Article

Impact of Mild Acid and Alkali Treatments on Cotton Fibers with Nonlinear Optical Imaging and SEM Analysis

1
Key Laboratory of Biofuels and Biochemistry of Sinopec, SINOPEC Dalian Research Institute of Petroleum and Petrochemicals Co., Ltd., Dalian 116000, China
2
School of Physics, Dalian University of Technology, Dalian 116024, China
3
State Key Laboratory of Fine Chemicals, Dalian University of Technology, Dalian 116024, China
4
School of Optoelectronic Engineering and Instrumentation Science, Dalian University of Technology, Dalian 116024, China
*
Authors to whom correspondence should be addressed.
Photonics 2025, 12(7), 688; https://doi.org/10.3390/photonics12070688
Submission received: 24 February 2025 / Revised: 9 May 2025 / Accepted: 4 July 2025 / Published: 8 July 2025
(This article belongs to the Section Optical Interaction Science)

Abstract

This study investigates the structural effects of dilute acid and alkali treatments on cotton fibers, aiming to understand the influence of chemical pretreatment on cellulose morphology. Cotton samples were exposed to 1% sulfuric acid and 1% sodium hydroxide at 90 °C, and the resulting changes were evaluated using scanning electron microscopy and nonlinear optical imaging techniques. The results indicate that sulfuric acid causes significant fiber degradation, leading to fragmentation and reduced fiber thickness. In contrast, sodium hydroxide treatment results in a roughened, flaky surface while preserving the overall structural integrity, with fibers appearing fluffier and more accessible to enzymatic processes. Untreated cotton fibers maintained a smooth and uniform surface, confirming the chemical specificity of the observed changes. These findings are crucial for optimizing biomass pretreatment methods, demonstrating that dilute chemical treatments primarily affect macrostructural features without significantly disrupting the cellulose microfibrils. The study provides valuable insights for the development of efficient biorefining processes and sustainable bio-based materials, highlighting the importance of selecting appropriate chemical conditions to enhance enzymatic hydrolysis and biomass conversion while maintaining the core structure of cellulose. This research contributes to advancing the understanding of cellulose’s structural resilience under mild chemical pretreatment conditions.

1. Introduction

Cellulose is the most abundant biopolymer on earth, an essential component of plant cell walls [1], and a valuable renewable resource for various industries such as papermaking [2], textiles [3], and biofuels [4,5]. As a linear polymer of glucose units, cellulose forms a highly ordered structure through hydrogen bonding to form microfibrils with crystalline and amorphous regions. In straw, lignin is interconnected with cellulose and hemicellulose via covalent bonds, van der Waals forces, and electrostatic interactions, forming a complex network that enhances the plant’s resistance to degradation [6]. This complex structure leads to the recalcitrance of cellulose, making it difficult to effectively utilize in many applications, especially in the production of biofuels and bio-based materials [4,5,7]. Pretreatment of cellulosic biomass is an essential step in biorefining operations, which aims to modify the structure and chemical properties of cellulose to improve its accessibility and reactivity [8,9]. Various pretreatment methods, including physical, chemical, and biological methods, have been developed to disrupt the cellulose structure, reduce its crystallinity, and increase its susceptibility to enzymatic hydrolysis [8,10]. However, the complex nature of cellulose makes it challenging to fully understand and characterize the changes that occur during pretreatment at the molecular and supramolecular levels. Due to the complex composition of plant straw, researchers have begun to focus on studying the properties of its fibers to observe the changes that occur during the pretreatment process. This approach provides valuable insights to aid in the optimization of straw pretreatment [11,12,13]. Alkaline treatment, using agents like sodium hydroxide or calcium hydroxide, primarily targets lignin and partially removes hemicellulose, thereby disrupting the lignin structure and increasing cellulose accessibility for subsequent microbial degradation. In contrast, acid treatment, often employing dilute sulfuric acid or hydrochloric acid, focuses on hydrolyzing hemicellulose into monosaccharides or oligosaccharides.
Traditional analytical methods for characterizing cellulose, such as X-ray diffraction [14], nuclear magnetic resonance spectroscopy [15], electron microscopy [16], transmission electron microscopy [17], and confocal microscopy [18], often provide limited spatial information or require extensive sample preparation, which may alter the native structure of the material. There is an urgent need for advanced imaging techniques that can provide high-resolution, spatially resolved information on chemical and structural changes in cellulose during pretreatment, ideally in real time and under relevant processing conditions. Nonlinear optical imaging, including techniques such as coherent anti-Stokes Raman scattering (CARS) [19,20,21], second harmonic generation, and stimulated Raman scattering (SRS) microscopy [22,23], has emerged as a powerful tool for label-free, chemically specific imaging of biological samples. These techniques offer several advantages over conventional Raman microscopy, including enhanced signal intensity, faster acquisition times, and 3D sectioning capabilities. While coherent Raman imaging has been widely used in biomedical research, its potential for characterizing lignocellulosic biomass remains underexplored.
This study aims to fill this gap by employing coherent Raman imaging to characterize changes in pure cellulose during pretreatment. By exploiting the chemical specificity and high spatial resolution of the technique, we seek to provide new insights into the mechanisms of pretreatment and the resulting structural and organizational changes in cellulose. Understanding these changes at the microscopic level is crucial to optimizing pretreatment processes, improving cellulose conversion efficiency, and ultimately facilitating the development of sustainable cellulose-based products and biofuels.

2. Methods and Materials

2.1. Experimental Instruments and Tools

Chemicals: Concentrated sulfuric acid (H2SO4, analytical grade), sodium hydroxide (NaOH, solid, analytical grade), and deionized water (ultrapure water).
Measuring Instruments: Graduated cylinders (various volumes) and beakers (multiple sizes).
Laboratory Tools: Weighing paper, filter paper, and microscope slides.
Instruments: Raman spectrometer (Renishaw Invia) with a 532 nm 70 mW excitation laser, a 50× objective lens, a heating platform, and an analytical balance.

2.2. Sample Preparation

Field-dried cotton fiber was pre-prepared and sub-sampled into 50 g portions. Each portion was placed in an oven at 40 °C for 3 h. To prepare a 1% (v/v) sulfuric acid solution, concentrated sulfuric acid (H2SO4) was diluted with deionized water. Specifically, 10 mL of concentrated sulfuric acid (approximately 98% purity) was carefully added to 990 mL of deionized water to yield a final volume of 1 L. The resulting solution was mixed thoroughly and stored in a labeled, tightly sealed container.
Similarly, a 1% (w/v) sodium hydroxide (NaOH) solution was prepared by calculating the appropriate mass of NaOH for the desired final volume. For example, to prepare 100 mL of a 1% solution, 1 g of solid NaOH was weighed and dissolved in distilled water to reach a final volume of 100 mL. The solution was stirred until the NaOH was fully dissolved. Both solutions were stored in labeled containers and handled with appropriate safety precautions.

3. Results and Discussions

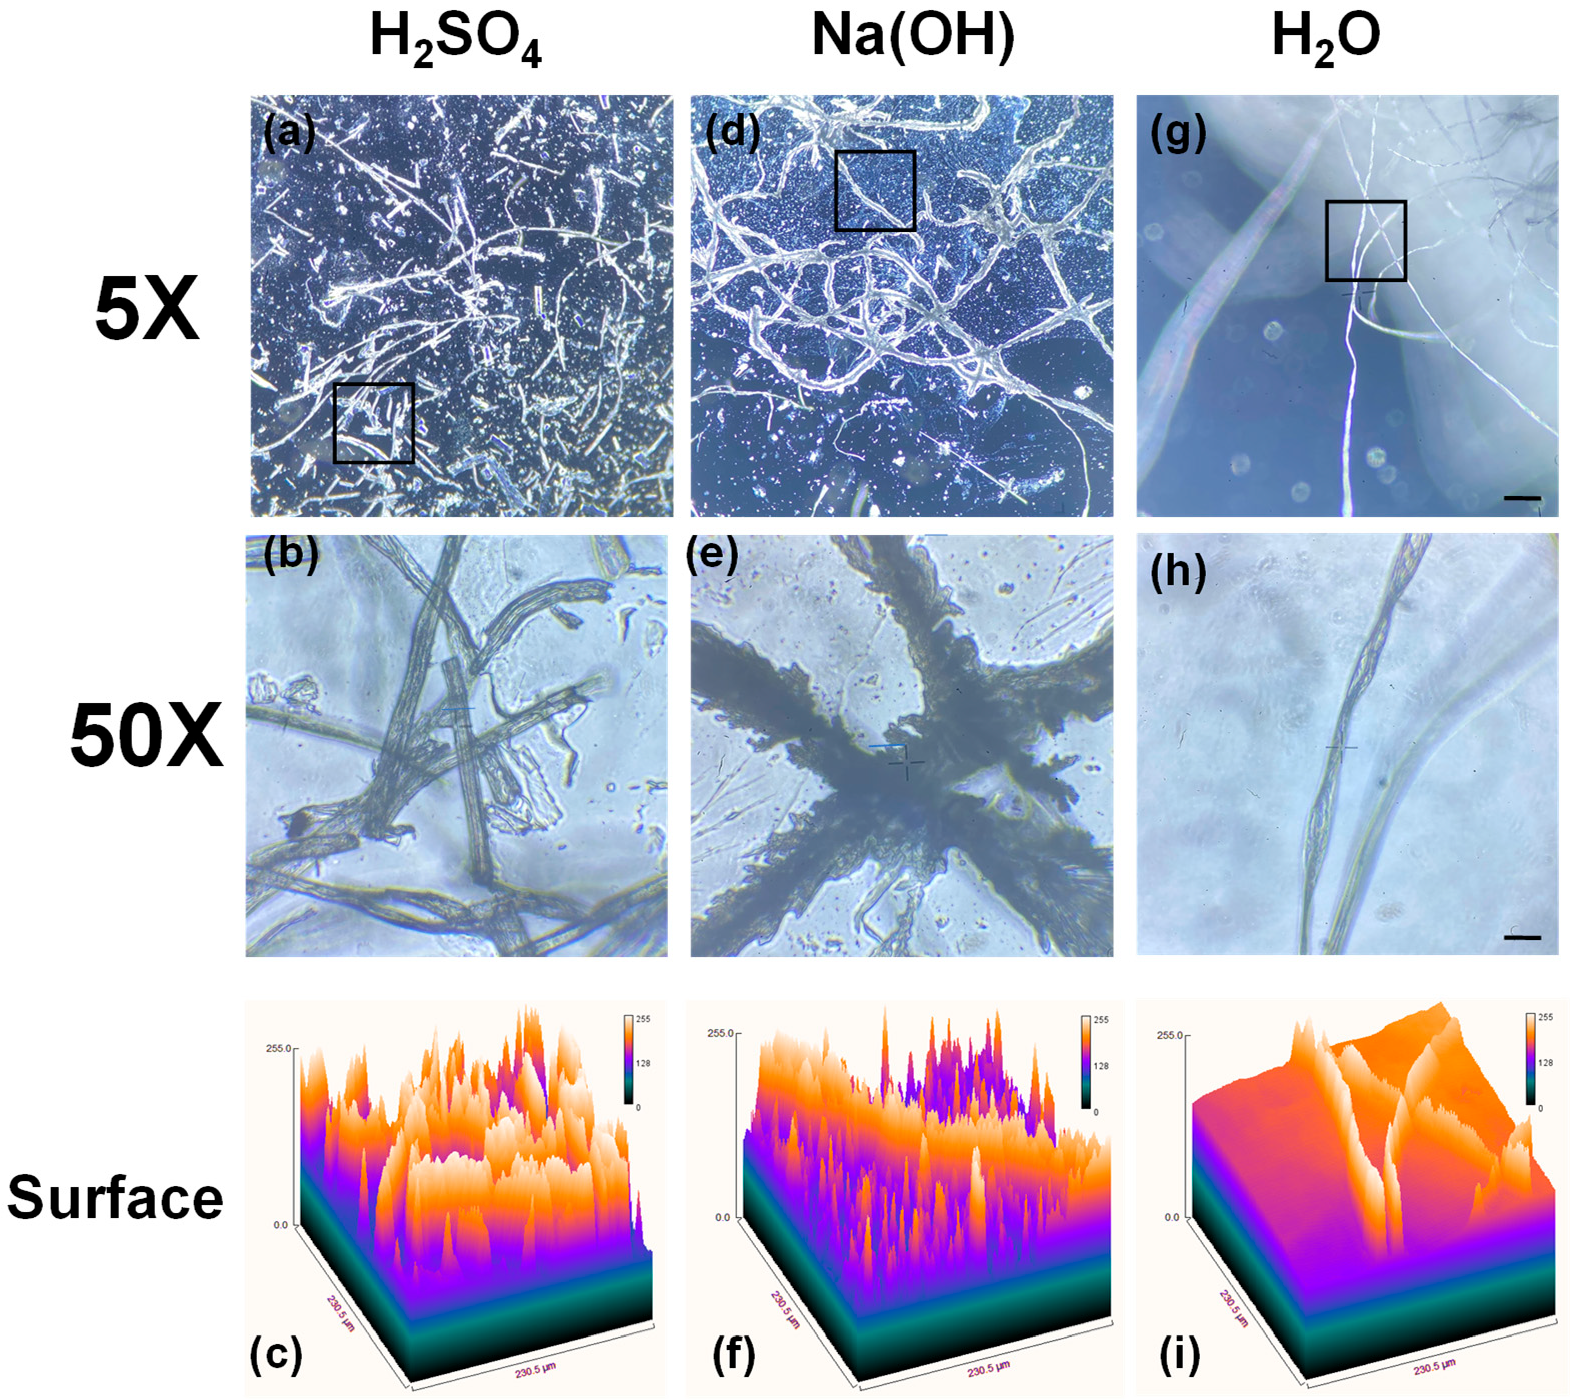
3.1. The Morphological Analysis

To investigate the structural impact of chemical treatments on cotton fibers, samples of cotton fibers and filter paper were initially dried at 100 °C for 1 h to establish a baseline mass. A predetermined amount of dried cotton fibers was then immersed in 100 mL of 1% dilute sulfuric acid and another set in 100 mL of 1% dilute sodium hydroxide solution. Both solutions were heated to 90 °C to accelerate the chemical reactions, as elevated temperatures promote greater interaction between the fiber surface and the reactive agents. After reaching 90 °C, the solutions were allowed to cool to room temperature, and the treated fibers were filtered out using filter paper. The fibers were then rinsed thoroughly with deionized water to remove any residual acid or base, ensuring that observed structural effects were due to the chemical reactions and not residual reagents. Figure 1 presents the comparative structural effects of 1% dilute sulfuric acid and sodium hydroxide on cotton fibers at 5× and 50× magnifications, highlighting specific morphological changes. Figure 1a,b show the cotton fibers after treatment with 1% sulfuric acid at 5× and 50× magnification, respectively. Figure 1c,f,i show surface analysis of the region of interest (ROI) in 5× magnification. The sulfuric acid, a strong acid, appears to partially hydrolyze the cellulose in the cotton fibers. This is evidenced by visible fragmentation, degradation, and a disrupted fiber network. Acid hydrolysis likely breaks down glycosidic bonds in cellulose, reducing the fiber’s structural integrity and creating smaller cellulose fragments. This breakdown is most evident at higher magnification (Figure 1b,c), where fibers exhibit splitting, increased surface roughness, and clear signs of physical damage. Such degradation suggests that prolonged or stronger acid exposure could further weaken or dissolve cotton fibers, as sulfuric acid penetrates and disrupts the cellulose chains. The effects of acid and alkali treatments at temperatures below 100 °C were observed since the boiling points of dilute acid and alkali solutions are close to 100 °C, ensuring no significant changes in the liquid surface during the experiments. Additionally, under normal temperature and pressure conditions, water’s boiling point is 100 °C, and exceeding this temperature would alter the concentration of the acid and alkali solutions. Therefore, the study focused on treatments conducted below this threshold to maintain consistent solution concentrations and reliable experimental conditions.
Figure 1d,e depict cotton fibers treated with 1% sodium hydroxide solution at 5× and 50× magnifications. Sodium hydroxide, a strong base, interacts with cellulose through a process known as mercerization. Mercerization is a chemical treatment process applied to cotton and other cellulose fibers to enhance their properties. This procedure can cause cellulose fibers to swell, increase in surface area, and rearrange internally, making the fibers more accessible to other treatments. In this case, the sodium hydroxide-treated fibers show less severe structural disruption than the acid-treated ones. However, subtle signs of swelling, a slightly twisted morphology, and some structural disarray are apparent, especially at 50× magnification in Figure 1e,f. The alkali treatment likely induces partial disorganization of the cellulose’s crystalline structure without causing fragmentation. This effect could make the fibers more receptive to other chemical modifications but without significant mass loss or dissolution, as observed in this experiment.
Figure 1g,h serve as a control, showing untreated cotton fibers in water at 5× and 50× magnification. These untreated fibers retain a well-defined, smooth, and continuous structure, with no visible signs of degradation or fragmentation (Figure 1i). The natural organization of cellulose microfibrils and the absence of any chemical treatment preserve the integrity of the fiber network. This comparison underscores the structural impact of acidic and basic treatments on cotton fibers, emphasizing that even mild chemical exposure at elevated temperatures can alter fiber morphology.
The observations from this experiment provide insights into the resilience and vulnerability of cotton fibers under different chemical conditions. Acid treatment, particularly with sulfuric acid, can lead to significant cellulose degradation, highlighting its potential to weaken cotton fibers, which may affect applications where durability is essential. In contrast, sodium hydroxide treatment primarily modifies the fiber surface without extensive fragmentation, potentially enhancing fiber accessibility for dyeing or bonding processes. Acid treatment progresses more slowly and is effective in removing hemicellulose, while alkali treatment acts more rapidly and is primarily used to remove lignin. These differences highlight the complementary roles of the two methods in biorefining. Zheng et al. [24] provide detailed insights into these structural modifications. This experiment also underscores the importance of selecting appropriate treatment conditions, as chemical treatments can enhance or diminish fiber properties depending on the intended application. The structural changes observed support the conclusion that dilute sulfuric acid primarily degrades the fiber’s cellulose structure, while dilute sodium hydroxide induces surface swelling and reorganization.

3.2. Nonlinear Optical Microscopic Imaging

The details of nonlinear microscopy have been described previously [25], and shown in Figure 2. The cotton fiber sample was mounted on the stage of a modified upright multiphoton scanning microscope (Olympus FV-1200MPE) configured for transmitted illumination. The excitation light source was a Ti/Sapphire laser (wavelength: 680–1040 nm, Mai Tai DeepSee, Spectra-Physics) with a repetition rate of 80 MHz and a pulse width of ~100 fs, average power 2.8 W. A portion of the output was coupled into the photonic crystal fiber (PCF, SCG-800-CARS, Newport) and served as a supercontinuum generation device, which produced the Stokes light (16 mW). The Stokes beam, primarily contributing at the vibration frequency of 1089 cm−1 associated with the fiber’s vibration mode, was adjusted and combined with another pump beam (70 mW) using a time delay line at a dichroic mirror. The beam was scanned in two dimensions by a pair of galvanometers. The two overlapping laser beams were focused onto the cotton fiber using an objective lens (UPLSAPO20X, Olympus). The typical image integration time was 2 μs per pixel. Transmitted and reflected light were collected using a 1.4 NA condenser, and the signals for CARS, bright field, and second-harmonic generation (SHG) were detected by photomultiplier tubes equipped with appropriate bandpass filters (740/13 nm for CARS, 400/10 nm for SHG). Image stacks were acquired by moving the sample stage, controlled by the microscope software, with a step size of 2 μm and a depth range of 80 μm.
In addition to the CARS imaging, a second channel was established for detecting SHG signals. The SHG channel utilized the same 800 nm pump beam, focused onto the cotton fibers, to exploit the nonlinear optical properties of the collagen present in the fibers. The generated SHG signal, which is at 400 nm, was collected using a dichroic mirror (cutoff at 450 nm) and directed to a photomultiplier tube (Olympus). This setup allowed for simultaneous imaging of both the CARS and SHG signals, providing complementary information about the structural and chemical properties of the cotton fibers.
Figure 3 illustrates the effects of chemical treatments on cotton fibers, using a combination of bright-field optical microscopy (OM), second-harmonic generation (SHG), and CARS imaging. The images are organized into four columns, each providing unique insights into the structural and chemical changes induced by the treatments. The scale bar in each image is 10 μm. The first column presents the OM images, offering a general overview of the fiber morphology before and after treatment. Untreated fibers exhibit a relatively smooth and intact surface, while the acid- and alkali-treated samples display visible surface alterations, indicating the impact of chemical exposure. These modifications are crucial in understanding the mechanical and structural effects of dilute acid and alkali treatments on the cotton fiber’s integrity.
The second column shows SHG images, which are sensitive to non-centrosymmetric structures, highlighting alterations in the fiber’s internal crystalline organization [26]. The SHG intensity in untreated fibers is relatively high, suggesting a well-preserved crystalline structure. The third column features CARS images, which provide a chemical contrast by selectively highlighting the vibrational characteristics of the fiber’s molecular components. In untreated fibers, the CARS signal is uniformly distributed, reflecting a consistent chemical composition. Acid-treated fibers exhibit a diminished CARS signal, suggesting chemical degradation or removal of specific molecular groups. The alkali-treated fibers show a distinct alteration in the CARS signal distribution, indicating a shift in chemical composition, likely due to the interaction of NaOH with cellulose.
The fourth and final column integrates the information from OM, SHG, and CARS images, offering a comprehensive view of both structural and chemical changes. This combined visualization allows for a more nuanced analysis of how each treatment affects the cotton fibers. For instance, the acid-treated fibers show both surface degradation and internal structural weakening, while alkali-treated fibers reveal pronounced surface modifications without significant internal damage. These observations emphasize the selective impact of dilute acid and alkali on the cotton fibers’ physical and chemical properties, shedding light on potential applications or limitations of such treatments in textile processing.
For quantitative analysis, regions exhibiting intensity feature variations were selected from the SHG and CARS images in Figure 3. Photon intensities were integrated along the fiber’s radial direction and subsequently normalized. This approach was designed to reveal the physicochemical effects of acid and alkaline treatments on the fibers by examining the changes in the normalized intensity signals. The resulting radial intensity distribution profile, perpendicular to the fiber axis, is presented in Figure 4.
Figure 4a–c show the normalized intensity distribution curves for SHG and CARS signals for the control group, acid-treated, and alkaline-treated samples, respectively. In Figure 4a, the untreated fibers exhibit a uniform distribution of SHG and CARS signals, reflecting a consistent chemical composition. In contrast, Figure 4b demonstrates that acid-treated fibers display a diminished CARS signal in the internal amorphous regions, indicating that specific molecular groups have undergone chemical degradation or removal. In Figure 4c, the alkaline-treated fibers show significant changes in the SHG and CARS signal distributions within the left crystalline region and the amorphous surface region. Notably, the peak of the CARS vibrational signal is offset relative to the SHG signal peak at the fiber surface, and the CARS signal in the crystalline region is weaker than in the adjacent amorphous region. This suggests that the swelling effect of NaOH on cellulose leads to a reconstruction of the chemical composition or structure. Moreover, the CARS signal in the right amorphous region does not change significantly—likely because the reaction between the alkali and the fiber was not complete—with an enhanced CARS signal peak trend observed near the 2 μm position.
Therefore, the study concluded that treatment with dilute acids and alkalis at temperatures below 100 °C does not induce significant qualitative changes in the cellulose structure of cotton. These treatments primarily impact the macrostructural arrangement of the fibers rather than altering the microfibrils or chemical composition at the microscopic level. As discussed in the analysis of Figure 4, the observed changes are predominantly surface-level, affecting the fiber morphology and the overall structural organization without significantly disrupting the core cellulose. These findings provide essential insights into how pretreatment processes modify biomass, facilitating the optimization of enzymatic hydrolysis and biomass conversion. This understanding is critical for the development of efficient biorefining technologies and the creation of sustainable bio-based materials, ensuring that the integrity of cellulose is maintained while enhancing its processability.

3.3. The Analysis with SEM Images

The SEM images in Figure 5 demonstrate the structural impact of chemical treatments on cotton fibers, specifically comparing the effects of 1% sulfuric acid and 1% sodium hydroxide at 90 °C. The extent of fiber degradation varies significantly between the two treatments. Sulfuric acid treatment leads to more severe degradation, characterized by fragmentation and substantial damage to the fibers. In contrast, sodium hydroxide treatment, while causing some structural changes, preserves better overall fiber integrity. The alkali-treated fibers exhibit a fluffy, roughened surface, which could facilitate fungal decomposition of cellulose, potentially enhancing enzymatic hydrolysis. Untreated fibers, serving as a control, display no observable changes, confirming that the alterations are a direct result of chemical exposure. These observations indicate that sulfuric acid has a more aggressive impact on cotton fibers, while sodium hydroxide induces modifications that are distinct and less destructive. In Figure 5a,d, the images depict cotton fibers treated with dilute sulfuric acid. At low magnification (Figure 5a), the fibers show a visibly rough and uneven texture, with clear signs of structural damage and fragmentation. The high magnification view in Figure 5d reveals further degradation, including reduced fiber thickness and noticeable surface erosion. These effects suggest partial degradation of the cellulose, leading to weakened fibers and fragmentation.
Cotton fibers treated with sodium hydroxide display a less severe response. The low magnification image (Figure 5b) shows a roughened surface, but the overall structural integrity of the fibers remains largely intact. In the high magnification image (Figure 5e), a flaky texture is observed, indicative of surface peeling and partial dissolution due to the alkaline environment. This treatment appears to affect the fiber’s outer layer, increasing surface roughness without causing significant fragmentation, resulting in a slight increase in fiber diameter.
The untreated cotton fibers serve as a control, exhibiting a smooth, uniform surface with preserved structural features. The high magnification image (Figure 5f) shows cylindrical fibers with distinct longitudinal striations, reflecting the natural and unaltered morphology of cotton fibers, free from any chemical damage. The SEM analysis clearly demonstrates the differential impact of dilute acid and alkali treatments on cotton fibers. Acid treatment results in considerable degradation, leading to fragmentation and damage, whereas alkaline treatment primarily affects the fiber’s surface, creating a rough, fluffy texture without severe internal disruption. The untreated fibers retain their original structure, highlighting the significance of chemical treatment on fiber morphology.

3.4. Summary and Comparison of Other Methods

Each imaging technique employed in this study—nonlinear optical microscopy, including transmission, SHG, and CARS imaging, as well as SEM—offers distinct advantages and limitations. The effects of dilute acid and alkali treatments on cotton fibers were examined using these advanced nonlinear optical imaging methods. The nonlinear optical images, including transmission, SHG, and CARS, revealed minimal changes at the microstructural level. While some variations in signal intensity were observed, CARS and SHG microscopy demonstrated that the chemical composition and structural integrity of the cotton fibers remained largely unchanged after treatment with dilute acid and alkali. SEM images further confirmed that although the acid and alkali treatments induced surface changes, such as slight erosion and an increase in fiber volume, the overall fiber structure was preserved. In Table 1, the summary and comparison of the optical methods are listed.

4. Conclusions

The results indicate that treating cotton fibers with dilute acid and dilute alkali at temperatures below 100 °C does not cause significant qualitative changes in the cellulose. These treatment methods primarily affect the macroscopic structural arrangement while having minimal impact on the microfiber structure or chemical composition at the microscopic level. In the processes of biomass conversion and enzymatic hydrolysis, maintaining the integrity of cellulose is crucial for efficient biofuel production. Utilizing advanced SHG/CARS multimodal nonlinear optical imaging to elucidate these effects is essential for optimizing pretreatment processes. The insights gained from this study will contribute to the development of sustainable and efficient biorefinery technologies, promoting the further utilization of cellulose-based materials.

Author Contributions

Conceptualization, H.G.; methodology, X.L. and C.W.; formal analysis, R.L.; resources, Q.Z.; funding acquisition, Q.Z.; writing—original draft preparation, R.L.; writing—review and editing, H.-C.C. All authors have read and agreed to the published version of the manuscript.

Funding

The Fundamental Research Funds for the Central Universities (DUT23YG205).

Institutional Review Board Statement

Not applicable.

Informed Consent Statement

Not applicable.

Data Availability Statement

The data presented in this study are available in the article.

Conflicts of Interest

Huipeng Gao and Quan Zhang were employed by the company SINOPEC Dalian Research Institute of Petroleum and Petrochemicals Co., Ltd. The remaining authors declare no conflicts of interest.

References

  1. Polko, J.K.; Kieber, J.J. The Regulation of Cellulose Biosynthesis in Plants. Plant Cell 2019, 31, 282–296. [Google Scholar] [CrossRef] [PubMed]
  2. Osong, S.H.; Norgren, S.; Engstrand, P. Processing of wood-based microfibrillated cellulose and nanofibrillated cellulose, and applications relating to papermaking: A review. Cellulose 2015, 23, 93–123. [Google Scholar] [CrossRef]
  3. Costa, S.M.; Mazzola, P.G.; Silva, J.C.A.R.; Pahl, R.; Pessoa, A.; Costa, S.A. Use of sugar cane straw as a source of cellulose for textile fiber production. Ind. Crops Prod. 2013, 42, 189–194. [Google Scholar] [CrossRef]
  4. Robertson, G.P.; Hamilton, S.K.; Barham, B.L.; Dale, B.E.; Izaurralde, R.C.; Jackson, R.D.; Landis, D.A.; Swinton, S.M.; Thelen, K.D.; Tiedje, J.M. Cellulosic biofuel contributions to a sustainable energy future: Choices and outcomes. Science 2017, 356, eaal2324. [Google Scholar] [CrossRef]
  5. Sharma, A.; Singh, G.; Arya, S.K. Biofuel from rice straw. J. Clean. Prod. 2020, 277, 124101. [Google Scholar] [CrossRef]
  6. Heinze, T. Cellulose: Structure and Properties. In Cellulose Chemistry and Properties: Fibers, Nanocelluloses and Advanced Materials; Rojas, O.J., Ed.; Advances in Polymer Science; Springer: Berlin, Germany, 2016; Volume 271, pp. 1–52. [Google Scholar]
  7. Passoth, V.; Sandgren, M. Biofuel production from straw hydrolysates: Current achievements and perspectives. Appl. Microbiol. Biotechnol. 2019, 103, 5105–5116. [Google Scholar] [CrossRef]
  8. Kumari, D.; Singh, R. Pretreatment of lignocellulosic wastes for biofuel production: A critical review. Renew. Sustain. Energy Rev. 2018, 90, 877–891. [Google Scholar] [CrossRef]
  9. Kumar, P.; Barrett, D.M.; Delwiche, M.J.; Stroeve, P. Methods for Pretreatment of Lignocellulosic Biomass for Efficient Hydrolysis and Biofuel Production. Ind. Eng. Chem. Res. 2009, 48, 3713–3729. [Google Scholar] [CrossRef]
  10. Binod, P.; Pandey, A. Chapter 1—Introduction. In Pretreatment of Biomass; Pandey, A., Negi, S., Binod, P., Larroche, C., Eds.; Elsevier: Amsterdam, The Netherlands, 2015; pp. 3–6. [Google Scholar]
  11. Ioelovich, M. Study of Cellulose Interaction with Concentrated Solutions of Sulfuric Acid. ISRN Chem. Eng. 2012, 2012, 428974. [Google Scholar] [CrossRef]
  12. Wang, Y.; Zhao, Y.; Deng, Y. Effect of enzymatic treatment on cotton fiber dissolution in NaOH/urea solution at cold temperature. Carbohydr. Polym. 2008, 72, 178–184. [Google Scholar] [CrossRef]
  13. Ranjithkumar, M.; Ravikumar, R.; Sankar, M.K.; Kumar, M.N.; Thanabal, V. An Effective Conversion of Cotton Waste Biomass to Ethanol: A Critical Review on Pretreatment Processes. Waste Biomass Valoriz. 2016, 8, 57–68. [Google Scholar] [CrossRef]
  14. Naik, S.; Goud, V.V.; Rout, P.K.; Jacobson, K.; Dalai, A.K. Characterization of Canadian biomass for alternative renewable biofuel. Renew. Energy 2010, 35, 1624–1631. [Google Scholar] [CrossRef]
  15. Baccile, N.; Falco, C.; Titirici, M.-M. Characterization of biomass and its derived char using13C-solid state nuclear magnetic resonance. Green Chem. 2014, 16, 4839–4869. [Google Scholar] [CrossRef]
  16. Kristensen, J.B.; Thygesen, L.G.; Felby, C.; Jorgensen, H.; Elder, T. Cell-wall structural changes in wheat straw pretreated for bioethanol production. Biotechnol. Biofuels 2008, 1, 5. [Google Scholar] [CrossRef]
  17. Alemdar, A.; Sain, M. Isolation and characterization of nanofibers from agricultural residues: Wheat straw and soy hulls. Bioresour. Technol. 2008, 99, 1664–1671. [Google Scholar] [CrossRef]
  18. Li, X.; Sha, J.; Xia, Y.; Sheng, K.; Liu, Y.; He, Y. Quantitative visualization of subcellular lignocellulose revealing the mechanism of alkali pretreatment to promote methane production of rice straw. Biotechnol. Biofuels 2020, 13, 8. [Google Scholar] [CrossRef]
  19. Cheng, J.X.; Volkmer, A.; Xie, X.S. Theoretical and experimental characterization of coherent anti-Stokes Raman scattering microscopy. J. Opt. Soc. Am. B-Opt. Phys. 2002, 19, 1363–1375. [Google Scholar] [CrossRef]
  20. Vilms Pedersen, S.; Brewer, J.R.; Hedegaard, M.A.B.; Arnspang Christensen, E. Spectral Unmixing for Label-Free, In-Liquid Characterization of Biomass Microstructure and Biopolymer Content by Coherent Raman Imaging. Anal. Chem. 2023, 95, 2168–2175. [Google Scholar] [CrossRef]
  21. Zeng, Y.; Saar, B.G.; Friedrich, M.G.; Chen, F.; Liu, Y.-S.; Dixon, R.A.; Himmel, M.E.; Xie, X.S.; Ding, S.-Y. Imaging Lignin-Downregulated Alfalfa Using Coherent Anti-Stokes Raman Scattering Microscopy. BioEnergy Res. 2010, 3, 272–277. [Google Scholar] [CrossRef]
  22. Gannaway, J.N.; Sheppard, C.J.R. Second-harmonic imaging in the scanning optical microscope. Opt. Quantum Electron. 1978, 10, 435–439. [Google Scholar] [CrossRef]
  23. Himmel, M.E.; Ding, S.Y.; Johnson, D.K.; Adney, W.S.; Nimlos, M.R.; Brady, J.W.; Foust, T.D. Biomass recalcitrance: Engineering plants and enzymes for biofuels production. Science 2007, 315, 804–807. [Google Scholar] [CrossRef]
  24. Zheng, Q.; Zhou, T.; Wang, Y.; Cao, X.; Wu, S.; Zhao, M.; Wang, H.; Xu, M.; Zheng, B.; Zheng, J.; et al. Pretreatment of wheat straw leads to structural changes and improved enzymatic hydrolysis. Sci. Rep. 2018, 8, 1321. [Google Scholar] [CrossRef]
  25. Li, R.; Zhang, Y.; Xu, X.; Zhou, Y.; Chen, M.; Sun, M. Optical characterizations of two-dimensional materials using nonlinear optical microscopies of CARS, TPEF, and SHG. Nanophotonics 2018, 7, 873–881. [Google Scholar] [CrossRef]
  26. Richely, E.; Zarei, A.; Melelli, A.; Rajan, D.K.; Govilas, J.; Gabrion, X.; Clévy, C.; Legland, D.; Perez, J.; Guessasma, S.; et al. Measurement of microfibril angle in plant fibres: Comparison between X-ray diffraction, second harmonic generation and transmission ellipsometry microscopies. Compos. Part C Open Access 2023, 11, 100355. [Google Scholar] [CrossRef]
  27. Janko, M.; Jocher, M.; Boehm, A.; Babel, L.; Bump, S.; Biesalski, M.; Meckel, T.; Stark, R.W. Cross-Linking Cellulosic Fibers with Photoreactive Polymers: Visualization with Confocal Raman and Fluorescence Microscopy. Biomacromolecules 2015, 16, 2179–2187. [Google Scholar] [CrossRef] [PubMed]
  28. Legat, T.; Grachev, V.; Kabus, D.; Lettinga, M.P.; Clays, K.; Verbiest, T.; de Coene, Y.; Thielemans, W.; Van Cleuvenbergen, S. Imaging with a twist: Three-dimensional insights of the chiral nematic phase of cellulose nanocrystals via SHG microscopy. Sci. Adv. 2024, 10, eadp2384. [Google Scholar] [CrossRef]
  29. Krishnamachari, P.; Hashaikeh, R.; Tiner, M. Modified cellulose morphologies and its composites; SEM and TEM analysis. Micron 2011, 42, 751–761. [Google Scholar] [CrossRef]
  30. Richely, E.; Nuez, L.; Pérez, J.; Rivard, C.; Baley, C.; Bourmaud, A.; Guessasma, S.; Beaugrand, J. Influence of defects on the tensile behaviour of flax fibres: Cellulose microfibrils evolution by synchrotron X-ray diffraction and finite element modelling. Compos. Part C Open Access 2022, 9, 100300. [Google Scholar] [CrossRef]
  31. Ji, Z.; Ma, J.-F.; Zhang, Z.-H.; Xu, F.; Sun, R.-C. Distribution of lignin and cellulose in compression wood tracheids of Pinus yunnanensis determined by fluorescence microscopy and confocal Raman microscopy. Ind. Crops Prod. 2013, 47, 212–217. [Google Scholar] [CrossRef]
  32. Moran-Mirabal, J.M. The study of cell wall structure and cellulose–cellulase interactions through fluorescence microscopy. Cellulose 2013, 20, 2291–2309. [Google Scholar] [CrossRef]
  33. Agarwal, U.P. Analysis of Cellulose and Lignocellulose Materials by Raman Spectroscopy: A Review of the Current Status. Molecules 2019, 24, 1659. [Google Scholar] [CrossRef] [PubMed]
Figure 1. Optical microscopy (OM) images of cotton fibers after chemical treatments. Cotton fibers treated with sulfuric acid at (a) 5× magnification and (b) 50× magnification (c) surface analysis of ROI (a). Cotton fibers treated with sodium hydroxide at (d) 5× magnification and (e) 50× magnification (f) surface analysis of ROI (d). Untreated cotton fibers in water at (g) 5× magnification and (h) 50× magnification (i) surface analysis of ROI (g). The scale bars are 100 μm for 5× magnification and 25 μm for 50× magnification, respectively.
Photonics 12 00688 g001
Figure 2. The optical scheme of a nonlinear optical microscope. HWP: half-wave plate; PBS: polarization beam splitter; m: Mirror; PCF: photonic crystal fiber; DMs: dichroic mirrors; G-G: Galvo-Galvo scanner; SL: scan lens; TL: tube lens; BP: bandpass filters; BS: beam splitter; PMT: photomultiplier tube.
Photonics 12 00688 g002
Figure 3. Nonlinear optical images of cotton fibers treated with different chemical solutions. The images are organized in a 3 × 4 grid. The first column shows OM images of the fibers. The second column displays SHG images. The third column presents CARS images. The final column shows merged images combining OM, SHG, and CARS data. The scale bar represents 10 μm.
Photonics 12 00688 g003
Figure 4. The normalized intensity distribution curves for SHG and CARS for (a) control, (b) acid-treated, and (c) alkaline-treated samples, respectively.
Photonics 12 00688 g004
Figure 5. The SEM images of cotton are as follows: (a,d) images after acid treatment; (b,e) images after alkali treatment; and (c,f) images of untreated cotton. The scale bars are 50 μm and 5 μm, respectively.
Photonics 12 00688 g005
Table 1. Summary and comparison of optical methods.
MethodsAdvantageLimit
OM [27]Simple imaging without complex operationsMacroscopic imaging
SHG [28]Rapid imaging of non-centrosymmetric materialsRequires image processing
CARS [25]Rapid imaging of molecular vibrationsNon-resonant background interference, high light source requirements
SEM [29]Microscopic structural imagingSample preparation required
X-ray diffraction [30]Rapid large-area imagingRequires a synchrotron source to achieve single-fiber scale, a strict geometric arrangement of fibers
Confocal fluorescence microscopy [31,32]Rapid high-resolution imagingRequires fluorescence dye labeling for sample preparation
Raman spectroscopy microscopy [33]Provides rich spectral informationOnly reflects local information
Disclaimer/Publisher’s Note: The statements, opinions and data contained in all publications are solely those of the individual author(s) and contributor(s) and not of MDPI and/or the editor(s). MDPI and/or the editor(s) disclaim responsibility for any injury to people or property resulting from any ideas, methods, instructions or products referred to in the content.

