1. Motivation and Introduction
Facing the consequences of climate change, there is increasing global demand for sustainable energy solutions and a shift toward a circular economy to reduce carbon dioxide emissions. Additionally, the transition to a circular economy, which enables efficient resource management through the reduction, reuse, and recycling of materials, is essential. This transition also necessitates a shift from chemical production processes reliant on traditional petrochemical feedstocks to process routes capable of converting waste-based input streams [
1,
2]. These lower-quality streams differ significantly from established feedstocks due to their high heterogeneity and elevated levels of contaminants. Consequently, the development of suitable diagnostic techniques and measurement instruments for analyzing their chemical and physical properties is essential, which constitutes the primary goal of this work.
One promising route to close the anthropogenic carbon cycle is the conversion of biogenic and anthropogenic waste streams into high-value chemicals and energy carriers via pyrolysis, gasification, and synthesis, which has been investigated as an example technology by Eberhard (2017) [
3], Dammann (2024) [
4], and Fleck (2018) [
5]. High-pressure entrained-flow gasification is a favorable gasification technology due to the high-quality syngas it produces with minimal hydrocarbons, soot, or tar. The syngas is generated by the partial oxidation of a liquid or slurry feedstock fed into a reaction chamber through one or more burner nozzles. In the vicinity of the burner nozzle, a spray is formed that reacts with a gasification medium (typically oxygen and steam) and recirculated gas in a high-temperature reaction zone. The burner is critical for gas-phase mixing and spray properties, which strongly influence the reaction of the droplets and thus overall process efficiency [
6,
7,
8,
9,
10].
In commercial entrained-flow reactors, co-annular external-mixing burner nozzles, as described in [
8,
10,
11,
12,
13,
14], are commonly used to supply the liquid or suspension fuel and the gasification medium to the reactor. When the suspension droplets enter the hot burner near-zone, they are exposed to very high heating rates in an oxidizing and reducing atmosphere. While liquid evaporation and reactions occur rapidly, the conversion of solid particles released from the suspension droplets after liquid evaporation is much slower due to slow heterogeneous reaction kinetics. Thus, characterizing the composition of suspension droplets is of great importance, as it remains beyond the capabilities of state-of-the-art spray-measurement techniques.
To overcome this limitation, a new diagnostic approach has been introduced that analyzes the transparency properties of individual droplets in the slurry spray. Various techniques exist to assess the transparency of slurry droplets, each with its own advantages and disadvantages. In this study, we employ light-scattering analysis of individual droplets as they pass through a shaped light beam. A similar approach is used in the time-shift technique, first introduced by Semidetnov (1985) [
15] and Pavlovskii (1991) [
16], and further developed in several dissertations at the Technical University of Darmstadt by Damaschke (2003) [
17], Bakis (2010) [
18], Kretschmer (2011) [
19], Schäfer (2012) [
20], Stegmann (2015) [
21], Rosenkranz (2016) [
22], and Lingxi (2020) [
23]. Additionally, selected external works have contributed to refining and improving this technique, including those of Wigger et al. (2018) [
24], Weich (2021) [
25], Wachter (2023) [
26,
27], and Gödeke (2023) [
28]. Commercial devices based on the time-shift technique are mostly known under the brand name
SpraySpy® [
29], and an extended version with AI capabilities is marketed under the brand name
ParticleTensorAI® [
30].
The practical application of the time-shift technique for suspension droplet characterization in terms of suspension concentration was first introduced by Tropea and Schäfer (2012) in [
20,
31,
32,
33]. Building on these works, several studies on suspension droplets have been conducted by Kuhnhenn (2016) [
34], Rosenkranz (2016) [
22], and Lingxi (2020) [
23], contributing more to the theoretical understanding of light scattering in suspension droplets. The capability of the time-shift technique for measuring dust and ice crystals was discussed by Stegmann (2016) [
35].
The present work focuses on the practical application of the light-scattering technique for suspension droplet characterization exclusively on high-mass-concentration slurry sprays, where the suspension droplets contain a high load of solid particles. Instead of analyzing the properties of individual droplets, our method characterizes the ensemble of suspension droplets. This approach enables the determination of key liquid properties in the slurry spray, such as particle mass concentration (Cm) and particle size (SMDp). In this work, the terms slurry droplet and suspension droplet are used interchangeably.
It should be noted that the characterization of individual static suspension droplets, such as those levitated acoustically [
36,
37] or electromagnetically [
38,
39], is well-established and involves analyzing light-scattering and absorption effects. However, determining the concentration and composition of individual dynamic suspension droplets, such as those in a flow or spray, remains a significant challenge. At present, there are no ready-to-use commercial instruments capable of performing this measurement in real-time applications. Developing such a device is the primary aim of this study. In this work, we used a commercial device,
ParticleTensorAI®, an extended version of
SpraySpy®, with a working distance of 250 mm and a droplet detection range between 2
m and 700
m. A full description can be found in [
29,
30]. The measurement probe operates in backscatter mode and can simultaneously detect transparent, semi-transparent, and non-transparent droplets.
2. Light Scattering of a Single Dynamic Suspension Droplet
When a suspension droplet passes through a shaped light beam, in addition to the refractions (
p > 0) that occur in a transparent droplet, the light inside the droplet is repeatedly scattered by the suspended particles (dust or coal particles, pigments, aggregates, etc.), leading to a more uniform overall light-scattering effect [
32], as depicted schematically in
Figure 1. Depending on the concentration and absorption properties of the suspended particles, the refracted light can be partially or totally absorbed. For a low concentration of suspended particles, the absorption during refraction might be minimal, allowing the suspension droplet to be considered semi-transparent with observable refracted light scattering. As the concentration increases, the intensity of refraction effects diminishes because the high concentration of suspended particles suppresses the passage of the beam through higher-order refraction. In contrast, the light-scattering intensity of reflection (
) on the surface of the particles does not depend on the concentration but rather on the refractive index of the base fluid and the polarization of the light beam.
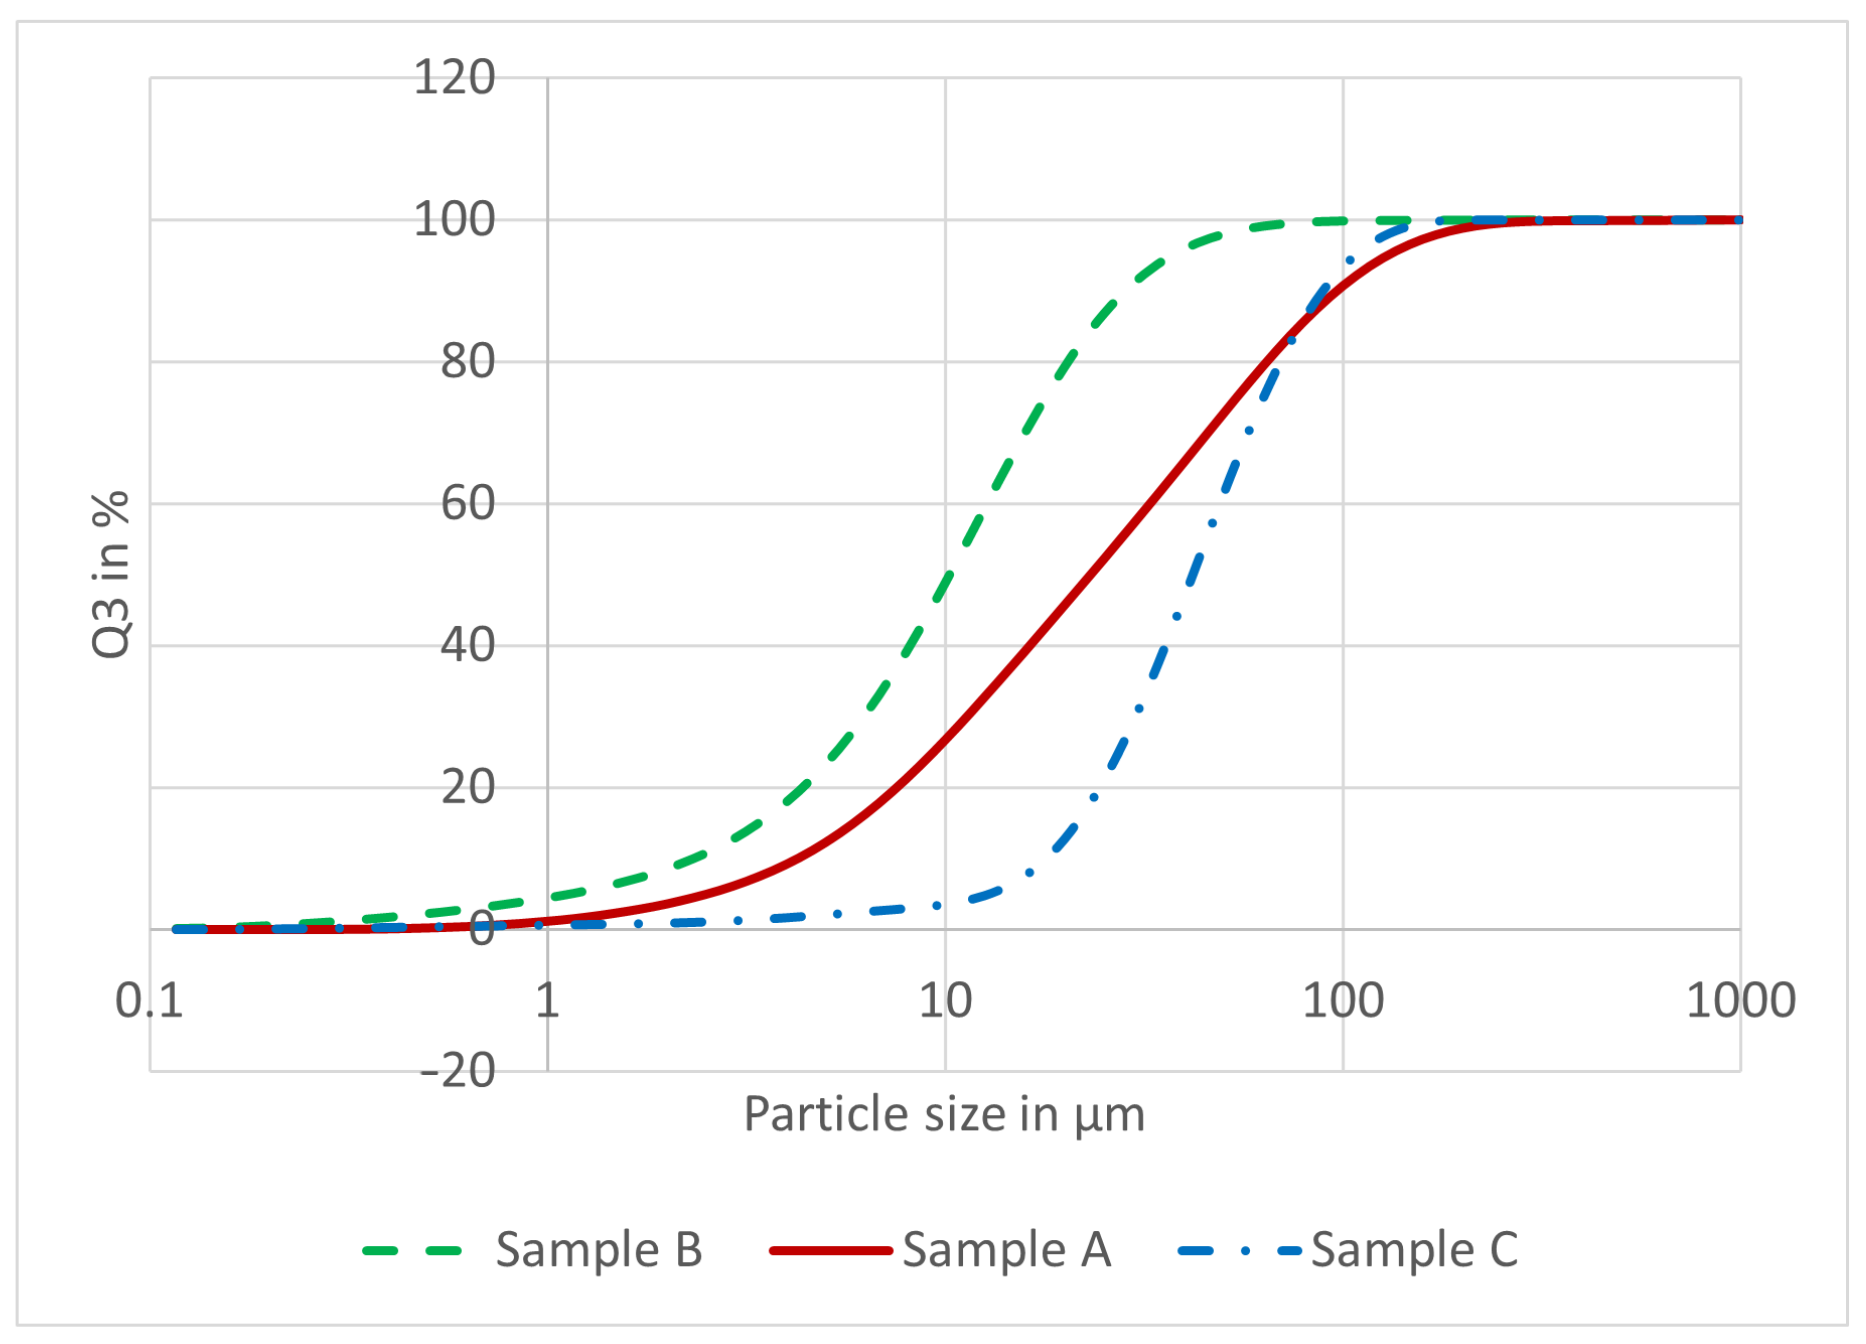
In the experiment, the suspension was prepared by dispersing coal particles in monoethylene glycol. Three different size distributions of the coal particles were obtained by sieving Sample A (
) into Samples B (
) and C (
). Subsequently, the particle size distributions were analyzed using a laser diffraction instrument. The measured particle size distributions are shown in
Figure 2. The particle concentration by weight in the suspension was varied between 5%, 10%, and 20%. In total, five different suspension compositions were successfully tested.
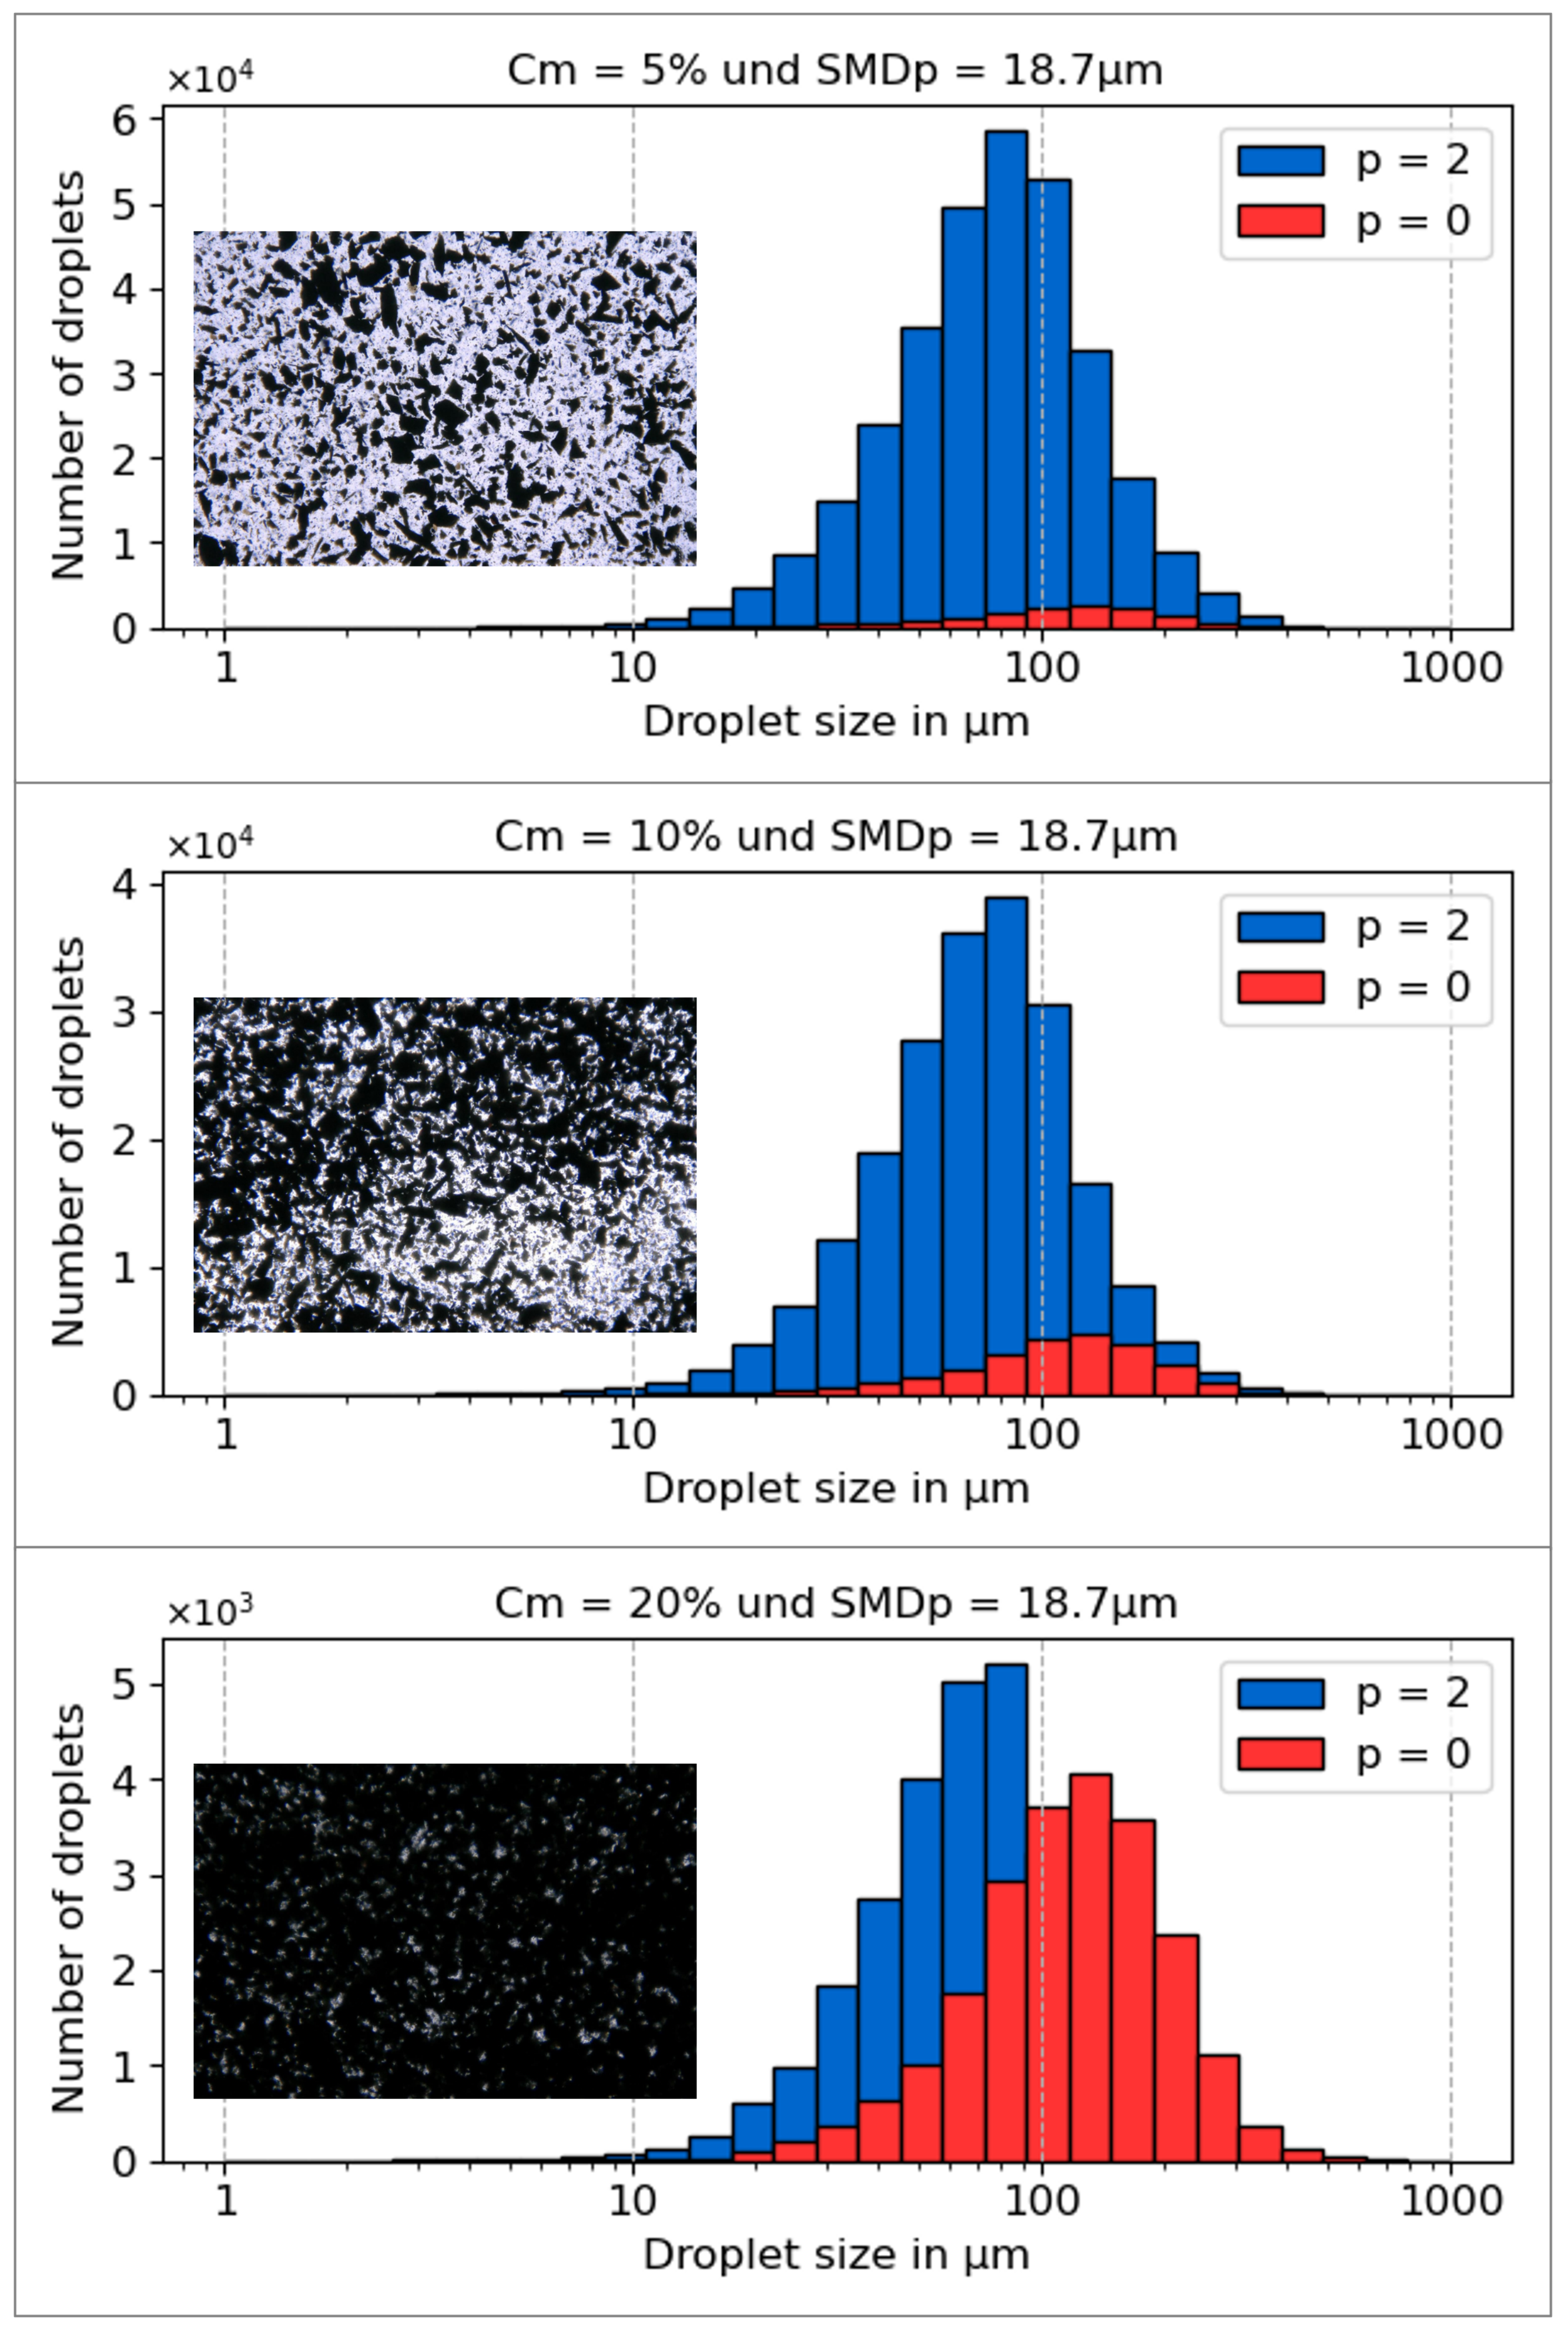
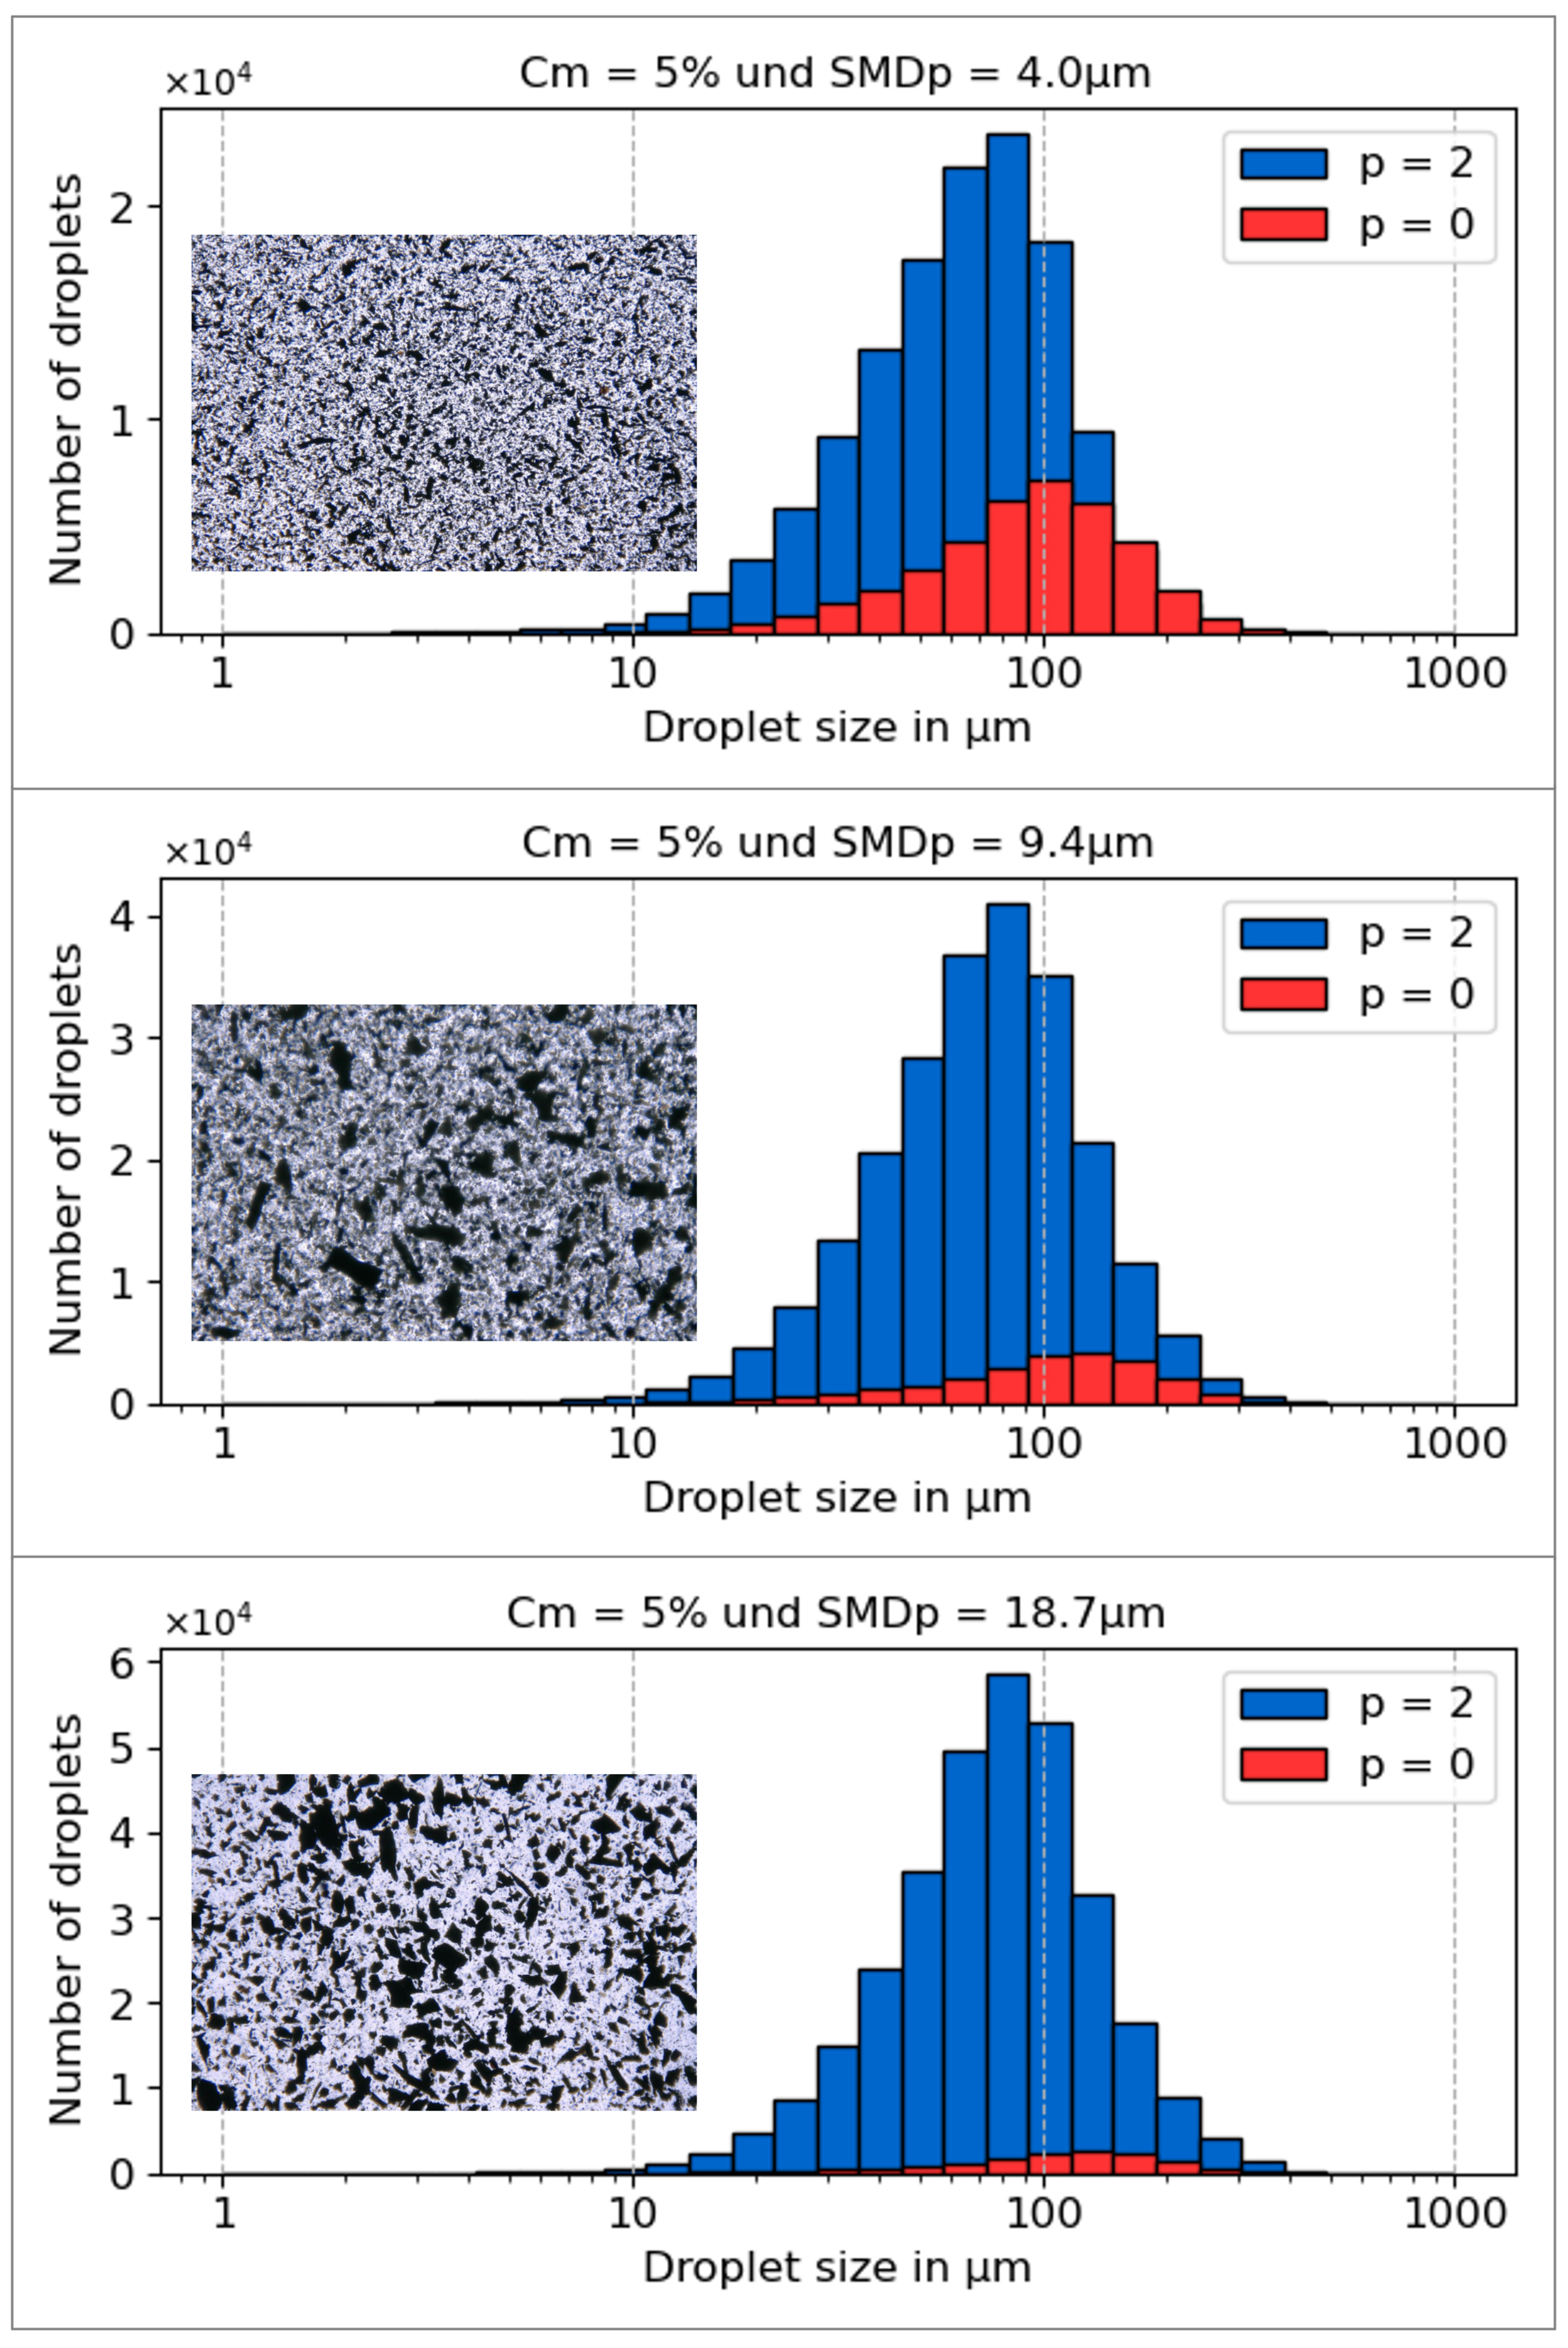
To analyze the correlation between light-scattering effects and suspension composition in this study, the suspensions from all variations used in the experiment were qualitatively analyzed under a microscope, ensuring that the thickness of the suspension samples remained constant. The images of the different suspension compositions are presented in
Figure 3 and
Figure 4, showing the absorption of backlight from the microscope for the variations. This absorption correlates with the absorption of the refracted Gaussian beam passing through a suspension droplet.
The visual analysis of the microscope images reveals two obvious effects. First, higher particle concentrations result in increased absorption. Second, for a constant suspension concentration, smaller coal particles have a larger effective surface area and, consequently, scatter more light. A similar phenomenon can be observed in the significant differences in the visibility range between rain and fog. Therefore, suspensions with smaller particles are expected to exhibit higher absorption effects at the same concentration.
The light absorption of a beam passing through a suspension droplet can be estimated using Lambert–Beer’s law, expressed as
where
is the intensity of the incident light beam,
represents the absorption coefficient,
is the path length of the light through the suspension probe, and
I is the intensity of the absorbed light beam.
In the case of first-order refraction, the light beam traverses the interior of the suspension droplet, as shown in
Figure 1. Consequently, the larger the droplet, the longer the path
, making it directly proportional to the droplet size
d. Additionally, the absorption effect is influenced by the suspended particles, with higher particle concentrations
C leading to greater absorption. Furthermore, the size of the suspended particles
and their total surface area also play a crucial role in absorption. Smaller particles result in a larger distribution and greater total surface area, thereby enhancing absorption.
From this perspective, the absorption coefficient
is directly proportional to the particle concentration
C and inversely proportional to the particle size
. As a result, Lambert–Beer’s law can be reformulated as
where
q is referred to as the refraction-pass parameter, which determines whether refraction light scattering is detectable.
This reformulation provides a reliable estimation for determining whether a suspension droplet can be classified as semi-transparent or non-transparent. Differentiating between semi-transparent and non-transparent suspension droplets is the key idea of this study for determining particle concentration and size. For a more detailed description of light scattering in complex dynamic droplets, refer to the dissertation by Li (2020) [
23], which includes an extensive numerical analysis supported by partial experimental confirmation. In our approach, we focus only on the refraction-pass parameter
q, which holds an abstract meaning and is not discussed quantitatively in this study.
3. Light-Scattering Generator
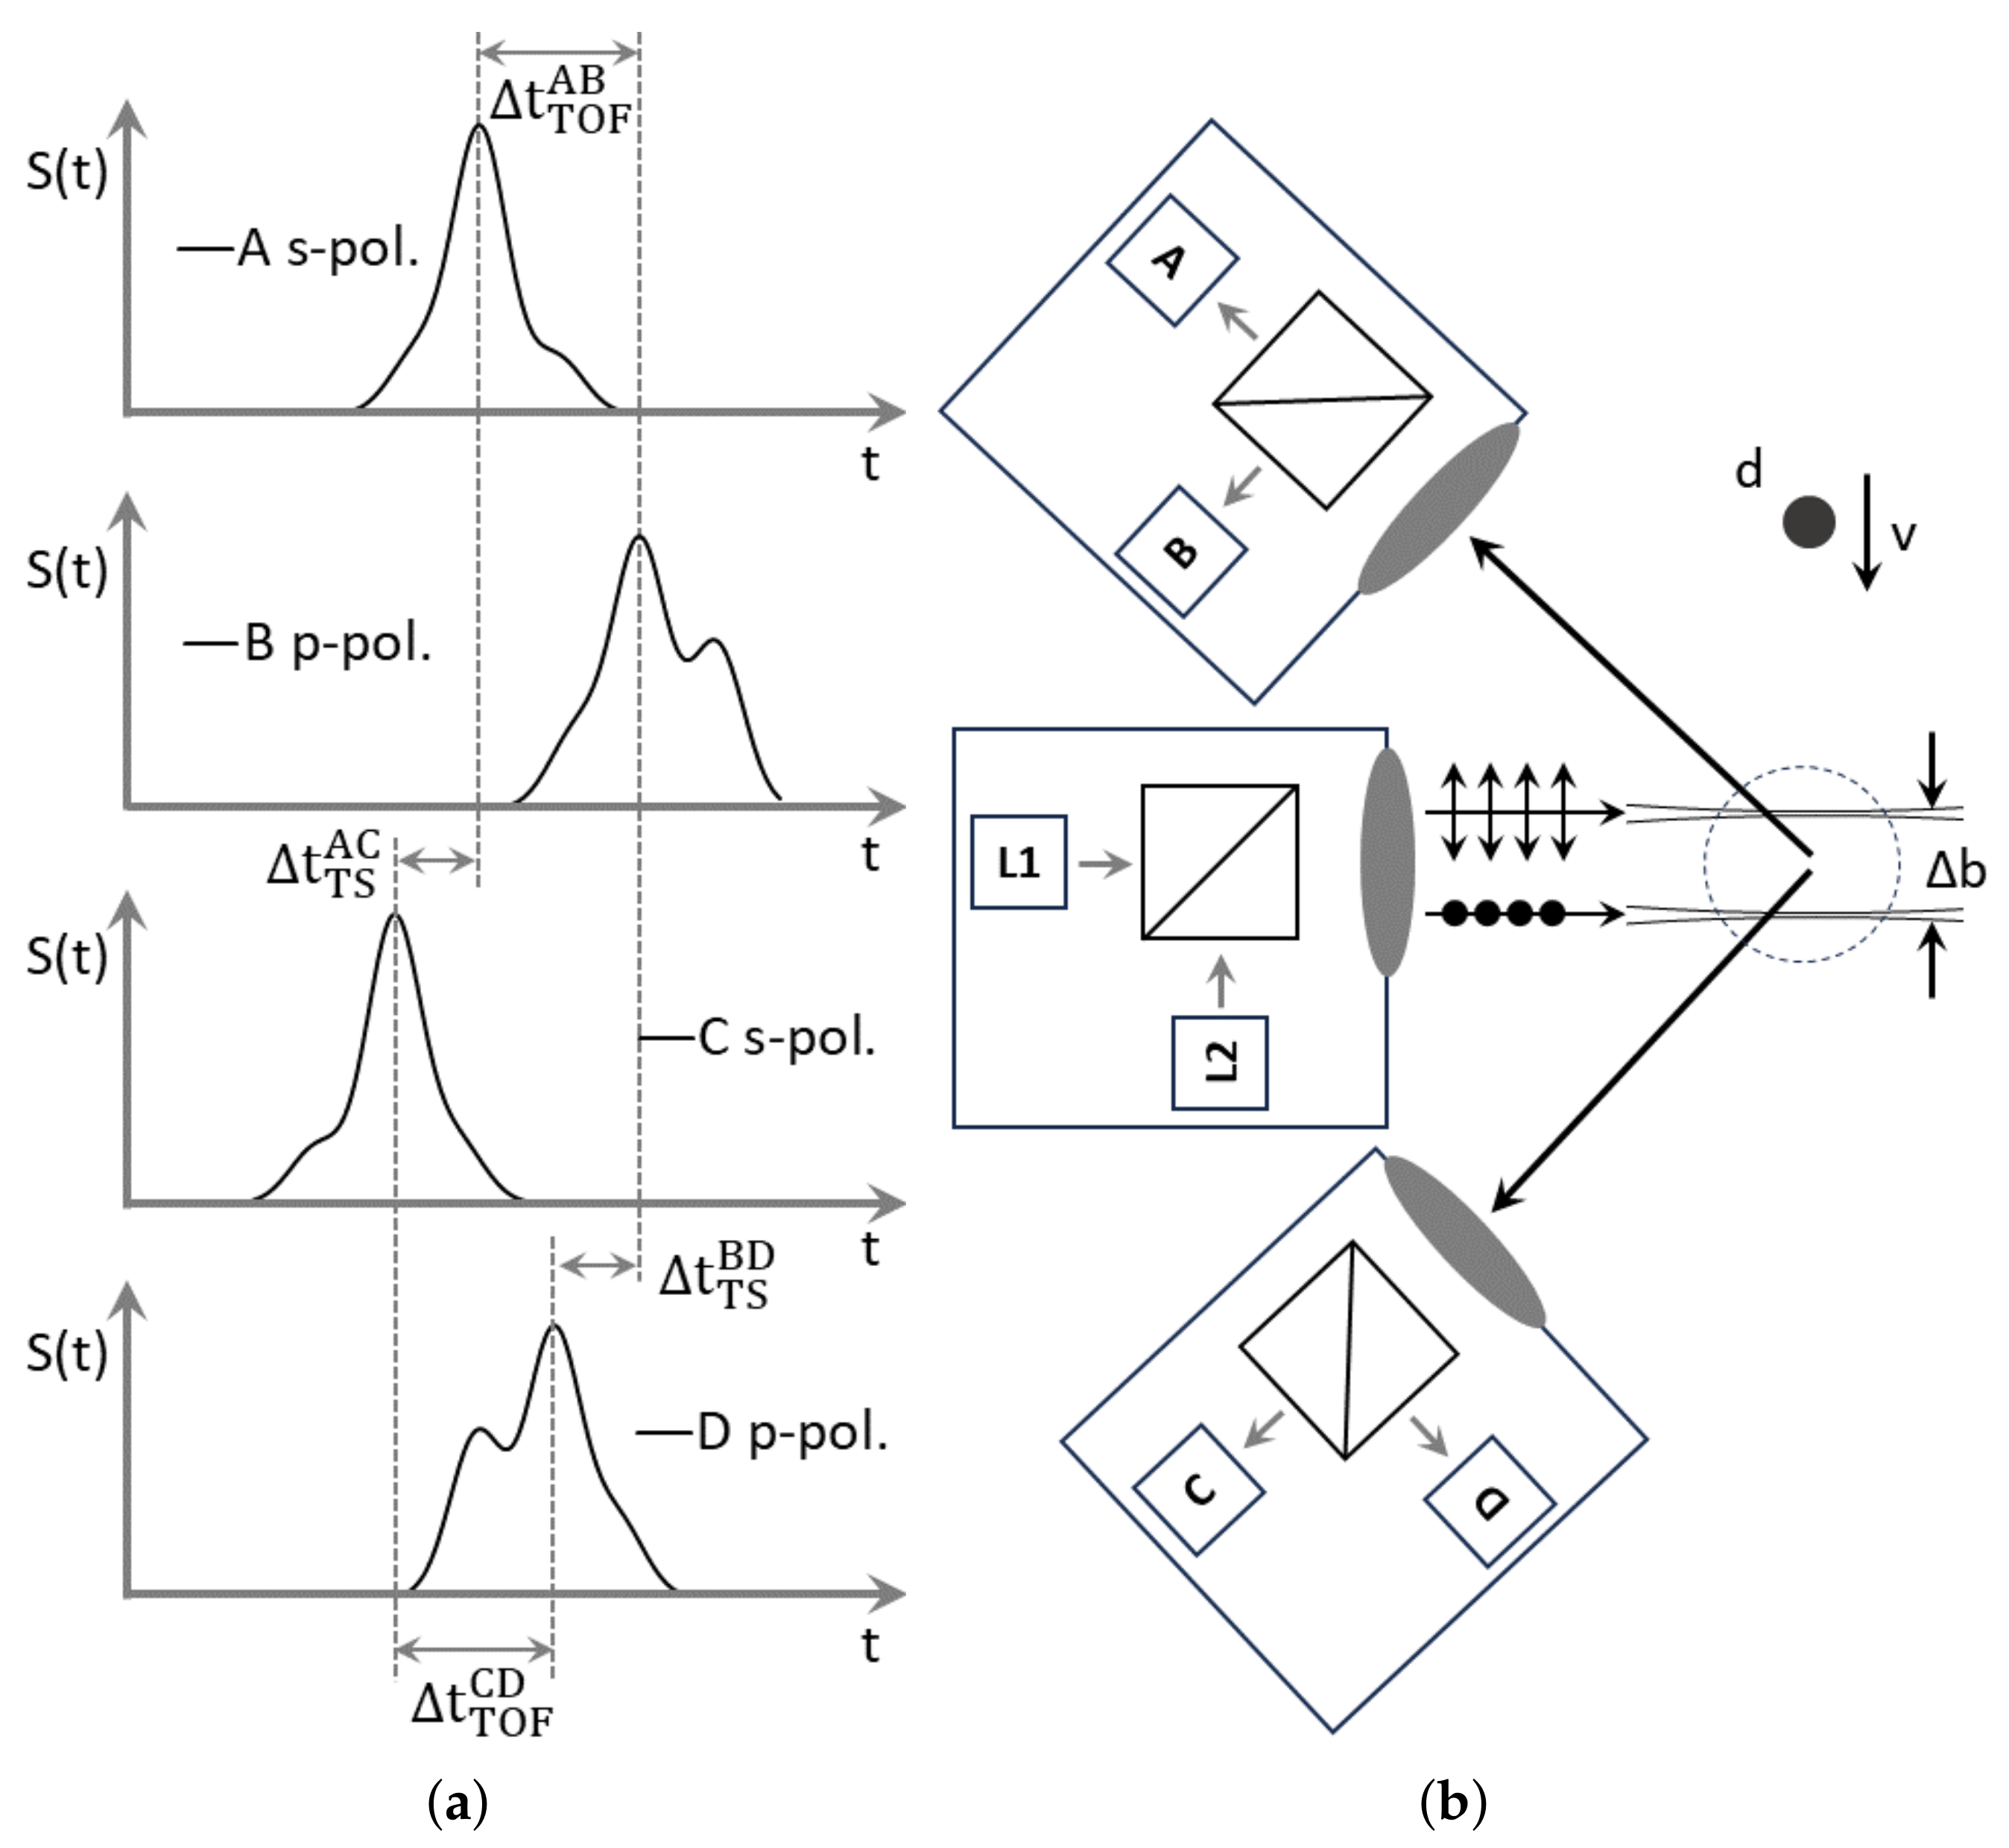
In the experimental setup, we utilized a time-shift time-of-flight (TSTOF) measurement system to generate light-scattering signals from dynamic suspension droplets. These droplets passed sequentially through two shaped light beams with different polarizations. The optical arrangement of the TSTOF device is depicted schematically in
Figure 5 and extensively described in prior works, such as [
41], which offers a robust approach for analyzing light-scattering phenomena. Additional insights into this technique can be found in resources like the OpenAI Chatbot [
42]. The commercial version of the TSTOF device is widely recognized under the brand name
SpraySpy® [
29].
The TSTOF setup used in this study is schematically illustrated in
Figure 5. It utilizes two light sources and four detectors, all arranged on the same side, to capture light scattering within the backscatter region. In this region, in case of refraction, the light beam passes through the droplets twice before being registered by the detectors. Scattered light signals from individual droplets exhibit time shifts relative to one another, which are directly correlated with the droplet size and velocity. The signal amplitude scales quadratically with the droplet size, while the full width at half maximum (FWHM) of the signal is proportional to the droplet velocity [
41]. By analyzing these signals, the size and velocity of individual suspension droplets can be determined with high precision.
In this study, the transparency of suspension droplets was assessed based on their scattering order. Droplets were classified as non-transparent if only reflection (
) was observed in the light-scattering signal. In contrast, droplets were considered semi-transparent if refraction (
) was detected. At low particle concentrations, refracted light can more easily pass through the droplet. However, as the concentration increases, the suspended particles interfere with the refracted light, resulting in a baseline effect [
32].
The measurement device used in the experiment operates in a backscatter configuration, meaning that all components—including the laser, detectors, and optical elements—are located on the same side. This setup allows the device to be used in applications with limited optical access. In the backscatter region, second-order refraction becomes active. Therefore, transparent droplets are defined as those in which second-order refraction is observed, indicated by a scattering order of .
4. Experimental Setup and Results
The investigations were conducted using the ATMOspheric spray test rig (ATMO) at the KIT/ITC facility, as described in detail in [
44] and shown in
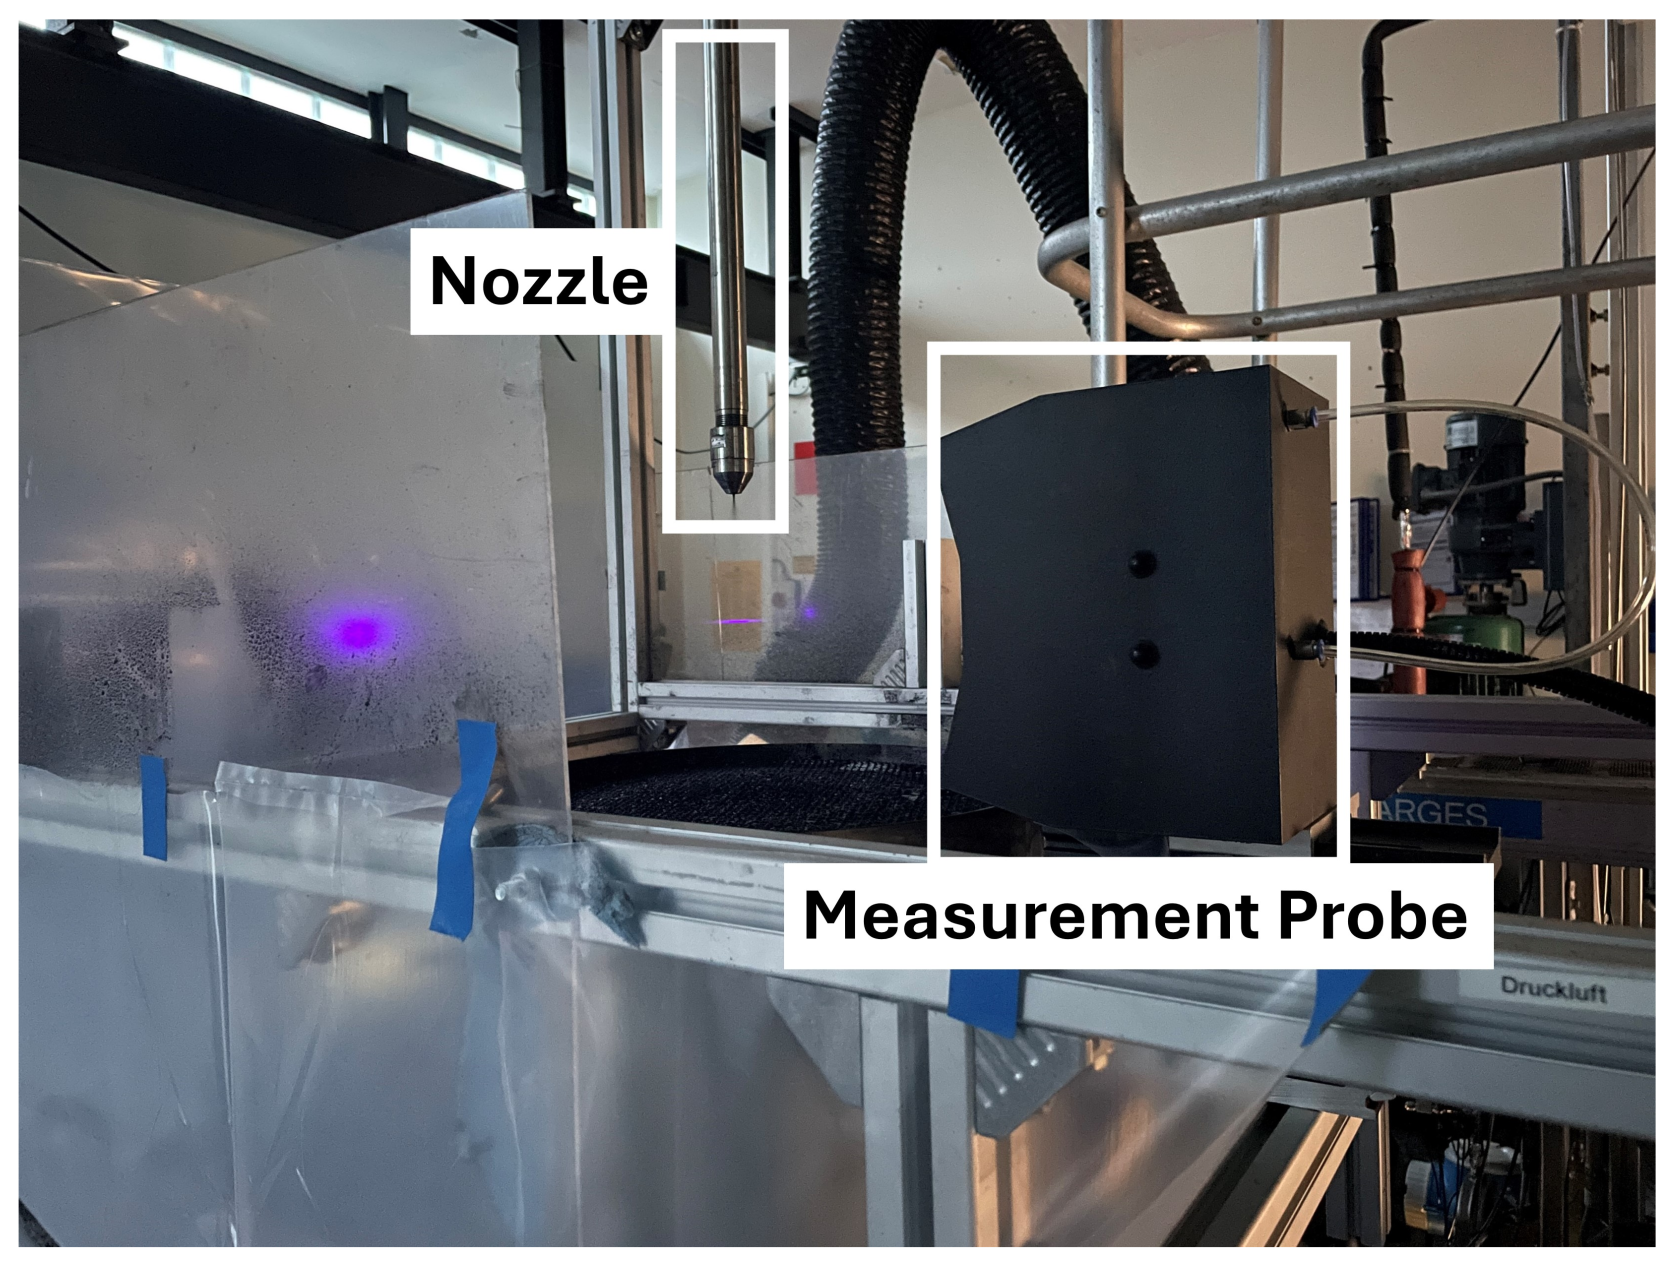
Figure 6. A twin-fluid lance was supplied by liquid or suspension fluids through an eccentric screw pump controlled with a Coriolis mass flow and density meter. A stirred liquid storage tank was used to avoid sedimentation. A hot-wire anemometer with a valve controlled the atomizing air mass flow in the range. In order to prevent the recirculation of small droplets through the suction of the exhaust air, a honeycomb structure was placed at the inlet of the collection tank to serve as a flow straightener. The twin-fluid atomizer has a central tube with a diameter of 2 mm and a surrounding gas slit of 2.06 mm. For spray characterization, the TSTOF measurement instrument described in the previous section was used. A photograph of part of the experimental setup is shown in
Figure 7, depicting the nozzle and measurement head of the TSTOF instrument.
The spray parameters were kept constant at and , and the measurement position in the spray was fixed. Horizontally, it was located in the center of the nozzle, and vertically, it was 120 mm from the nozzle exit. Three different suspension concentrations, , and three sizes of suspended particles, , were used. In total, five measurements were conducted.
The composition of the suspension can have a measurable influence on the atomization process, potentially affecting the droplet size, velocity, and spray density. In this scenario, the absolute values of these parameters may vary with the composition of the suspension. To measure the suspension composition without being affected by variations in the atomization process, we propose using the relative droplet rate (
) and the Sauter Mean Diameter (SMD) of semi-transparent droplets. The relative droplet rate is expected to be more robust against variations in droplet size, velocity, and spray density because these variations affect both non-transparent and semi-transparent droplets, preserving the relative ratio. Additionally, the SMD of the detected semi-transparent droplets is entirely independent of the number of droplets, their velocity, or their size. According to the relationship described in Equation (
2), the SMD depends solely on the suspension composition. For these reasons, we propose using only these two parameters—
and the SMD of semi-transparent droplets—to characterize the composition of suspensions used in the atomization process.
Using the TSTOF setup, individual suspension droplets were measured in both semi-transparent and non-transparent modes. Based on the measured droplet size distributions, the Sauter Mean Diameter (SMD) and the relative droplet rate (
) of semi-transparent suspension droplets were calculated. The relevant results are presented in
Table 1, which shows the SMD and relative droplet rate of semi-transparent suspension droplets. The droplet velocity remained nearly constant at 31 m/s across all measurements, as expected under the constant atomization parameters. All measurement data has been published on Zenodo [
45]. Graphical representations of the measurement data are shown in
Figure 3 and
Figure 4.
The measurement results demonstrate a correlation with both the suspension concentration and the size of suspended particles. First, the measurement data (1) illustrate the correlation between the relative number of semi-transparent droplets
and the Sauter Mean Diameter (SMD) with the suspension concentration. At lower concentrations, the relative number of semi-transparent droplets is higher, and the SMD of suspension droplets, which remain detectable as semi-transparent, is larger. Second, the measurement data (1) shows the relationship between
and SMD for a constant suspension concentration of 5% with varying sizes of suspended particles. Larger suspended particles result in a higher number of semi-transparent droplets being detected. Additionally, the SMD of semi-transparent suspension droplets also increases with larger particle sizes. These correlations align with the relationship described by Equation (
2).
In the experiment, we identified a limited range within which the monitoring of the slurry spray is effective. This limitation arises because the calculation of the relative droplet rate () requires both non-transparent and semi-transparent suspension droplets to be detectable. If only semi-transparent or only non-transparent suspension droplets are present, the value of will be either 100% or 0%, making it impossible to distinguish values beyond these extremes. Consequently, measurements outside this range cannot provide meaningful information about the suspension composition.
5. Measurement Instrument
Based on the approach discussed above, we propose a simplified version of the TSTOF setup and calculation process. In the context of the measurement method presented here, detecting variations in the concentration of suspended particles or their size distribution can be achieved by simply counting the number of semi-transparent and non-transparent suspension droplets. Consequently, it is not necessary to measure the size of the suspension droplets. Instead, determining whether a droplet is semi-transparent or non-transparent by analyzing the sequence of light-scattering signals is sufficient.
This simplified setup requires only a single light source and two detectors. Signal processing is reduced to peak detection within a low-frequency band, enabling the development of a more cost-effective and compact device. Such a device could be used to monitor slurry sprays, paint sprays, or, more generally, sprays containing heterogeneous droplets.
Additionally, it would be feasible to develop a machine learning model with a single task: detecting droplet transparency. This can be achieved by analyzing the shape of the light-scattering signal, which often has shift symmetry depending on the transparency. This machine learning approach can be implemented in a configuration with a single light source and a single detector, further optimizing the simplicity and cost-effectiveness of the system. This approach not only simplifies the setup but also broadens its potential applications in real-time monitoring scenarios. An AI-based approach using a single light-scattering signal to analyze droplet properties has been discussed in detail in [
43].
It is important to note that this measurement method is effective only if a statistically relevant number of semi-transparent and non-transparent suspension droplets can be detected. This can be achieved by increasing the light intensity or adjusting the spectral properties of the light source to minimize or maximize absorption. Suspensions with high particle concentrations cannot be measured using this method, as only reflection signals would be detectable. In such cases, analyzing the baseline of the signal could be a useful solution, as discussed in [
20,
23,
32].
Moreover, for increasing or decreasing the detection probability of semi-transparent particles, the path length of the light beam passing through the suspension droplet and the composition of the droplet can be optimized to ensure that the refracted beam exits the droplet and is registered by the detector. The path length of the light beam through the droplet can be optimized by adjusting the light-scattering angle. Typically, in the forward-scattering regime, the light beam passes through the droplet once, whereas in the backscattering regime, it passes through twice. Depending on the suspension composition, adapting the light-scattering angle may be advantageous.
In slurry sprays, some droplets may not contain particles at all, depending on the suspension composition. The number of such droplets must also correlate with the suspension composition. To gain more advanced insights into the composition of individual suspension droplets, analyzing individual light-scattering signals can be useful. In many industrial applications, where material properties vary, calibration processes may not be possible. In such cases, we propose the use of unsupervised machine learning with clustering techniques to classify individual light-scattering signals.
6. Conclusions and Future Work
In this work, we demonstrated a method for using light scattering from individual suspension droplets passing through a Gaussian beam to estimate the concentration of suspension droplets and the size of the suspended particles. We identified the Sauter Mean Diameter and the relative droplet rate of semi-transparent droplets as effective parameters for monitoring slurry sprays and suspension compositions. Additionally, we proposed an optical arrangement of the TSTOF setup with a simplified configuration that requires only two detectors and one light source. Furthermore, we suggested a more compact setup using a single detector and a single light source combined with machine learning for analyzing light-scattering signals.
In future work, we will focus on the realization of a commercial measurement instrument capable of monitoring slurry sprays. This will require at least a quantitative analysis of suspension concentration in incremental steps (e.g., 0%, 1%, 2%, 4%, etc.) and the use of different types of particles to provide more detailed data for developing a physical model. Additionally, an unsupervised machine learning approach will be developed to cluster individual droplets and utilize this information for more advanced slurry-spray characterization and monitoring.
Author Contributions
Conceptualization, W.S., S.F., M.H. and T.J.; Methodology, W.S. and T.J.; Software, W.S.; Validation, W.S., S.F., M.H. and T.J.; Investigation, W.S., S.F., M.H. and T.J.; Writing—Original Draft Preparation, W.S., S.F., M.H. and T.J.; Writing—Review and Editing, W.S. and T.J.; Visualization, W.S. and T.J.; Supervision, W.S. and T.J. All authors have read and agreed to the published version of the manuscript.
Funding
This research received no external funding.
Institutional Review Board Statement
Not applicable.
Informed Consent Statement
Not applicable.
Data Availability Statement
The data underlying the results presented in this paper are publicly available at [
45]. The use of the data is permitted only for academic purposes and not for any commercial purposes.
Conflicts of Interest
Author Walter Schäfer was employed by the company ai-quanton GmbH. The remaining authors declare that the research was conducted in the absence of any commercial or financial relationships that could be construed as potential conflicts of interest.
References
- Kijo-Kleczkowska, A.; Gnatowski, A. Recycling of plastic waste, with particular emphasis on thermal methods. Energies 2022, 15, 2114. [Google Scholar] [CrossRef]
- Ragaert, K.; Delva, L.; Van Geem, K. Mechanical and chemical recycling of solid plastic waste. Waste Manag. 2017, 69, 24–58. [Google Scholar] [CrossRef] [PubMed]
- Eberhard, M.; Santo, U.; Böning, D.; Schmid, H.; Michelfelder, B.; Zimmerlin, B.; Günther, A.; Weigand, P.; Müller-Hagedorn, M.; Stapf, D.; et al. Der bioliq®-Flugstromvergaser—Ein Baustein der Energiewende. Chem. Ing. Tech. 2018, 90, 85–98. [Google Scholar] [CrossRef]
- Dammann, M.; Santo, U.; Böning, D.; Knoch, H.; Eberhard, M.; Kolb, T. Entrained flow gasification: Pilot-scale experimental, balancing and equilibrium data for model validation. Fuel 2025, 382, 132809. [Google Scholar] [CrossRef]
- Fleck, S.; Santo, U.; Hotz, C.; Jakobs, T.; Eckel, G.; Mancini, M.; Weber, R.; Kolb, T. Entrained flow gasification Part 1: Gasification of glycol in an atmospheric-pressure experimental rig. Fuel 2018, 217, 306–319. [Google Scholar] [CrossRef]
- Ögren, Y.; Gullberg, M.; Wennebro, J.; Sepman, A.; Tóth, P.; Wiinikka, H. Influence of oxidizer injection angle on the entrained flow gasification of torrefied wood powder. Fuel Process. Technol. 2018, 181, 8–17. [Google Scholar] [CrossRef]
- Förster, T.; Voloshchuk, Y.; Richter, A.; Meyer, B. 3D numerical study of the performance of different burner concepts for the high-pressure non-catalytic natural gas reforming based on the Freiberg semi-industrial test facility HP POX. Fuel 2017, 203, 954–963. [Google Scholar] [CrossRef]
- Fang, N.; Lu, Y.; Li, Z.; Lu, Y.; Chen, Z. Improving mixing and gasification characteristics in an industrial-scale entrained flow gasifier with a novel burner. J. Clean. Prod. 2022, 362, 132157. [Google Scholar] [CrossRef]
- Haas, M.; Dammann, M.; Fleck, S.; Kolb, T. Entrained flow gasification: Impact of fuel spray distribution on reaction zone structure. Fuel 2023, 334, 126572. [Google Scholar] [CrossRef]
- Bader, A.; Hartwich, M.; Richter, A.; Meyer, B. Numerical and experimental study of heavy oil gasification in an entrained-flow reactor and the impact of the burner concept. Fuel Process. Technol. 2018, 169, 58–70. [Google Scholar] [CrossRef]
- Jakobs, T.; Wachter, S.; Haas, M.; Fleck, S.; Kolb, T. Burner Development for High Pressure Entrained Flow Gasification. In Proceedings of the DECHEMA 2022 Jahrestagung-(Bio) Process Engineering—A Key to Sustainable Development (2022), Aachen, Germany, 12–15 September 2022. [Google Scholar]
- Wachter, S.; Jakobs, T.; Kolb, T. Mass flow scaling of gas-assisted coaxial atomizers. Appl. Sci. 2022, 12, 2123. [Google Scholar] [CrossRef]
- Wachter, S.; Jakobs, T.; Kolb, T. Comparison of central jet and annular sheet atomizers at identical gas momentum flows. Ind. Eng. Chem. Res. 2021, 60, 11502–11512. [Google Scholar] [CrossRef]
- Xue, Z.; Gong, Y.; Guo, Q.; Wang, F.; Yu, G. Visualization study on breakup modes of coal water slurry in an impinging entrained-flow gasifier. Fuel 2019, 244, 40–47. [Google Scholar] [CrossRef]
- Semidetnov, N. Investigation of Laser Doppler Anemometer as Instrumentation for Two Phase Flow Measurements. Ph.D. Thesis, Leningrad Institut for Precision Mechanics and Optics, St. Petersburg, Russia, 1985. [Google Scholar]
- Pavlovskii, B.A.; Semidetnov, N.V. Combined velocity, size, and concentration measurement for particles in a two-phase flow. Meas. Tech. 1991, 34, 917–921. [Google Scholar] [CrossRef]
- Damaschke, N. Light Scattering Theories and Their Use for Single Particle Characterization; Forschungsberichte Strömungslehre und Aerodynamik; Shaker: Aachen, Germany, 2003; Volume 7. [Google Scholar]
- Bakić, S. Time Integrated Detection and Applications of Femtosecond Laser Pulses Scattered by Small Particles. Ph.D. Thesis, Technische Universität Darmstadt, Darmstadt, Germany, 2010. [Google Scholar]
- Kretschmer, A. Partikelcharakterisierung mit dem Zeitverschiebungsverfahren. Ph.D. Thesis, Universität Rostock, Rostock, Germany, 2011. [Google Scholar]
- Schäfer, W. Time-shift technique for particle characterization in sprays. Ph.D. Thesis, Technische Universität Darmstadt, Darmstadt, Germany, 2012. [Google Scholar]
- Stegmann, P.G. Light Scattering by Non-Spherical Particles. Ph.D. Thesis, Technische Universität Darmstadt, Darmstadt, Germany, 2016. [Google Scholar]
- Rosenkranz, S.; Schäfer, W.; Tropea, C.; Zoubir, A.M. Modeling photon transport in turbid media for measuring colloidal concentration in drops using the time-shift technique. Appl. Opt. 2016, 55, 9703. [Google Scholar] [CrossRef] [PubMed]
- Li, L. Light Scattering of Complex Particles: Application to the Time-Shift Technique. Ph.D. Thesis, Technische Universität Darmstadt, Darmstadt, Germany, 2020. [Google Scholar] [CrossRef]
- Wigger, G.; Briesenick, D.; Eierhoff, D.; Bornemann, C.; Riediger, S.; Goedeke, L.; Ehrhard, P. Method for Determining the Droplet Size Distribution During Atomization and Screening Method Based Thereon in Paint Development. WO/2020/002245, 2 January 2020. [Google Scholar]
- Weich, D. Charakterisierung des Sprays der Industriellen Serienlackierung mit Hochrotationszerstäubern und Untersuchung der Zusammenhänge zu Eingangs- und Ergebnisgrößen. Ph.D. Thesis, Universität Bremen, Bremen, Germany, 2021. [Google Scholar]
- Wachter, S. Scale-Up and Design of Gas-Assisted Atomizers. Ph.D. Thesis, Karlsruher Institut für Technologie, Karlsruhe, Germany, 2023. [Google Scholar] [CrossRef]
- Wachter, S.; Jakobs, T.; Kolb, T. Effect of Solid Particles on Droplet Size Applying the Time-Shift Method for Spray Investigation. Appl. Sci. 2020, 10, 7615. [Google Scholar] [CrossRef]
- Gödeke, L. Experimental Investigation of High-Speed Rotary Bell Atomization by Laser-Optical Methods. Ph.D. Thesis, Technische Universität Darmstadt, Darmstadt, Germany, 2023. [Google Scholar] [CrossRef]
- AOM-Systems GmbH. Available online: https://aom-systems.com (accessed on 28 June 2025).
- ai-quanton GmbH. Available online: https://ai-quanton.com (accessed on 28 June 2025).
- Tropea, C.; Schäfer, W. Verfahren und Vorrichtung zur Bestimmung der Größe Eines Opaken Transluzenten Teilchens. WO2013139691A2, 26 September 2013. [Google Scholar]
- Schäfer, W.; Tropea, C. The time-shift technique for measurement size of non-transparent spherical particles. In Proceedings of the International Conference on Optical Particle Characterization (OPC 2014), Tokyo, Japan, 10–14 March 2014; Aya, N., Iki, N., Shimura, T., Shirai, T., Eds.; Volume 9232, p. 92320H. [Google Scholar] [CrossRef]
- Schäfer, W.; Tropea, C. Characterization of atomization processes in suspension/emulsion sprays. In Proceedings of the ICLASS 2015—13th International Conference on Liquid Atomization and Spray Systems, Tainan, Taiwan, 23–27 August 2015; pp. 1–7. [Google Scholar]
- Kuhnhenn, M.; Luh, M.F.; Joensen, T.V.; Roisman, I.V.; Tropea, C. Experimental Characterization of Spray generated by a Rotary Atomizer Wheel. In Proceedings of the ILASS–Europe 2017 28th Conference on Liquid Atomization and Spray Systems, Universitat Politècnica València, Valencia, Spain, 6–8 September 2017; Volume 1, pp. 4–7. [Google Scholar] [CrossRef]
- Stegmann, P.G.; Tropea, C.; Järvinen, E.; Schnaiter, M. Comparison of measured and computed phase functions of individual tropospheric ice crystals. J. Quant. Spectrosc. Radiat. Transf. 2016, 178, 379–389. [Google Scholar] [CrossRef]
- Zaitone, B.; Hunsmann, S.; Castanet, G.; Damaschke, N.; Ebert, V.; Tropea. Evaporation of an acoustically levitated droplet. In Proceedings of the 10th International Conference on Liquid Atomization and Spray Systems, ICLASS 2006, Kyoto, Japan, 27 August–1 September 2006. [Google Scholar]
- Zaitone, B. Drying of Multiphase Single Droplets in Ultrasonic Levitator. Ph.D. Thesis, Technische Universität Darmstadt, Darmstadt, Germany, 2009. [Google Scholar]
- Heinisch, C. Optische Messtechnik für umströmte Tropfen in Einer Neuen Elektrodynamischen Falle. Ph.D. Thesis, Technische Universität Darmstadt, Darmstadt, Germany, 2008. [Google Scholar]
- Bakić, S.; Heinisch, C.; Damaschke, N.; Tschudi, T.; Tropea, C. Time integrated detection of femtosecond laser pulses scattered by small droplets. Appl. Opt. 2008, 47, 523–530. [Google Scholar] [CrossRef] [PubMed]
- Malvern Panalytical Ltd. 2025. Available online: https://www.malvernpanalytical.com (accessed on 28 June 2025).
- Schaefer, W.; Tropea, C.; Wigger, G.; Eierhoff, D. Spray measurements with the time-shift technique. Meas. Sci. Technol. 2021, 32, 105202. [Google Scholar] [CrossRef]
- OpenAI GPT; Custom Version TSTOF. Interactive Discussion on the Time-Shift Time-of-Flight (TSTOF) Measurement Method for Droplet and Particle Characterization in Flows. 2024. Available online: https://tstof.com (accessed on 28 June 2025).
- Schaefer, W.; Li, L. Particle characterization by analyzing light scattering signals with a machine learning approach. Appl. Opt. 2024, 63, 7701–7707. [Google Scholar] [CrossRef]
- Sänger, A.D. Zerstäubung hochviskoser Fluide bei variierendem Systemdruck—Grundlagenforschung zur Hochdruck-Flugstromvergasung. Ph.D. Thesis, Karlsruher Institut für Technologie (KIT), Karlsruhe, Germany, 2018. [Google Scholar] [CrossRef]
- Zenodo. Dataset: Optical Measurement Method for Monitoring Slurry Sprays in Recycling Processes for Carbon Dioxide Emission Reduction. 22 December 2024. Available online: https://doi.org/10.5281/zenodo.14544756 (accessed on 28 June 2025).
| Disclaimer/Publisher’s Note: The statements, opinions and data contained in all publications are solely those of the individual author(s) and contributor(s) and not of MDPI and/or the editor(s). MDPI and/or the editor(s) disclaim responsibility for any injury to people or property resulting from any ideas, methods, instructions or products referred to in the content. |
© 2025 by the authors. Licensee MDPI, Basel, Switzerland. This article is an open access article distributed under the terms and conditions of the Creative Commons Attribution (CC BY) license (https://creativecommons.org/licenses/by/4.0/).


