Article

Modal Mode Simulation of Near-Unstable Cavities with Realistic Mirror Maps

1
School of Physics and Astronomy, Beijing Normal University, Beijing 100875, China
2
Department of Physics, Institute of Science Tokyo, Meguro, Tokyo 152-8550, Japan
3
Department of Physics and Astronomy, Vrije Universiteit Amsterdam, VU Amsterdam, 1081 HV Amsterdam, The Netherlands
4
Dutch National Institute for Subatomic Physics (Nikhef), 1098 XG Amsterdam, The Netherlands
5
School of Physical Sciences, University of Adelaide, Adelaide, SA 5005, Australia
6
School of Physics and Technology, Wuhan University, Wuhan 430072, China
*
Authors to whom correspondence should be addressed.
Photonics 2025, 12(7), 670; https://doi.org/10.3390/photonics12070670
Submission received: 23 May 2025 / Revised: 25 June 2025 / Accepted: 27 June 2025 / Published: 2 July 2025

Abstract

Near-unstable cavities hold promise for reducing thermal noise in next-generation gravitational wave detectors and for enhancing light–matter interactions in quantum electrodynamics. However, operating close to the edge of geometrical stability presents significant challenges, including increased coupling to higher-order modes and heightened sensitivity to small cavity length changes and mirror imperfections. This study employs Finesse v3 simulations to systematically investigate the modal behavior of a plano-concave cavity as it approaches instability, incorporating measured mirror surface defects and anisotropic curvature to replicate realistic conditions. The simulations highlight the degradation of beam purity and control signals as the cavity approaches instability. By validating the simulations against experimental data, we confirm Finesse’s reliability for modeling cavities while identifying critical limitations in regimes close to the edge of stability. These findings provide essential guidance for optimizing cavity designs in future gravitational wave detectors, balancing performance gains against the challenges of operating at the stability edge.

1. Introduction

Gravitational wave detection has become a cornerstone for testing general relativity and studying compact astrophysical objects [1,2,3]. As one of the major noise sources in advanced gravitational wave detectors, thermal noise significantly impacts detector sensitivity across most target frequency bands [4,5,6]. To meet the ever-increasing sensitivity requirements of next-generation detectors, suppressing thermal noise, especially coating thermal noise, has emerged as a critical research focus [7,8].
Optical resonators operating near the stability boundary (known as near-unstable cavities, NUCs) have emerged as promising candidates for next-generation gravitational wave detection systems, owing to their advantageous combination of compact geometry and expanded beam profiles that effectively mitigate thermal noise limitations [9,10]. Beyond their application in precision interferometry, such marginally stable optical cavities have become indispensable tools in quantum optical experiments, particularly for achieving strong light–matter coupling in cavity quantum electrodynamics and atomic physics implementations [11,12,13,14,15,16]. The enhanced sensitivity of these configurations comes with inherent challenges, as their proximity to the stability threshold renders them vulnerable to even minute variations in either the resonator length or mirror surface characteristics. They also face challenges such as high optical losses and degeneracy of Gaussian modes. Additionally, the well-defined Gaussian beams can become distorted through interactions with small imperfections on mirror surfaces. These factors negatively affect the instrument’s sensitivity and controllability.

1.1. Stability Criteria and near Unstable Cavity

The stability of an optical resonator determines whether a laser beam can maintain stable propagation through multiple reflections. In simple terms, if the beam remains confined within finite dimensions after successive reflections, the cavity is considered “stable”. Conversely, if the beam diverges and eventually escapes the cavity, it is classified as “unstable”. The stability condition is independent of mirror reflectivity but is intrinsically linked to the curvature radii of the mirrors and the cavity length. Take the simple linear two-mirror cavity as an example. Suppose that the curvature radii of the front mirror and the end mirror are R 1 and R 2 , respectively, and the cavity length is L. The stability of the cavity can be characterized by the g-factor, which is defined as
g = 1 L R 1 1 L R 2 .
A cavity is stable when 0 g 1 . Violation of this condition results in an unstable configuration in which the beam cannot be sustained. In particular, stable cavities exhibit well-defined eigenmodes and high cavity gain, making them ideal for interferometric applications. Unstable cavities can be beneficial in specific applications, such as high-power lasers, where their large mode volumes can result in higher gain [17,18]. However, analyzing mode behavior in these cavities is particularly challenging. Various techniques for characterizing such modes are described in [19,20]. NUCs represent a special class of optical resonators that operate at the boundary of the stability condition where g approaches 0 or 1. These configurations exhibit special beam properties that make them valuable for precision interferometry in gravitational wave detection.
For the concentric cavities widely used in current gravitational wave detectors, the mirror curvature radii satisfy R 1 = R 2 = R c with a cavity length of L = 2 R c . The beam size on the mirrors can be expressed as
w = λ R c π 1 + g 1 g .
This reveals that when the cavity approaches the stability boundary ( g 1 ), the beam spot expands dramatically. This behavior stems from the fundamental dependence of beam parameters on the g-factor, where the spot size grows significantly as the cavity nears instability. The expanded beam size provides a direct mechanism for reducing coating thermal noise, since the noise power spectral density decreases with the square of the beam spot size. However, these benefits come with important technical considerations.

1.2. Challenges of Using near Unstable Cavity

The same geometric properties that enable large beam sizes make the cavities extremely sensitive to tiny perturbations. Cavity length changes on the order of micrometers or subtle mirror imperfections that would be negligible in stable cavities can destabilize a near unstable configuration. Marginally stable optical resonators exhibit enhanced fundamental-to-higher-order mode coupling from mirror surface defects (such as figure errors, surface roughness, and coating non-uniformity) compared to their stable counterparts. This coupling often results in energy being diverted from the fundamental mode to higher-order modes, effectively causing a loss and reducing the overall cavity gain.
Additionally, Gaussian mode degeneracy arises when there is insufficient Gouy phase separation between modes. This modal degeneracy significantly influences both spectral characteristics and energy distribution, driving inevitable power exchange among co-resonant states (see Section 3 for detailed analysis). While conventional stable configurations effectively filter out higher-order modes, marginally stable resonators permit their sustained oscillation due to mirror-induced perturbations. The cascading interaction between successively excited modes progressively degrades beam quality, while the resulting multimodal interference introduces systematic errors in length stabilization and alignment feedback systems.
These fundamental trade-offs present the key engineering challenge for NUCs in gravitational wave detectors. On one hand, they offer better thermal noise performance. On the other hand, they become more sensitive to perturbations. Our research aims to precisely quantify this balance through detailed simulations. In next-generation detectors, coating thermal noise is expected to be a major limiting factor. Despite their operational complexities, NUCs could provide crucial benefits for these future detectors.
In this work, we employ Finesse simulations to systematically investigate modal behavior in near-unstable plano-concave cavities, incorporating measured mirror surface defects and anisotropic curvature to replicate experimental conditions. Our study progresses from establishing the theoretical framework of cavity stability to analyzing higher-order mode coupling effects through comprehensive frequency scans, ultimately validating the simulations against experimental data. The results quantitatively characterize the stability as the cavity approaches geometric instability, providing critical insights for future gravitational wave detector designs.

2. Model of the Simulation

2.1. Finesse Simulation Framework with Higher-Order Modes

Finesse [21] is a versatile interferometer simulation tool that enables modeling of complex optical systems through numerical solution of steady-state field amplitudes. It supports both plane-wave and Hermite–Gaussian mode analyses, with the latter enabling precise studies of mode-matching and misalignment effects. The program also allows the construction of virtual interferometers using customizable optical components (lasers, mirrors, modulators, and detectors). It generates comprehensive output data for analysis, including detector signals, cavity eigenmodes, and beam parameters as functions of adjustable system parameters.
For modeling mirror surface imperfections and their effects, Finesse employs a modal decomposition approach. Any complex optical field u ( x , y , z ) can be expressed as a superposition of orthogonal basis modes:
u ( x , y , z ) = n , m k n m u n m ( x , y , z ) ,
where k n m represents the coupling coefficients containing amplitude and phase information for each Hermite–Gauss (HG) or Laguerre–Gauss (LG) mode u n m . The coupling coefficients are determined through orthogonality conditions
k n m = u ( x , y , z ) u n m ( x , y , z ) d x d y .
Mirror surface distortions primarily affect the beam through phase modulation, analogous to how water ripples distort reflections. This effect is quantified through generalized coupling coefficients that describe energy transfer between incident mode u n m and reflected/transmitted mode u n m
k n , m , n , m q , q , A = u n m ( x , y ; q ) A ( x , y ) u n m x , y ; q d x d y .
Here, q and q represent complex beam parameters, while A ( x , y ) encodes the mirror distortion function. For reflections, A ( x , y ) = exp 2 i k n 1 z ( x , y ) , with n 1 being the refractive index and z ( x , y ) the surface height profile. This formulation captures how mirror imperfections scatter light into higher-order modes, with the coupling coefficients quantifying the efficiency of this process.
Finesse implements this theoretical framework through numerical integration methods, allowing researchers to study how realistic mirror maps affect beam quality in gravitational wave detectors. This simulation program has been extensively validated through its use in Advanced LIGO [5,22], Advanced Virgo [6,23], KAGRA [24,25], and Einstein Telescope [26], establishing it as a reliable tool for investigating NUC behavior and optimizing future detector designs.

2.2. A Plano-Concave Cavity Model

To examine the behavior of cavity when it approaches the stability boundary and evaluate Finesse’s simulation capability for NUCs, we built a linear plano-concave cavity model using Finesse. By gradually adjusting the cavity length toward the unstable region and scanning across a specified laser frequency range, we observed changes in both fundamental and higher-order modes. During simulations, we not only tuned the cavity length and laser frequency but also investigated how increasing the maximum mode order ( m a x t e m , the optional maximum mode order applied in Finesse simulation), affected the results. In order to facilitate comparison with the NUCs’ experimental results in Wang et al. [27], our simulation model adopts the same parameters as those in Wang et al. [27], shown in Table 1.
The plano-concave cavity configuration replicates the experimental setup in Wang et al. [27], consisting of a flat input mirror (IM) and a concave end mirror (EM) with identical specifications. The initial cavity length, mirror curvatures, and reflectivities precisely match the experimental parameters from Wang et al. [27]. The mirror surface map shown in Figure 1 was directly measured from the experimental setup.
Both the plano-concave cavity and the widely used concentric cavity can be operated near the stability boundary while maintaining identical eigenmode properties. The key difference lies in their physical dimensions. The plano-concave configuration requires only half the cavity length of its concentric counterpart, consequently accumulating half the round-trip Gouy phase [27,28], which could be written as
Δ Ψ N = N · 2 arctan L z R ,
where N is the order of the mode, and the Rayleigh range z R for this geometry is z R = L g 2 / 1 g 2 . The offset of the second-order mode resonance frequency from the fundamental mode is represented by f 2 , which serves as a critical stability metric, follows from these relations as
f 2 = 2 FSR π arctan L z R ,
where FSR stands for the free spectral range, enabling derivation of the stability parameter and cavity length
L = R 2 1 g 2 = R 2 2 1 cos f 2 FSR π .
Remarkably, despite these differences, both cavity types exhibit identical eigenmode characteristics when operating near instability.
To accurately reproduce the effects of realistic mirror defects on modal characteristics, we applied the measured mirror map data from Wang et al. [27] on the EM of our NUCs simulation. Figure 1 depicts the mirror surface deformation (mirror map) of the EM, where the x and y axes represent two orthogonal spatial dimensions relative to the mirror center. And the optical path depth represents the height of surface variations along the normal direction of the mirror surface. Furthermore, to better approximate the actual experimental conditions of non-ideal spherical mirror surface, we introduced a controlled curvature anisotropy of Δ R c 145 μ m between the x and y axes of the EM.

3. Simulation Results and Discussion

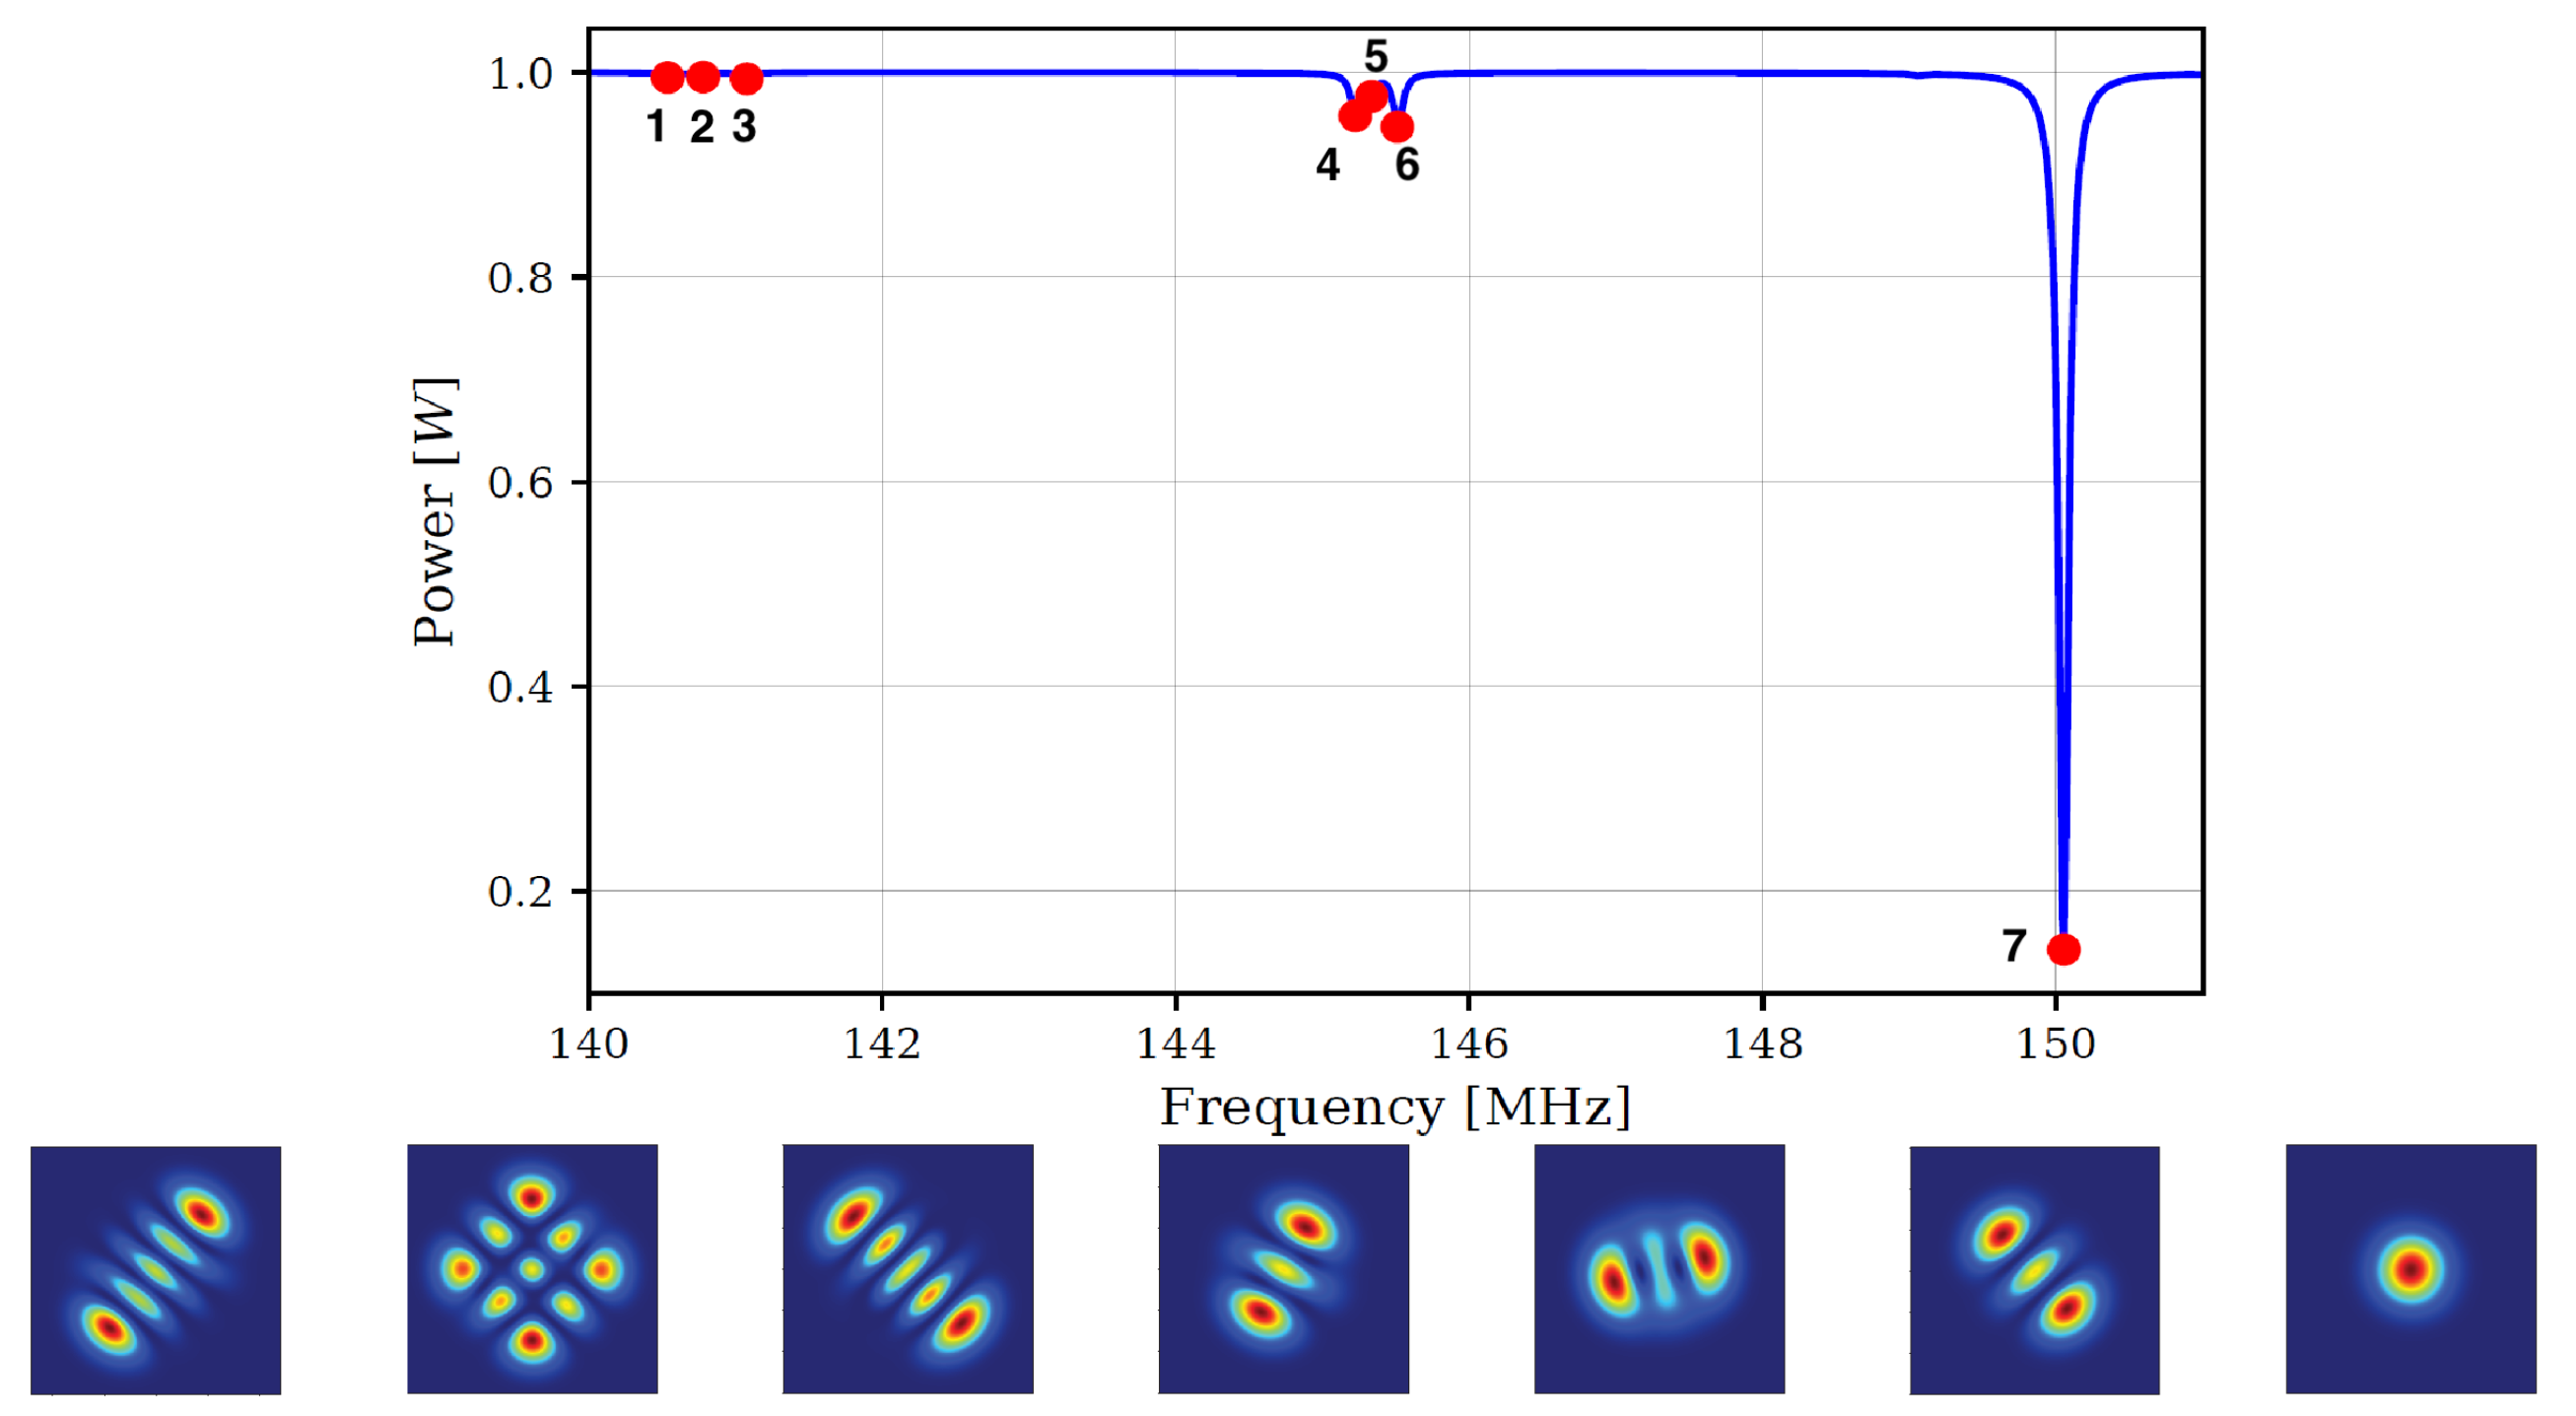
After building the plano-concave cavity model in Finesse, we performed a frequency sweep across 140–151 MHz to characterize the resonant behavior of Gaussian modes at the initial cavity length. The resulting transmission beam profile at the EM output is presented in Figure 2, demonstrating good agreement with experimental observations.
The simulation results presented in Figure 2 demonstrate excellent agreement with the experimentally observed higher-order mode resonance splitting. Three fourth-order modes ( HG 40 , HG 22 , and HG 04 ) exhibit less obvious resonance peaks near 141 MHz, with characteristic frequency separations of approximately 0.3 MHz. Similarly, the second-order modes ( HG 20 and HG 02 ) split into two dominant peaks near 145.5 MHz with comparable 0.3 MHz spacing. Notably, a weak secondary resonance (marked by red dot 5 in Figure 2) appears between the second-order mode peaks, displaying slightly elongated beam profiles that suggest possible hybrid mode coupling.
Under ideal conditions, modes of the same order should exhibit degenerate resonances since they accumulate identical Gouy phase delays. The observed frequency splitting strongly indicates the presence of mirror surface imperfections. NUCs are particularly sensitive to such defects, even micrometer-scale height variations across the mirror surface can induce differential Gouy phase shifts during multiple round trips, ultimately leading to the measured mode separations. This effect becomes especially pronounced when operating close to the stability boundary, where small phase differences accumulate significantly over many cavity circulations.
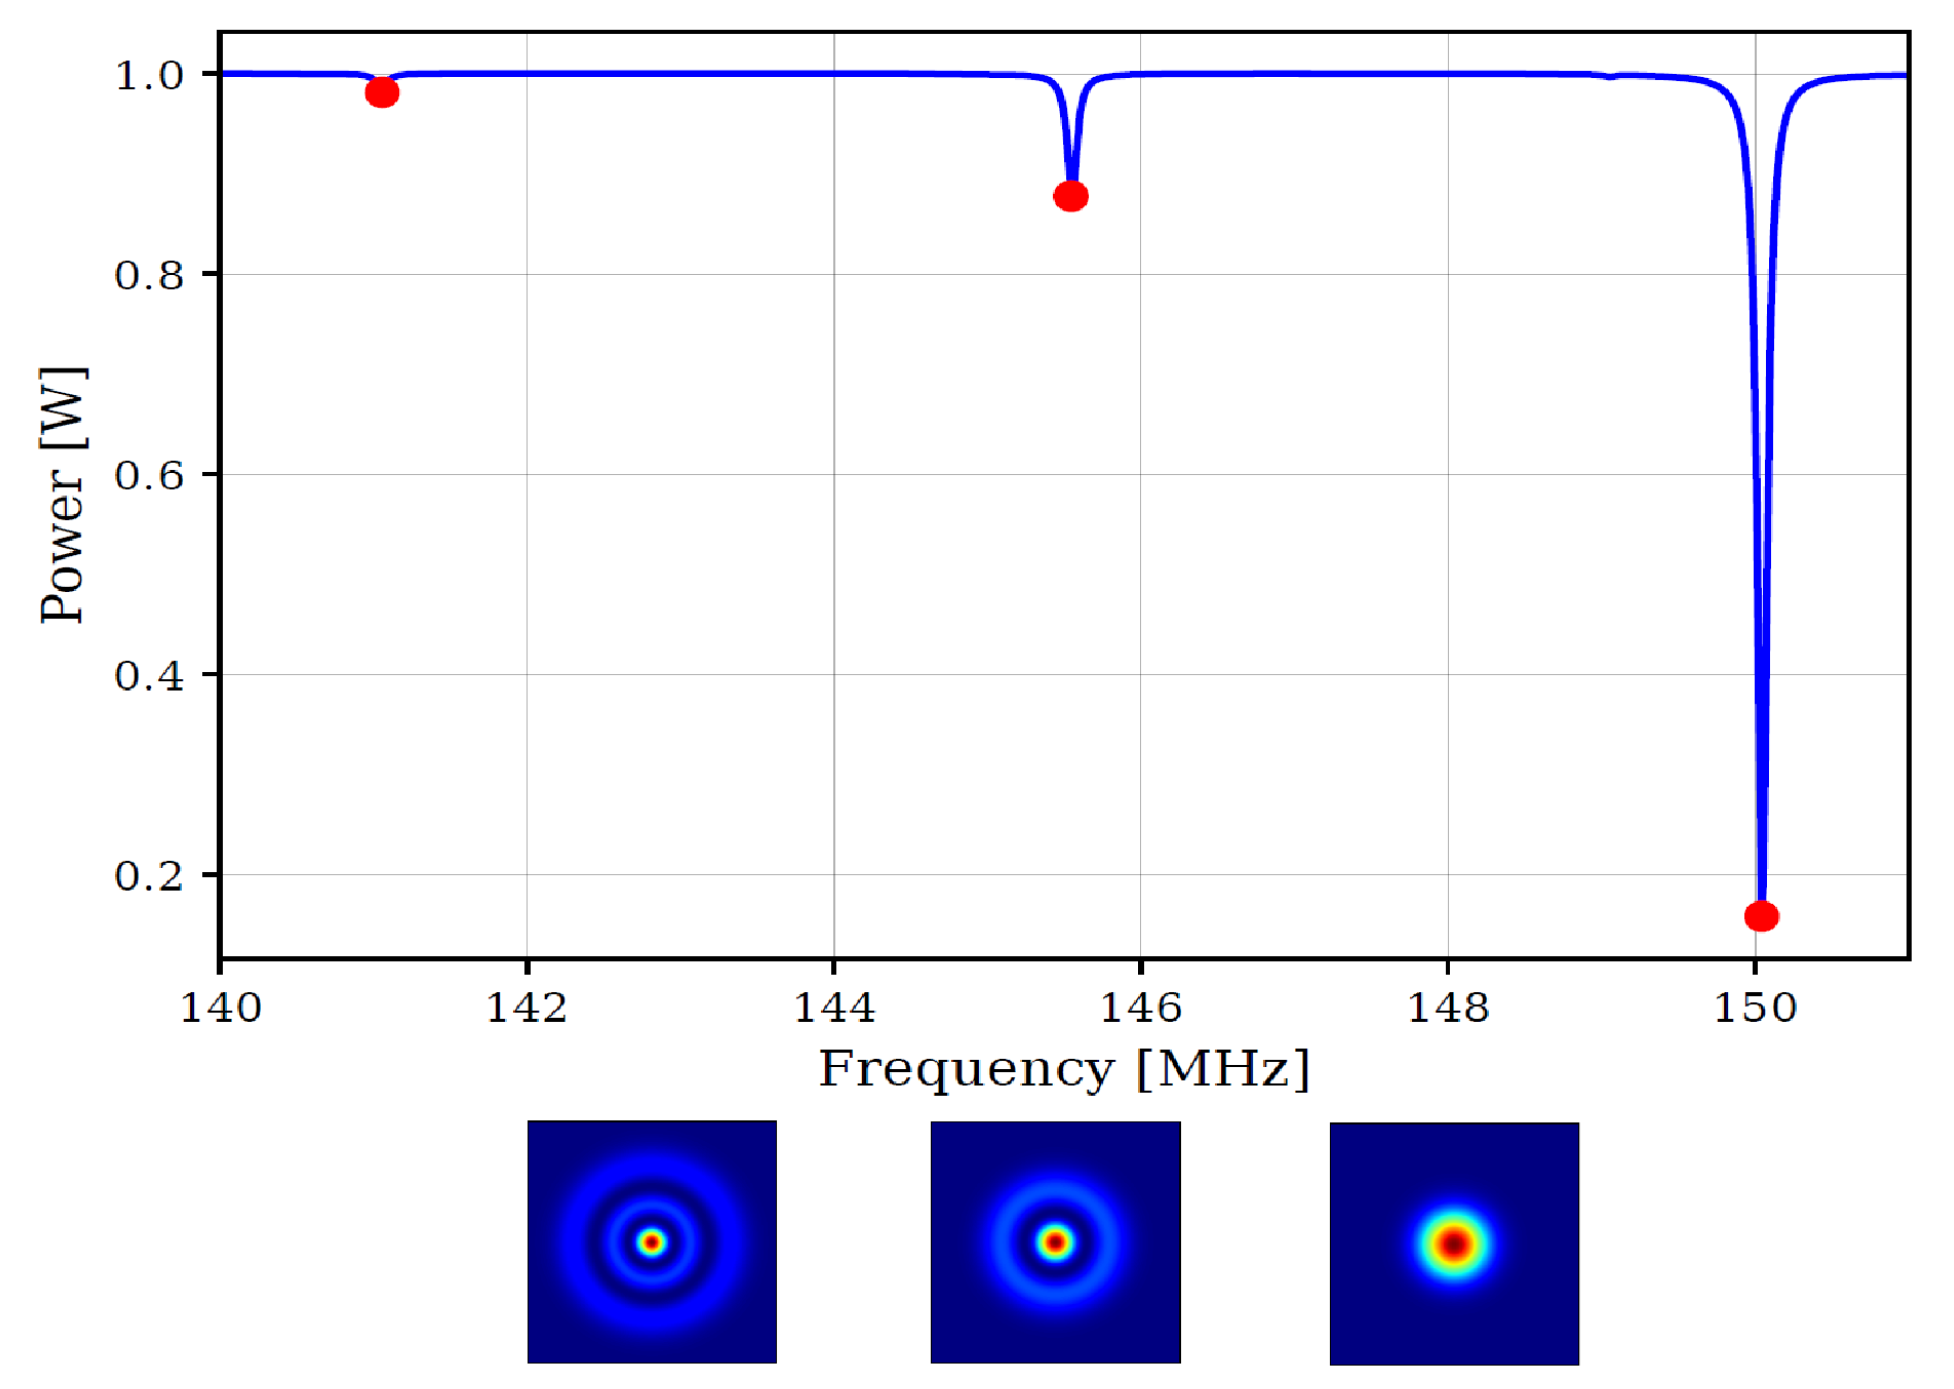
To verify whether mirror surface imperfections caused the observed mode splitting, we performed a controlled simulation by removing the measured mirror map from the EM and equalizing the curvature radii in all directions. As shown in Figure 3, this modification completely eliminated the mode separation phenomenon, all fourth-order modes merged into a single peak at 141 MHz, while the second-order modes coalesced at 145.5 MHz. These results confirm that mirror defects constitute the primary cause of higher-order mode splitting, as orthogonal modes in an ideal spherical cavity maintain identical phase accumulation due to perfect symmetry.
The beam profiles of both second- and fourth-order modes degenerated into rotationally symmetric Laguerre–Gauss patterns after removing surface imperfections. This transformation demonstrates the destructive effect of mirror defects on the symmetry of the mode. It also indicates that under ideal conditions, NUCs are possible to suppress higher-order mode excitation through proper mode matching techniques. The comparative results between Figure 2 and Figure 3 provide direct evidence that mirror surface imperfections, rather than intrinsic cavity properties, drive the observed higher-order mode resonances splitting in near-unstable configurations.
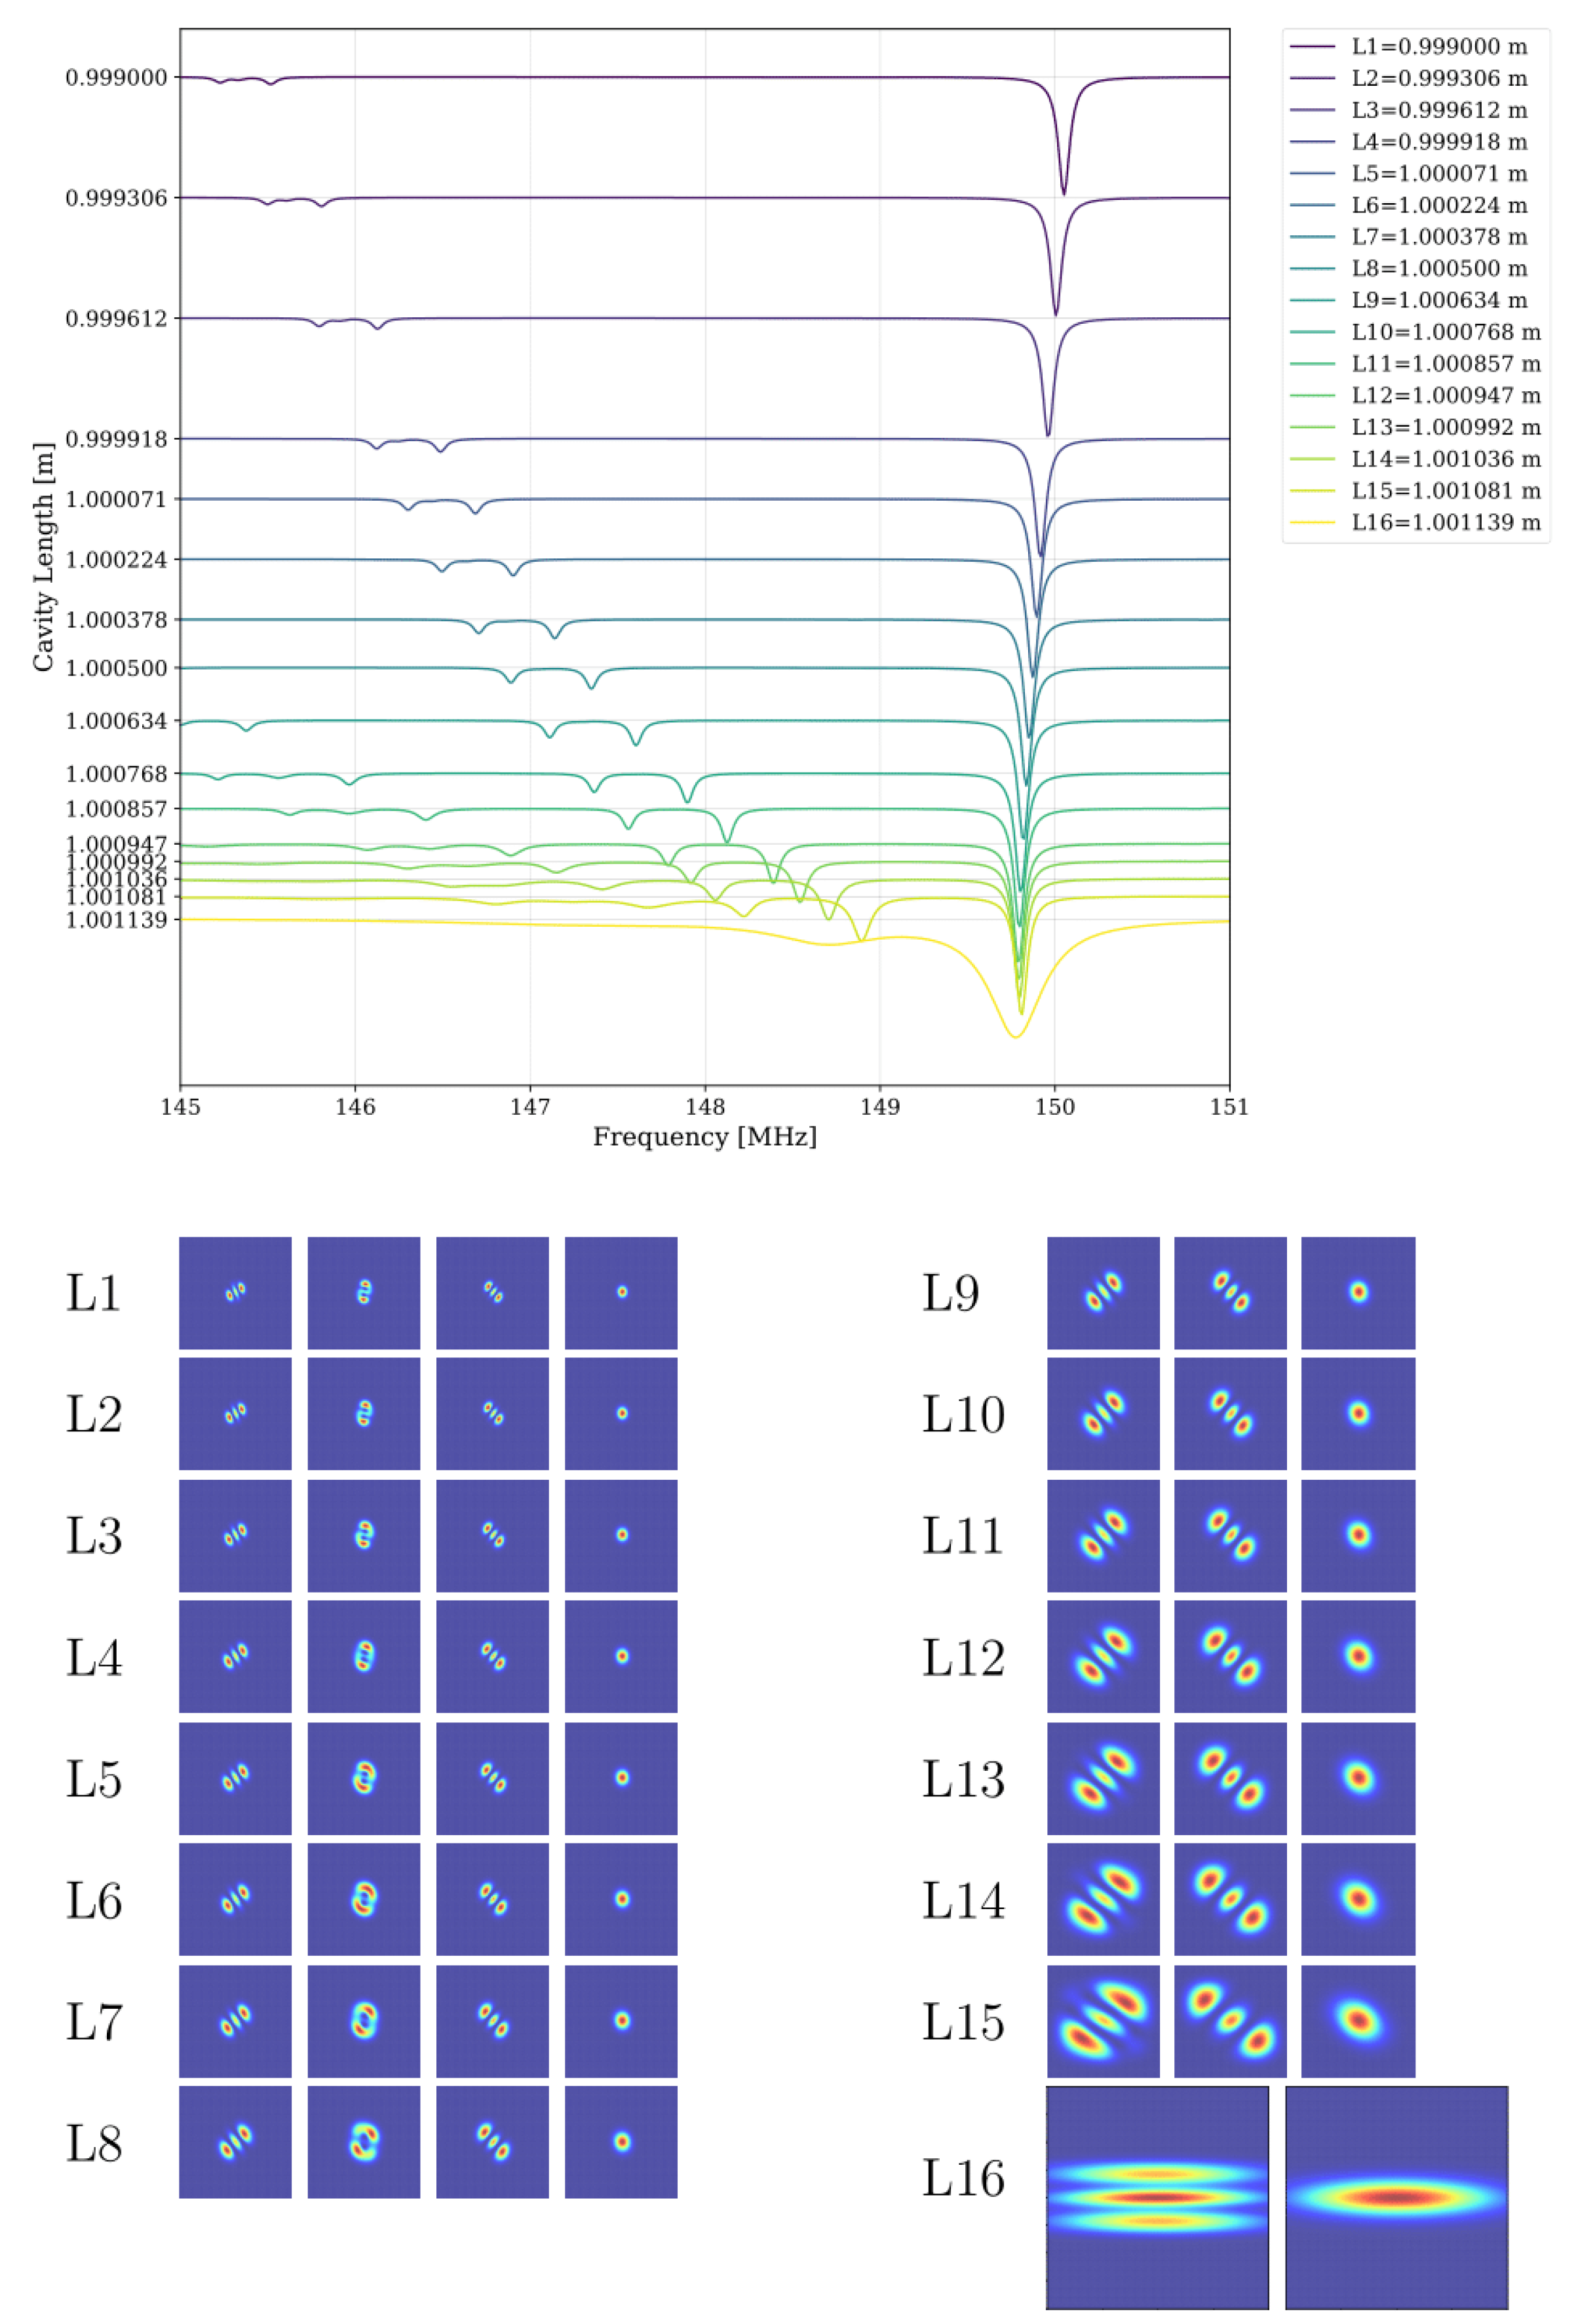
In order to investigate the behavior of our NUC model as it approached the stability boundary, we progressively increase the cavity length from L = 0.999 m to L = 1.001139 m (The maximum length that Finesse can simulate before the cavity becomes unstable). The top figure in Figure 4 presents the simulated evolution of resonance frequencies and amplitudes for fundamental and higher-order modes as the cavity’s g-factor approached zero, corresponding to significantly reduced geometric stability. The resonant peak near the right side represents the HG 00 mode, while the two relatively distinct peaks on the left correspond to the HG 20 and HG 02 modes, respectively. As the cavity length increases, more tiny formant peaks appear on the left side of the graph line, indicating that more high-order modes are gradually moving towards the fundamental mode. The fundamental mode demonstrates a gradual leftward frequency shift with increasing cavity length, though this shift becomes markedly nonlinear near the instability boundary. This nonlinear behavior might be due to the coupling of higher-order modes at critical stability. At this point, the fundamental mode is no longer a pure fundamental mode, and its changes no longer follow the previous trend.
As the cavity length increases, the frequency splitting between the HG 20 and HG 02 modes shows an increasing trend. In the region at L = 0.999 m, their separation is approximately 0.28 MHz, while at L = 1.001036 m, the separation expands to 0.35 MHz. This enhanced frequency splitting originates from the differential impact of mirror asymmetry on the phase accumulation of orthogonal modes. In the near-unstable region, the beam becomes more sensitive to mirror curvature variations, causing HG 20 and HG 02 to experience different Gouy phase delays, thereby widening their frequency separation.
In the bottom figure of Figure 4, we present the evolution of beam profiles at the end mirror across the sixteen cavity length configurations, with the left column showing the first eight configurations from L = 0.999 m to L = 1.0005 m ( L 1 to L 8 ) and the right column displaying the remaining configurations up to L = 1.001139 m ( L 9 to L 16 ). The images reveal a progressive beam size expansion that accelerates markedly as the cavity approaches instability, particularly evident in the final two configurations where a minimal 60 μ m cavity length increase (from L = 1.001081 m to L = 1.001139 m) produces a doubling of the spot size. For consistent visualization, all beam profiles ( L 1 to L 15 ) maintain a uniform scale of [−200 w 0 , 200 w 0 ], while L 16 adopts an expanded [−400 w 0 , 400 w 0 ] range to accommodate its significantly larger mode structure, as specified in Figure 4. This dramatic nonlinear growth directly correlates with the cavity’s approach to the stability boundary, quantitatively demonstrating the theoretical prediction of beam size divergence near instability.
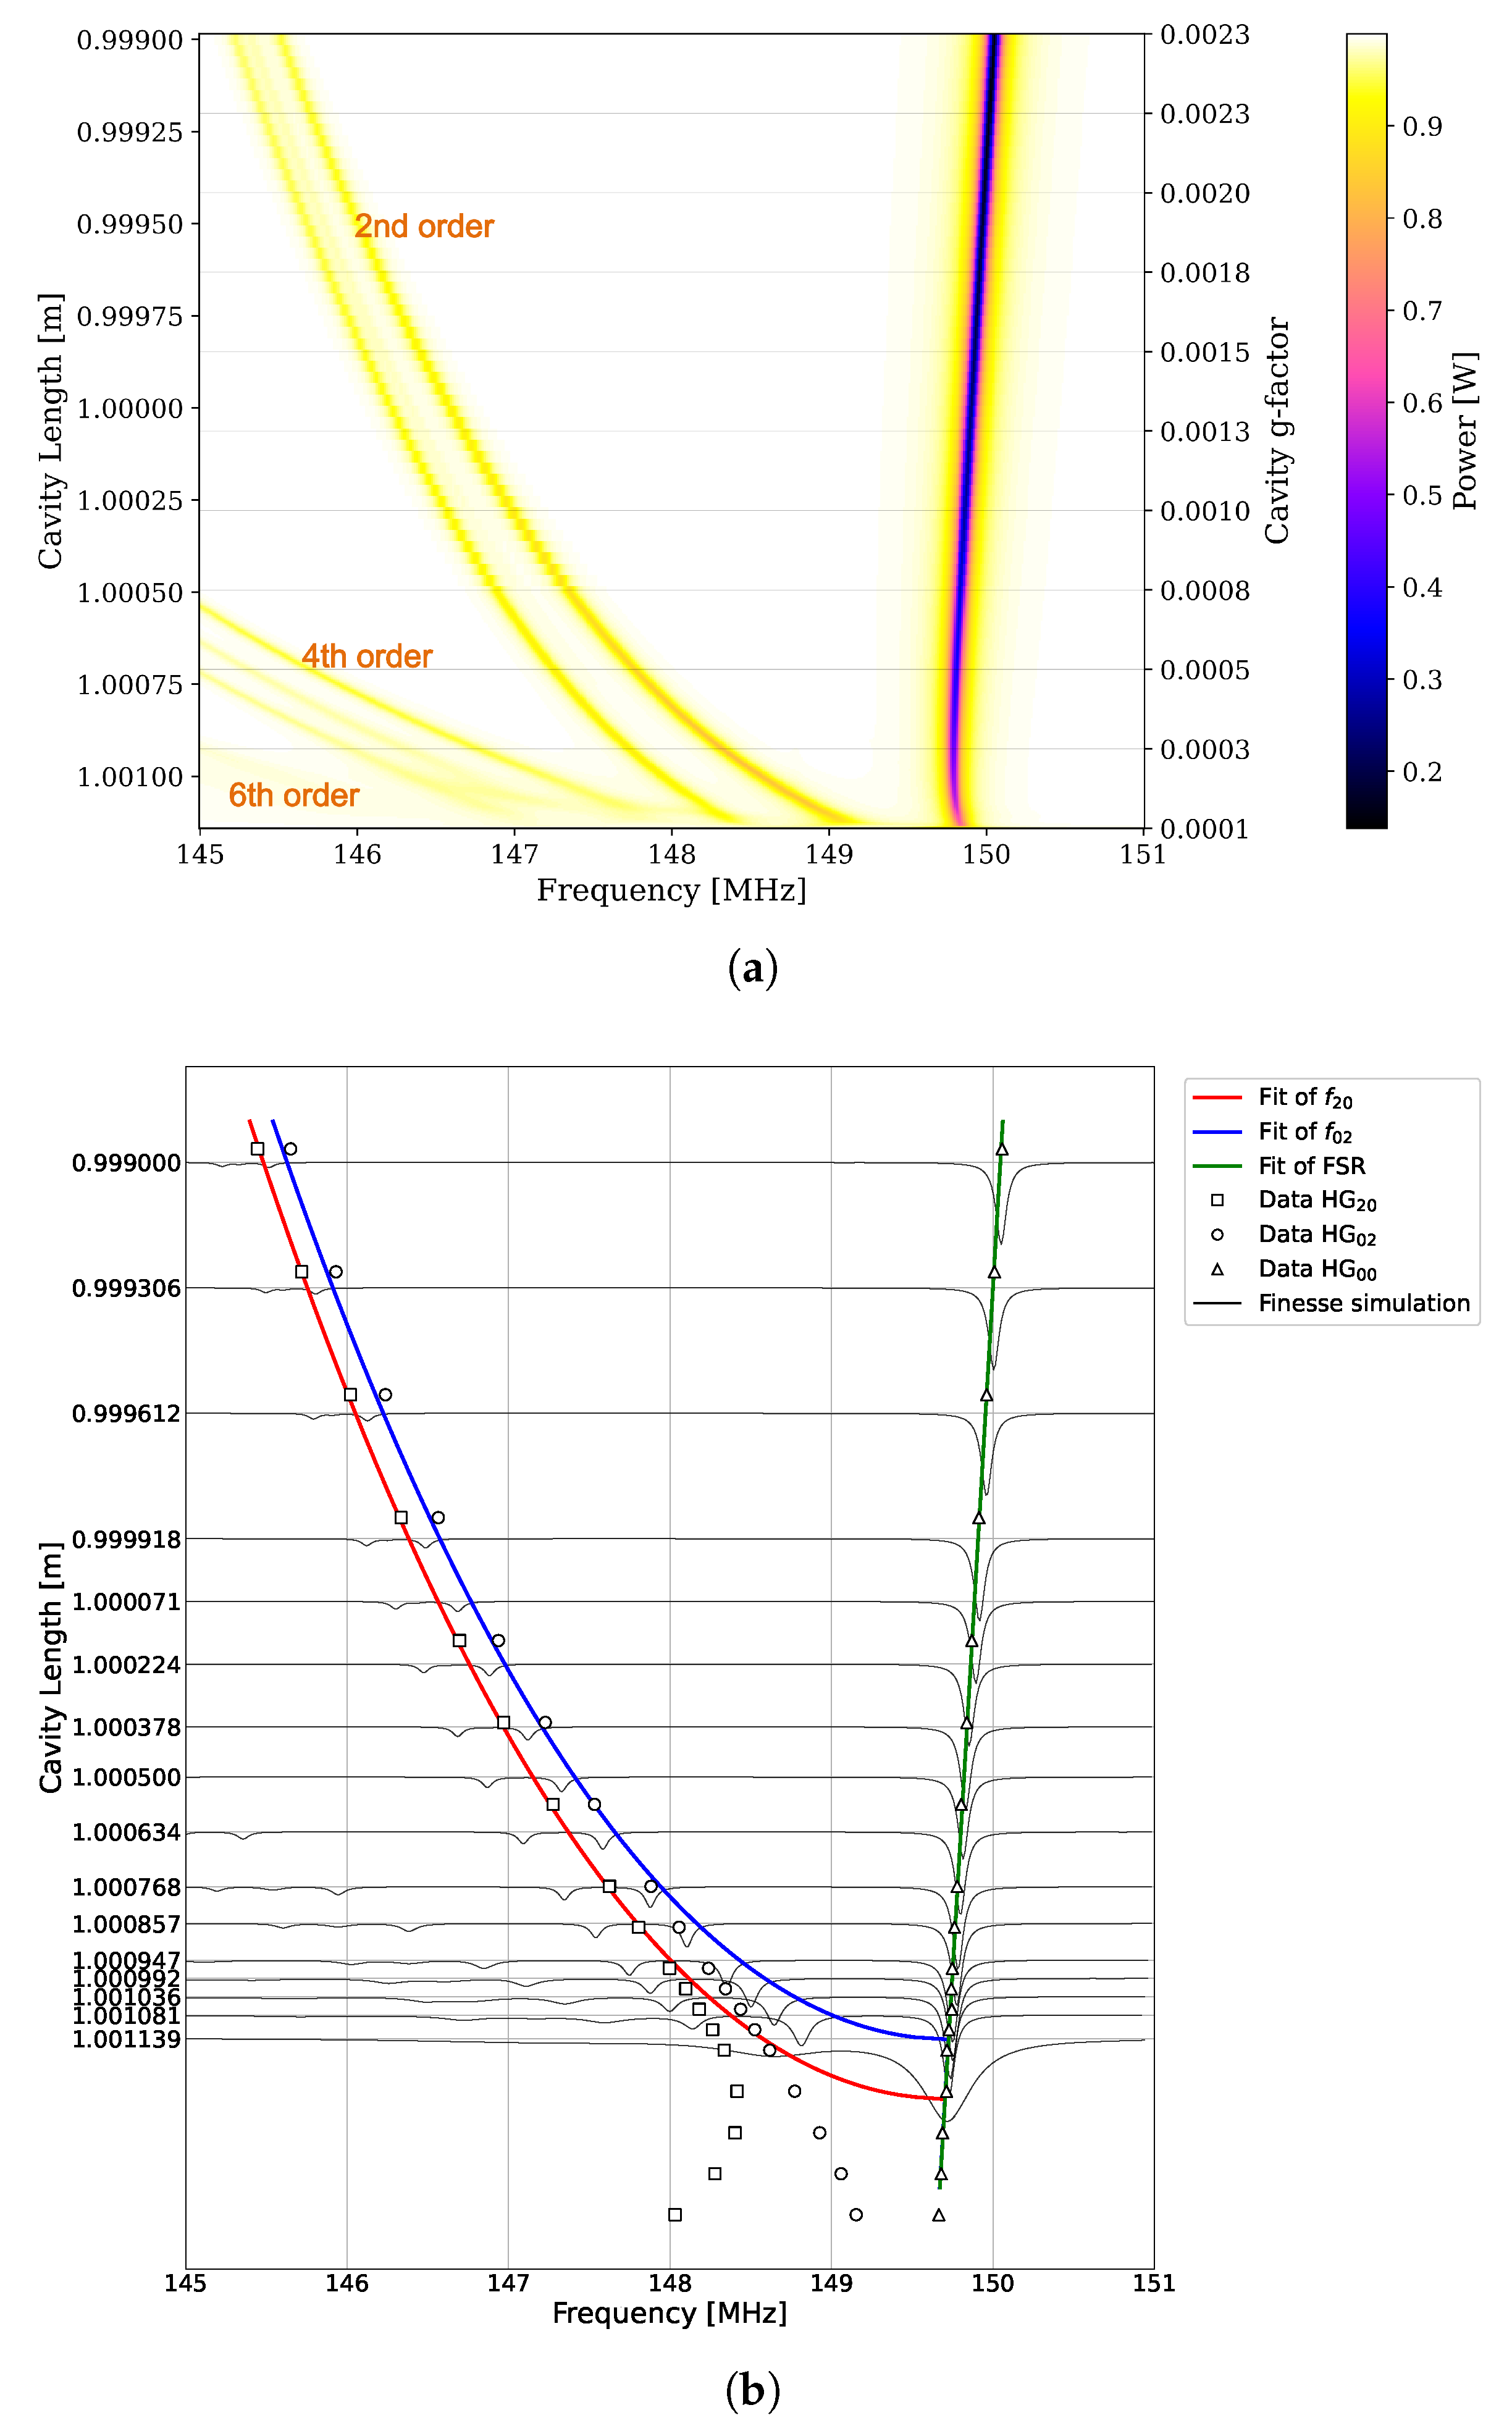
In Figure 5a, we present the resonance simulation results under different cavity lengths and g-factor corresponding to each cavity. We observed the mode bunching phenomenon in the critical stable region in this figure. The higher-order modes progressively converge in frequency with the fundamental mode as cavity approaches geometric instability, which leads to a decrease in the purity of the fundamental mode. Figure 5b gives a comprehensive comparison between experimental measurements and Finesse simulations of resonance frequency evolution as the cavity approaches instability. The measured data from Wang et al. [27] (shown as discrete points) and theoretical fits (colored lines) for both fundamental and second-order modes demonstrate excellent agreement in the stable regime (cavity lengths below 1.0005 m). The resonant frequency of the fundamental mode, shown in Figure 5a, exhibits nonlinear behavior as the cavity approaches instability. However, experimental measurements display a linear trend. This discrepancy arises because the Pound–Drever–Hall technique, used for cavity locking, introduces a shift in the error signal due to the overlap between higher-order modes and the fundamental mode. To enable a meaningful comparison between the simulation and the measured data, the modeled resonance frequencies of the fundamental mode in Figure 5b are calibrated by subtracting the frequency spacing between two adjacent fundamental modes (one near 150 MHz and the other near 0 Hz). After this calibration, the simulated resonance behavior of the fundamental mode becomes linear, aligning with the measurement results. The resonant frequencies of the second-order modes are also calibrated by subtracting their values from the resonant frequency of the fundamental mode near 0 Hz.
As shown in Figure 5b, there are noticeable differences between the simulated and measured resonant frequencies of the second-order modes. This discrepancy arises because the mirror map used in the simulation was obtained prior to coating. In practice, the mirror curvature can change after coating and installation into the mirror mount. From Equation (8), the resonant frequency of a second-order mode is given by
f 2 = FSR π · arccos 1 2 L R 2 .
Assuming a small deviation in mirror curvature, where L R 2 1 m, δ R < 10 3 m R 2 and R 2 L δ R 2 , the expression becomes
f 2 = FSR π · arccos 1 2 L R 2 + δ R FSR π · 1 2 R 2 L R 2 δ R 2 R 2 ( R 2 L ) .
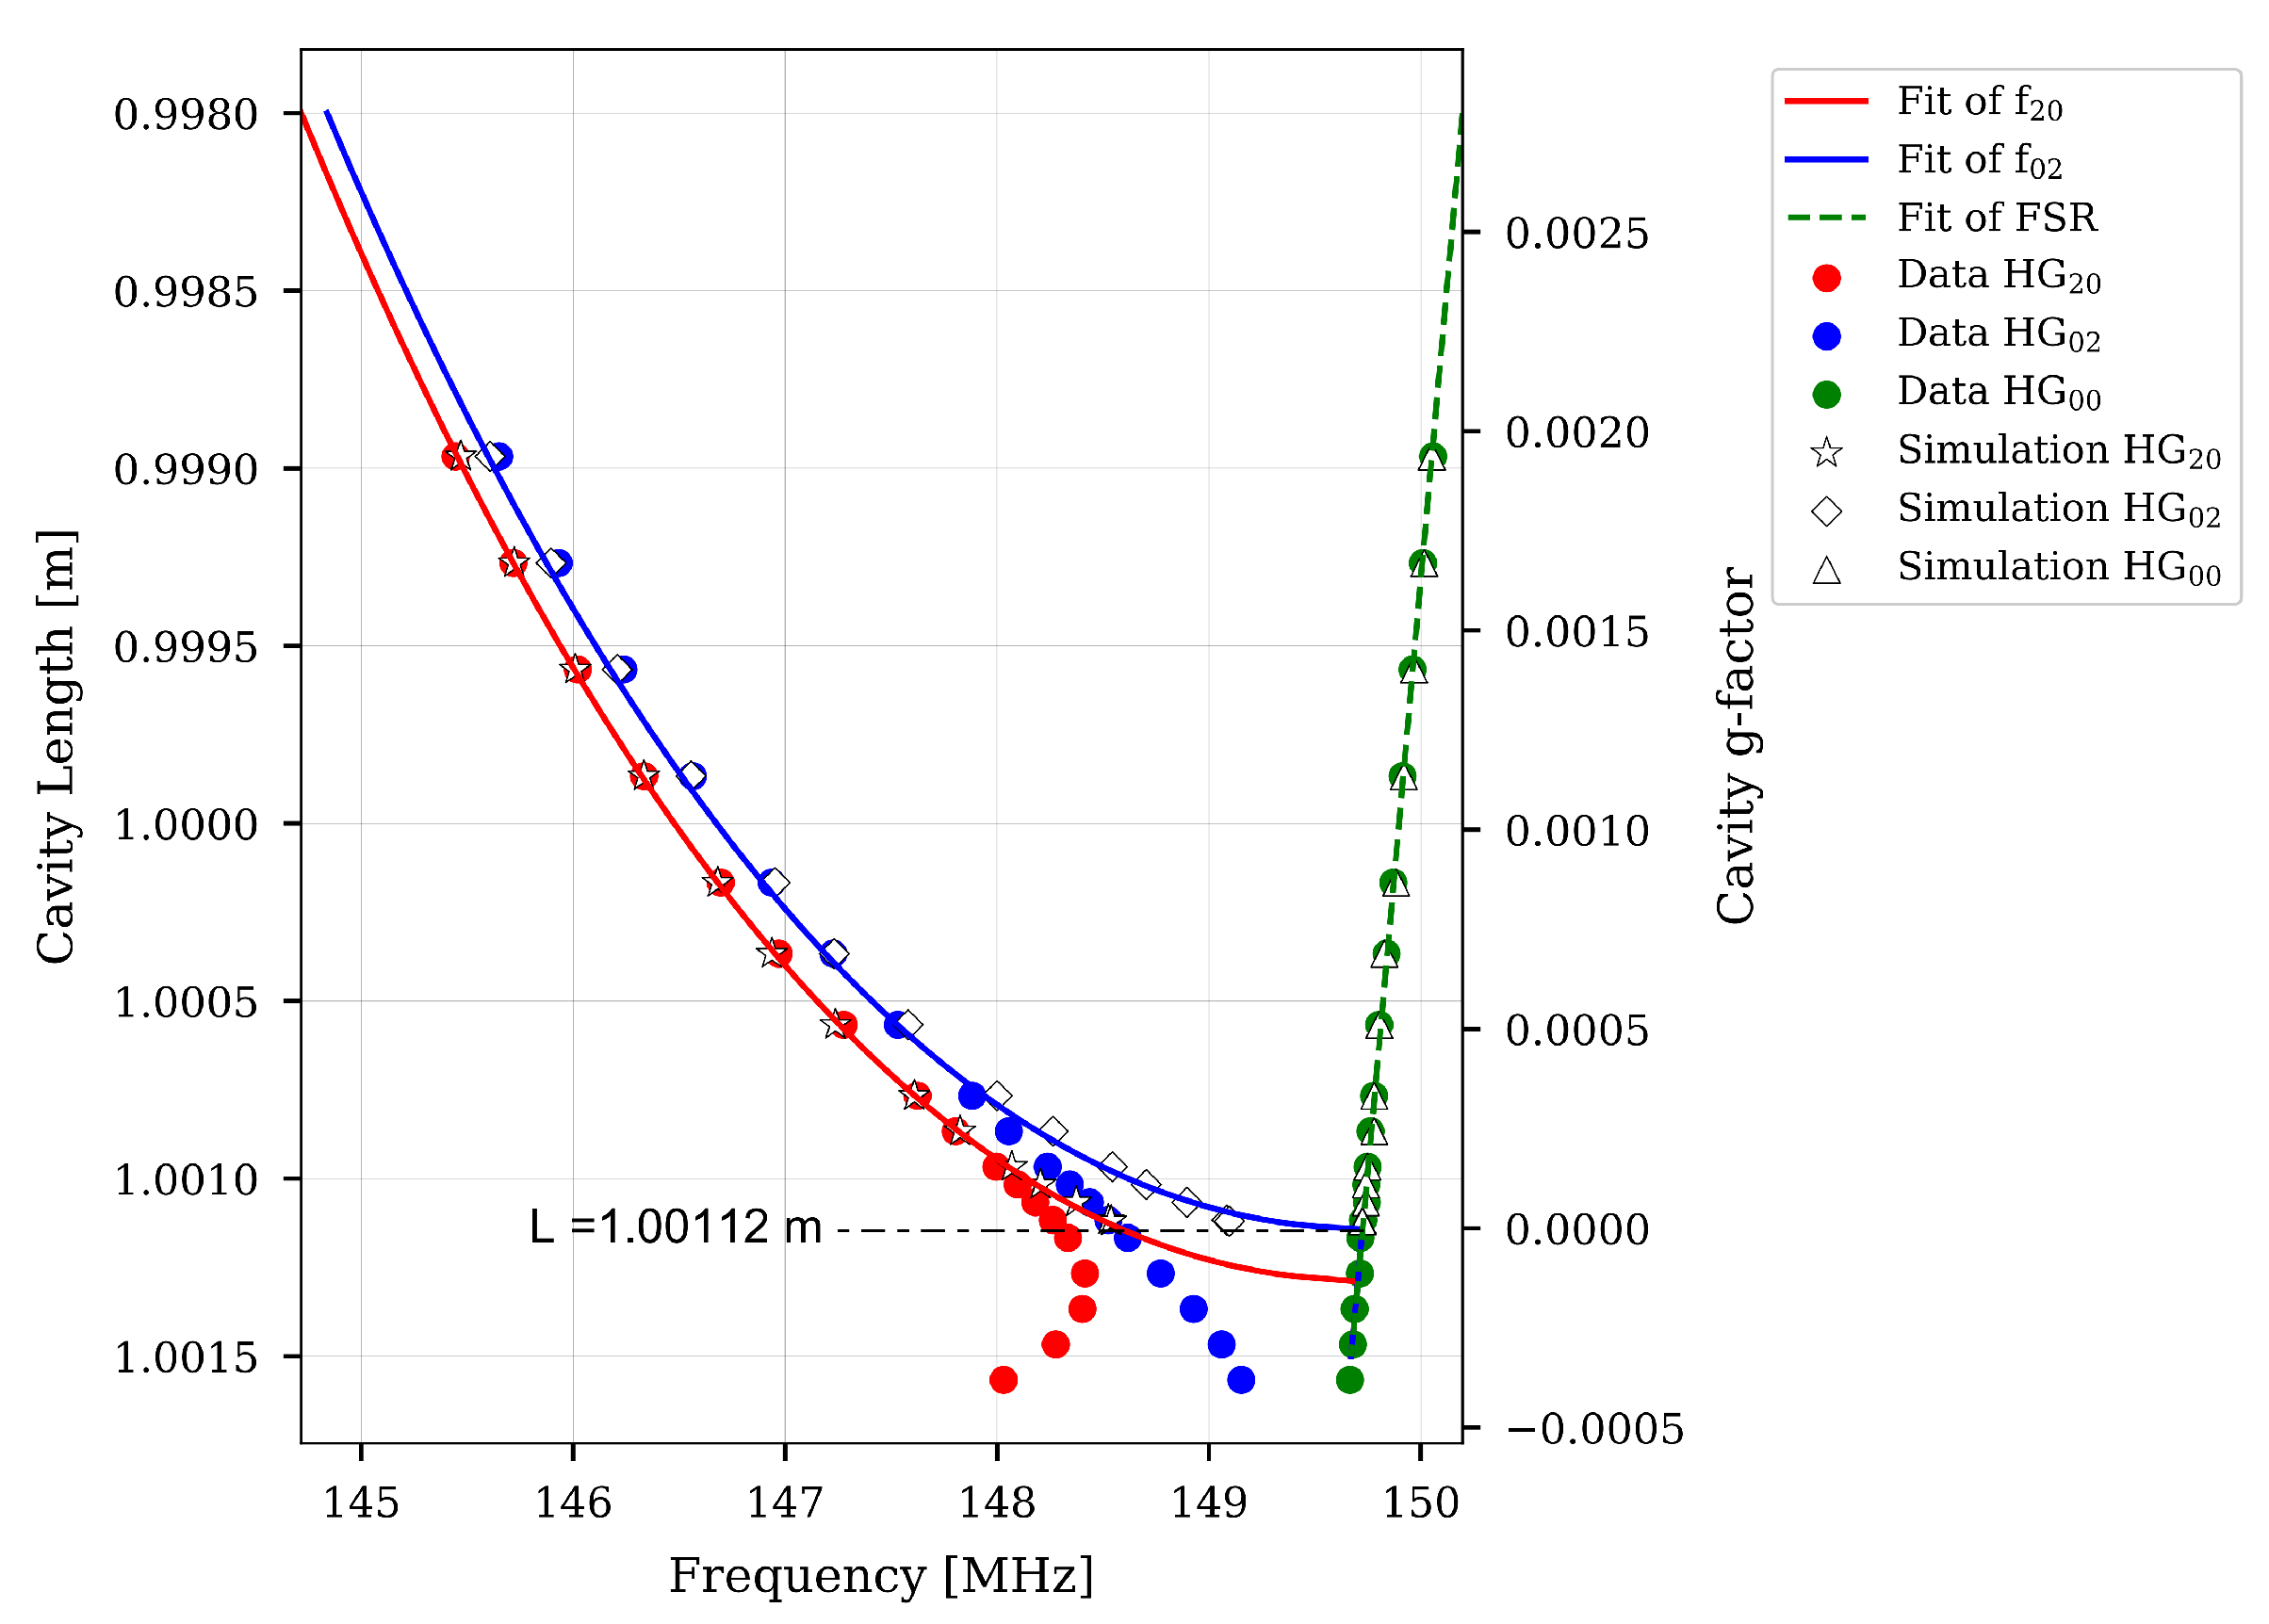
This shows that a small change in mirror curvature leads to a measurable shift in the resonant frequencies. In a plano-concave cavity, such offsets can be effectively corrected by applying appropriate frequency shifts to the resonances of each mode. Figure 6 presents the comprehensive comparison between these calibrated simulations, experimental measurements, and theoretical predictions. The simulated resonant frequencies are adjusted by applying a fixed offset to align them with the measured resonance frequencies in the stable region. To enable more intuitive comparison between simulation and experimental results, in Figure 6 we performed simulations at precisely matched cavity lengths corresponding to each experimental configuration, with the maximum simulated cavity length reaching L = 1.00112 m. The plot demonstrates excellent three-way agreement in stable operating regimes (L < 1.0005 m), where the simulated HG 20 and HG 02 modes (white markers) precisely track both experimental data (colored dots) and fitting (colored lines) for all three observables. As the cavity approaches instability (1.0008 m < L < 1.00112 m), the experimental resonances of second-order modes begin deviating from fitting predictions due to higher-order mode coupling effects, while the simulations maintain alignment with the idealized fitting curves.
In the stable region, the behavior of second-order modes is primarily influenced by astigmatism in the mirror curvature. The Finesse simulation results demonstrate excellent agreement with both theoretical predictions and experimental measurements in stable operating regimes, particularly for the HG 00 mode resonance frequencies that closely follow the expected free spectral range (FSR) fitting results. This correspondence validates the simulation’s reliability for conventional cavity configurations. However, in the near-unstable region where mode bunching occurs, numerous higher-order modes, coupled from the fundamental mode due to local mirror defects, become resonant simultaneously. This overlapping resonance significantly complicates the characterization of individual mode behaviors even with realistic mirror maps.
These systematic comparisons with experimental data from Wang et al. [27] serve two crucial purposes: first, they validate our simulation approach in stable operating regimes, where the simulated HG 20 and HG 02 modes show excellent agreement with measurements. Second, the observed discrepancies near the stability boundary highlight phenomena requiring additional experimental investigation, particularly the effects of post-coating curvature changes noted in Wang et al. [27]. This experimental-simulation synergy provides a robust framework for evaluating near-unstable cavity behavior while identifying areas where modeling assumptions may require refinement.
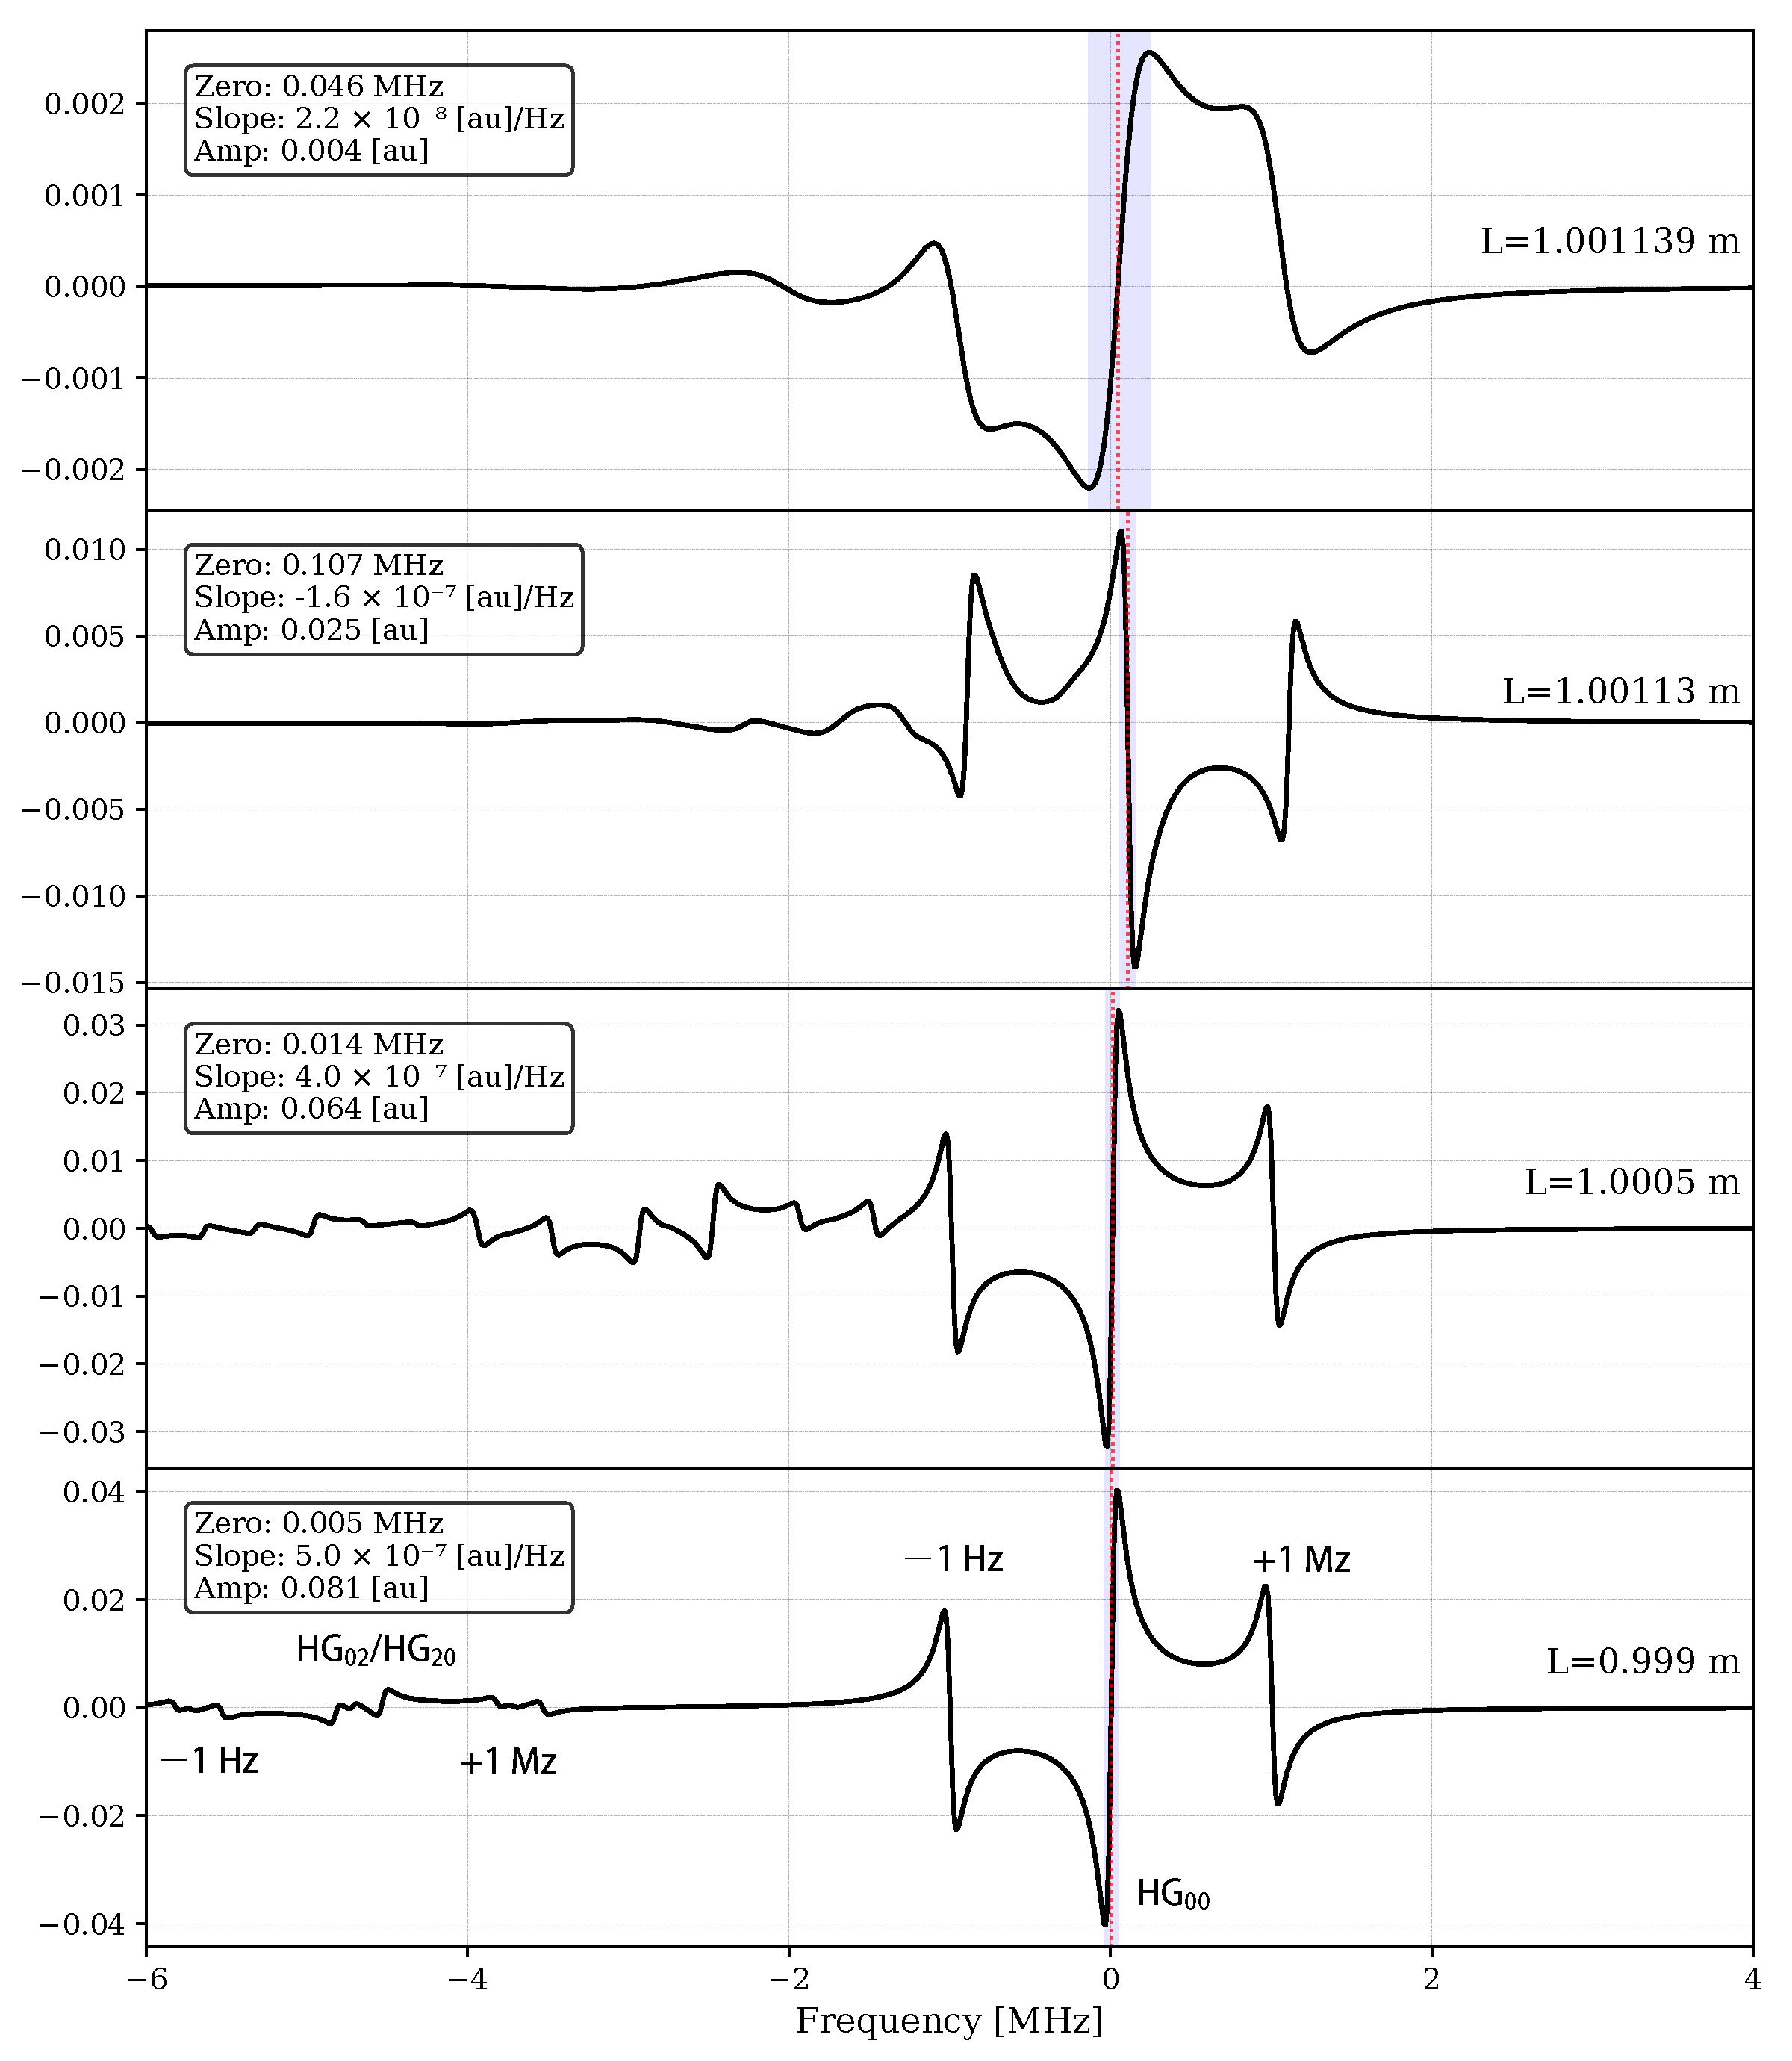
Figure 7 presents the Pound–Drever–Hall error signals simulated by Finesse under different cavity length configurations. Several key evolutionary characteristics are observed as the cavity length increases from the stable regime (L = 0.999 m) towards the simulation boundary (L = 1.001139 m). First, the slope of the fundamental mode error signal (at around 0 MHz) remains clearly distinguishable, demonstrating that near-unstable cavities can still provide feasible feedback control conditions before reaching the instability threshold. Second, the error signals of second-order modes ( HG 20 and HG 02 ) and their 1 MHz modulation sidebands gradually converge toward the fundamental mode as the cavity length increases, showing that overlap begins to emerge when L > 1.00113 m with approximately 0.1 MHz offset introduced to the fundamental mode error signal, confirming that higher-order mode coupling contaminates the frequency-locking reference signal. This observed offset provides a direct explanation for the nonlinear frequency shift of the fundamental mode observed in Figure 5a as the cavity approaches the stability boundary, where progressive contamination from higher-order modes alters the expected resonance behavior. Finally, when the cavity length reaches 1.001139 m, the amplitude of the fundamental mode error signal exhibits over 90% attenuation (from 1.7 × 10 7 [au]/Hz to 1.6 × 10 8 [au]/Hz). Although the linear region of the error signal remains clearly distinguishable at this operating point, the substantial amplitude reduction significantly increases the challenges in control system implementation, particularly in maintaining the required locking stability for precision interferometry.
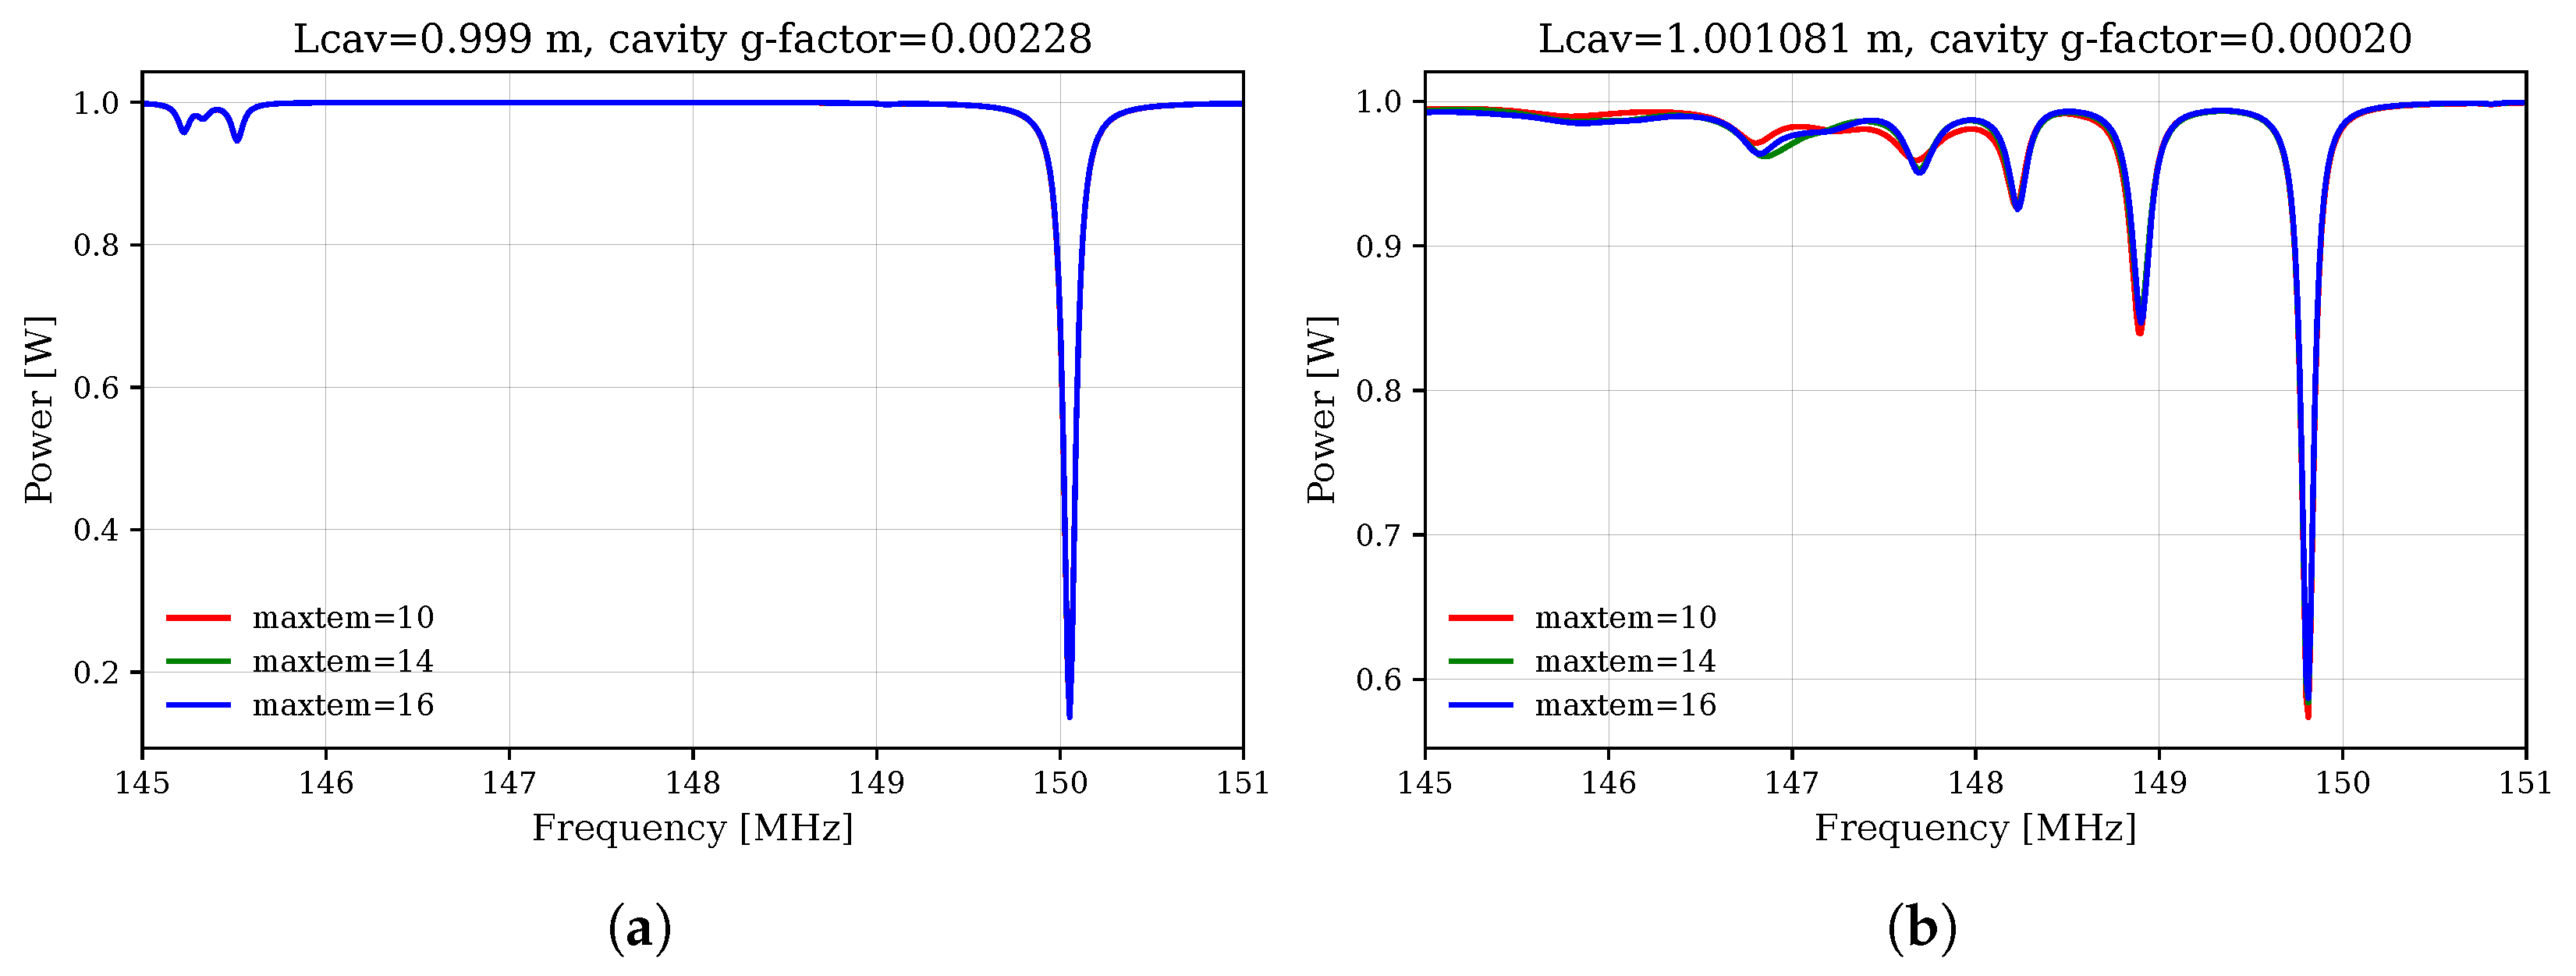
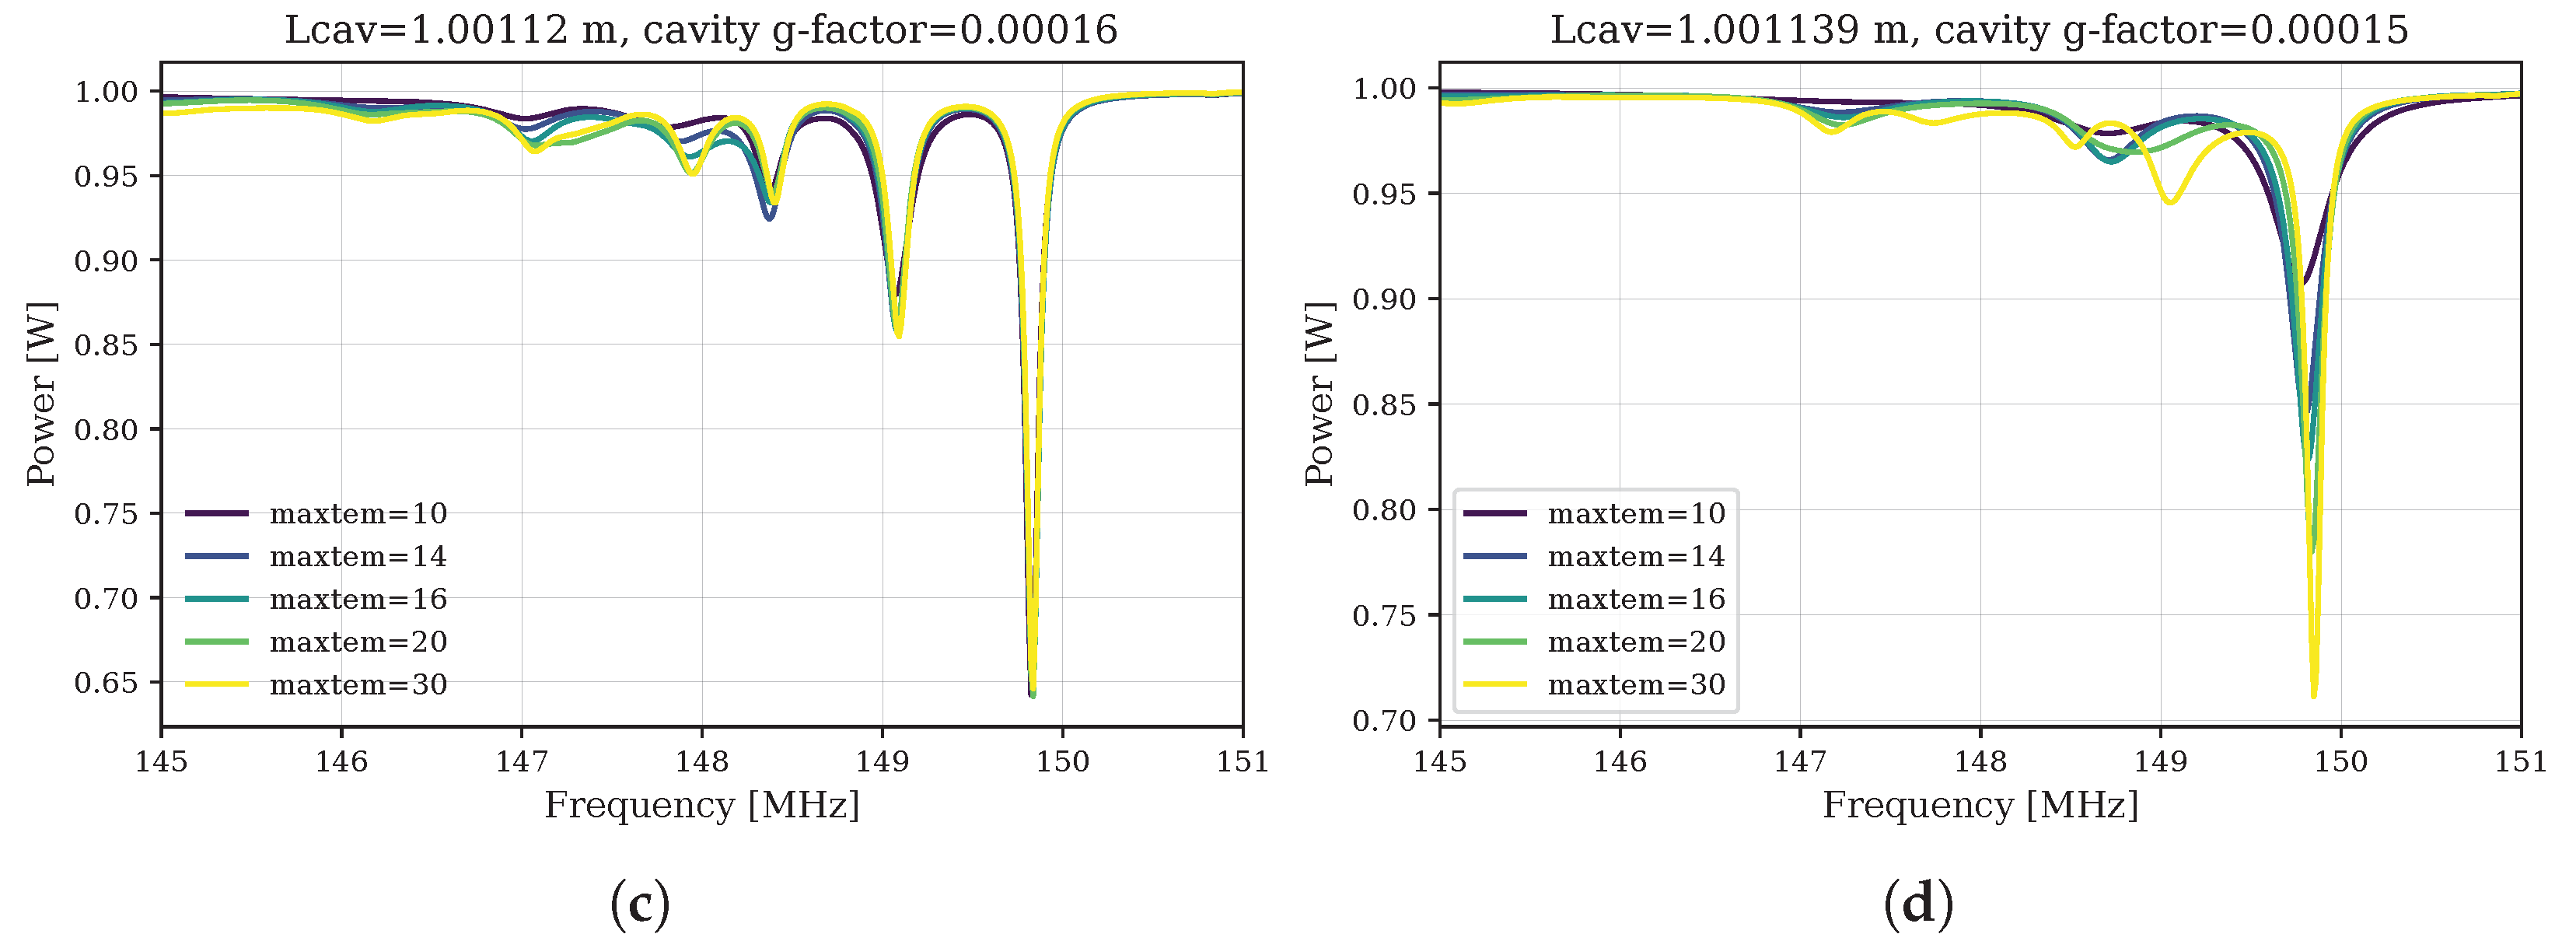
To investigate the influence of the maximum transverse mode order ( m a x t e m ) on NUCs simulations in Finesse, we systematically compare cavity scan results across different m a x t e m settings. Figure 8 presents the comparison of resonance frequencies and amplitudes in a plano-concave cavity simulated with varying m a x t e m as the cavity approaches the stability boundary. In the stable regime (Figure 8a, L = 0.999 m), increasing m a x t e m from 10 to 16 has a negligible impact on the resonance spectrum, confirming that higher-order modes remain effectively decoupled from the fundamental mode when the cavity operates far from instability. However, as the cavity length increases toward the stability boundary (Figure 8b–d), the influence of m a x t e m becomes pronounced. For L = 1.00112 m (g = 0.00016), additional resonance peaks emerge with higher m a x t e m , revealing previously unresolved higher-order modes. This trend intensifies in the near-unstable region ( L 1.00112 m, g 0.00016 ), where elevating m a x t e m from 10 to 30 not only unveils a dense spectrum of higher-order resonances but also demonstrates a progressive reduction in the fundamental mode’s amplitude. This amplitude suppression reflects enhanced energy transfer from the fundamental mode to higher-order modes due to their degeneracy and strong coupling near instability. The results underscore the necessity of including sufficiently high m a x t e m values in Finesse simulations to accurately capture the complex modal interactions in near-unstable cavities, particularly for predicting beam quality and control signal stability in gravitational wave detectors.

4. Conclusions

This study demonstrates the critical role of higher-order mode interactions in NUCs through systematic Finesse simulations incorporating realistic mirror imperfections. Our results reveal that while stable cavities exhibit negligible sensitivity to the m a x t e m , NUCs approaching the stability boundary show pronounced dependence on m a x t e m , with higher values unveiling dense spectra of coupled higher-order modes and significant energy transfer from the fundamental mode. The observed amplitude suppression of the fundamental mode and the emergence of additional resonances underscore the challenges of maintaining beam purity and control signal stability in NUCs. Furthermore, the excellent agreement between simulations and experimental data in stable regimes validates Finesse’s reliability, while discrepancies near instability highlight the need for comprehensive modeling of higher-order modes and mirror defects. While this work focused on plano-concave cavities to enable direct experimental validation, future studies should extend this framework to concentric and folded cavities. In particular, concentric cavities—used in current gravitational wave detectors—exhibit stronger higher-order mode degeneracy, where both odd- and even-order modes couple simultaneously to the fundamental mode. This introduces additional control challenges not present in plano-concave systems, requiring advanced techniques for mode suppression and alignment stabilization. These findings emphasize the trade-offs between thermal noise suppression and operational complexity in NUCs, providing essential insights for optimizing future gravitational wave detector designs. The study underscores the necessity of advanced simulation techniques to mitigate performance degradation in near-unstable configurations, ensuring their viability for next-generation precision interferometry. Future work will also focus on developing quantitative mode identification criteria to better characterize complex coupling effects in near-unstable configurations.

Author Contributions

Conceptualization, M.C., H.W. and A.F.; methodology, M.C. and H.W.; software, M.C., A.F. and D.B.; validation, M.C. and H.W.; formal analysis, M.C. and H.W.; investigation, M.C.; resources, H.W.; data curation, M.C.; writing—original draft preparation, M.C. and H.W.; writing—review and editing, M.C. and H.W.; visualization, M.C.; supervision, H.W., A.F., D.B. and Z.-H.Z.; project administration, H.W. and Z.-H.Z.; funding acquisition, H.W. and Z.-H.Z. All authors have read and agreed to the published version of the manuscript.

Funding

This work was supported by the National Natural Science Foundation of China under Grants Nos. 12021003 and 12433001; the JST ASPIRE Program, Japan Grant Number JPMJAP2320; Australian Research Council Grant Number DE230101035.

Data Availability Statement

The data supporting this study’s findings are available within the article.

Conflicts of Interest

The authors declare no conflicts of interest.

References

  1. Sathyaprakash, B.S.; Schutz, B.F. Physics, Astrophysics and Cosmology with Gravitational Waves. Living Rev. Rel. 2009, 12, 2. [Google Scholar] [CrossRef] [PubMed]
  2. Abbott, B.P.; Abbott, R.; Abbott, T.D.; Abernathy, M.R.; Acernese, F.; Ackley, K.; Adams, C.; Adams, T.; Addesso, P.; Adhikari, R.X.; et al. Tests of general relativity with GW150914. Phys. Rev. Lett. 2016, 116, 221101, Erratum in: Phys. Rev. Lett. 2018, 121, 129902. [Google Scholar] [CrossRef] [PubMed]
  3. Abbott, B.P.; Abbott, R.; Abbott, T.; Acernese, F.; Ackley, K.; Adams, C.; Adams, T.; Addesso, P.; Adhikari, R.X.; Adya, V.B.; et al. GW170817: Observation of Gravitational Waves from a Binary Neutron Star Inspiral. Phys. Rev. Lett. 2017, 119, 161101. [Google Scholar] [CrossRef] [PubMed]
  4. Winkler, W.; Danzmann, K.; Ruediger, A.; Schilling, R. Heating by optical absorption and the performance of interferometric gravitational wave detectors. Phys. Rev. A 1991, 44, 7022–7036. [Google Scholar] [CrossRef]
  5. Aasi, J.; Abbott, B.P.; Abbott, R.; Abbott, T.; Abernathy, M.R.; Ackley, K.; Adams, C.; Adams, T.; Addesso, P.; Adhikari, R.X.; et al. Advanced LIGO. Class. Quant. Grav. 2015, 32, 074001. [Google Scholar] [CrossRef]
  6. Acernese, F.; Agathos, M.; Agatsuma, K.; Aisa, D.; Allem, N.; Allocca, A.; Amarni, J.; Astone, P.; Balestri, G.; Ballardin, G.; et al. Advanced Virgo: A second-generation interferometric gravitational wave detector. Class. Quant. Grav. 2015, 32, 024001. [Google Scholar] [CrossRef]
  7. Harry, G.M.; Gretarsson, A.M.; Saulson, P.R.; Kittelberger, S.E.; Penn, S.D.; Startin, W.J.; Rowan, S.; Fejer, M.M.; Crooks, D.R.M.; Cagnoli, G.; et al. Thermal noise in interferometric gravitational wave detectors due to dielectric optical coatings. Class. Quant. Grav. 2002, 19, 897–918. [Google Scholar] [CrossRef]
  8. Rowan, S.; Hough, J.; Crooks, D.R.M. Thermal noise and material issues for gravitational wave detectors. Phys. Lett. A 2005, 347, 25–32. [Google Scholar] [CrossRef]
  9. Hild, S. Future Interferometers. In LIGO Document G1000715; LIGO Scientific Collaboration: Hanford, WA, USA, 2010. [Google Scholar]
  10. Hild, S. LIGO-3 Overview. In LIGO Document G1300577; LIGO Scientific Collaboration: Hanford, WA, USA, 2013. [Google Scholar]
  11. Bertet, P.; Osnaghi, S.; Rauschenbeutel, A.; Nogues, G.; Auffeves, A.; Brune, M.; Raimond, J.; Haroche, S. A complementarity experiment with an interferometer at the quantum–classical boundary. Nature 2001, 411, 166–170. [Google Scholar] [CrossRef]
  12. Durak, K.; Nguyen, C.H.; Leong, V.; Straupe, S.; Kurtsiefer, C. Diffraction-limited Fabry–Perot cavity in the near concentric regime. New J. Phys. 2014, 16, 103002. [Google Scholar] [CrossRef]
  13. Álvarez, M.D. Fundamental limitations of cavity-assisted atom interferometry. In Optical Cavities for Optical Atomic Clocks, Atom Interferometry and Gravitational-Wave Detection; Springer: Berlin/Heidelberg, Germany, 2019; pp. 141–155. [Google Scholar]
  14. Nguyen, C.H.; Utama, A.N.; Lewty, N.; Kurtsiefer, C. Operating a near-concentric cavity at the last stable resonance. Phys. Rev. A 2018, 98, 063833. [Google Scholar] [CrossRef]
  15. Pal, R.; Yadav, V.; Sharma, A. Transportable optical cavity systems for terrestrial and space-borne portable optical atomic clocks. Front. Quantum Sci. Technol. 2024, 3, 1438345. [Google Scholar] [CrossRef]
  16. Liu, J.; Liu, J.; Li, Z.; Yu, P.; Zhang, G. Stabilization of transverse modes for a high finesse near-unstable cavity. Appl. Sci. 2019, 9, 4580. [Google Scholar] [CrossRef]
  17. Siegman, A.E. Unstable optical resonators for laser applications. Proc. IEEE 1965, 53, 277–287. [Google Scholar] [CrossRef]
  18. Siegman, A. Unstable optical resonators. Appl. Opt. 1974, 13, 353–367. [Google Scholar] [CrossRef]
  19. Siegman, A.; Arrathoon, R. Modes in unstable optical resonators and lens waveguides. IEEE J. Quantum Electron. 1967, 3, 156–163. [Google Scholar] [CrossRef]
  20. Karman, G.; McDonald, G.; New, G.; Woerdman, J. Fractal modes in unstable resonators. Nature 1999, 402, 138. [Google Scholar] [CrossRef]
  21. Brown, D.D.; Rowlinson, S.; Leavey, S.; Jones, P.; Freise, A. Finesse 3. 2020. Available online: https://finesse.ifosim.org/ (accessed on 25 March 2025).
  22. Harry, G.M. Advanced LIGO: The next generation of gravitational wave detectors. Class. Quantum Gravity 2010, 27, 084006. [Google Scholar] [CrossRef]
  23. Acernese, F.; Adams, T.; Agathos, M.; Agatsuma, K.; Allocca, A.; Astone, P.; Ballardin, G.; Barone, F.; Barsuglia, M.; Basti, A.; et al. The Advanced Virgo detector. J. Physics Conf. Ser. 2015, 610, 012014. [Google Scholar] [CrossRef]
  24. Akutsu, T.; Ando, M.; Araya, A.; Aritomi, N.; Asada, H.; Aso, Y.; Atsuta, S.; Awai, K.; Barton, M.A.; Cannon, K.; et al. The status of KAGRA underground cryogenic gravitational wave telescope. J. Physics Conf. Ser. 2020, 1342, 012014. [Google Scholar] [CrossRef]
  25. Somiya, K. Detector configuration of KAGRA - the Japanese cryogenic gravitational-wave detector. Class. Quantum Gravity 2011, 29, 124007–124018. [Google Scholar] [CrossRef]
  26. Punturo, M.; Abernathy, M.; Acernese, F.; Allen, B.; Andersson, N.; Arun, K.; Barone, F.; Barr, B.; Barsuglia, M.; Beker, M.; et al. The Einstein Telescope: A third-generation gravitational wave observatory. Class. Quantum Gravity 2010, 27, 194002. [Google Scholar] [CrossRef]
  27. Wang, H.; Dovale-Álvarez, M.; Collins, C.; Brown, D.D.; Wang, M.; Mow-Lowry, C.M.; Han, S.; Freise, A. Feasibility of near-unstable cavities for future gravitational wave detectors. Phys. Rev. D 2018, 97, 022001. [Google Scholar] [CrossRef]
  28. Wang, H. Beware of Warped Surfaces: Near-Unstable Cavities for Future Gravitational Wave Detectors. Ph.D. Thesis, University of Birmingham, Birmingham, UK, 2017. [Google Scholar]
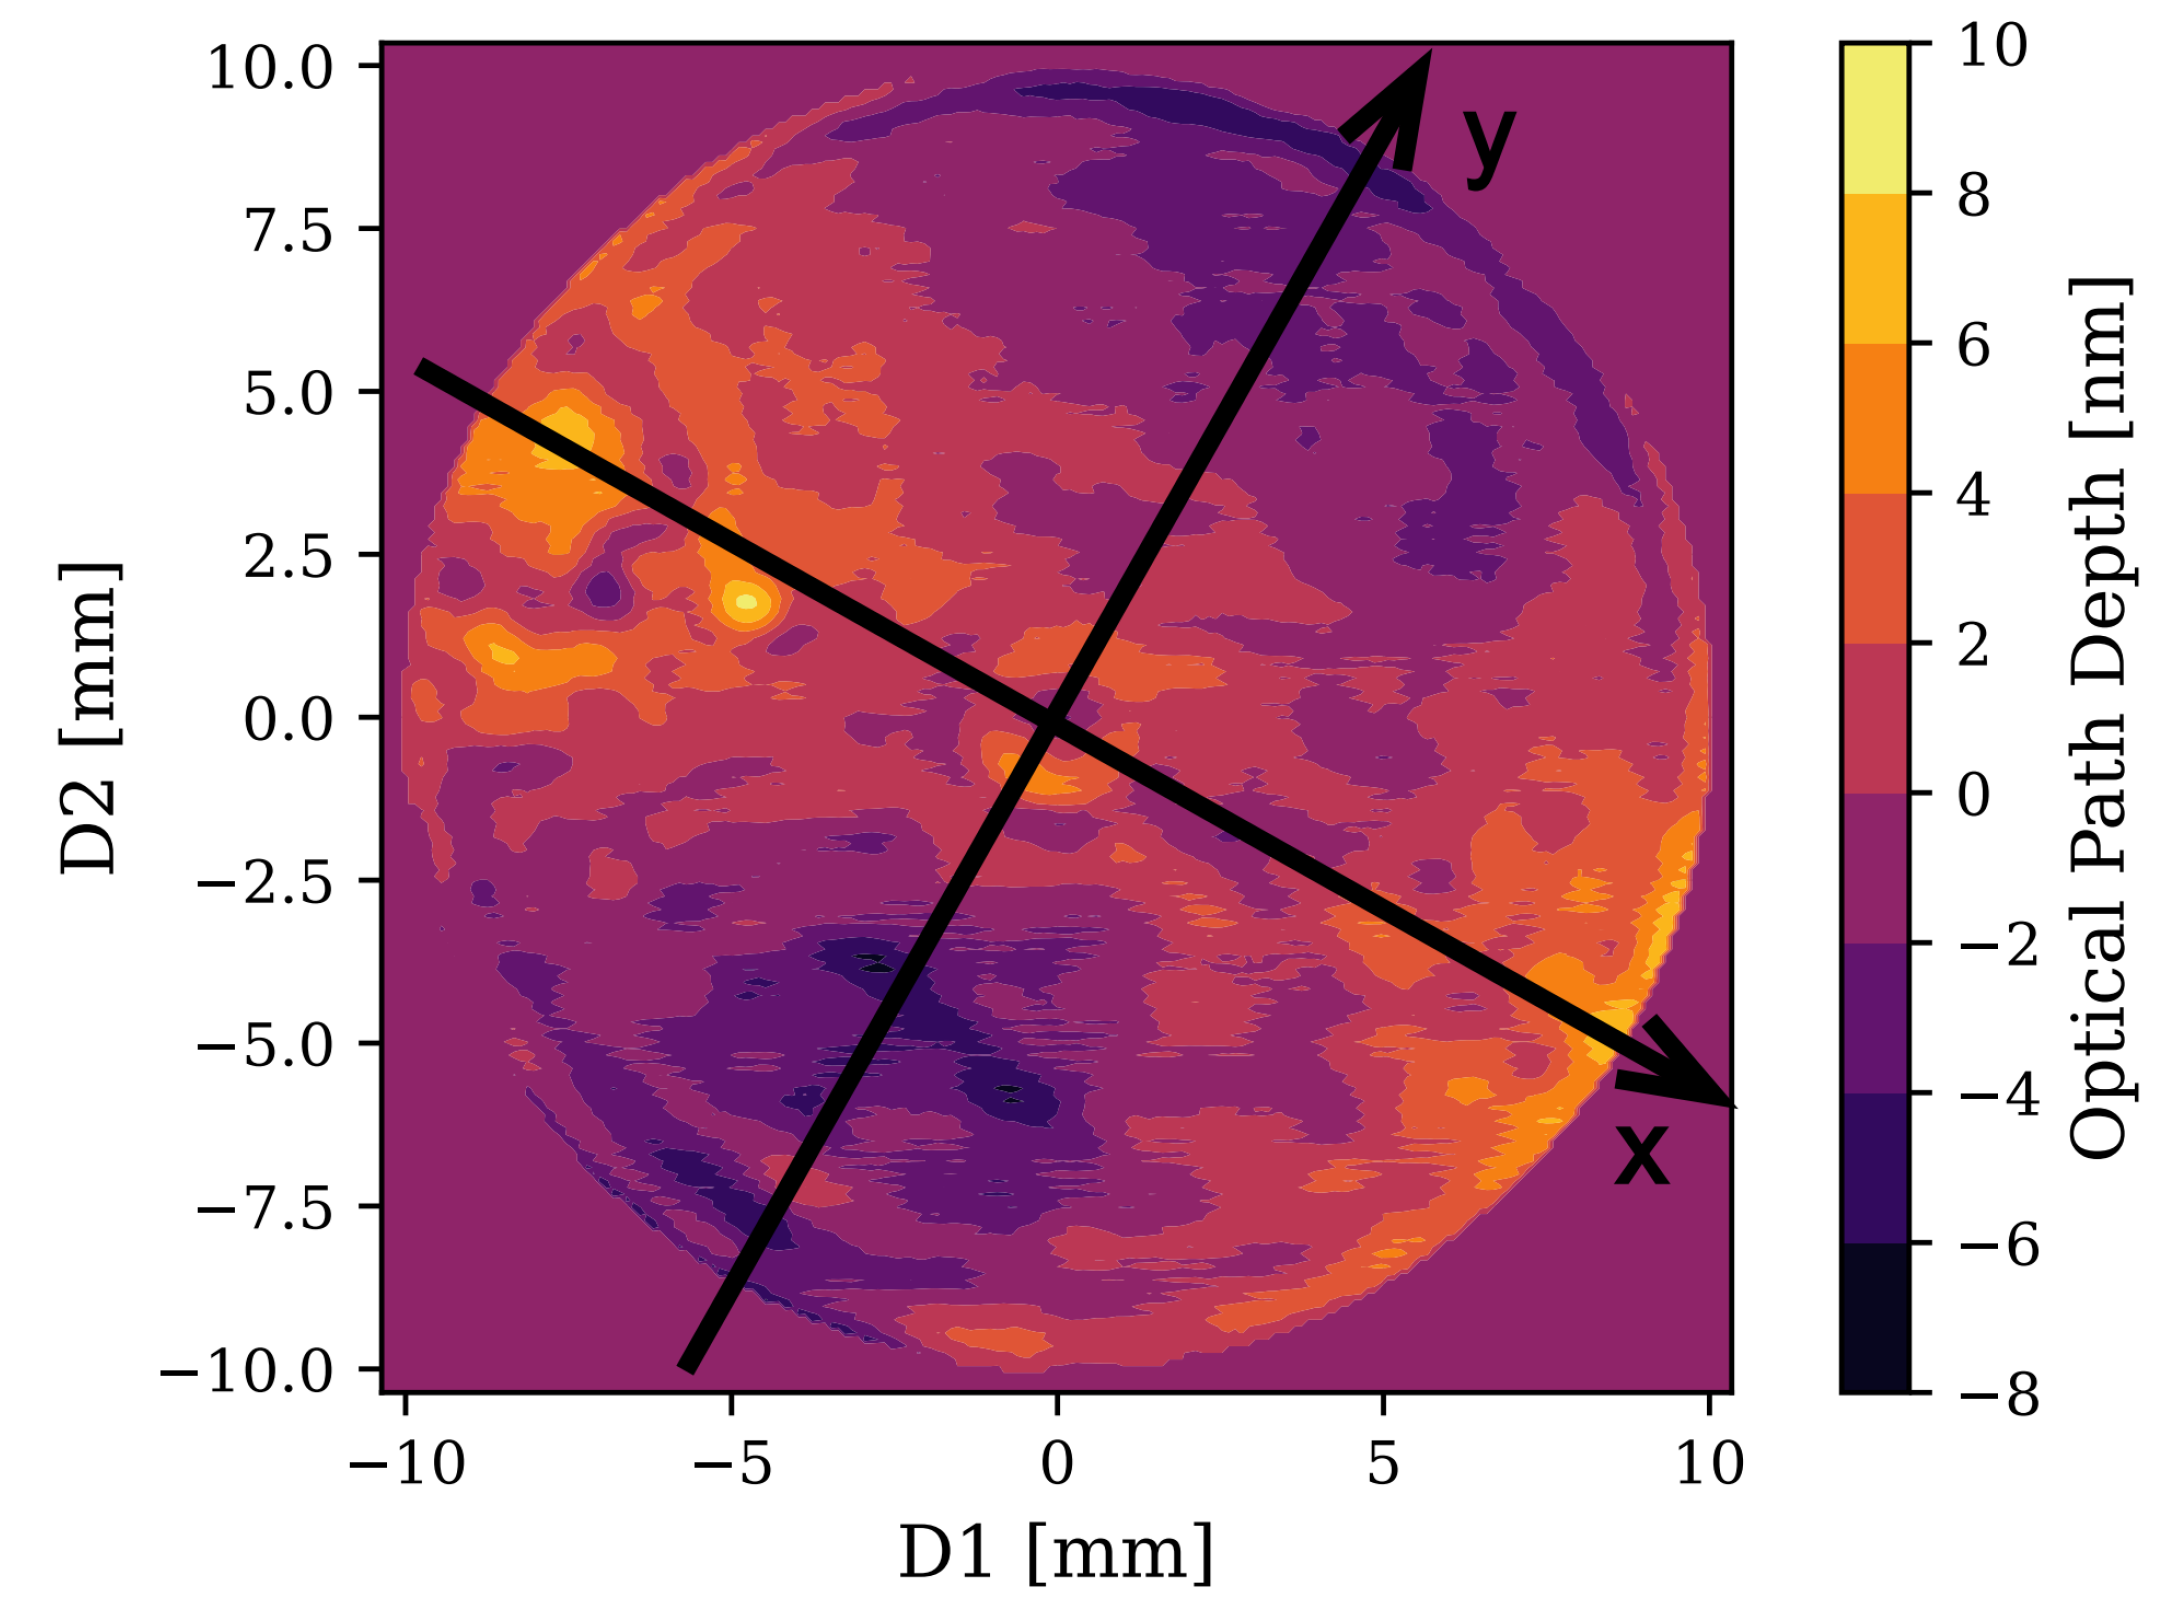
Figure 1. Mirror surface map applied on EM. The astigmatism is clearly observable, resulting in different radii of curvature along the x and y axes.
Photonics 12 00670 g001
Figure 2. Simulated cavity scan. The red dots mark the resonant frequencies: peaks 1–3 correspond to the fourth-order modes, peaks 4–6 to the second-order modes, and peak 7 to the fundamental mode. Below the resonance curve are the beam profiles corresponding to the resonance frequencies.
Photonics 12 00670 g002
Figure 3. Simulation of cavity scan results without mirror surface defects.
Photonics 12 00670 g003
Figure 4. The top figure shows the resonance results obtained by tuning the laser frequency when the cavity length approaches the stable boundary. The bottom figure shows the beam profile corresponding to each cavity length, where x and y axes are scaled by the beam waist size ( w 0 ). For cavities L1–L15, the coordinate range is [−200 w 0 , 200 w 0 ], while L16 displays an extended range of [−400 w 0 , 400 w 0 ] to capture broader mode structure.
Photonics 12 00670 g004
Figure 5. (a) Resonance simulation results under different cavity lengths and the stability of the cavity. (b) Comparison between experimental results from Wang et al. [27] (white markers), theoretical fittings (colored lines), and Finesse simulations (black lines). The experimental data were obtained from the tabletop setup described in Wang et al. [27] using identical cavity parameters.
Photonics 12 00670 g005
Figure 6. Experimental validation: three-way comparison of Finesse simulations (white markers), experimental measurements from Wang et al. [27] (colored dots), and theoretical fitting values (colored lines). The experimental data points were acquired under conditions matching our simulations.
Photonics 12 00670 g006
Figure 7. Error signals under different cavity lengths when gradually approaching the stable boundary. The blue-shaded region denotes the linear range of the fundamental mode error signal. Annotations for each trace specify: (1) zero: the frequency offset of the error signal’s null point relative to the carrier frequency (marked by red dashed lines); (2) slope: the error signal sensitivity in the linear regime; and (3) amp: the peak-to-peak signal amplitude within the linear region.
Photonics 12 00670 g007
Figure 8. Comparison of resonance frequencies and amplitudes with different m a x t e m using Finesse simulation. (a) Cavity length is 0.999 m, g-factor is 0.00228. The red, green, and blue lines represent m a x t e m = 10, 14, and 16 respectively. (b) Cavity length is 1.001081 m, g-factor is 0.0002. The red, green, and blue lines represent m a x t e m = 10, 14, and 16 respectively. (c) Cavity length is 1.00112 m, g-factor is 0.00016. The lines in different colors represent m a x t e m = 10, 14, 16, 20, and 30 respectively. (d) Cavity length is 1.001139 m, g-factor is 0.00015. The lines in different colors represent m a x t e m = 10, 14, 16, 20, and 30 respectively.
Photonics 12 00670 g008aPhotonics 12 00670 g008b
Table 1. Main parameters of plano-concave cavity model.
ParametersValues
Laser Power1 W
Modulated Frequency1 MHz
Modulation TypePhase Modulation
Cavity Length∼1 m
Radius of Curvature of IMFlat
Radius of Curvature of EM R c x 1.0012849 m
Radius of Curvature of EM R c y 1.00114 m
Reflectivity of IM0.9985
Reflectivity of EM0.9985
FSR∼150.05 MHz
Finesse2092.82
Disclaimer/Publisher’s Note: The statements, opinions and data contained in all publications are solely those of the individual author(s) and contributor(s) and not of MDPI and/or the editor(s). MDPI and/or the editor(s) disclaim responsibility for any injury to people or property resulting from any ideas, methods, instructions or products referred to in the content.