Communication

Sensitivity Enhancement of Fault Detection Utilizing Feedback Compensation for Time-Delay Signature of Chaotic Laser

1
Key Laboratory of Advanced Transducers and Intelligent Control System Ministry of Education, Taiyuan University of Technology, Taiyuan 030024, China
2
College of Physics and Optoelectronics, Taiyuan University of Technology, Taiyuan 030024, China
3
Shanxi Key Laboratory of Precision Measurement Physics, Taiyuan University of Technology, Taiyuan 030024, China
*
Author to whom correspondence should be addressed.
Photonics 2025, 12(7), 641; https://doi.org/10.3390/photonics12070641
Submission received: 13 May 2025 / Revised: 18 June 2025 / Accepted: 20 June 2025 / Published: 24 June 2025

Abstract

Fiber fault detection based on the time-delay signature of an optical feedback semiconductor laser has the advantages of high sensitivity, precise location, and a simple structure, which make it widely applicable. The sensitivity of this method is determined by the feedback strength inducing the nonlinear state of the laser. This paper proposes a feedback compensation method to reduce the requirement of the fault echo intensity for the laser to enter the nonlinear state, significantly enhancing detection sensitivity. Numerical simulations analyze the impact of feedback compensation parameters on fault detection sensitivity and evaluate the performance of the laser operating at different pump currents. The results show that this method achieves a 9.33 dB improvement in sensitivity compared to the original approach, effectively addressing the challenges of detecting faults with high insertion losses in optical networks.

1. Introduction

The widespread deployment of optical fibers and the rapid increase in transmission capacity have led to a rise in fiber fault-induced losses, emphasizing the need for effective fault detection [1,2]. The rise in fiber to the x (FTTx) has established it as the predominant form in fiber optic applications, with time division multiplexing in passive optical networks (TDM-PONs) as its primary architecture [3,4,5]. This configuration enables high-speed efficient information transfer through a one-to-many broadcasting method. However, it also complicates the detection of branch faults due to high insertion losses and the uniform distribution of identical signals across multiple branches.
Researchers have proposed various methods for detecting TDM-PON faults, including using optical time domain reflectometers (OTDRs) for fault location, with different branch lengths to identify branches [6]; employing optical frequency domain reflectometry for fault positioning, where interference units of varying lengths at the ends of branches generate unique beat frequency signals for branch distinction [7]; integrating fiber Bragg gratings (FBGs) at branch ends, combined with tunable-OTDR, to match the wavelength characteristics of different branches for identification [8]; utilizing optical fibers of varying lengths and FBGs with distinct reflection or transmission intensities to create unique reflection pulse codes, enabling branch identification while fault positioning relies on the pulse flight method [9,10]; and using Brillouin-OTDR for fault location, selecting specially designed fibers with distinct Brillouin frequency shifts to differentiate branches based on their unique frequency shift values [11].
However, these methods rely on photodetectors to receive fault echoes, which limits the detection system’s sensitivity due to the photodetector’s response capabilities. For instance, in a 20 km feeder fiber with a 1:64 branch TDM-PON, this results in a fiber loss of 4 dB over 20 km, an insertion loss of 18 dB in the splitter, and a total bidirectional loss of approximately 44 dB (the attenuation coefficient of G.652.D fiber at 1550 nm is 0.2 dB/km, according to ITU-T G.652 [12]). Under these conditions, traditional photodetectors struggle to detect fault echoes effectively. While sensitivity can be enhanced by using a resonance effect created by a cavity formed by modulation frequencies and fault point feedback to the laser [13], the use of vector network analyzers introduces significant cost increases.
In 2015, we proposed a fault detection method based on the time-delay signature of optical feedback semiconductor lasers for fiber fault location. Unlike traditional chaotic OTDR, this method enables the laser to enter a chaotic state through fault point feedback echoes, with fault location determined by the delay signature of the chaotic laser [14]. This approach eliminates the need for photodetectors to receive fault echoes, simplifying the system and overcoming the limitations of photodetector sensitivity. However, the fault detection is determined by the observation of the time-delay signature, which refers to the fault echo power. Too weak of a fault echo cannot induce the laser nonlinear state and will not be detected, leading to the failure of the detection method.
To enhance the sensitivity of the fault detection system, the laser must be driven into a nonlinear state by a weaker fault echo signal. This can be achieved by employing a new semiconductor laser with a lower threshold for entering the nonlinear regime [15]. However, in this paper, we adopt a more effective approach, involving constructing a feedback compensation branch, where the total feedback intensity received by the laser is composed of both the fault echo feedback and the compensation feedback. By adjusting the compensation strength, the total feedback intensity received by the laser can reach the threshold for entering the nonlinear state. Consequently, even very weak echo signals from fault points can drive the laser into a nonlinear state, and the sensitivity of the system is significantly improved. The simulation analyzes the impact of compensation parameters and bias current and indicates the optimized condition. The study offers theoretical support for future experimental validation and practical deployment.

2. Principle and Numerical Model

2.1. Principle

The schematic diagram for enhancing sensitivity in optical fiber fault detection using feedback compensation is shown in Figure 1. The laser diode (LD) output is split into two paths by a 99:1 coupler. One path is used for fiber fault detection, and the other monitors the laser output state while preparing for the subsequent process. The 99% branch is further divided into test fiber (80%) and a compensation branch (20%). When the laser passes through the test fiber, Fresnel reflections at the fiber end or fault point return light to the LD, driving it into a quasi-periodic or chaotic state. This state is detected by the photodiode (PD) connected to the 1% branch of the 99:1 coupler. The temporal waveform is captured by an oscilloscope (OSC) and processed to calculate the auto-correlation curve, which is used to determine the fault location.
The compensation branch includes a variable optical attenuator (VOA), a variable fiber delay line (VFDL), and a fiber mirror (FM). The FM reflects light back to the laser, while the VOA and VFDL adjust the strength and phase of the feedback, respectively. The phase is adjusted by changing the fiber length on a wavelength scale using the VFDL.
The method of fault detection relies on the nonlinear states of the laser output, which exhibit distinct time-delay signatures in their chaotic or quasi-periodic states. By introducing feedback compensation, the laser enters the nonlinear state earlier in response to weaker fault echoes, thereby enhancing the detection system’s sensitivity.

2.2. Simulation Model

To analyze the effect of compensation branch parameters on the laser’s nonlinear state, numerical simulations were performed using the Lang–Kobayashi rate equations [16], which include two feedback terms to model the external cavity feedback and compensation feedback. The equations were solved using the fourth-order Runge–Kutta method [17]. Simulations focused on how the compensation branch influences the laser’s nonlinear state, excluding the effects of spontaneous emission noise. The rate equations are as follows:
d A ( t ) d t = 1 2 { G n [ N ( t ) N 0 ] 1 τ p } A ( t ) + k f τ i n A ( t τ f ) cos θ 1 ( t ) + k c τ i n A ( t τ c ) cos θ 2 ( t ) + 2 β N ( t ) μ 1 d φ ( t ) d t = α 2 { G n [ N ( t ) N 0 ] 1 τ p } k f τ i n A ( t τ f ) A ( t ) sin θ 1 ( t ) k c τ i n A ( t τ c ) A ( t ) sin θ 2 ( t ) + 2 β N ( t ) μ 2 d N ( t ) d t = I q V N ( t ) τ n G n [ N ( t ) N 0 ] A 2 ( t ) θ 1 ( t ) = ω 0 τ f + φ ( t ) φ ( t τ f ) θ 2 ( t ) = ω 0 τ c + φ ( t ) φ ( t τ c )
In this model, A(t) and φ(t) represent the amplitude and phase of the electric field, respectively, and N(t) denotes the carrier density. The gain coefficient is Gn, and N0 and Nth are the transparent and threshold carrier densities, respectively. The carrier and photon lifetimes are τn and τp, while τin is the round-trip time of the laser’s internal cavity. The linewidth enhancement factor, electron charge, wavelength, and active region volume are represented by α, q, λ, and V, respectively. The fault echo strength of the probe branch and the feedback strength of the compensation branch are denoted as kf and kc, respectively. τf and τc refer to the round-trip times from the laser to the fault point and to the end of the compensation branch, respectively. The feedback light phases of the probe and compensation branches are θ1(t) and θ2(t), respectively. ɷ0 denotes the angular oscillation frequency. The length of the compensated branch, Lc, is composed of two parts, namely the fixed fiber length L1 and the variable fiber delay line Lv, with τc = 2nLc/c, where n is the fiber refractive index and c is the speed of light in the fiber. The last term in the first two rows of the rate equation is spontaneous radiation noise, where β denotes the spontaneous emission factor and μ1 and μ2 are two mutually independent random variables that follow a standard normal distribution.
The main parameters are set as follows: Gn = 1.414 × 10⁻¹² m3 s−1, N0 = 0.455 × 1024 m−3, Nth = 1.059 × 1024 m−3, τn = 2.5 ns, τp = 1.17 ps, τin = 7.38 ps, τf = 21 ps, α = 5.0, β = 5.0, q = 1.602 × 10⁻¹⁹ C, λ = 1550 nm, V = 324 μm3, ω0 = 1.216 × 10¹⁵ rads−1, L1 = 20 mm, n = 1.5, c = 3 × 10⁸ ms−1, and the threshold current Ith is 22 mA [18].

2.3. Bifurcation Diagram

To better observe the enhancement effect of the feedback compensation on the laser entering the dynamic state, we analyzed the bifurcation diagram of the laser output with varying feedback strengths.
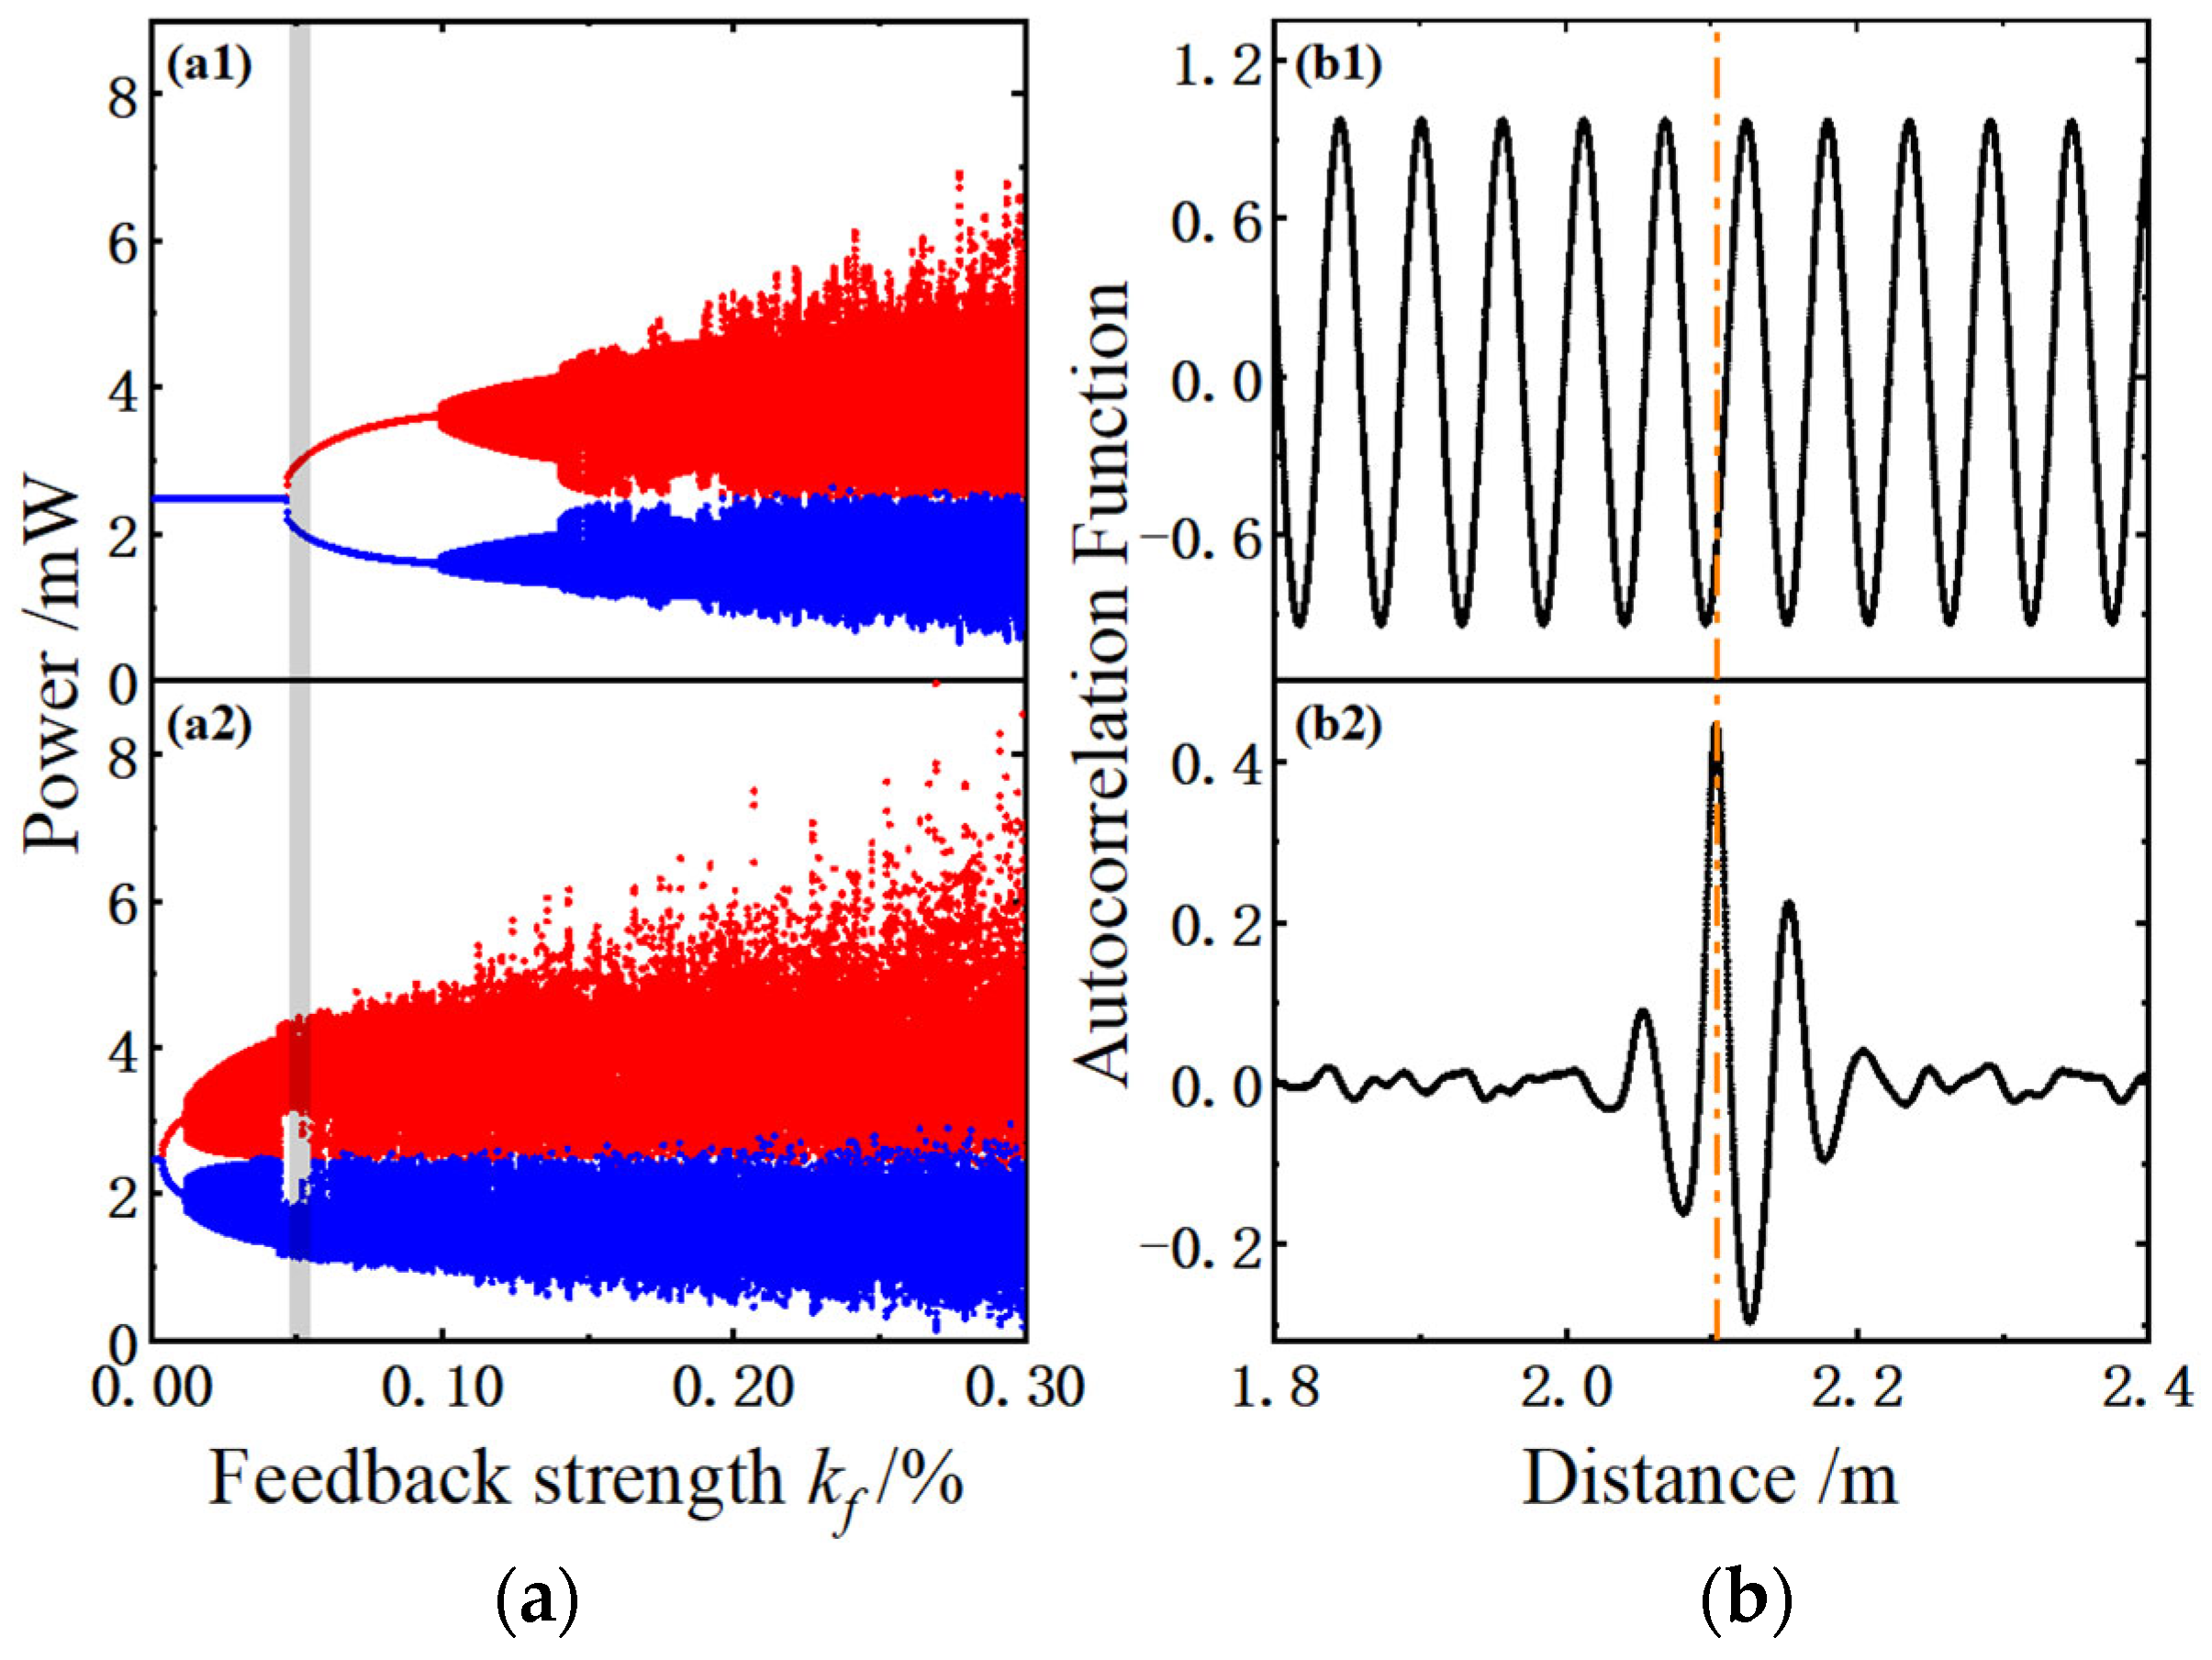
Figure 2(a1) shows the bifurcation diagram of the laser output without the compensation feedback, illustrating the transition from steady state to single-period state as the fault echo intensity increases. Specifically, the laser transitions to a single-period state at kf = 0.0457% and to a quasi-periodic state at kf = 0.0986%. This latter value served as the basis for selecting the compensation feedback strength, setting its upper limit to 0.0986%.
Figure 2(a2) shows the bifurcation diagram after incorporating the compensation branch, with the compensation feedback intensity set to kc = 0.09%. A comparison between Figure 2(a1,a2) reveals significant changes in the laser’s bifurcation behavior. The stable state almost disappears, and the onset of the single-period state is advanced from kf = 0.0457% to kf = 0.0051%, with the range of feedback strength required to maintain the single-period state being substantially reduced. Additionally, the starting point for the quasi-periodic state, which is crucial for fault detection and reflects the external cavity delay characteristics, shifts from 0.0986% to 0.0115%.
Figure 2b shows the auto-correlation curves of the laser output corresponding to the same feedback intensity range (highlighted by the gray area in Figure 2a). In Figure 2(a1), where no compensation feedback is applied, the laser output remains in a single-period state. The corresponding auto-correlation curve (Figure 2(b1)) exhibits periodic fluctuations, which do not provide information about the external cavity length (fault position). However, as shown in Figure 2(a2), the laser output transitions to a quasi-periodic state with compensation feedback. The auto-correlation curve in this case (Figure 2(b2)) shows a prominent peak, indicating the fault position.
Figure 3 shows that the effect of spontaneous emission noise from the laser is analyzed, revealing that the critical feedback strength required to trigger nonlinearity increases from 0.0115% to 0.0131%. Due to this minimal influence, we have ignored it in the subsequent simulations.

3. Simulation Results

3.1. Impact of Compensation Parameters

Feedback compensation involves adding an additional compensation branch to the original system, leaving the laser’s inherent parameters unchanged. The primary factors influencing sensitivity are the compensation feedback strength kc and the feedback phase. In this section, we examine how these two parameters affect the system’s sensitivity, while the compensation feedback phase is analyzed indirectly through adjustments to the feedback length Lc.
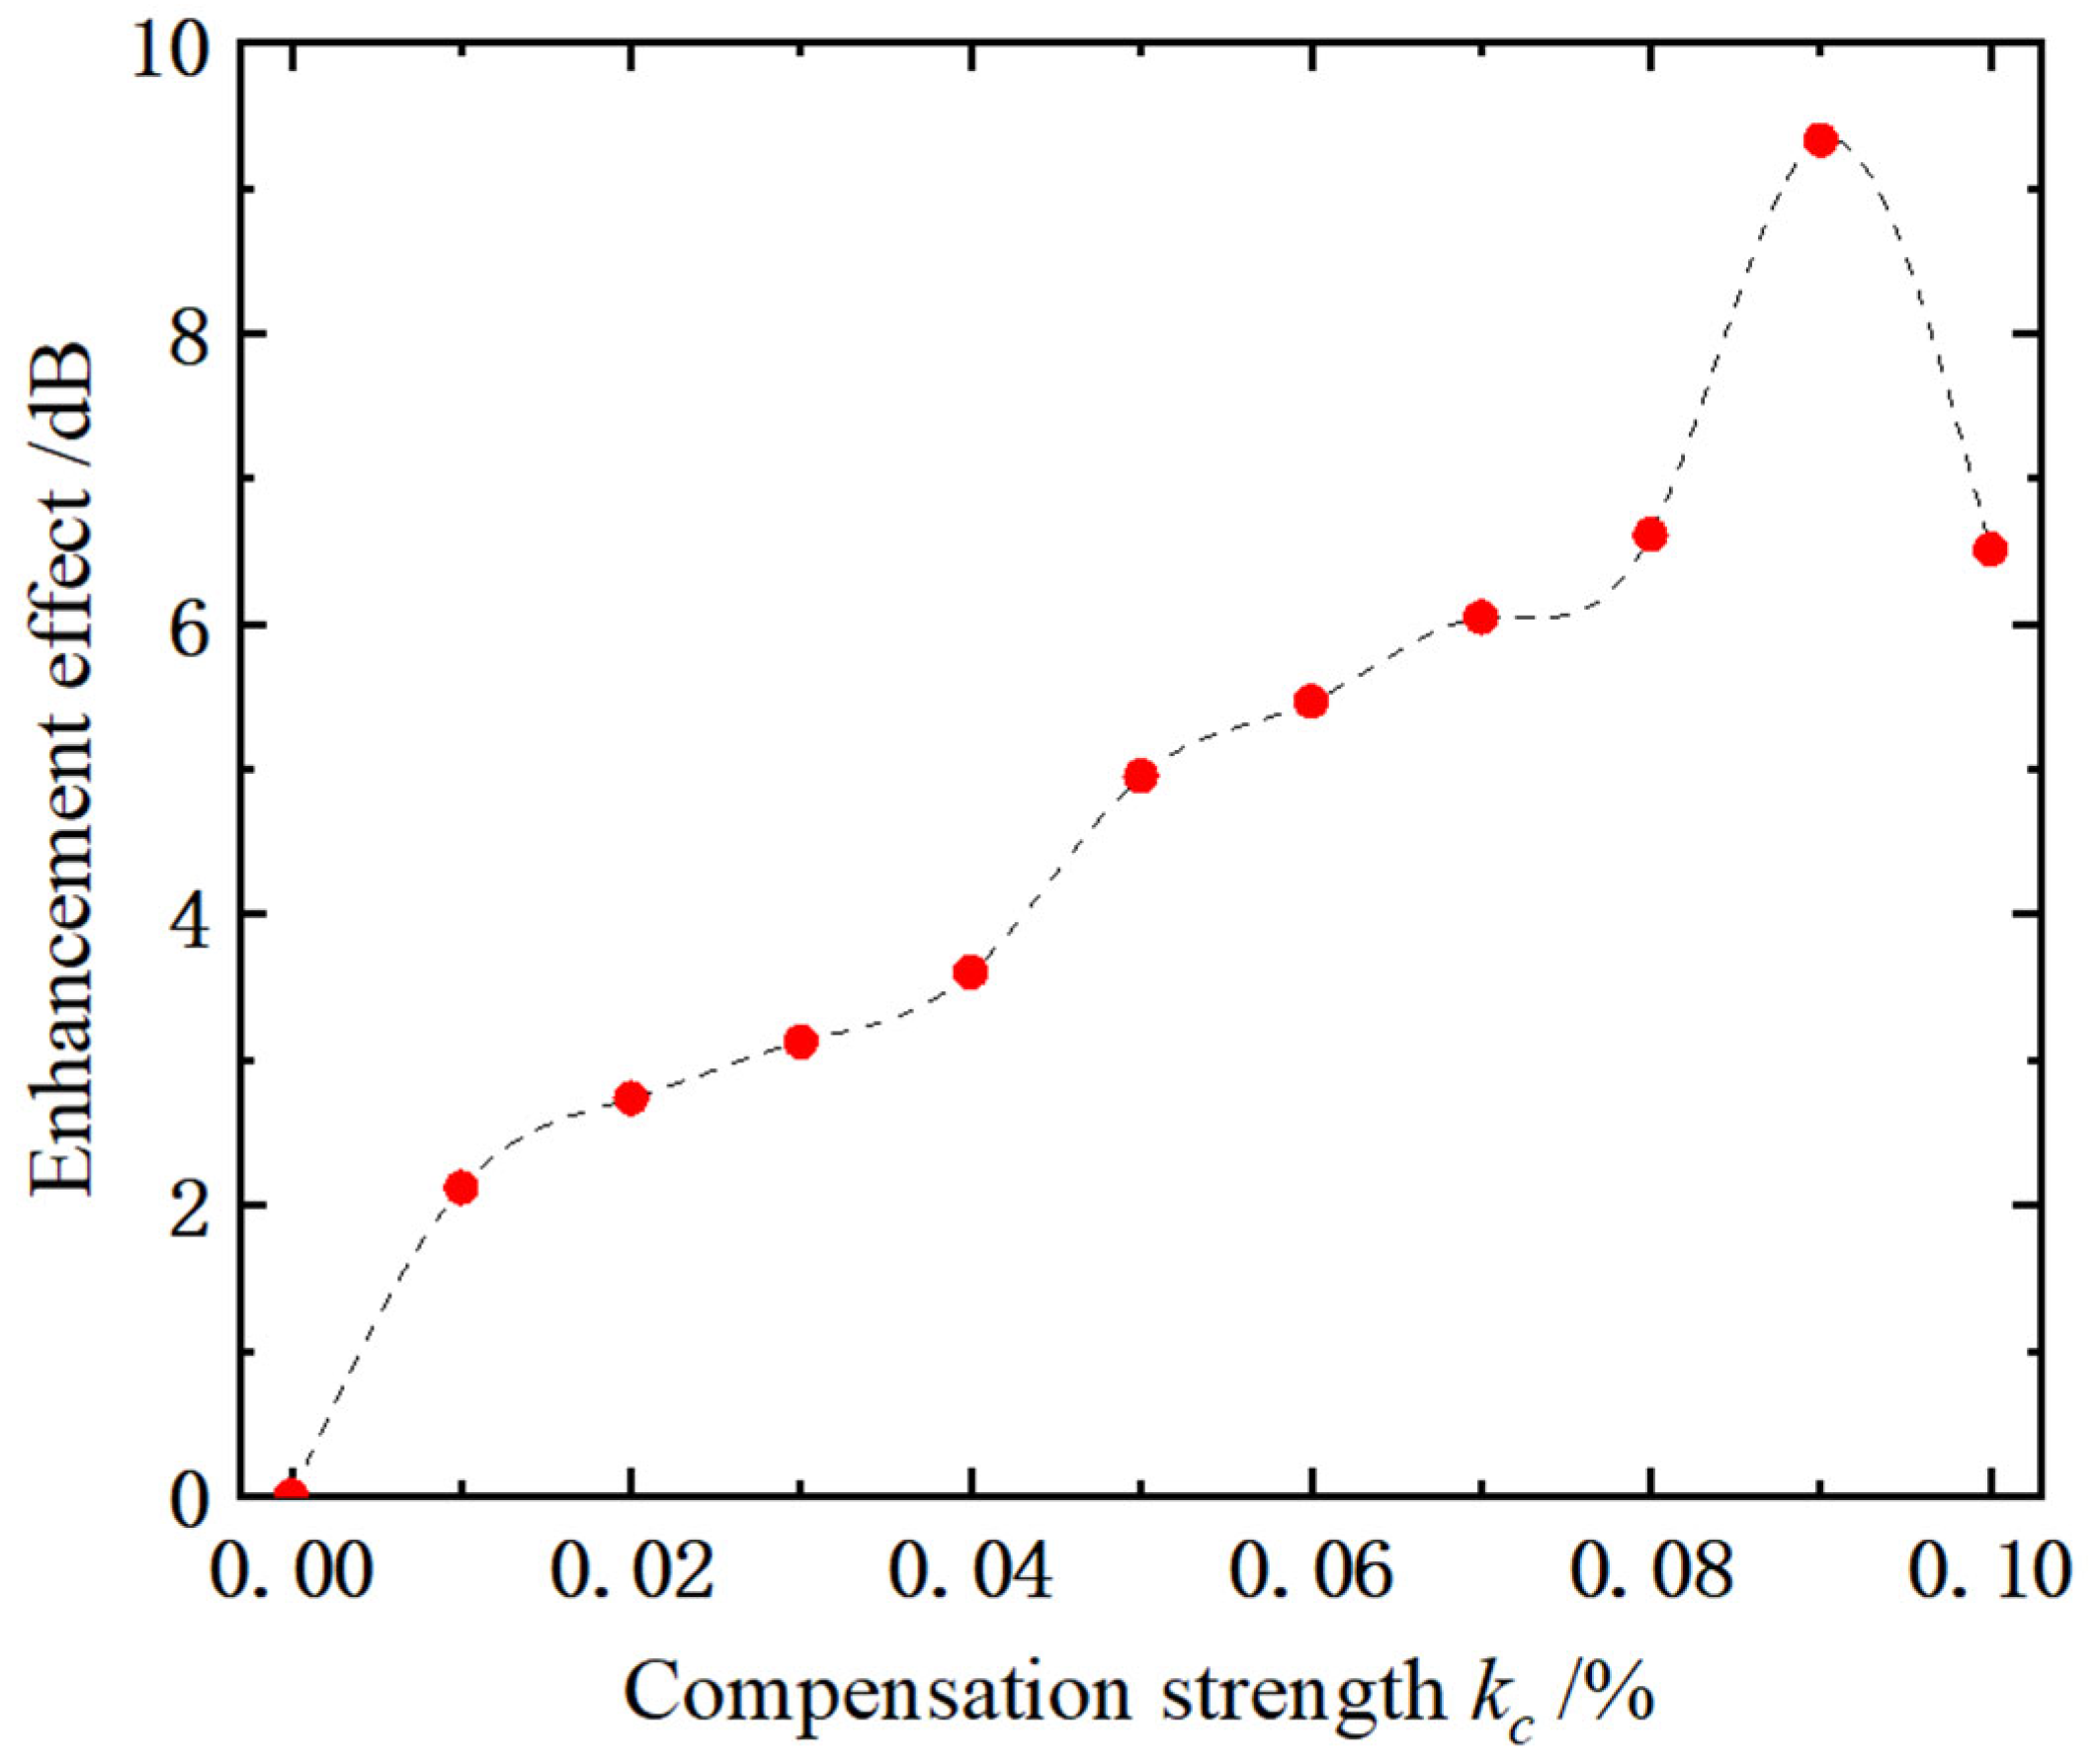
Fault detection using this method requires the laser to enter a nonlinear state in response to the fault echo. Therefore, sensitivity is defined as the minimum feedback strength required to induce the laser into a nonlinear state, which numerically equals 10 × log(kmin) with units expressed in dB. The sensitivity enhancement effect is the difference between the minimum feedback strength required to respond to fault echoes before and after the compensation. Figure 4 illustrates the relationship between the enhancement effect and the compensation feedback strength kc. As kc increases from 0 to 0.09%, the enhancement effect progressively improves. When kc exceeds 0.02%, the enhancement effect surpasses 3 dB, and at kc = 0.09%, it reaches its maximum value of 9.33 dB. However, beyond this point, further increases will cause a slight decrease in the enhancement effect. It is important to note that, since the compensation branch is connected to 20% of the 80:20 coupler, the effective feedback strength to LD almost reaches 4%, which is much higher than the maximum set value of 0.1% in this study.
The sensitivity enhancement is also influenced by the feedback phase θ2(t) of the compensation branch. Given the complexity of adjusting phase parameters in practical experiments, the relationship between the optical transmission phase and path length difference is considered. A change in one wavelength in the compensation branch length Lc results in a full-period change in the feedback phase. Since the light undergoes a round-trip process in the fiber, a half-wavelength change in Lc is sufficient to induce a full-period shift in the feedback phase. The external cavity length Lc of the compensation branch consists of a fixed fiber length L1 and a variable fiber delay line Lv. Therefore, the study of the feedback phase is equivalent to investigating the variation in the length of Lv.
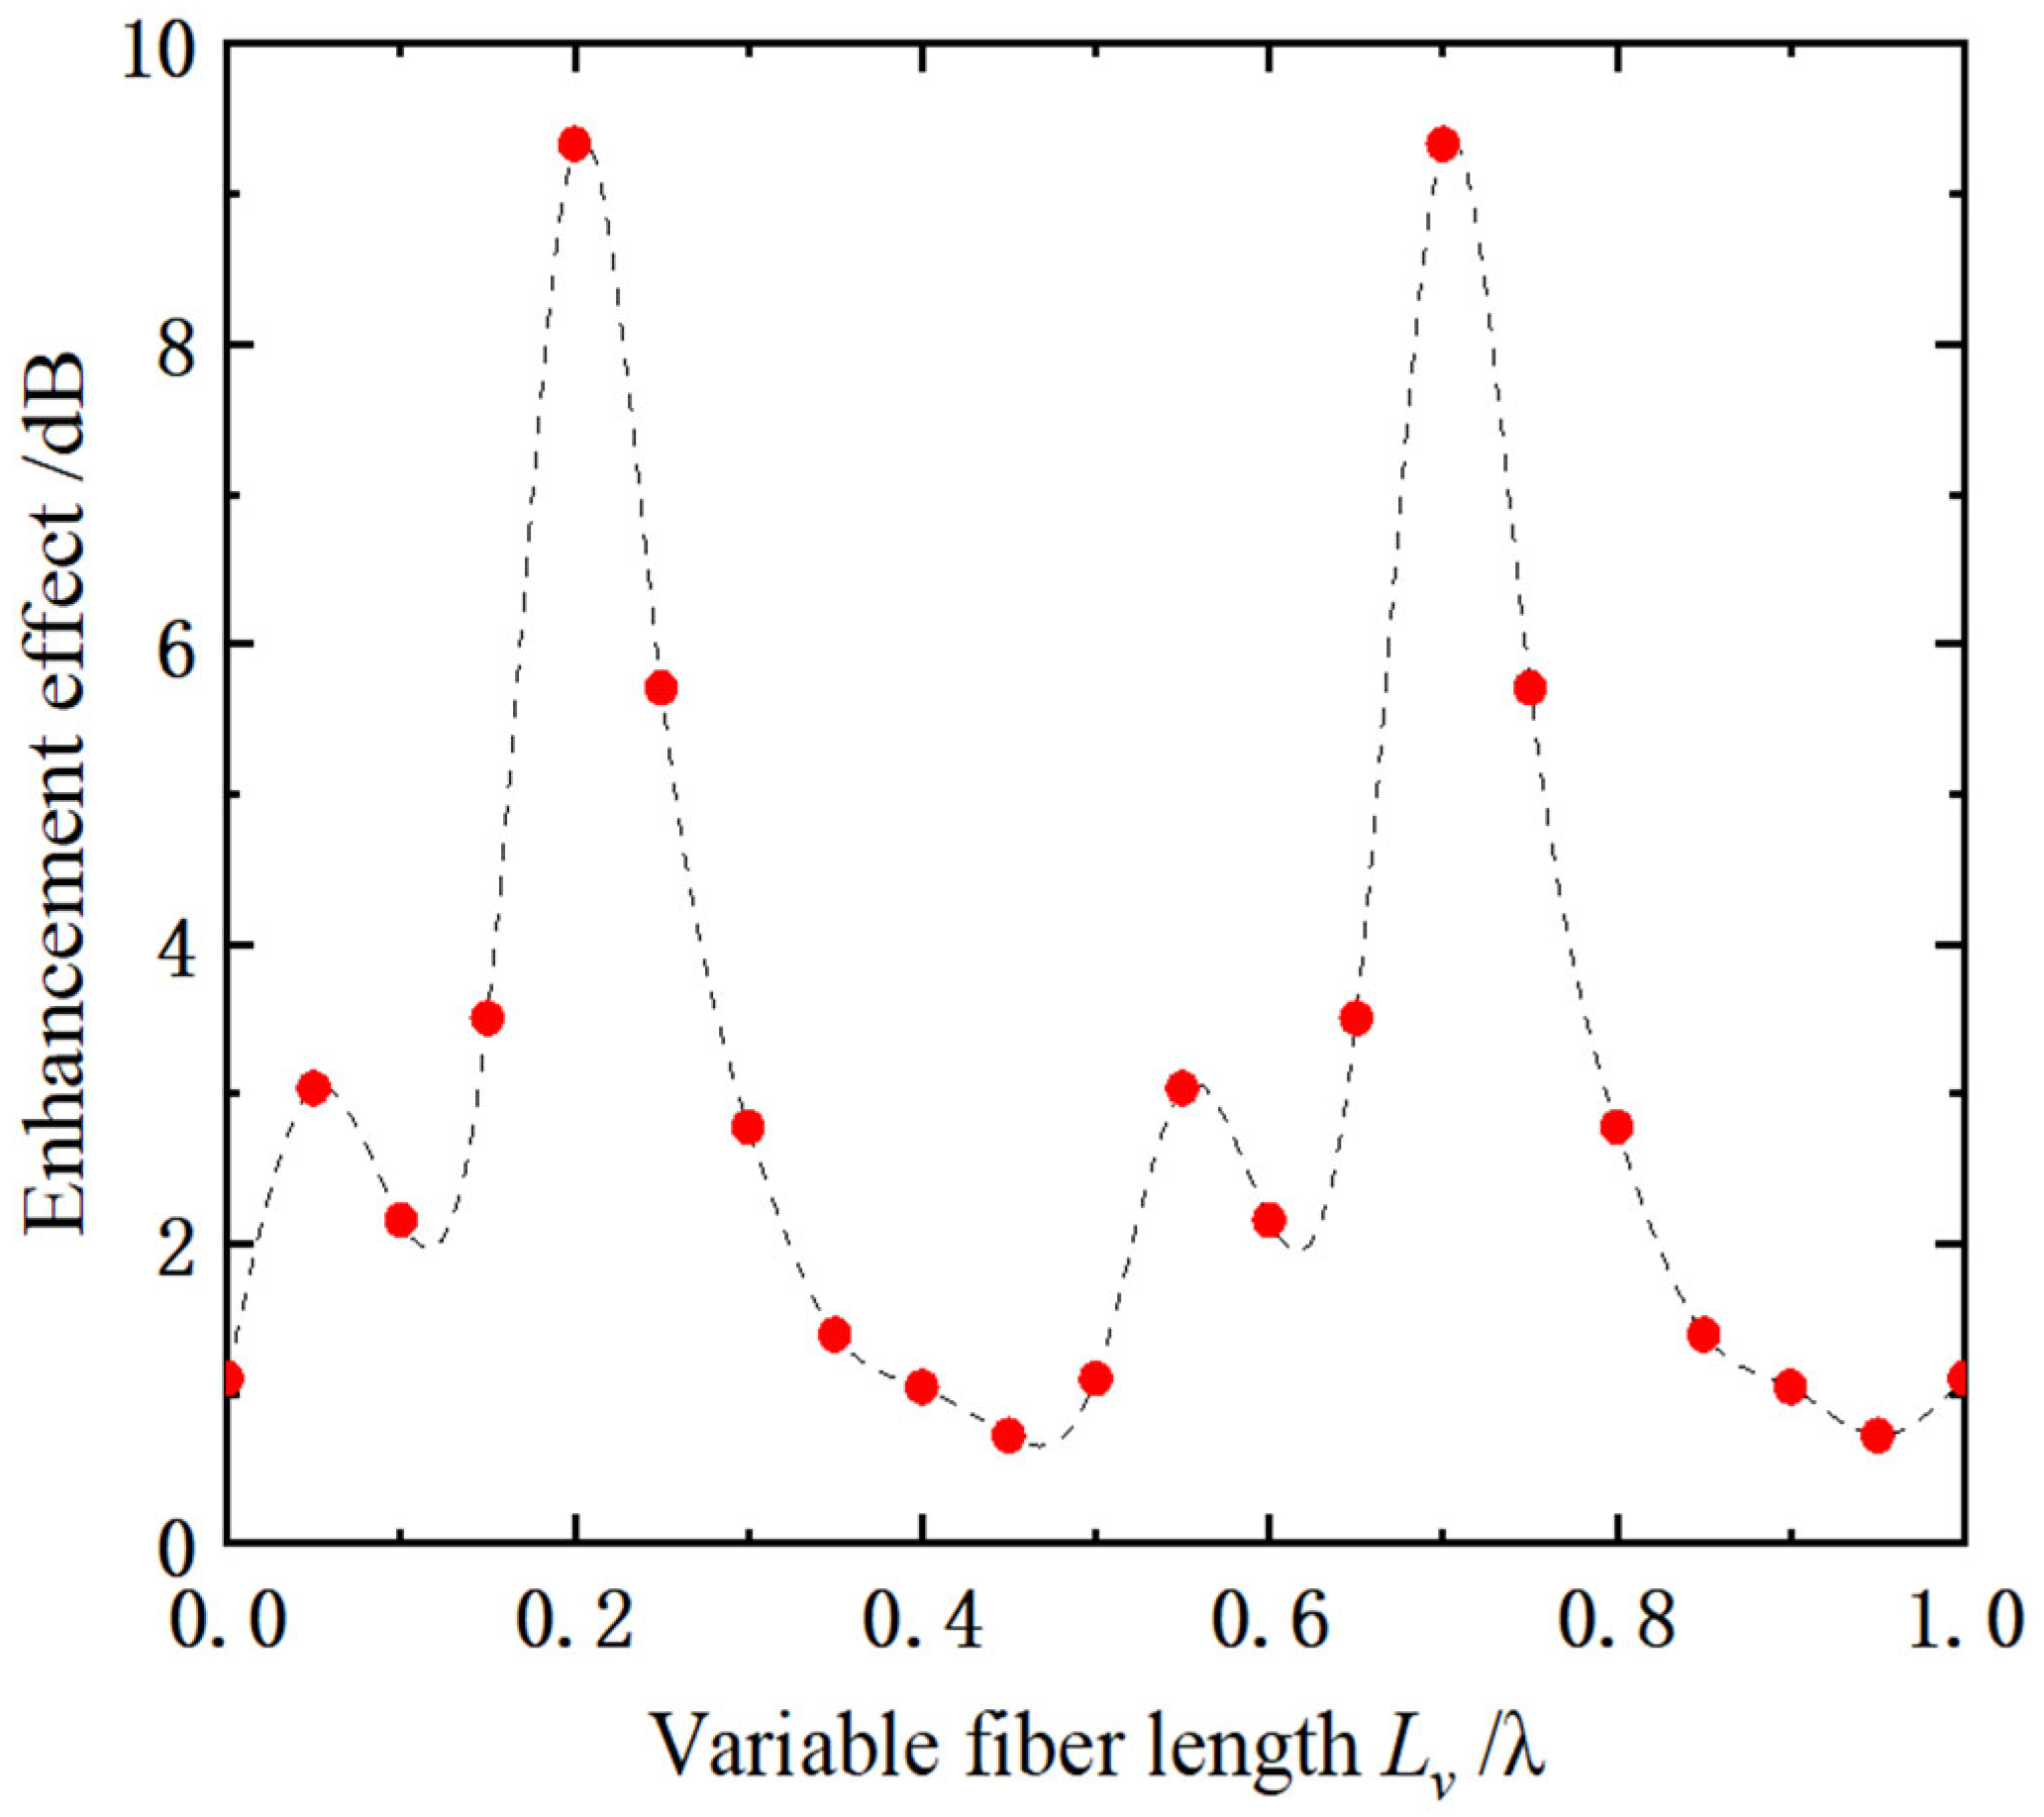
To analyze the effect of Lv on sensitivity enhancement, we set the compensation intensity kc to 0.09% and compare the sensitivity improvement at different values of Lv. The relationship between sensitivity enhancement and Lv is shown in Figure 5. As with the previous analysis, the graph demonstrates a periodic relationship with a period of 0.5λ. Within each period, sensitivity enhancement first increases and then decreases, with the maximum sensitivity improvement of 9.33 dB occurring at Lv = 0.2λ and Lv = 0.7λ.
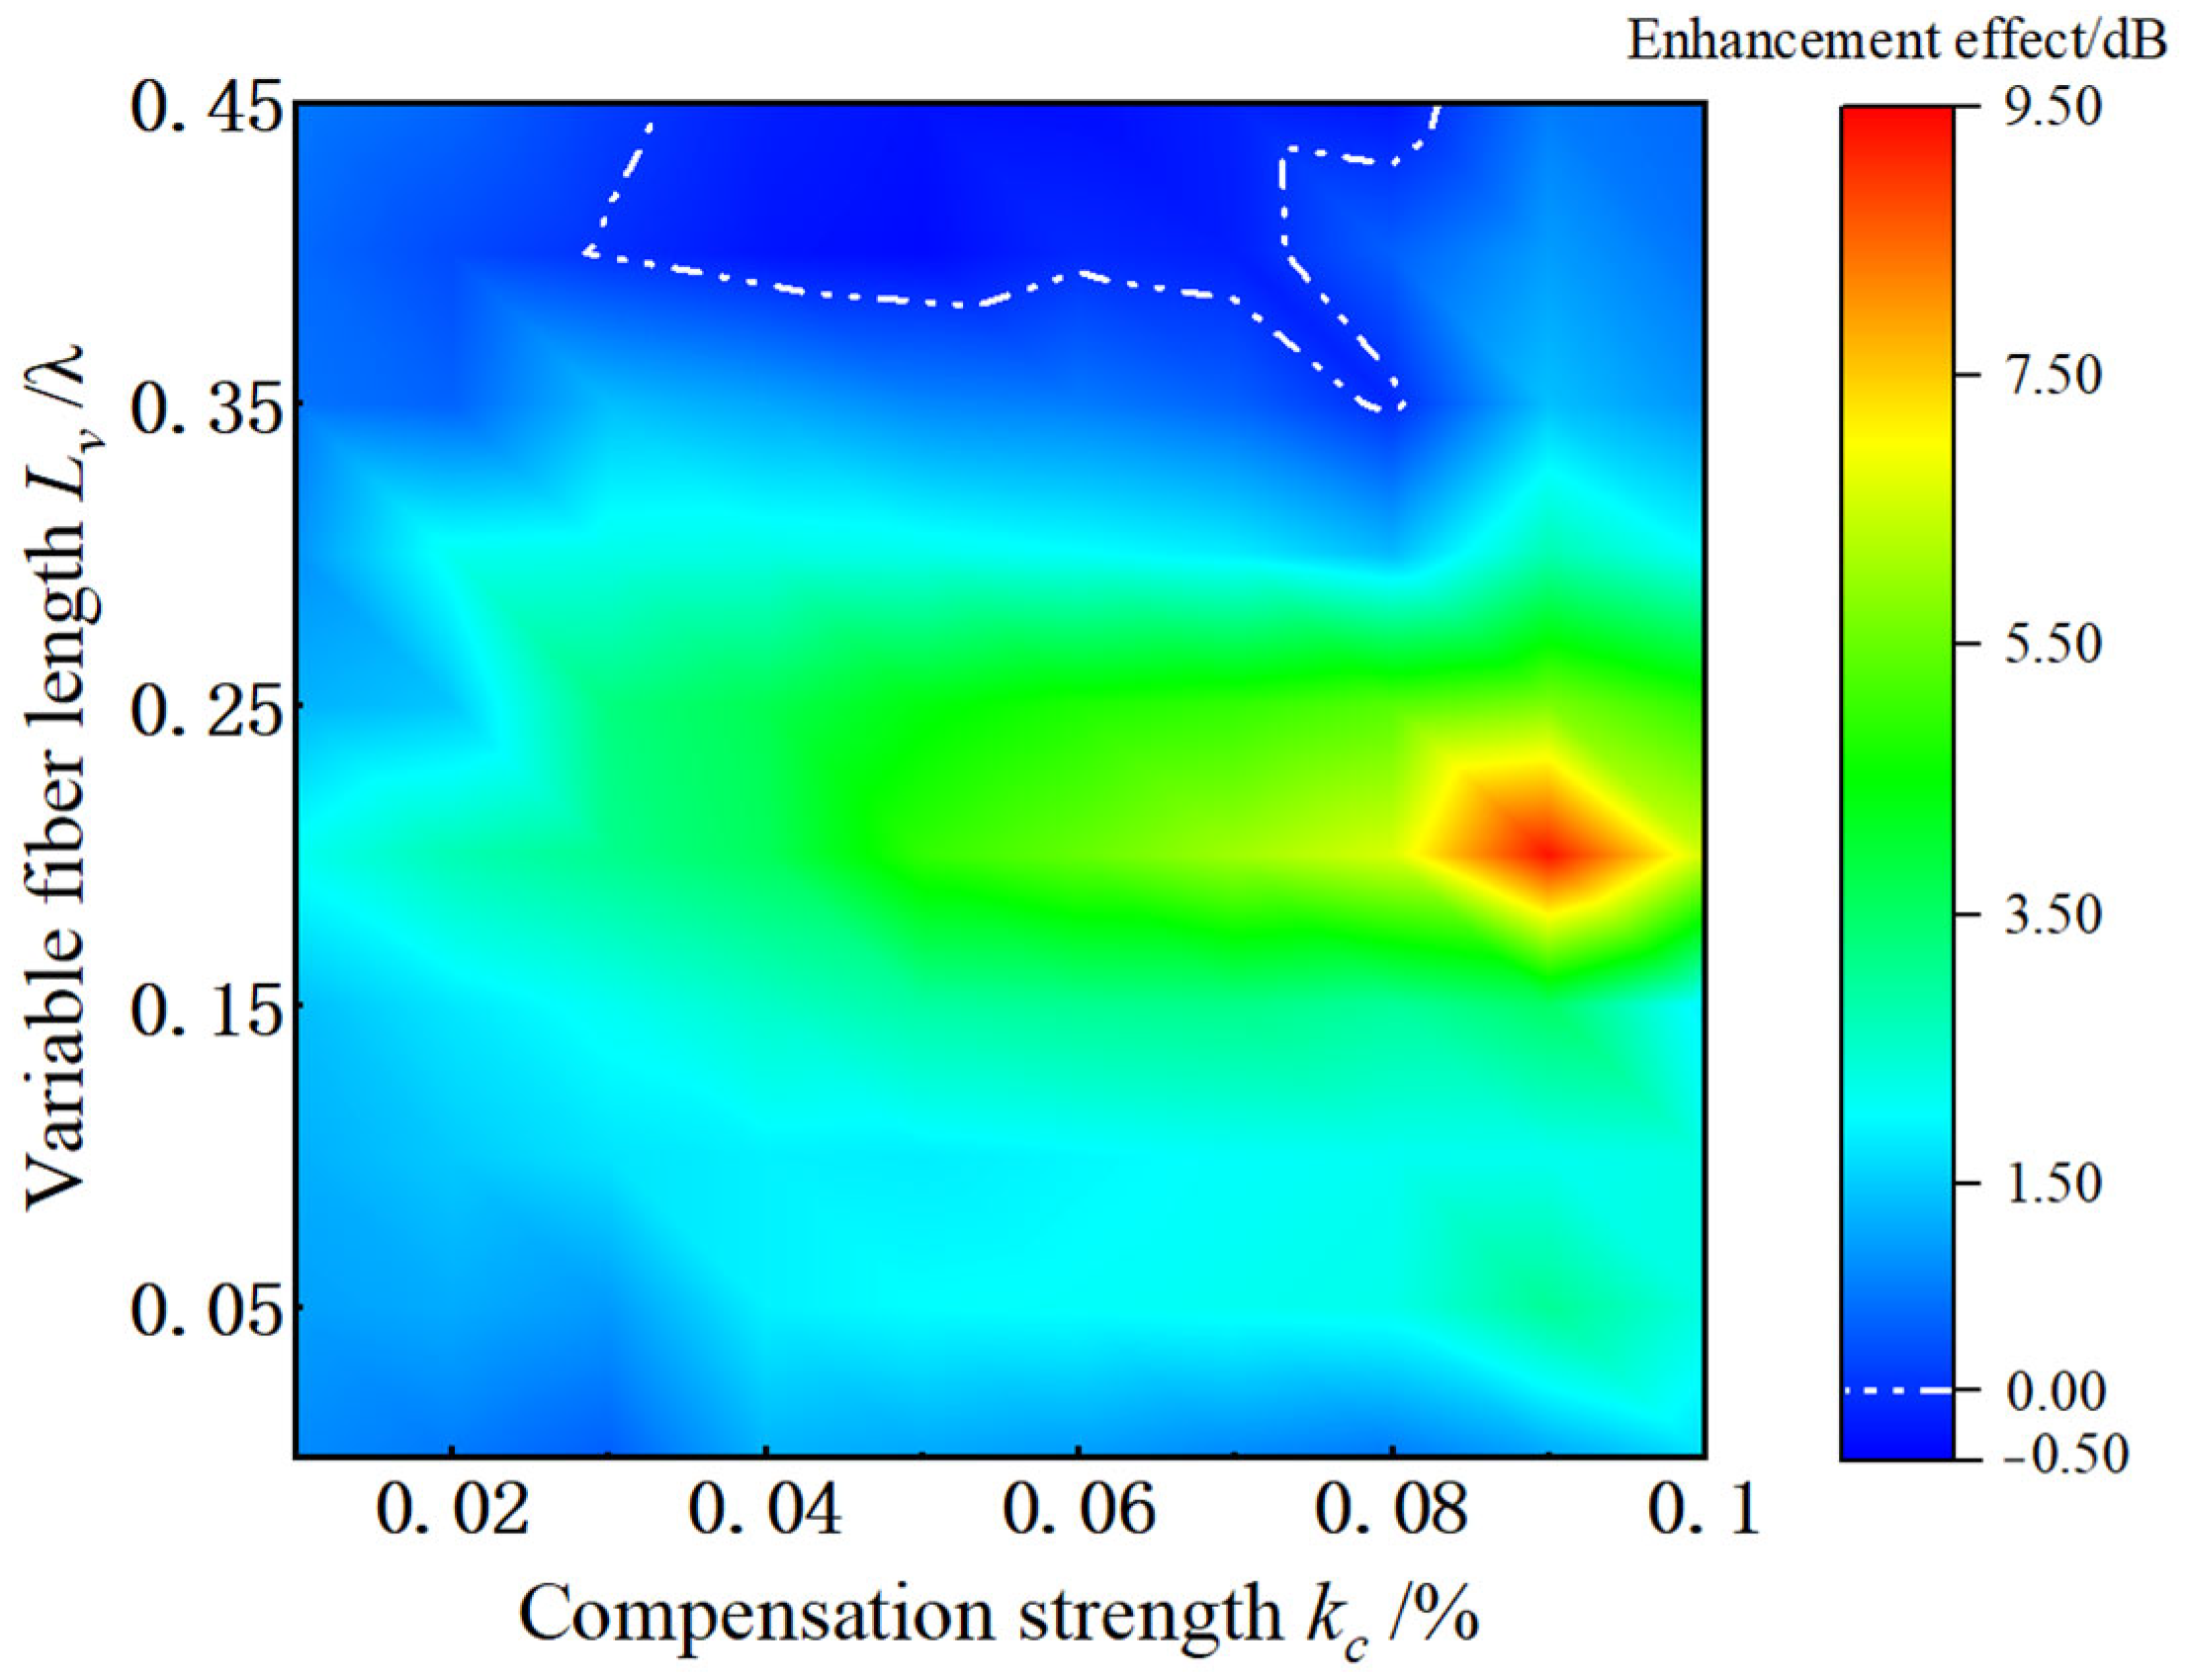
The impact of the feedback intensity and feedback length of the compensation branch on overall sensitivity enhancement is shown in Figure 6. When the variation in Lv is between 0.1λ and 0.3λ, the enhancement effect remains above 3 dB as kc changes (indicated by the green area in the graph). In the range of kc = 0.08–0.10% and Lv = 0.18λ–0.23λ (highlighted in red), the sensitivity enhancement exceeds 7 dB. The optimal sensitivity enhancement occurs at kc = 0.09% and Lv = 0.2λ, where the maximum sensitivity improvement of 9.33 dB is achieved, as previously discussed. However, not all parameter ranges lead to sensitivity enhancement. In the narrow range of kc = 0.03–0.08% and Lv = 0.4λ–0.45λ (shown by the white dashed line in Figure 6), the sensitivity enhancement effect is negative, indicating that within this range, feedback compensation actually results in a loss of sensitivity.

3.2. Effect of Pump Current

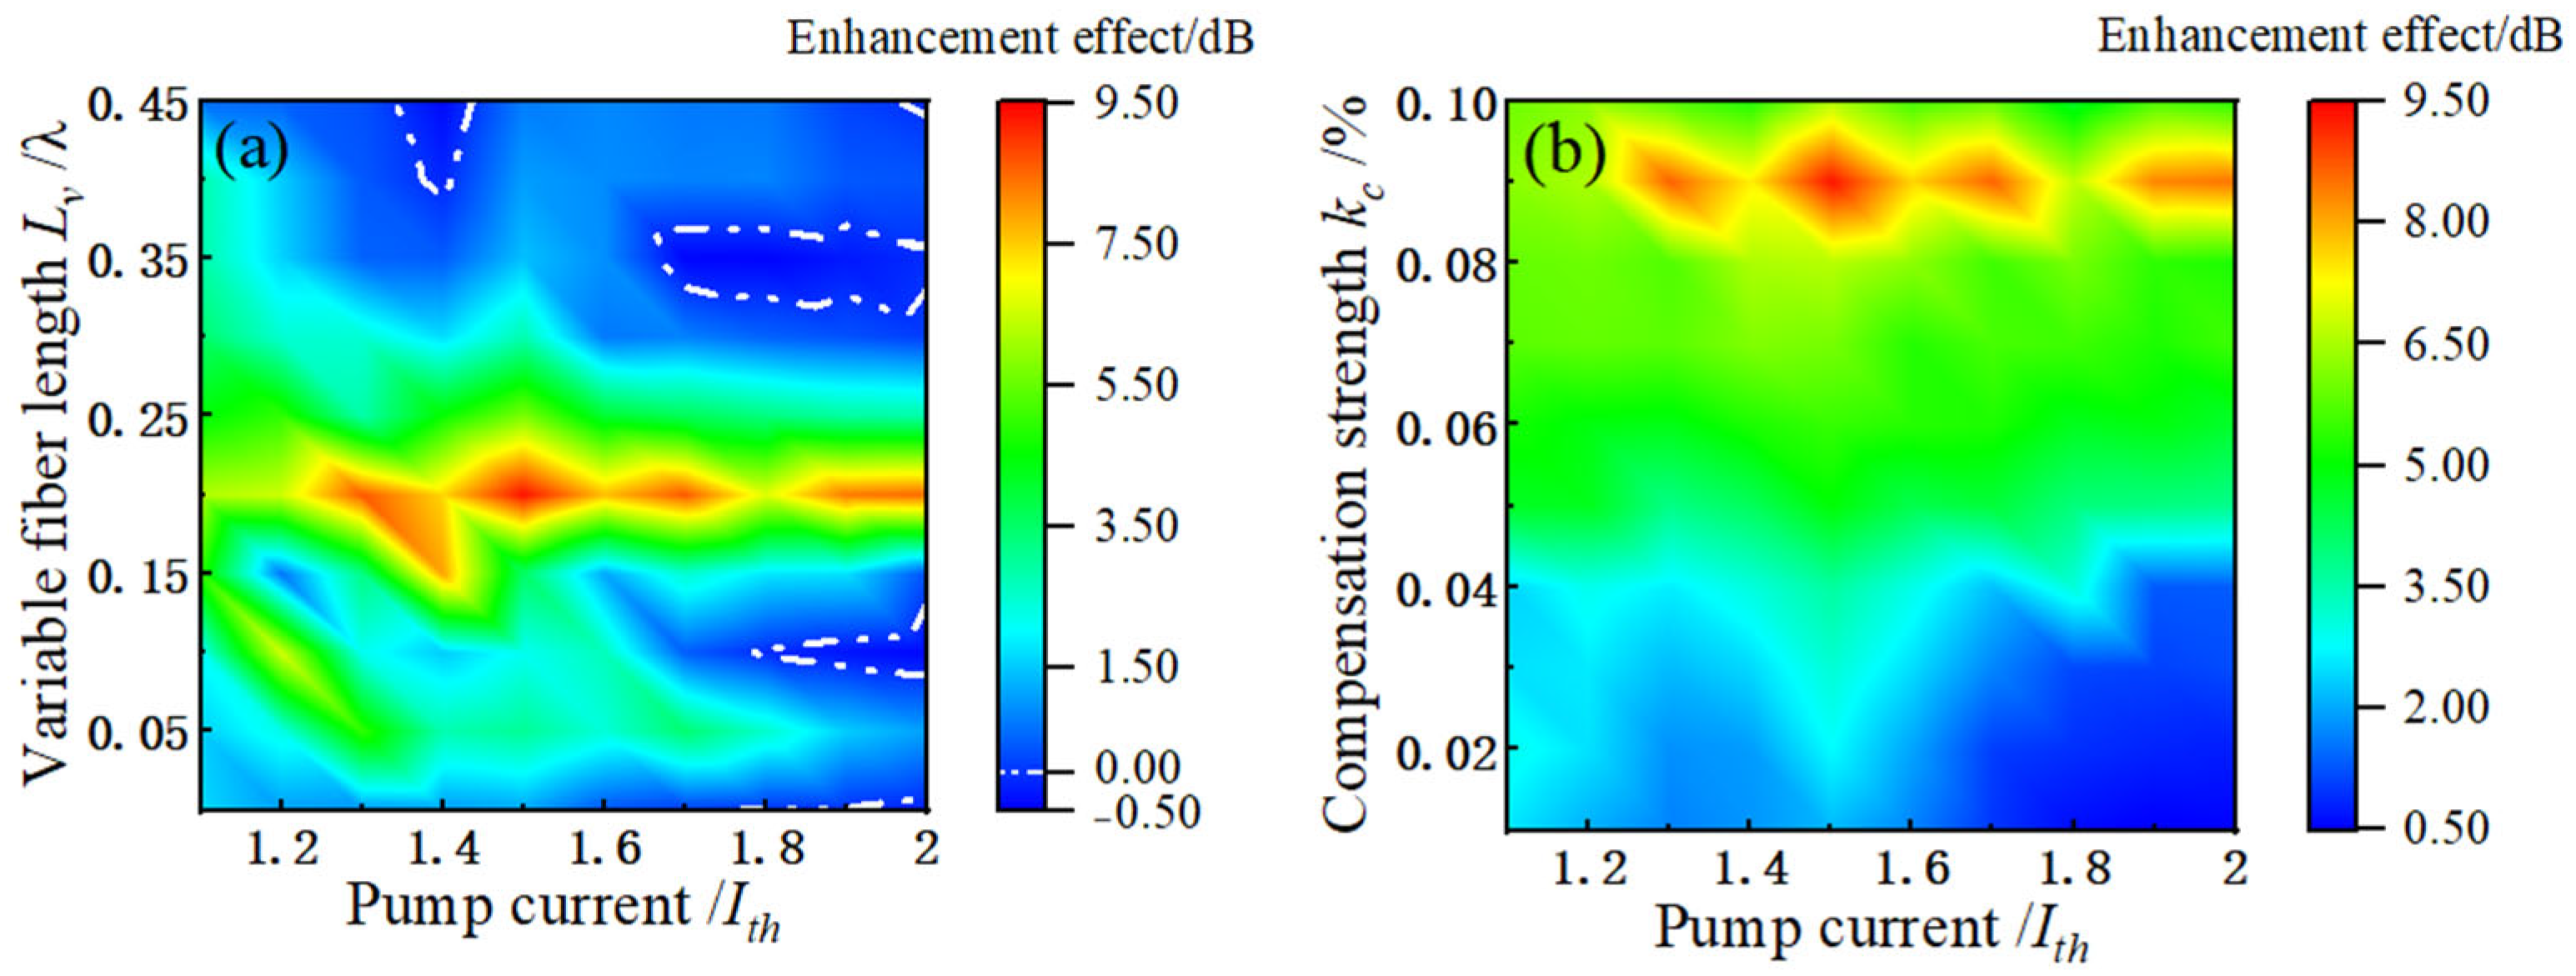
In previous research on the dynamics of optical feedback semiconductor lasers, the bias current influences the boundary of various nonlinear states. Figure 7a shows the effect of different bias currents and Lv on sensitivity enhancement, where kc = 0.09%. The effective sensitivity enhancement region is primarily around Lv = 0.2λ, where the enhancement typically exceeds 7 dB (indicated by the red area). Expanding Lv to the range 0.15λ–0.3λ, the enhancement effect remains above 3 dB regardless of changes in the bias current. However, when Lv exceeds 0.3λ, the enhancement effect deteriorates sharply, even becoming negative. A similar trend occurs when Lv is less than 0.15λ and the bias current exceeds 1.6 Ith.
Figure 7b illustrates the impact of different bias currents and compensation intensities kc on sensitivity enhancement, with Lv fixed at 0.2λ. When kc > 0.04%, changes in the bias current have no effect on sensitivity, and enhancement remains consistently above 3 dB. However, when kc < 0.04%, sensitivity can only be enhanced by 3 dB around 1.5 Ith. The optimal sensitivity improvement occurs in the range of kc = 0.08–0.10%.
By combining Figure 7a,b, it is clear that optimal sensitivity enhancement is achieved when the bias current is set to 1.5 Ith. Therefore, the best sensitivity improvement occurs at this value of bias current.

4. Discussion

The preceding section presented a simulation-based analysis of the influence of external parameters on the laser’s behavior. In practical optical fiber fault detection environments, these parameters can be manually adjusted to configure the detection system for optimal performance. However, in addition to these controllable external parameters, there also exist intrinsic parameters of the laser that cannot be modified during actual operation. Previous studies have shown that there exists a critical sensitivity threshold (kcritical) for driving the laser into a nonlinear state. Once the laser is fabricated, internal parameters including the cavity round-trip time and the linewidth enhancement factor are predetermined and cannot be adjusted during the operation. These parameters collectively determine the threshold at which the laser transitions into a nonlinear state.
This section discusses the influence of internal laser parameters on the sensitivity of the detection system to inform the design of lasers with better internal characteristics for higher sensitivity requirements.
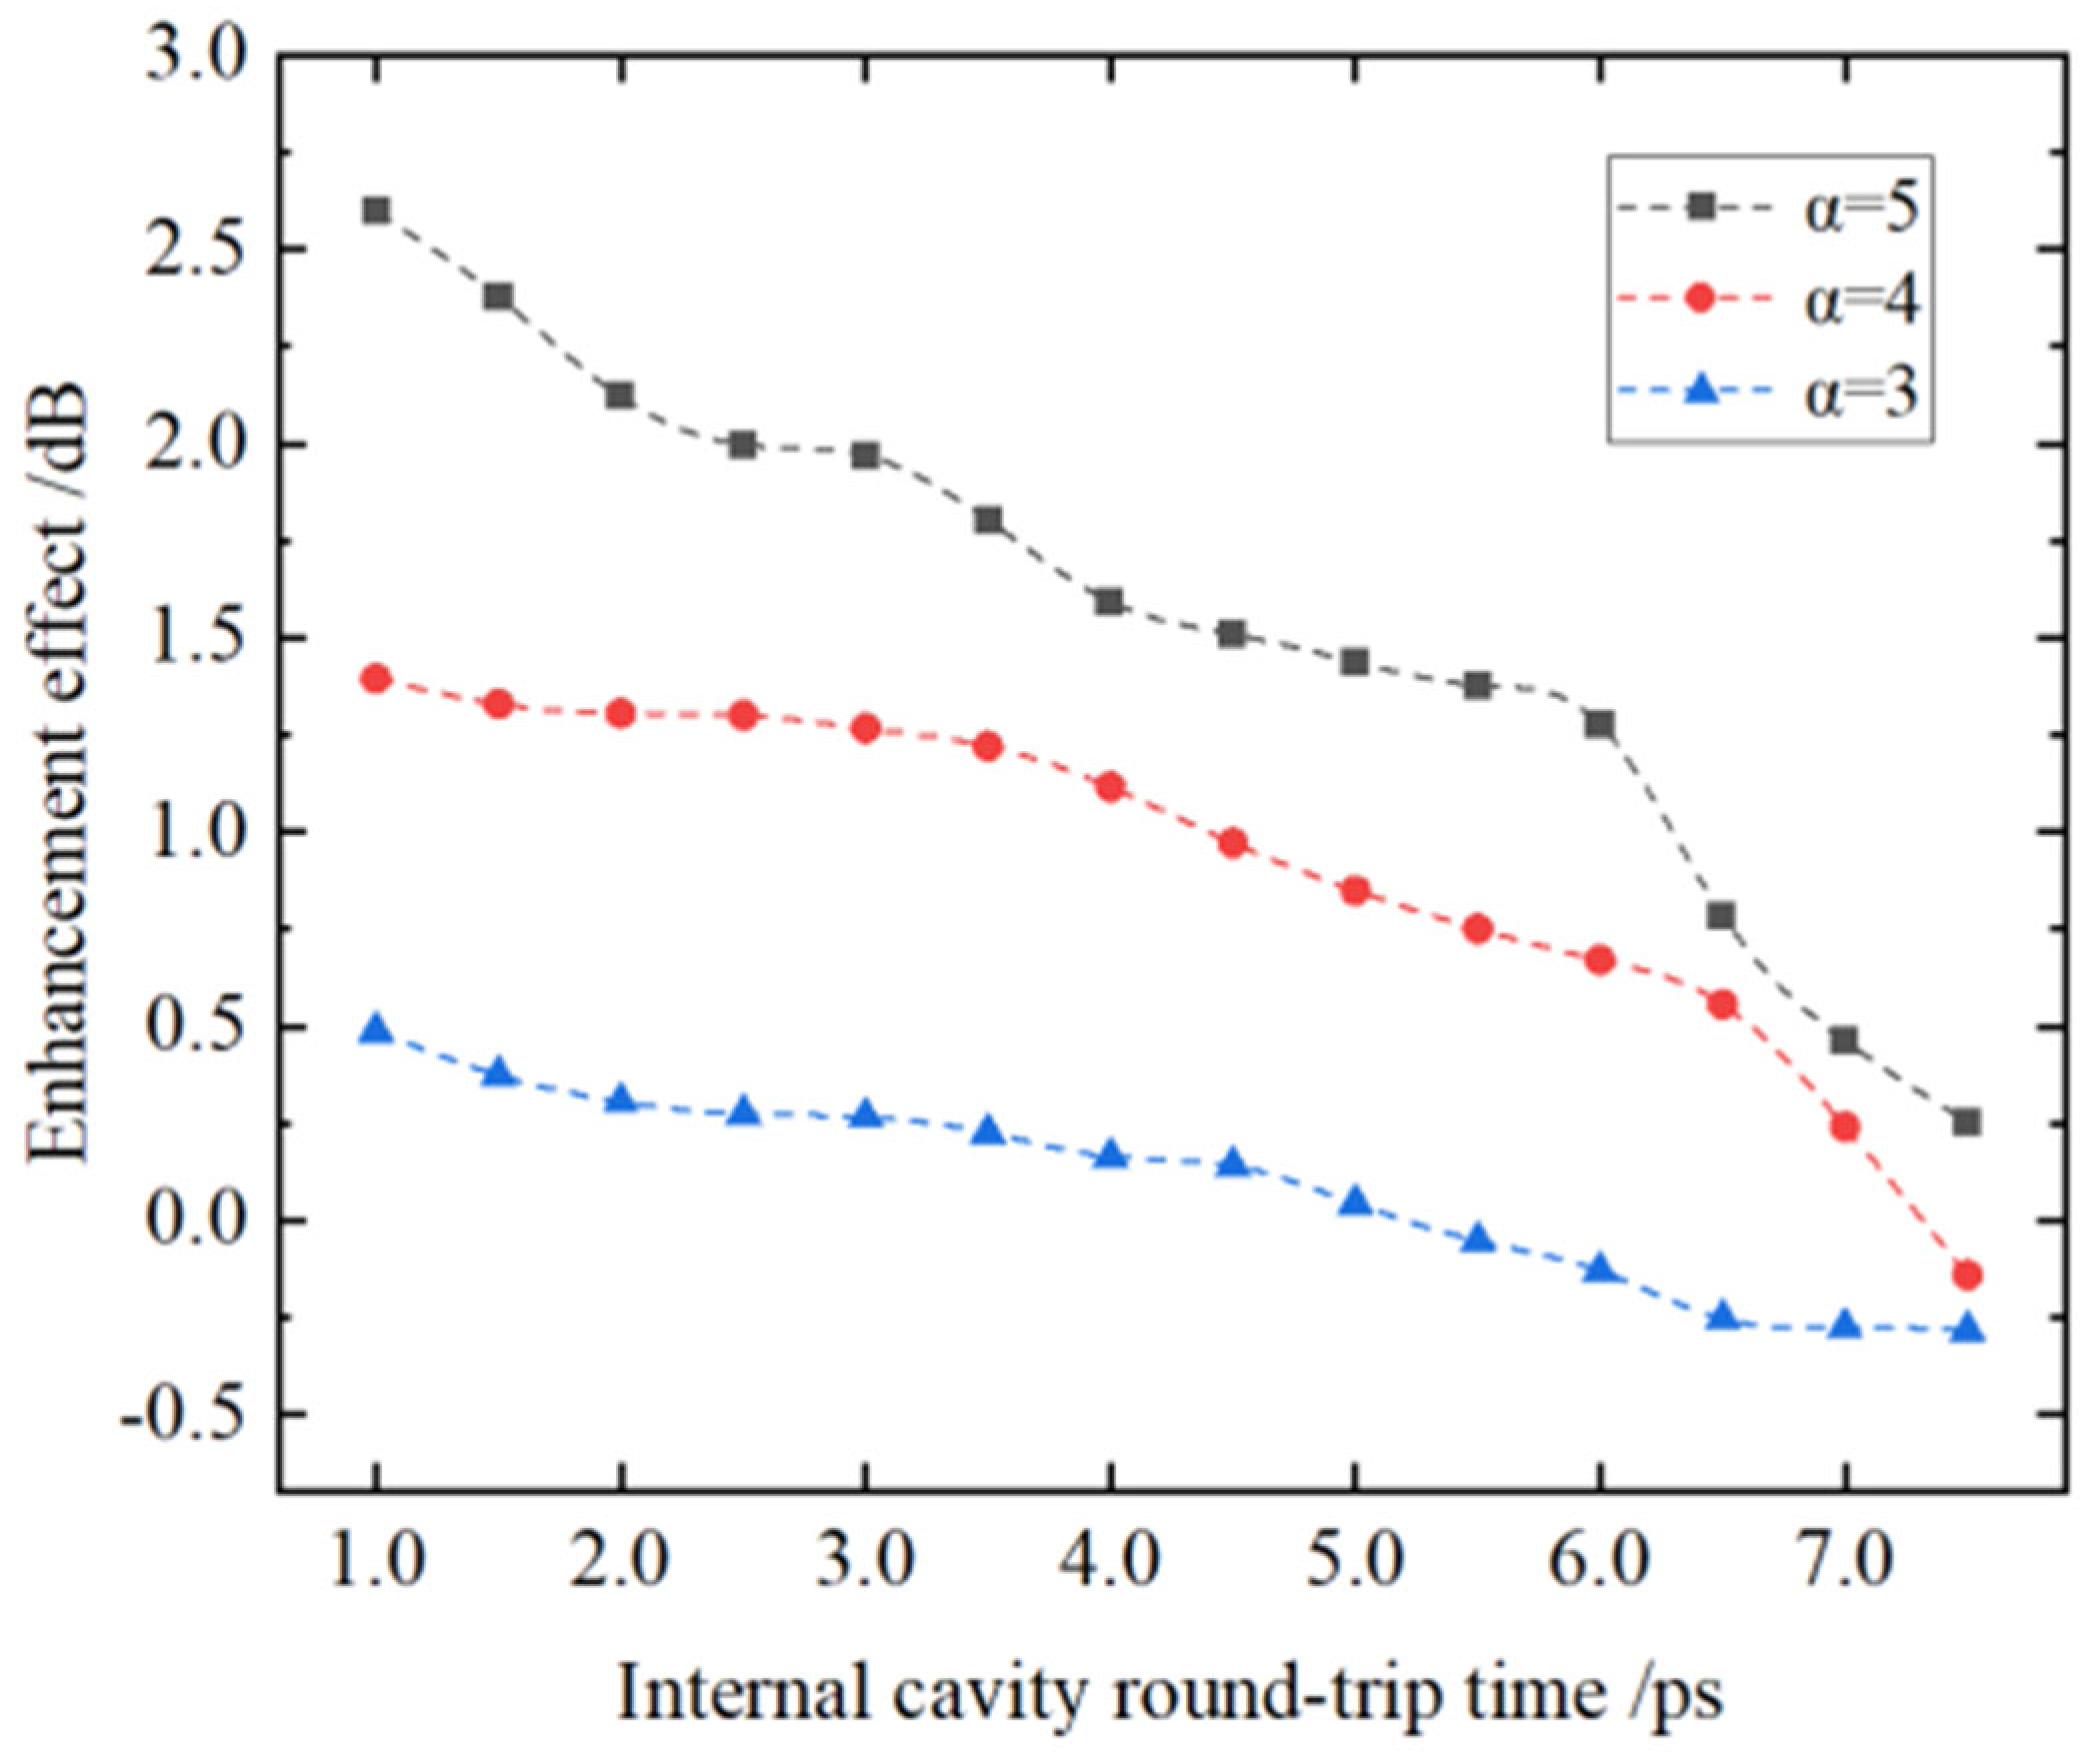
Figure 8 illustrates the relationship between sensitivity enhancement and both the internal cavity round-trip time and the linewidth enhancement factor of the laser. In the figure, the black, red, and blue curves correspond to α values of five, four, and three, respectively. Focusing on the black curve, where the linewidth enhancement factor α is set to five, as the internal cavity round-trip time increases from 1 ps to 7.5 ps, the sensitivity enhancement of the fault detection system decreases from 2.59 dB to 0.25 dB, exhibiting an approximately linear trend. A horizontal comparison of the three curves shows that they all exhibit the same trend, indicating that a shorter internal cavity round-trip time leads to a more significant improvement in sensitivity. A vertical comparison clearly reveals that a larger α results in greater sensitivity enhancement.
These simulation results are consistent with the predicted trends by the formulas derived by J. Helms and K. Petermann [19]. Specifically, shorter internal cavity round-trip times and larger linewidth enhancement factors reduce the critical threshold for the laser to enter a nonlinear state, thereby increasing the detection system’s sensitivity.
Considering that the test branch is connected to an 80:20 coupler with a 20% loss, the fault echo sensitivity is improved by 7.31 dB. Given that the maximum feedback rate of the compensation branch using the 80:20 coupler is 4%, if this coupler is replaced with a 95:5 coupler, the effective branch feedback intensity for the laser would reach 0.25%, which is still much higher than the maximum set value of 0.1% in this study. In this case, the actual sensitivity improvement for the fault echo would reach 8.80 dB, and it supports from 32 to 64 branches enlarged or 22 km extended.

5. Conclusions

This paper presents a simple and cost-effective method for enhancing optical fiber fault detection sensitivity using optical feedback compensation. Simulation results demonstrate a significant improvement in the sensitivity of the fault echo response. Here, sensitivity refers to the system’s responsiveness to weak signals capable of triggering the laser’s nonlinear state, which also quantifies how much signal attenuation can occur before the signal is completely submerged in noise. With kc = 0.09%, Lv = 0.2λ, and the bias current set to 1.5 Ith, the sensitivity is improved by 9.33 dB compared to the original method. Under the optimal parameter configuration, the method enables the supported network scale to expand from 32 to 64 branches, and the maximum detection range is extended by 23.3 km.
This approach addresses the challenges of detecting faults in optical networks with high insertion losses, and further experimental validation is required to confirm its feasibility in practical applications.

Author Contributions

Conceptualization, T.Z.; methodology, H.G. and H.L.; data curation, H.G. and M.Z.; writing—original draft preparation, H.G., M.Z. and Y.G.; writing—review and editing, H.L., X.G. and T.Z.; funding acquisition, X.G., Y.G., H.H. and T.Z. All authors have read and agreed to the published version of the manuscript.

Funding

This research was funded by the Fundamental Research Program of Shanxi Province (20210302123183, 202403021221034, 20210302123185), the National Natural Science Foundation of China (62175176, 62475185), the Development Fund in Science and Technology of Shanxi (YDZJSX2022A010), and the Research Project Supported by the Shanxi Scholarship Council of China (2021–032).

Institutional Review Board Statement

Not applicable.

Informed Consent Statement

Not applicable.

Data Availability Statement

Data underlying the results presented in this paper are not publicly available at this time but may be obtained from the authors upon reasonable request.

Conflicts of Interest

The authors declare no conflicts of interest.

References

  1. Agrawal, G.P. Fiber-Optic Communication Systems; John Wiley & Sons: Hoboken, NJ, USA, 2021. [Google Scholar]
  2. Ali, T.A.; Ameen, J.J.H. Study of Fault Detection Techniques for Optical Fibers. ZANCO J. Pure Appl. Sci. 2019, 31, 143–149. [Google Scholar]
  3. Keiser, G. FTTX Concepts and Applications; John Wiley & Sons: Hoboken, NJ, USA, 2006. [Google Scholar]
  4. Hutcheson, L. FTTx: Current Status and the Future. IEEE Commun. Mag. 2008, 46, 90–95. [Google Scholar] [CrossRef]
  5. Effenberger, F.; Kramer, G.; Li, R.D.; Oron, M.; Pfeiffer, T.; Germany, A.-L. An Introduction to PON Technologies. IEEE Commun. Mag. 2007, 3, S17–S25. [Google Scholar] [CrossRef]
  6. Caviglia, F.; Di Biase, V.C.; Gnazzo, A. Optical Maintenance in PONs. Opt. Fiber Technol. 1999, 5, 349–362. [Google Scholar] [CrossRef]
  7. Yüksel, K.; Wuilpart, M.; Moeyaert, V.; Mégret, P. Novel Monitoring Technique for Passive Optical Networks Based on Optical Frequency Domain Reflectometry and Fiber Bragg Gratings. J. Opt. Commun. Netw. 2010, 2, 463. [Google Scholar] [CrossRef]
  8. Yeh, C.-H.; Chi, S. Fiber-fault monitoring technique for passive optical networks based on fiber Bragg gratings and semiconductor optical amplifier. Opt. Commun. 2006, 257, 306–310. [Google Scholar] [CrossRef]
  9. Zhang, X.; Guo, H.; Jia, X.; Liao, Q. Optimal Matching Approach for Cascaded Encoder in Remote Coding Scheme-based Passive Optical Network Monitoring System. Curr. Opt. Photonics 2018, 2, 407–412. [Google Scholar] [CrossRef]
  10. Esmail, M.A.; Fathallah, H. Physical Layer Monitoring Techniques for TDM-Passive Optical Networks: A Survey. IEEE Commun. Surv. Tutor. 2013, 15, 943–958. [Google Scholar] [CrossRef]
  11. Honda, N. In-Service Line Monitoring for Passive Optical Networks. In Optical Fiber Communications and Devices; Yasin, M., Ed.; InTech: London, UK, 2012; ISBN 978-953-307-954-7. [Google Scholar]
  12. ITU-T G.652 (08/2024); Transmission Systems and Media, Digital Systems and Networks, Transmission Media and Optical Systems Characteristics—Optical Fibre Cables, Characteristics of a Single-Mode Optical Fibre and Cable. International Telecommunication Union: New York, NY, USA, 2024.
  13. Li, X.; Zhang, M.; Guo, H.; Shi, Z.; Guo, Y.; Zhao, T.; Wang, A. Parameter Optimization for Modulation-Enhanced External Cavity Resonant Frequency in Fiber Fault Detection. Photonics 2023, 10, 822. [Google Scholar] [CrossRef]
  14. Zhao, T.; Han, H.; Zhang, J.; Liu, X.; Chang, X.; Wang, A.; Wang, Y. Precise Fault Location in TDM-PON by Utilizing Chaotic Laser Subject to Optical Feedback. IEEE Photonics J. 2015, 7, 6803909. [Google Scholar] [CrossRef]
  15. Zhao, T.; Shen, Z.-R.; Xie, W.-L.; Guo, Y.-Q.; Wang, A.-B.; Wang, Y.-C. Sensitivity to external optical feedback of circular-side hexagonal resonator microcavity laser*. Chin. Phys. B 2021, 30, 120513. [Google Scholar] [CrossRef]
  16. Lang, R.; Kobayashi, K. External optical feedback effects on semiconductor injection laser properties. IEEE J. Quantum Electron. 1980, 16, 347–355. [Google Scholar] [CrossRef]
  17. Salau, T.A.O.; Ajide, O.O. Runge-Kutta Schemes Coefficients Simulation for Comparison and Visual Effects. Engineering 2013, 5, 530–536. [Google Scholar] [CrossRef]
  18. Wang, A.; Wang, B.; Li, L.; Wang, Y.; Shore, K.A. Optical Heterodyne Generation of High-Dimensional and Broadband White Chaos. IEEE J. Select. Top. Quantum Electron. 2015, 21, 531–540. [Google Scholar] [CrossRef]
  19. Helms, J.; Petermann, K. A Simple Analytic Expression for the Stable Operation Range of Laser Diodes with Optical Feedback. IEEE J. Quantum Electron. 1990, 16, 347–355. [Google Scholar] [CrossRef]
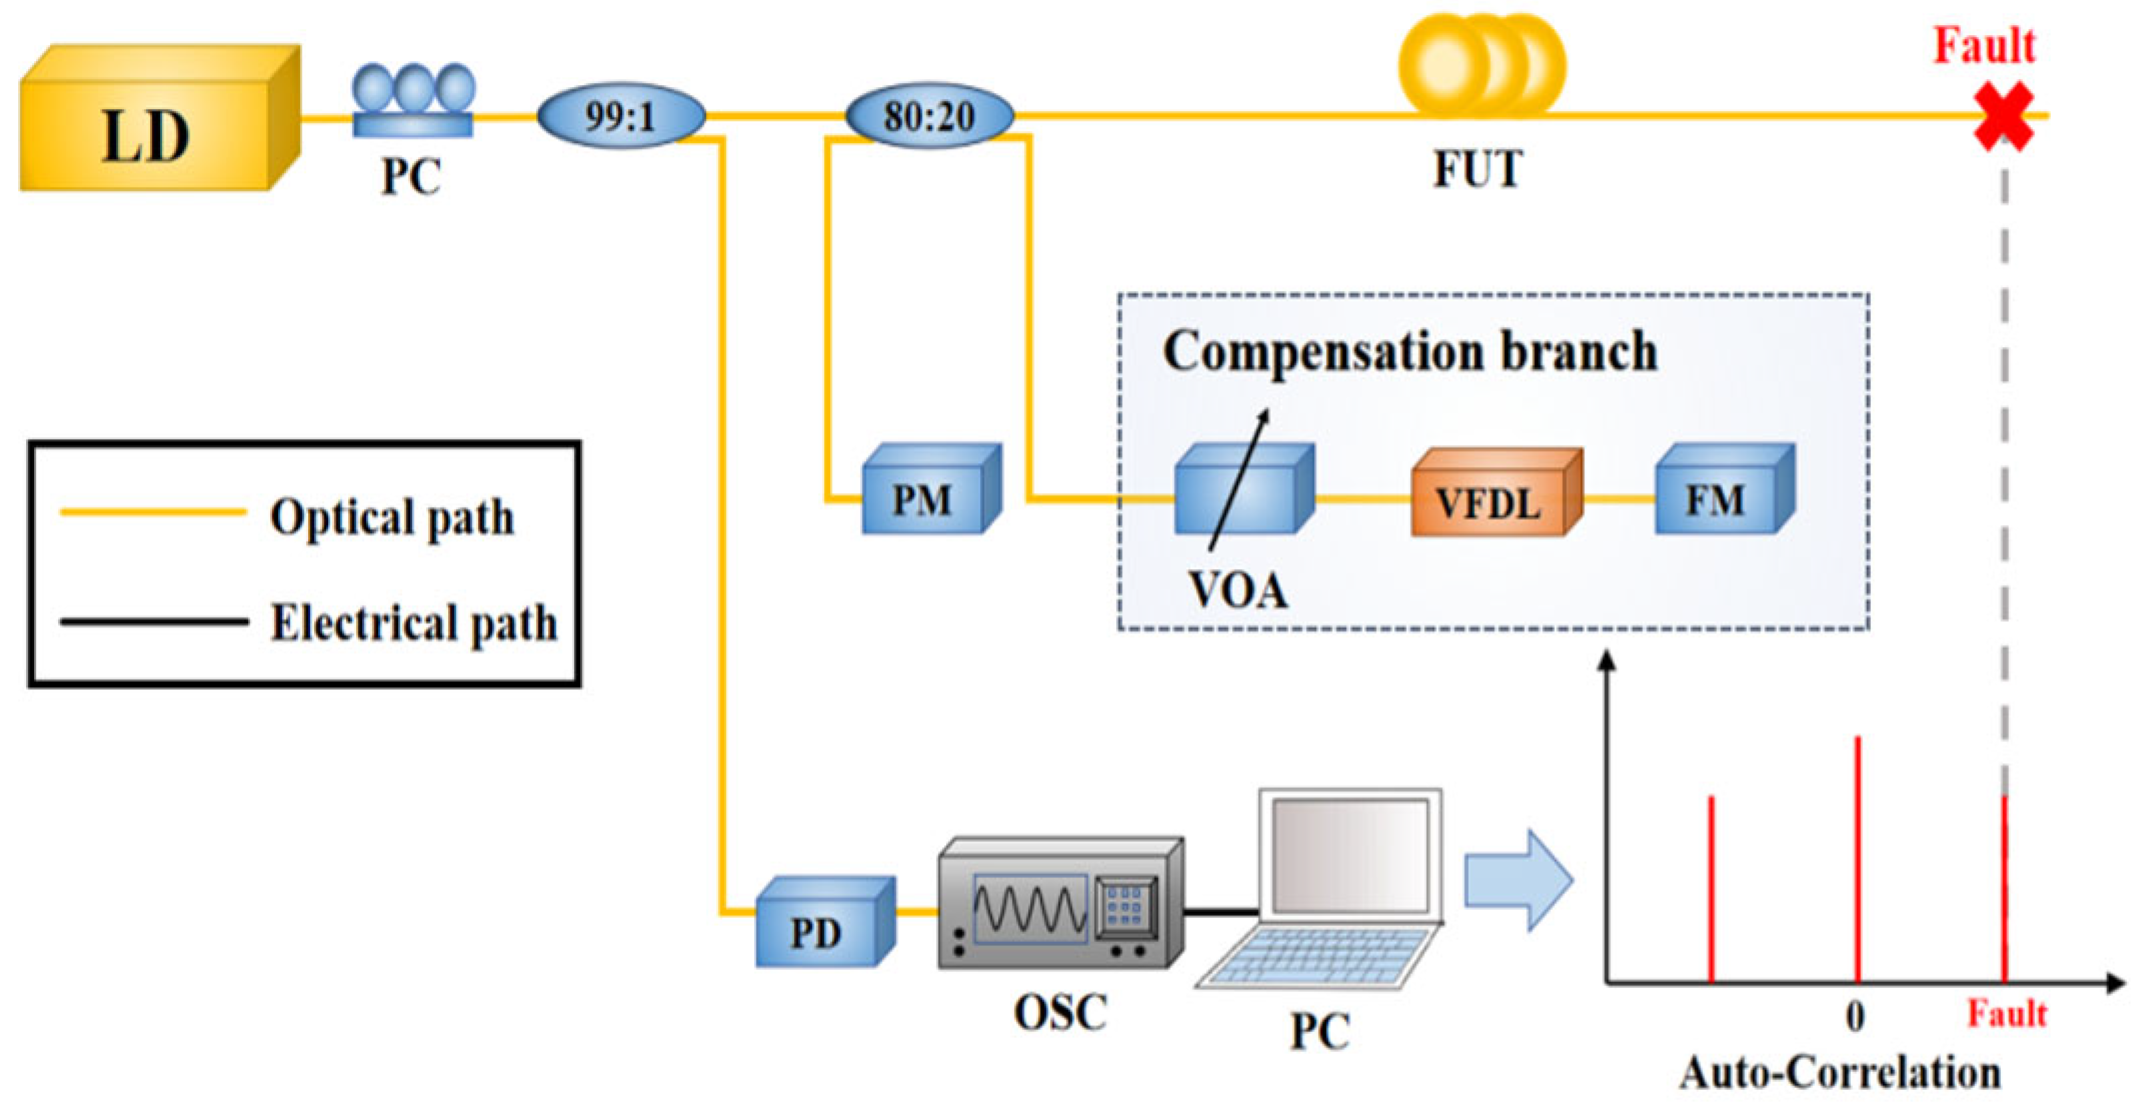
Figure 1. Schematic diagram of the principle of sensitivity enhancement using feedback compensation. LD: laser diode; PC: polarization controller; FUT: fiber under test; PD: photodiode; OSC: oscilloscope; PC: personal computer; VOA: variable optical attenuator; VFDL: variable fiber delay line; FM: fiber mirror; PM: power meter.
Photonics 12 00641 g001
Figure 2. (a) The bifurcation diagram of the laser as a function of the fault feedback strength kf, without (a1) and with (a2) compensation feedback. (b) The auto-correlation function of the laser output corresponding to the gray area (b1) at period state and (b2) quasi-period state. The red represents the maximum value of the laser output, and the blue represents the minimum value.
Photonics 12 00641 g002
Figure 3. Comparison of the bifurcation diagrams of laser output (a) with noise and (b) without noise. The red represents the maximum value of the laser output, and the blue represents the minimum value.
Photonics 12 00641 g003
Figure 4. The impact of different compensation strengths kc on the sensitivity enhancement effect.
Photonics 12 00641 g004
Figure 5. The impact of variable fiber lengths Lv on the sensitivity enhancement effect.
Photonics 12 00641 g005
Figure 6. The impact of compensation parameters on the sensitivity enhancement effect. The sensitivity enhancement effect is negative in the white dash-lines area.
Photonics 12 00641 g006
Figure 7. (a) The influence of the combined action of bias currents and variable fiber lengths on sensitivity enhancement; (b) the influence of the combined action of bias currents and compensation intensities on sensitivity enhancement. The sensitivity enhancement effect is negative in the white dash-lines area.
Photonics 12 00641 g007
Figure 8. The impact of the internal cavity round-trip time and the linewidth enhancement factor on the sensitivity enhancement effect.
Photonics 12 00641 g008
Disclaimer/Publisher’s Note: The statements, opinions and data contained in all publications are solely those of the individual author(s) and contributor(s) and not of MDPI and/or the editor(s). MDPI and/or the editor(s) disclaim responsibility for any injury to people or property resulting from any ideas, methods, instructions or products referred to in the content.