Article

AI-Assisted Plasmonic Coupling Analysis of Spherical Gold Nanoparticles on Substrate

by
Valeria D. Babaylova
1,
Vladislav S. Tuchin
1,2,
Nikita S. Petrov
1,
Aleksey V. Kochakov
1,
Anton A. Starovoytov
1,
Igor A. Gladskikh
1,* and
Daler R. Dadadzhanov
1,*
1
International Research and Education Center for Physics of Nanostructures, ITMO University, 49 Kronverksky Pr., St. Petersburg 197101, Russia
2
Information Technologies and Programming Faculty, ITMO University, 49 Kronverksky Pr., St. Petersburg 197101, Russia
*
Authors to whom correspondence should be addressed.
Photonics 2025, 12(6), 619; https://doi.org/10.3390/photonics12060619
Submission received: 27 May 2025 / Revised: 12 June 2025 / Accepted: 16 June 2025 / Published: 18 June 2025
(This article belongs to the Special Issue Advancements in Optical Metamaterials)

Abstract

A method of electrostatic deposition of CTAB-stabilized gold nanoparticles on a modified APTES and PSS surface was considered. Positively charged gold nanoparticles with a spherical shape were synthesized using a one-step synthesis method with a CTAB surfactant and deposited on a negatively charged modified glass substrate surface with an APTES/PSS layer. Depending on the concentration of the gold nanoparticles, the deposition time, and the modification of the substrate, both isolated nanoparticles with a narrow plasmon peak close to the maximum position in solution, and interacting nanoparticles with varying degrees of plasmonic coupling, were obtained. We also present a deep learning approach for rapid, non-contact estimation of relative plasmon coupling (PC) in gold nanoparticles deposited on substrates using simple camera images. To obtain the training dataset, gold nanoparticles were characterized by the intensity of peaks corresponding to plasmonic coupling in the long-wavelength region of the spectrum. A fully connected neural network was trained to regress PC values from color features, minimizing the mean-squared error. The best model, retrained on the full training set, achieved R2 = 0.83, RMSE = 0.007, MSE = 0.086, and MAE = 0.050 on the test dataset.

1. Introduction

Optical properties of gold nanoparticles (GNPs) are primarily governed by the localized surface plasmon resonance (LSPR) effect [1]. These nanoparticles exhibit a large absorption cross-section and significantly enhance the electromagnetic field in their vicinity, which is essential for amplifying weak absorption and luminescence in organic compounds [2,3,4]. In some cases, GNPs exhibit pronounced chiroptical activity as a result of symmetry breaking, which enhances their ability to interact with circularly polarized light [5,6]. These unique characteristics have enabled GNPs to find widespread applications in light harvesting [7], phase light modulators [8], and biosensors [9], particularly those based on SERS (surface-enhanced Raman spectroscopy) [10] and MEF/MEC (metal-enhanced fluorescence/metal-enhanced chemiluminescence) [11,12]. Due to their sensitivity to the surrounding environment, GNPs are essential for use in refractometric sensors [13]. By precisely adjusting the position of the LSPR through variations in particle size, shape [14,15,16], and relative positioning [17], a wide range of frequency coverage can be achieved, spanning from visible light to the near-infrared spectral range.
Despite the fact that vacuum deposition and ion beam lithography techniques continue to be preferred for the production of two-dimensional structures [18,19], colloidal synthesis enables synthesis of monodispersed nanoparticles of nearly any size and shape [20,21,22]. Furthermore, this method allows for the modification of the nanoparticle surface with the desired ligands directly during the synthesis process. Moreover, colloidal chemistry enables the production of large quantities of nanoparticles, while the development of environmentally friendly synthesis techniques leads to a decrease in undesirable byproducts [23]. In this context, the development of techniques for depositing nanoparticles derived from colloidal solutions onto surfaces is a crucial task.
The main challenge in depositing nanoparticles onto a surface using conventional methods such as drop casting and spin coating lies in their tendency to aggregate and form heterogeneous structures, particularly at the interface during the drying process of the solution. Furthermore, these techniques do not effectively adhere nanoparticles to the substrate. To address these issues, techniques based on the electrostatic attraction between charged nanoparticles and a substrate surface that has been pretreated with different organic molecules, depending on the nanoparticle charge, are employed [24,25].
For specific applications, one may require radically different nanostructures from isolated GNPs, which yield sharp plasmonic peaks ideal for refractive-index-unit (RIU) sensing, to closely spaced assemblies in which interparticle gaps host intense “hot spots” with high near-field enhancement factors capable of amplifying very weak signals. During the transition from discrete nanoparticles to interacting clusters, one observes in the absorption spectra a pronounced broadening of the plasmon band toward longer wavelengths and, ultimately, the rise of a secondary peak [17,19]. However, performing rapid spectral characterization for every sample is often impractical. Thus, it is essential to develop automated means of identifying the resulting structure and assessing its quality via simpler observables—such as the sample’s color—potentially harnessing machine learning algorithms for this task [26].
In the present study, we explore a controlled deposition approach for GNPs onto functionalized glass substrates, exploiting electrostatic attraction to guide assembly. The morphology of the deposited GNPs is governed not only by the deposition duration but, to an even greater extent, by the residual CTAB concentration. Finally, we demonstrate that machine learning models can quickly and automatically evaluate the degree of nanoparticle interactions on substrate surfaces based solely on the visual color of the deposited film.

2. Materials and Methods

2.1. Synthesis of Gold Nanoparticles

A one-step protocol was employed to synthesize spherical GNPs, using the cationic surfactant CTAB as both a stabilizer and electrostatic template [27]. First, 364 mg of CTAB (cetyltrimethylammonium bromide, ≥99, Helicon, Moscow, Russia) was dissolved in 20 mL of deionized water to yield a 0.05 M solution. The mixture was stirred at 2000 rpm and maintained temperature as 50 °C until it became clear. Then, 100  μ L of 0.10 M HAuCl 4 · 3 H 2 O (gold(III) chloride trihydrate, Sigma-Aldrich, Darmstadt, Germany) was introduced; the solution immediately turned pale yellow. Upon addition of 120  μ L of 0.10 M ascorbic acid, the color faded, indicating a reduction of Au 3 + to Au 0 . Finally, 400  μ L of 0.20 M NaOH was added, and, over time, the solution color evolved from violet to deep burgundy, signaling nanoparticle nucleation and growth. The suspension was then left at room temperature for 12 h without mixing to complete the reaction, yielding a stable burgundy colloid.
Immediately prior to deposition onto dielectric substrates, excess CTAB was removed by three successive centrifugation cycles at 10,000–12,000 rpm: after each spin, the supernatant was discarded and the pellet re-dispersed in deionized water to the original volume. This procedure produced monodisperse, CTAB-capped GNPs carrying a net positive surface charge. Extinction spectra recorded on an SF-56 spectrophotometer (OKB “Spektr”–LOMO) over 300–1100 nm (1 nm step) revealed a pronounced plasmon peak at 523 nm. According to Mie-calculator [28], this resonance position corresponds to a core diameter of approximately 23 nm in water; accounting for the CTAB shell (which raises the local permittivity) suggests an overall particle size slightly larger. The full width at half-maximum (FWHM) of the plasmon band was 50 nm (~1832 cm 1 ), consistent with moderate monodispersity.

2.2. Deposition of Nanoparticles on Functionalized Glass Substrate

The deposition procedure was adapted from the method for nanorod deposition with some modifications [29]. For the deposition of GNPs, colorless 1 mm thick microscope glass slides were used as substrates. The glass slides were sequentially rinsed with deionized water and isopropyl alcohol, wiped with a lint-free paper, and then subjected to 10 min of oxygen plasma treatment (PE25-JW, Plasma Etch, Carson City, NV, USA) to enhance adhesion of subsequent surface modifiers. Cleaned substrates were immersed in a 1:100 (v/v) solution of (3-aminopropyl)triethoxysilane (APTES, 98 %, Sisco Research Laboratories, Mumbai, India) in ethanol for 1 h at room temperature in the dark. The APTES solution was prepared immediately before use. Afterward, the slides were rinsed twice for 5 min each in ethanol to remove unbound APTES, followed by two 5 min rinses in deionized water, and drying under a gentle nitrogen stream. To strengthen the Si–O–Si linkage and stabilize the silane layer, the substrates were annealed at 120 °C for 1 h. Next, a 0.286 M (20 mg/mL) aqueous solution of poly(sodium 4-styrenesulfonate) (PSS, Sigma-Aldrich, Darmstadt, Germany) was prepared and stirred until fully dissolved. The silanized slides were immersed in the PSS solution for 1 h in the dark and then rinsed in deionized water for 5 min and dried under nitrogen. Finally, the substrates were submerged in GNP suspensions of varying concentrations for predetermined time intervals. After deposition, each slide was rinsed in deionized water to remove non-adsorbed nanoparticles.
Figure 1 presents a schematic of the preparation process for depositing GNPs. Glass carries a negative surface charge due to deprotonated silane groups (Si– O ) formed upon exposure to ambient moisture [30]. The APTES layer renders the surface positively charged, while the subsequent PSS coating re-imparts a negative charge, creating a stable bilayer capable of electrostatically binding CTAB-capped GNPs. Systematic variation of immersion time and nanoparticle concentration allowed optimization of adsorption conditions. Control experiments using direct deposition onto unmodified glass (without APTES/PSS) followed by rinsing showed negligible nanoparticle attachment, underscoring the necessity of this multistep surface functionalization for robust nanoparticle immobilization.

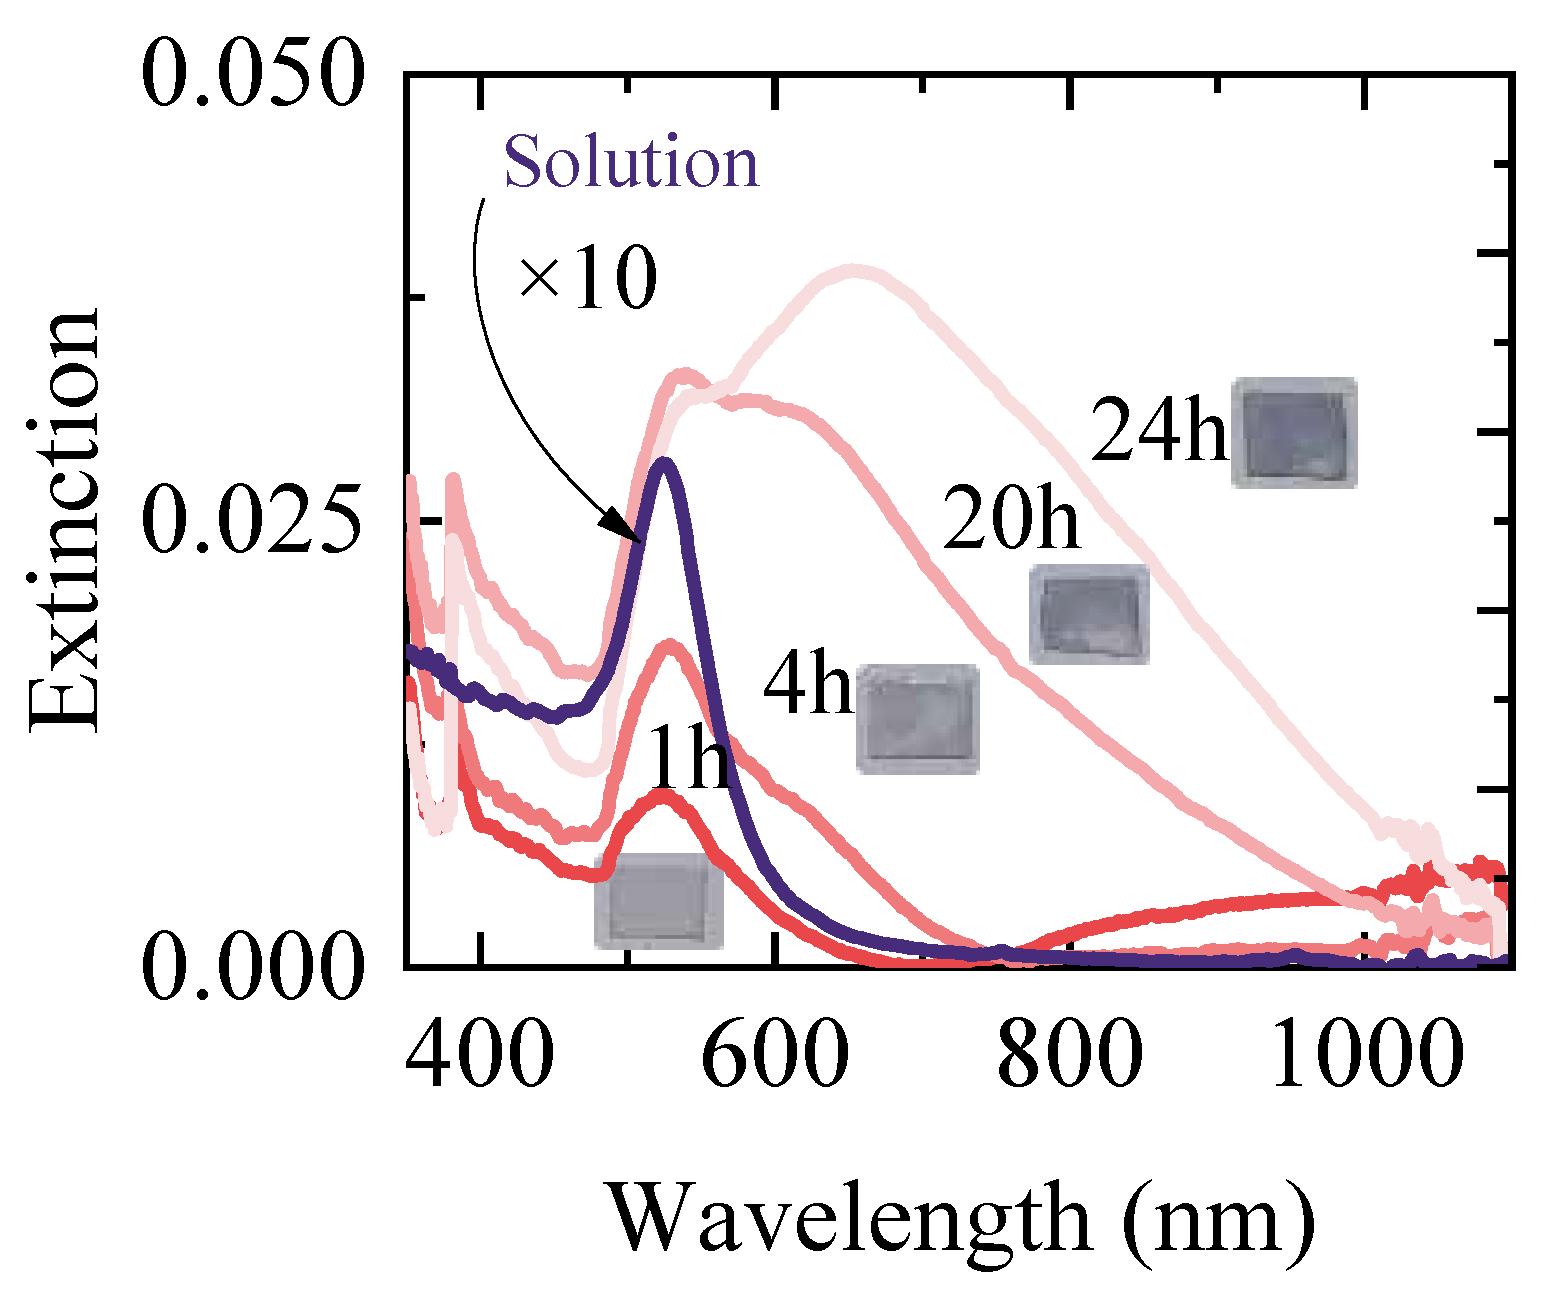
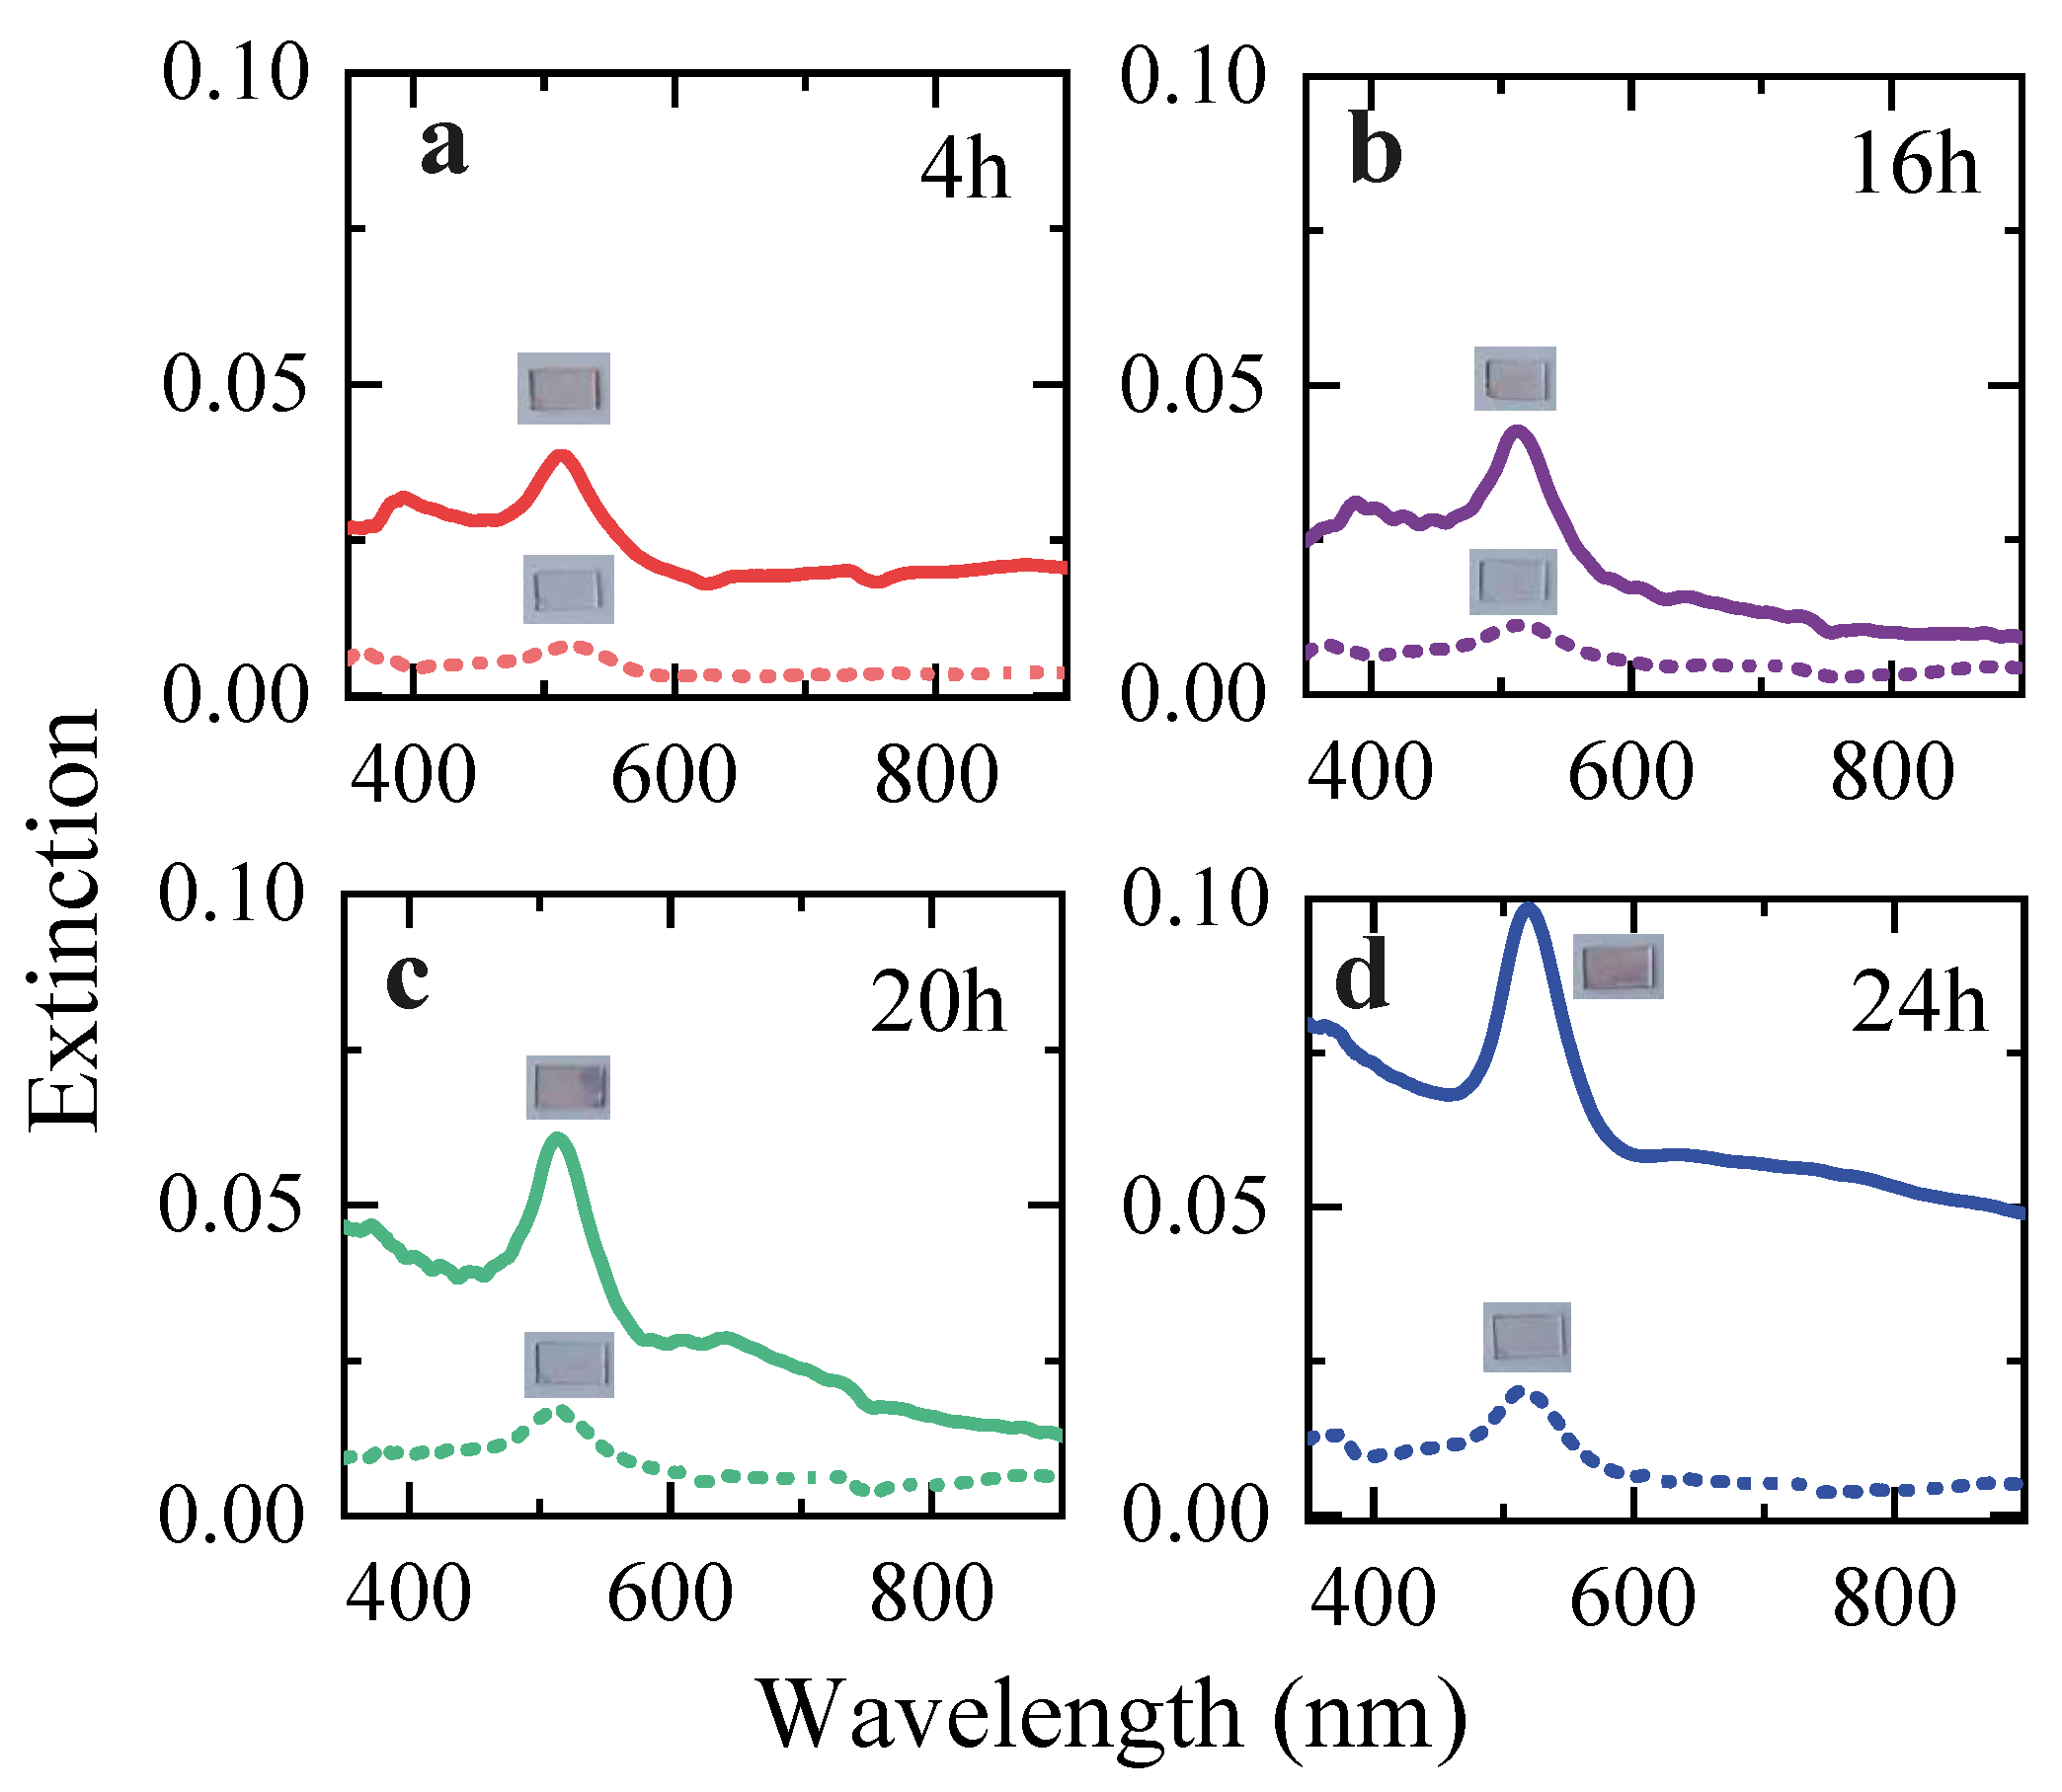
3. Results and Discussion

In Figure 2, extinction spectra are shown for GNPs deposited on substrate from 5 × 10 7   M GNPs colloidal solution onto APTES/PSS-functionalized substrates after varying incubation times (1–24 h). Two characteristic bands appear: A short-wavelength peak at ~523 nm, corresponding to the localized surface plasmon resonance of isolated particles, whose intensity increases with incubation time. A broad long-wavelength band (>600 nm), arising from near-field plasmon–plasmon coupling between neighboring particles.
For incubation times beyond 20 h, the long-wavelength band becomes dominant, possibly indicating the transition from a sparse to a dense particle distribution. Insets in Figure 2 visually illustrate both increased color saturation and a darker hue of the films, consistent with higher particle loading. During deposition, nanoparticles adhere randomly to the substrate, yielding both isolated particles whose resonance remains close to that in colloidal suspension (modulated by the local refractive index) and more complex, interacting aggregates. At early times, isolated particles predominate; as surface coverage grows, interparticle spacing decreases, enhancing plasmon–plasmon coupling and giving rise to new resonances in the long-wavelength region [17].
The observed red shift ( Δ λ ≈ 35 nm) and broadening of the long-wavelength band for deposition after 1 h compared to 24 h correlate with reduced interparticle separation, in agreement with the coupled dipole approximation (CDA) [31,32]. When gaps fall below 5 nm, strong near-field interactions hybridize plasmon modes and generate “hot spots” with highly intensified electromagnetic fields [33].
The efficiency of GNP deposition at a fixed time has a significant dependence on the concentration of the colloidal solution (Figure 3). Solutions of GNPs in CTAB were prepared by dilution, and the concentration was determined from absorption spectra: from 0.25 μ M to 5 μ M, optimal monolayer coverage is achieved with maximum optical density in the short-wavelength band of single plasmon oscillations, as well as in the long-wavelength band of hot spots. Higher concentrations (5 μ M) lead to the adsorption of CTAB micelles, which block the binding of GNPs [29], since PSS-modified substrates have a negative charge sufficient to bind positively charged CTAB-stabilized GNPs; however, this also causes the repulsion of free CTAB micelles, which have a greater charge that is not compensated by PSS [34,35]. At 0.25 μ M, based on extinction spectra, there is a sparse distribution of GNPs and aggregation of nanoparticles (the long-wavelength band is significantly broadened), indicating partial desorption of CTAB, which reduces colloidal stability.
To confirm the reproducibility of the GNP deposition method, a series of experiments were conducted by varying the time (4, 16, 20, 24 h) and the concentration of the colloidal solution (1 μ M, and 0.35 μ M). The extinction spectra (Figure 4) of all samples demonstrate a maximum of the LSPR around 515 nm with a FWHM of 55 nm, confirming the moderate monodispersity of the deposited particles and the absence of aggregation. The observed blue shift of the peak for GNPs on a substrate relative to the initial colloidal solution with a GNP is due to the change in the dielectric environment of the nanoparticles [36]: the transition from the liquid phase ( n 1.33 for water) to the glass substrate ( n 1.46 ) reduces the effective refractive index near GNPs. An additional contribution comes from the substrate coupling effect, related to the redistribution of the electromagnetic field between GNPs and the substrate.
The dependence of optical density at the maximum of plasmon resonance on deposition time is linear. Visual analysis of the sample photographs reveals a gradual darkening of the color from pale pink (t = 4 h) to purple (t = 24 h), correlating with an increase in coverage density.

4. Neural Network Architecture and Hyperparameter Optimization

In this section, we present the design of a neural network model for regression, the process of hyperparameter optimization, and the final performance evaluation of the best model. Additionally, we describe how the dataset was collected and processed, including both the imaging-based feature extraction and the computation of the target variable from spectral measurements.

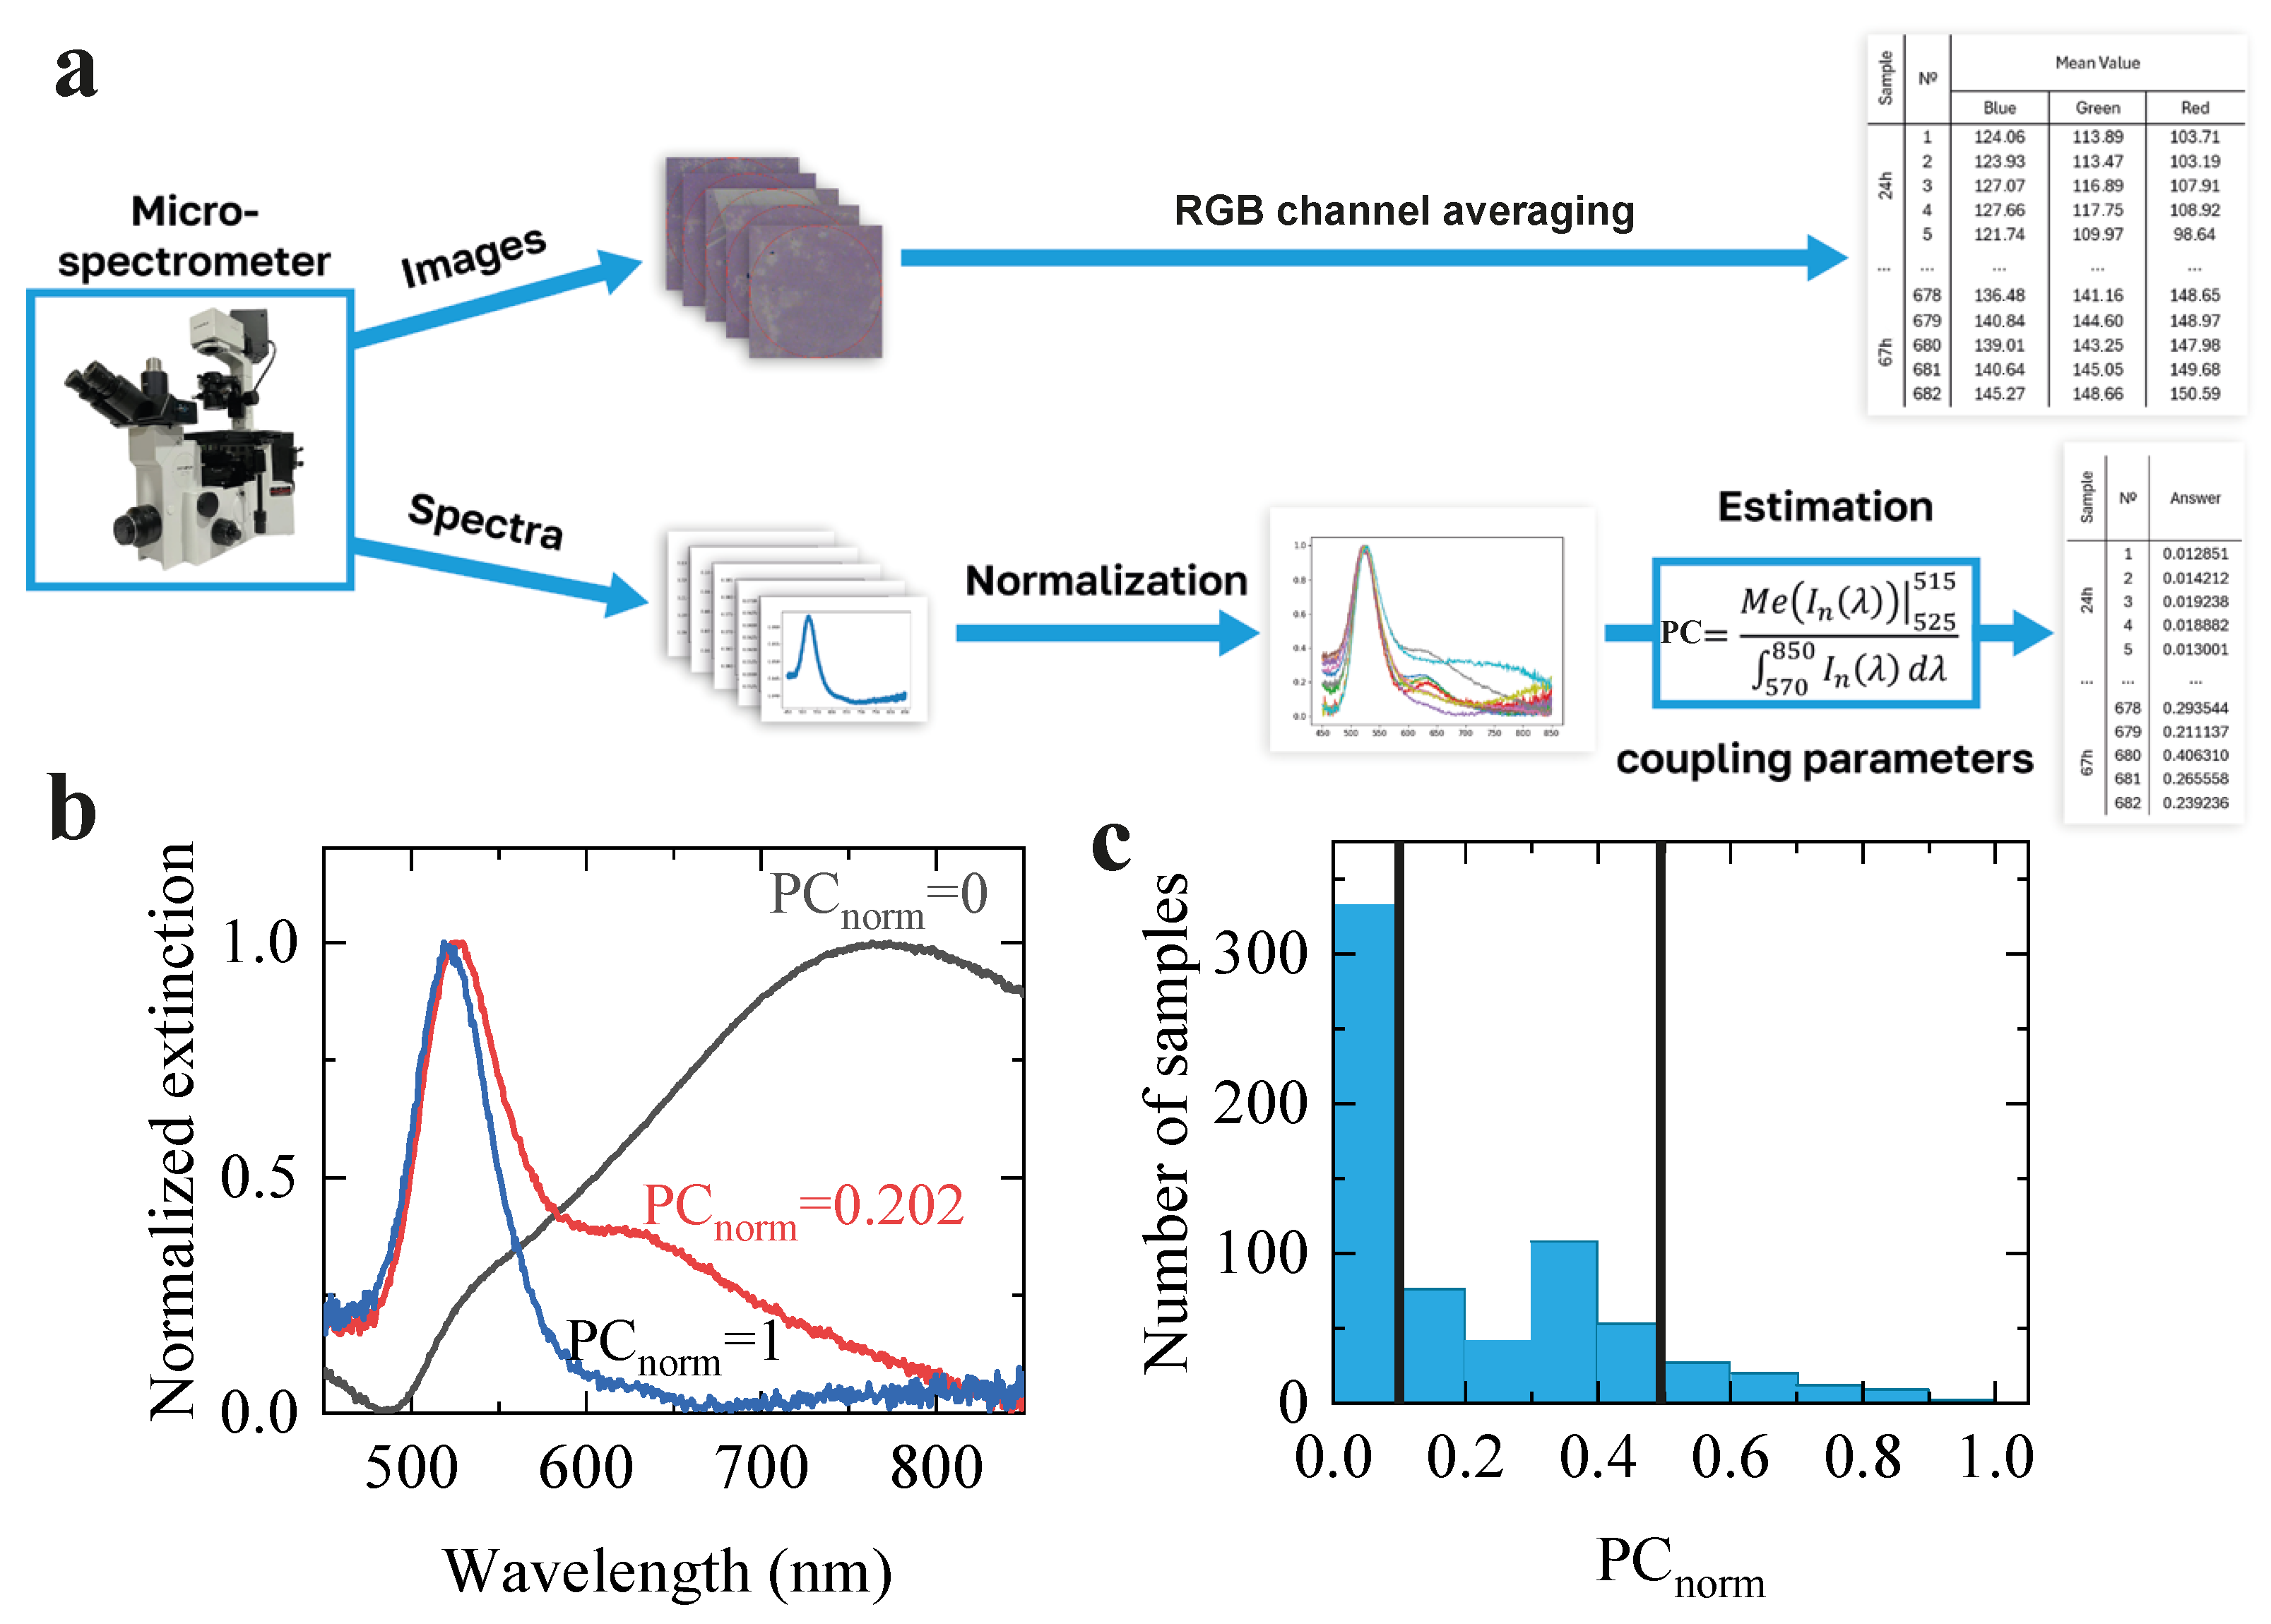
4.1. Data Collection and Processing

The dataset used in this study was constructed through a two-stage acquisition pipeline involving both imaging and spectroscopic measurements, as can be seen in Figure 5a. First, images of sample regions were captured using a camera. From each image, a specific region of interest (ROI) was extracted, and the mean intensity values of red (R), green (G), and blue (B) color channels were computed. These three values served as the input features for the model. Simultaneously, an extinction spectrum was obtained for each ROI on the image using a spectrometer connected to the microscope. These raw spectra were normalized by their maximum intensity to bring all values into a consistent scale. From the normalized spectrum, a target value (PC) was computed as the median value of the normalized intensity I n in the wavelength ( λ ) range 515–525 nm divided by the integral of the normalized intensity over the range 570–850 nm, as shown in Equation (1):
P C = Me I n ( λ ) | λ = 515 n m λ = 525 n m 515 n m 850 n m I n ( λ ) d λ
The selected wavelength ranges were based on known spectral features of spherical GNPs with small sizes (approximately less than 50 nm). The 515–525 nm range mainly captures the main plasmon peak of isolated GNPs, while the 570–850 nm range reflects plasmon-coupled GNPs [37,38].
The overall acquisition and data processing pipeline is illustrated in Figure 5.
Each such combination of input features and computed target values forms a single data sample. In total, 682 samples were collected following this procedure. These structured data pairs were then used to train and evaluate a neural network model to predict the target function from the color channel features. To ensure the reliability of model training and evaluation, we conducted an initial analysis of the dataset. The target variable ( PC n o r m ) was computed from normalized absorption spectra by Equation (1) and was scaled to the [0, 1] range using the MinMaxScaler technique. Similarly, the RGB input features were also normalized to the [0, 1] range to ensure numerical stability during training and to improve model convergence. The target variable was categorized into three levels of nanoparticle interaction (Figure 5b) according to the following rules: high plasmonic coupling (target ≤ 0.1); low plasmonic coupling (0.1 < target ≤ 0.5); and isolated nanoparticles (target > 0.5). A histogram of the normalized PC values is presented in Figure 5c, which clearly shows a significant imbalance: the majority of samples fall within the 0–0.1 range. To address this imbalance and ensure that both the training and test sets contain a representative distribution of target values, we applied a stratified data splitting strategy. The normalized target values were divided into 10 discrete bins, and a stratified train–test split was performed using an 80/20 ratio. This approach helped preserve the overall target distribution in both subsets and reduced the risk of overfitting to dominant target regions.

4.2. Model Architecture

We developed a fully connected feedforward neural network to perform regression analysis based on three input features: the mean values of the R, G, and B color channels extracted from a cropped region of a sample image. The model was implemented using the PyTorch deep learning framework (v2.6.0) [39]. The model predicts a continuous target value derived from absorption spectra, the acquisition of which was described earlier. The target and features were normalized into the range [0, 1] and rounded to four decimal places. The neural network architecture is flexible and customizable, with its structure controlled by hyperparameters. Each model instance consists of a configurable number of hidden layers, defined by the hyperparameter num_layers. The size of each hidden layer is set individually via layer_sizes, allowing each layer to have a different number of neurons. These sizes are determined by separate hyperparameters for each layer, enabling the construction of non-symmetric architectures with varying capacity across layers, which helps the model adapt to the complexity of the regression task. Each hidden layer is followed by a ReLU activation function. Additional architectural options include batch normalization controlled by use_batchnorm and dropout regularization controlled by use_dropout, with the dropout probability specified by dropout_p. The final output layer is a fully connected layer with a single neuron, suitable for regression.

4.3. Optimization and Hyperparameter Searching

We used mean-squared error (MSE) as the loss function during training. The model parameters were optimized using the Adam optimizer, with the learning rate (lr) treated as a tunable hyperparameter. During hyperparameter optimization, the learning rate scheduler (use_scheduler) could be enabled in some trials using the StepLR strategy, which reduces the learning rate by a factor of 0.5 every 50 epochs. This allowed for better convergence in certain settings by gradually decreasing the learning rate as training progressed. To systematically search for the best hyperparameters, we used Optuna (v4.3.0) [40], a modern hyperparameter optimization framework. The following hyperparameters were explored: num_layers—number of hidden layers (1–10); layer_sizes—individual size of each hidden layer (chosen from 16, 32, 64, 128); lr—learning rate (log-uniform between 10 4  and 10−2); use_dropout—whether to apply dropout (True/False); dropout_p—dropout probability (0.1–0.5); use_batchnorm—whether to apply batch normalization (True/False); and use_scheduler—whether to apply learning rate scheduling (True/False). Each trial involved training a new model for 500 epochs. The objective function minimized the root mean-squared error (RMSE) in a test set. The dataset was stratified into bins based on the target value distribution to ensure balanced sampling during train–test splitting.
After running 1000 trials, the best configuration was selected based on the lowest RMSE. The best neural network was configured with three hidden layers of sizes [32, 128, 32], used batch normalization (enabled) and did not apply dropout. The learning rate was set at 0.00142 and was scheduled using the StepLR strategy with a decay factor of 0.5 every 50 epochs. Figure 6 shows the real images of the camera samples with the true and predicted PC value. In most cases, the model performs well in predicting the extent of plasmon coupling. Below are the metrics obtained on the test set: R 2 = 0.8227 , RMSE = 0.0902, MSE = 0.0081, and MAE = 0.0491. These results demonstrate the effectiveness of using a tunable neural network architecture along with a systematic hyperparameter search to solve a low-dimensional regression problem.
In addition to designing and optimizing the neural network, we also evaluated the performance of several simpler machine learning (ML) models for comparison. Specifically, we implemented regularized linear regression models, Ridge and Lasso from the scikit-learn library (v1.7) [41], and a gradient boosting model using XGBoost [42]. For each of these models, a hyperparameter optimization procedure was performed using Optuna (v4.3.0) with 1000 trials, similar to the search performed for the neural network. For Ridge and Lasso regressions, the regularization parameter alpha was optimized over a log-uniform range from 1 × 10⁻³ to 1 × 10³. For XGBoost, multiple parameters were tuned, including the number of estimators, the maximum depth of the tree, the learning rate, the sub-sample ratio, the column sampling ratio per tree, the minimum loss reduction (gamma), and the L1 and L2 regularization terms.
The best hyperparameter configuration for Ridge regression was achieved with an alpha value of 0.156. For Lasso regression, the optimal alpha was found to be 0.001. In the case of XGBoost, the most effective setup involved 99 estimators, a maximum depth of 10, a learning rate of approximately 0.179, and a sub-sample ratio close to 0.837. The model also performed best with a column sampling ratio per tree of about 0.718, a gamma value of 0.0005, and regularization terms set to roughly 0.553 for L1 and 0.776 for L2. The final performance metrics for each model on the test set are summarized below. These results (see Table 1) show that while XGBoost achieved performance comparable to the neural network, the neural model slightly outperformed all other models in terms of both accuracy (R2) and error metrics (MAE, RMSE, MSE).
In contrast, Ridge and Lasso regressions showed noticeably weaker results, indicating that linear models are insufficient to capture the underlying patterns in the data. Although the neural network and XGBoost exhibited similar performance overall, the neural model achieved a lower MAE by a meaningful margin and also demonstrated a slight advantage in R2. This comparison underscores the effectiveness of using a tunable neural architecture for this specific regression task and supports the reliability of the results through benchmarking against multiple modeling approaches.

5. Conclusions

Spherical gold nanoparticles were synthesized using a chemical reduction method in the presence of a surface stabilizer, CTAB, and subsequently deposited onto substrates pre-functionalized with APTES and PSS. During deposition, the negatively charged outer PSS layer of the substrate interacted with the positively charged CTAB-stabilized particles. The resulting film morphology ranging from sparse distributions of individual nanoparticles to dense aggregated structures is governed by parameters such as nanoparticle and CTAB concentrations in the solution, as well as the incubation time.
To enable rapid, non-invasive assessment of relative plasmon coupling (PC) in these films, we developed a machine learning model that predicts the degree of coupling based solely on visual color features. A fully connected feedforward neural network was trained to regress PC values from the mean R, G, and B channel intensities extracted from sample images. Both the RGB features and the PC target values were scaled to the [0, 1] range to ensure numerical stability. The model was trained using the Adam optimizer with the mean-squared error (MSE) as the loss function. To identify the most effective architecture and training strategy, we conducted an extensive hyperparameter search using Optuna over 1000 trials. This included tuning the number of hidden layers (1–10), neuron counts per layer (16–128), learning rate, dropout probability, batch normalization, and optional learning rate scheduling (StepLR with decay factor of 0.5 every 50 epochs). Each configuration was trained for 500 epochs on a stratified train–test split, and the final model was retrained using the best configuration.
In parallel, we evaluated simpler machine learning models, including Ridge and Lasso regressions, as well as XGBoost. All models underwent comparable hyperparameter tuning using Optuna. The neural network ultimately achieved the best performance, with R 2 = 0.8227, RMSE = 0.0902, MSE = 0.0081, and MAE = 0.0491 on the test set. These results were slightly better than those of the best-tuned XGBoost model and significantly better than those from Ridge and Lasso regressions. This comparison (see Table 1) highlights the effectiveness of a tunable neural architecture for this low-dimensional regression task and confirms the reliability of the proposed approach through validation across multiple modeling techniques.
Overall, our findings demonstrate the potential of using simple visual color features to predict the degree of plasmon coupling with high accuracy. This enables a rapid, cost-effective, and scalable assessment of nanoparticle film morphology, offering practical advantages for real-time monitoring in both research and industrial settings.

Author Contributions

Conceptualization, D.R.D.; investigation, V.D.B., N.S.P., A.V.K., V.S.T., A.A.S., I.A.G. and D.R.D.; writing—original draft preparation, V.D.B., A.V.K. and V.S.T.; writing—review and editing, A.A.S., I.A.G. and D.R.D.; visualization, V.D.B., N.S.P., V.S.T., D.R.D. and I.A.G.; supervision, D.R.D. and I.A.G.; project administration, A.A.S. and D.R.D.; funding acquisition, D.R.D. All authors have read and agreed to the published version of the manuscript.

Funding

This work was supported by ITMO University Research Projects in AI Initiative (RPAII), (Project 640098).

Institutional Review Board Statement

This study did not require ethical approval.

Informed Consent Statement

Not applicable.

Data Availability Statement

The authors confirm that the data supporting the findings of this study are available within the article.

Conflicts of Interest

The authors declare no conflicts of interest.

References

  1. Alekseeva, A.; Bogatyrev, V.; Khlebtsov, B.; Mel’Nikov, A.; Dykman, L.; Khlebtsov, N. Gold nanorods: Synthesis and optical properties. Colloid J. 2006, 68, 661–678. [Google Scholar] [CrossRef]
  2. Becerril-Castro, I.B.; Calderon, I.; Pazos-Perez, N.; Guerrini, L.; Schulz, F.; Feliu, N.; Chakraborty, I.; Giannini, V.; Parak, W.J.; Alvarez-Puebla, R.A. Gold Nanostars: Synthesis, Optical and SERS Analytical Properties. Anal. Sens. 2022, 2, e202200005. [Google Scholar] [CrossRef]
  3. Dadadzhanov, D.R.; Vartanyan, T.A.; Dadadzhanova, A.I.; Karabchevsky, A. Surface-enhanced near-infrared absorption (SENIRA) of C-H and N-H groups with gold nanoarray. In Proceedings of the Quantum Sensing and Nano Electronics and Photonics XVII; Razeghi, M., Lewis, J.S., Khodaparast, G.A., Khalili, P., Eds.; International Society for Optics and Photonics, SPIE: Pune, India, 2020; Volume 11288, p. 1128816. [Google Scholar] [CrossRef]
  4. Dadadzhanov, D.R.; Vartanyan, T.A.; Karabchevsky, A. Vibrational overtones spectroscopy enabled by plasmonic nanoantennas. In Proceedings of the Plasmonics: Design, Materials, Fabrication, Characterization, and Applications XVI; SPIE: Pune, India, 2018; Volume 10722, pp. 112–116. [Google Scholar]
  5. Kuznetsova, V.; Kadar, A.; Gaenko, A.; Er, E.; Ma, T.; Whisnant, K.G.; Ma, J.; Ni, B.; Mehta, N.; Kim, J.Y.; et al. Graph–Property Relationships for Complex Chiral Nanodendrimers. ACS Nano 2025, 19, 6095–6106. [Google Scholar] [CrossRef] [PubMed]
  6. Sapunova, A.A.; Yandybaeva, Y.I.; Zakoldaev, R.A.; Afanasjeva, A.V.; Andreeva, O.V.; Gladskikh, I.A.; Vartanyan, T.A.; Dadadzhanov, D.R. Laser-Induced Chirality of Plasmonic Nanoparticles Embedded in Porous Matrix. Nanomaterials 2023, 13, 1634. [Google Scholar] [CrossRef]
  7. Zhu, H.; Yuan, X.; Yao, Q.; Xie, J. Shining photocatalysis by gold-based nanomaterials. Nano Energy 2021, 88, 106306. [Google Scholar] [CrossRef]
  8. Jagannath, G.; Eraiah, B.; NagaKrishnakanth, K.; Rao, S.V. Linear and nonlinear optical properties of gold nanoparticles doped borate glasses. J. Non-Cryst. Solids 2018, 482, 160–169. [Google Scholar] [CrossRef]
  9. Pasparakis, G. Recent developments in the use of gold and silver nanoparticles in biomedicine. WIREs Nanomed. Nanobiotechnol. 2022, 14, e1817. [Google Scholar] [CrossRef]
  10. Maleeva, K.; Dadadzhanov, D.; Palekhova, A.; Kaliya, I.; Tkach, A.; Baranov, A.; Bogdanov, K. SERS substrates based on polymer-protected self-assembled plasmonic films with gold nanoparticles as enhancing element of a microfluidic sensor. Opt. Mater. 2023, 146, 114581. [Google Scholar] [CrossRef]
  11. Dadadzhanov, D.R.; Gladskikh, I.A.; Baranov, M.A.; Vartanyan, T.A.; Karabchevsky, A. Self-organized plasmonic metasurfaces: The role of the Purcell effect in metal-enhanced chemiluminescence (MEC). Sens. Actuators B Chem. 2021, 333, 129453. [Google Scholar] [CrossRef]
  12. Geddes, C.D.; Lakowicz, J.R. Metal-enhanced fluorescence. J. Fluoresc. 2002, 12, 121–129. [Google Scholar] [CrossRef]
  13. Wu, W.T.; Chen, C.H.; Chiang, C.Y.; Chau, L.K. Effect of Surface Coverage of Gold Nanoparticles on the Refractive Index Sensitivity in Fiber-Optic Nanoplasmonic Sensing. Sensors 2018, 18, 1759. [Google Scholar] [CrossRef]
  14. Nehl, C.L.; Liao, H.; Hafner, J.H. Optical Properties of Star-Shaped Gold Nanoparticles. Nano Lett. 2006, 6, 683–688. [Google Scholar] [CrossRef] [PubMed]
  15. Hao, E.; Schatz, G.C.; Hupp, J.T. Synthesis and Optical Properties of Anisotropic Metal Nanoparticles. J. Fluoresc. 2004, 14, 331–341. [Google Scholar] [CrossRef] [PubMed]
  16. Sánchez-Iglesias, A.; Pastoriza-Santos, I.; Pérez-Juste, J.; Rodríguez-González, B.; Garcia de Abajo, F.J.; Liz-Marzán, L.M. Synthesis and Optical Properties of Gold Nanodecahedra with Size Control. Adv. Mater. 2006, 18, 2529–2534. [Google Scholar] [CrossRef]
  17. Rechberger, W.; Hohenau, A.; Leitner, A.; Krenn, J.; Lamprecht, B.; Aussenegg, F. Optical properties of two interacting gold nanoparticles. Opt. Commun. 2003, 220, 137–141. [Google Scholar] [CrossRef]
  18. Manoccio, M.; Esposito, M.; Passaseo, A.; Cuscunà, M.; Tasco, V. Focused Ion Beam Processing for 3D Chiral Photonics Nanostructures. Micromachines 2020, 12, 6. [Google Scholar] [CrossRef]
  19. Gladskikh, I.A.; Toropov, N.A.; Dadadzhanov, D.R.; Baranov, M.A.; Gladskikh, A.A.; Mirzoyan, G.; Markovich, G.; Vartanyan, T.A. Laser-Based Reshaping of Self-Organized Metasurfaces of Supported Ag Nanoparticles for Encoding Tunable Linear Dichroism Patterns. ACS Appl. Nano Mater. 2024, 7, 11342–11349. [Google Scholar] [CrossRef]
  20. Phengdaam, A.; Phetsang, S.; Jonai, S.; Shinbo, K.; Kato, K.; Baba, A. Gold nanostructures/quantum dots for the enhanced efficiency of organic solar cells. Nanoscale Adv. 2024, 6, 3494–3512. [Google Scholar] [CrossRef]
  21. Cho, N.H.; Kim, Y.B.; Lee, Y.Y.; Im, S.W.; Kim, R.M.; Kim, J.W.; Namgung, S.D.; Lee, H.E.; Kim, H.; Han, J.H.; et al. Adenine oligomer directed synthesis of chiral gold nanoparticles. Nat. Commun. 2022, 13, 3831. [Google Scholar] [CrossRef]
  22. Van Gordon, K.; Baúlde, S.; Mychinko, M.; Heyvaert, W.; Obelleiro-Liz, M.; Criado, A.; Bals, S.; Liz-Marzán, L.M.; Mosquera, J. Tuning the Growth of Chiral Gold Nanoparticles Through Rational Design of a Chiral Molecular Inducer. Nano Lett. 2023, 23, 9880–9886. [Google Scholar] [CrossRef]
  23. Sargazi, S.; Laraib, U.; Er, S.; Rahdar, A.; Hassanisaadi, M.; Zafar, M.N.; Diez-Pascual, A.M.; Bilal, M. Application of Green Gold Nanoparticles in Cancer Therapy and Diagnosis. Nanomaterials 2022, 12, 1102. [Google Scholar] [CrossRef] [PubMed]
  24. Sastry, M.; Rao, M.; Ganesh, K.N. Electrostatic Assembly of Nanoparticles and Biomacromolecules. Acc. Chem. Res. 2002, 35, 847–855. [Google Scholar] [CrossRef] [PubMed]
  25. Adamczyk, Z.; Morga, M.; Nattich-Rak, M.; Sadowska, M. Nanoparticle and bioparticle deposition kinetics. Adv. Colloid Interface Sci. 2022, 302, 102630. [Google Scholar] [CrossRef]
  26. Montaño-Priede, J.L.; Sanroman-Iglesias, M.; Zabala, N.; Grzelczak, M.; Aizpurua, J. Robust Rules for Optimal Colorimetric Sensing Based on Gold Nanoparticle Aggregation. ACS Sens. 2023, 8, 1827–1834. [Google Scholar] [CrossRef]
  27. Abdullah, A.; Altaf, M.; Khan, H.I.; Khan, G.A.; Khan, W.; Ali, A.; Bhatti, A.S.; Khan, S.U.; Ahmed, W. Facile room temperature synthesis of multifunctional CTAB coated gold nanoparticles. Chem. Phys. 2018, 510, 30–36. [Google Scholar] [CrossRef]
  28. ITMO University. Mie/Theory Spectrum Calculator. Available online: https://physics.itmo.ru/ru/mie#/spectrum (accessed on 26 May 2025).
  29. Gutiérrez, M.V.; Scarpettini, A.F. Kinetic and plasmonic properties of gold nanorods adsorbed on glass substrates. Colloid Interface Sci. Commun. 2019, 33, 100213. [Google Scholar] [CrossRef]
  30. Behrens, S.H.; Grier, D.G. The charge of glass and silica surfaces. J. Chem. Phys. 2001, 115, 6716–6721. [Google Scholar] [CrossRef]
  31. Kelesidis, G.A.; Gao, D.; Starsich, F.H.; Pratsinis, S.E. Light Extinction by Agglomerates of Gold Nanoparticles: A Plasmon Ruler for Sub-10 nm Interparticle Distances. Anal. Chem. 2022, 94, 5310–5316. [Google Scholar] [CrossRef] [PubMed]
  32. Saison-Francioso, O.; Lévêque, G.; Akjouj, A.; Pennec, Y. Theoretical Study of Gold Nanoparticles Randomly Dispersed on a Dielectric/Gold Substrate. ACS Omega 2023, 8, 21493–21505. [Google Scholar] [CrossRef]
  33. Saini, R.K.; Sharma, A.K.; Agarwal, A.; Prajesh, R. Near field FEM simulations of plasmonic gold nanoparticle based SERS substrate with experimental validation. Mater. Chem. Phys. 2022, 287, 126288. [Google Scholar] [CrossRef]
  34. Naskar, B. Micellization and Physicochemical Properties of CTAB in Aqueous Solution: Interfacial Properties, Energetics, and Aggregation Number at 290 to 323 K. Colloids Interfaces 2025, 9, 4. [Google Scholar] [CrossRef]
  35. Jain, K.; Mehandzhiyski, A.Y.; Zozoulenko, I.; Wågberg, L. PEDOT:PSS nano-particles in aqueous media: A comparative experimental and molecular dynamics study of particle size, morphology and z-potential. J. Colloid Interface Sci. 2021, 584, 57–66. [Google Scholar] [CrossRef] [PubMed]
  36. Leonov, N.B.; Gladskikh, I.A.; Starovoytov, A.A. Effect of media on plasmon resonance of silver nanoparticles. Appl. Phys. A 2023, 129, 430. [Google Scholar] [CrossRef]
  37. Jenkins, J.A.; Zhou, Y.; Thota, S.; Tian, X.; Zhao, X.; Zou, S.; Zhao, J. Blue-Shifted Narrow Localized Surface Plasmon Resonance from Dipole Coupling in Gold Nanoparticle Random Arrays. J. Phys. Chem. C 2014, 118, 26276–26283. [Google Scholar] [CrossRef]
  38. Yoon, S. Controlled assembly of gold nanoparticles: Methods and plasmon coupling properties. Bull. Korean Chem. Soc. 2024, 45, 689–698. [Google Scholar] [CrossRef]
  39. Paszke, A. Pytorch: An imperative style, high-performance deep learning library. arXiv 2019, arXiv:1912.01703. [Google Scholar]
  40. Akiba, T.; Sano, S.; Yanase, T.; Ohta, T.; Koyama, M. Optuna: A Next-generation Hyperparameter Optimization Framework. In Proceedings of the 25th ACM SIGKDD International Conference on Knowledge Discovery & Data Mining, KDD ’19, New York, NY, USA, 4–8 August 2019; pp. 2623–2631. [Google Scholar] [CrossRef]
  41. Pedregosa, F.; Varoquaux, G.; Gramfort, A.; Michel, V.; Thirion, B.; Grisel, O.; Blondel, M.; Prettenhofer, P.; Weiss, R.; Dubourg, V.; et al. Scikit-learn: Machine learning in Python. J. Mach. Learn. Res. 2011, 12, 2825–2830. [Google Scholar]
  42. Chen, T.; Guestrin, C. Xgboost: A scalable tree boosting system. In Proceedings of the 22nd ACM SIGKDD International Conference on Knowledge Discovery and Data Mining, San Francisco, CA, USA, 13–17 August 2016; pp. 785–794. [Google Scholar]
Figure 1. Schematic of substrate surface functionalization and GNP deposition (a) via APTES/PSS bilayer formation (b).
Photonics 12 00619 g001
Figure 2. Extinction spectra of the GNP colloidal solution and of GNP deposited on APTES/PSS-functionalized substrates as a function of deposition time. The concentration of GNPs was 0.5 μ M. For comparison, the extinction spectrum of a colloidal solution of NPs (labeled by dark blue) was reduced by 10 times. To remove excess CTAB, the GNP colloidal solution was centrifuged three times at 12,000 rpm for 10 min.
Photonics 12 00619 g002
Figure 3. Extinction spectra of GNPs at fixed time of deposition as 67 h and varied concentration of NP and CTAB. The relative concentration of CTAB was proportional to ratio between nanoparticle concentration. GNP colloidal stock solutions were preliminary centrifuged three times at 12,000 rpm for 10 min.
Photonics 12 00619 g003
Figure 4. Extinction spectra of films obtained by depositing GNPs from solutions of varying concentration at different incubation times: (a)—4 h, (b)—16 h, (c)—20 h, and (d)—24 h. The solid and dashed curves correspond to the final nanoparticle concentrations of 1 μ M and 0.35 μ M, respectively, after dilution. GNP colloidal stock solutions were preliminary centrifuged three times at 10,000 rpm for 10 min.
Photonics 12 00619 g004
Figure 5. (a) A two-stage acquisition pipeline involving both imaging and spectroscopic measurements, (b) normalized extinction spectra with specific PC n o r m values, and (c) histogram of normalized target values ( PC n o r m ). Vertical lines at the thresholds of 0.1 and 0.5 are used to mark the boundaries between the defined GNP classes, ranging from isolated to interacted nanoparticles.
Photonics 12 00619 g005
Figure 6. Photographs of the sample area from which the spectra were taken, with each segment showing its PC n o r m value and the value predicted by AI.
Photonics 12 00619 g006
Table 1. Performance comparison of different models on the test set.
ModelR2RMSEMSEMAE
Ridge (optimized)0.61620.13270.01760.0952
Lasso (optimized)0.60820.13410.01800.0982
XGBoost (optimized)0.82080.09070.00820.0531
Neural Network (ours)0.82270.09020.00810.0491
Disclaimer/Publisher’s Note: The statements, opinions and data contained in all publications are solely those of the individual author(s) and contributor(s) and not of MDPI and/or the editor(s). MDPI and/or the editor(s) disclaim responsibility for any injury to people or property resulting from any ideas, methods, instructions or products referred to in the content.

