1. Introduction
Refractive index (RI) detection is a crucial method for analyzing material composition, and can be used to monitor various physical parameters such as solution concentration [
1], gas concentration [
2], and magnetic field strength [
3]. It has yielded significant results in fields such as biomedicine [
4], food safety [
5], and ecological monitoring [
6]. Compared with electrical sensors, optical fiber RI sensors have developed rapidly in recent years due to their advantages of compact size, remote controllability, and resistance to electromagnetic interference.
Among optical fiber sensors, interferometric sensors can be fabricated using various techniques, including direct fusion [
7], offset fusion [
8], fiber tapering [
9], special-shaped fibers [
10], and laser polishing [
11]. No-core fiber (NCF), a unique waveguide made from quartz silicon material, lacks a distinct core cladding RI difference. Originally designed to replace multimode fibers (MMFs) after hydrofluoric acid etching [
12], NCFs use the surrounding environment as the cladding, enabling high-order modes to directly interact with external media, resulting in excellent sensing performance. Therefore, many researchers have employed NCFs to develop RI sensors with high sensitivity.
In 2015, Bai et al. first demonstrated the relationship between the bandpass spectrum induced by the self-imaging effect in the single mode–no-core single mode (SNS) fiber structure and RI sensitivity. They showed that reducing the NCF length could enhance RI sensitivity under specific self-imaging indices [
13]. In 2022, Razali et al. experimentally confirmed that SNS structures with two self-imaging indices between one and four offered optimal RI sensing performance [
14]. However, achieving suitable self-imaging indices often required relatively long NCF segments (on the order of centimeters), which limits the sensor’s use in confined spaces.
To address this limitation, researchers have proposed various approaches to enhance the beam splitting/combining efficiency of NCFs while reducing structural size. These methods include inserting MMF segments [
15], offset fusion, tapering [
16], etching [
17], and introducing surface plasmon resonance (SPR) effects [
18]. As a result, MZI based refractometers have been successfully miniaturized to millimeter scale.
Hollow-core fiber (HCF), a tubular quartz fiber with an air-filled core, typically does not support long-distance transmission. However, due to its strong beam divergence capability, particularly when the hollow core is reshaped, it can serve effectively as a beam expander. By leveraging the beam-expanding capability of HCF and the high external interaction sensitivity of NCF, it becomes feasible to fabricate an ultra-compact, highly sensitive Mach–Zehnder interferometer (MZI) to meet current sensor miniaturization demands.
In this paper, the successful design and fabrication of an ultra-compact MZI (UC-MZI) refractometer based on rice-shaped air cavities (RACs) is presented. The sensor employs an SNS configuration, with HCFs fused onto both sides of the NCF under optimized fusion parameters to form non-cylindrical RACs. These air cavities exhibit strong beam splitting and combining capabilities, enabling the excitation of higher-order modes within a short propagation distance of just 500 μm, thus endowing the RAC-MZI with high RI sensitivity. Under a surrounding medium with an RI of 1.43, the sensor achieved maximum RI sensitivities of 1550.41 nm/RIU and 1810.89 nm/RIU at two interference peaks. Furthermore, temperature demodulation revealed a minimal temperature crosstalk of only 1.38 × 10⁻⁵ RIU/°C. The proposed sensor offers a novel strategy for the development of ultra-compact, high-coupling-efficiency RI sensors.
2. Principle
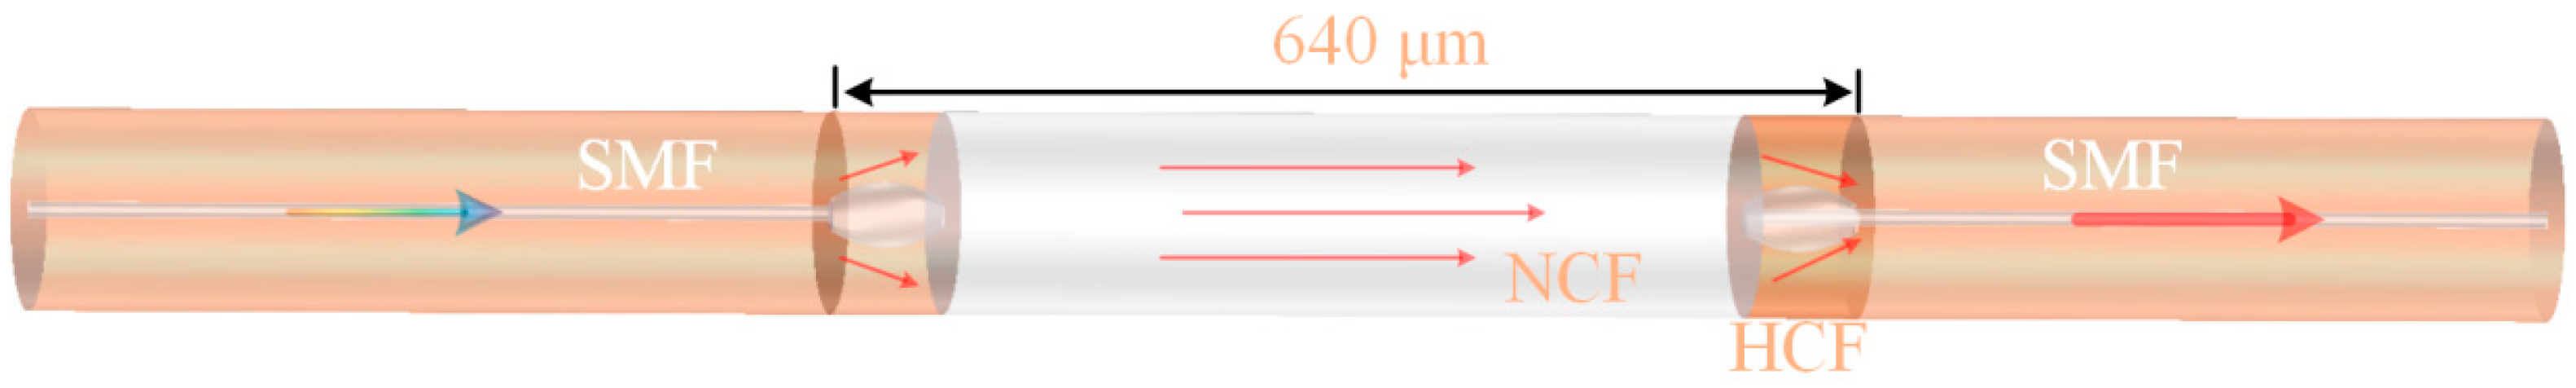
The schematic diagram of the proposed UC-MZI is shown in
Figure 1. The enclosed RAC is formed via transitional fusion splicing between a single-mode fiber (SMF) and an HCF, followed by fusion splicing with an NCF. When a broadband optical beam is introduced into the first RAC through the input SMF, core mismatch and the collapsed cavity cause the light to propagate through both the air holes and the cladding, rather than being confined within the air holes. As the light continues to propagate into the NCF, the beam undergoes significant broadening, simultaneously exciting high-order cladding modes within the NCF.
The excitation of these high-order cladding modes makes the light field more sensitive to changes in the external environment, thereby enhancing the sensor’s sensitivity to RI changes. After passing through the second RAC, a portion of the cladding modes is refocused into the fiber core, allowing the fundamental mode and the cladding modes to recombine at the output SMF. The interference between these modes generates a distinct interference spectrum. The resulting interference light intensity is expressed as
where
and
represent the intensities of the core mode and cladding modes, respectively, while
denotes the total light intensity transmitted through the output SMF. Due to the differing propagation constants and effective RIs of the fundamental mode and the cladding modes, a phase difference
is induced during propagation. This phase difference can be expressed as
where
represents the difference in effective RI between the higher-order mode and the fundamental mode,
is the wavelength, and L is the interference length, defined as the combined length of the HCF and NCF (approximately 0.64 mm). When the phase difference satisfies the condition,
(where n is an integer), a resonance dip appears in the interference spectrum. The corresponding dip wavelength can be expressed as
As the RI of the surrounding environment changes, the effective RI difference between the coupled modes in the UC-MZI also varies. Consequently, the interference wavelength shifts in response to changes in the external RI. The RI sensitivity of the sensor can be determined by analyzing these wavelength shifts, and it is expressed as
where
represents the change in the RI of the detection environment, and
denotes the corresponding variation in the effective RI difference between the core and cladding modes. When the RI of the detection environment is typically much lower than that of the NCF, the optical field is strongly confined within the cladding. An increase in environmental RI results in a greater
, leading to a redshift in the interference wavelength. As the environmental RI approaches the cladding RI, more light energy is leaked into the external medium, and the rate of change in
becomes more pronounced. Consequently, the RI sensitivity
increases due to this nonlinear variation.
The experiment evaluated the transmission spectra and Fast Fourier Transform (FFT) results of MZIs with both cylindrical and rice-shaped air cavities, as shown in
Figure 2. The cylindrical cavity is HCF fused using ordinary fusion power, and its two sides are not compressed. With air cavities and NCFs of identical lengths, the MZI incorporating the RAC successfully excited two distinct resonance peaks. The FFT analysis reveals that, compared to the cylindrical air cavity, the MZI embedded with an RAC excites higher-order cladding modes. This enhancement is attributed to the superior beam expansion capability of the RAC, which enables the development of compact, high-performance sensors.
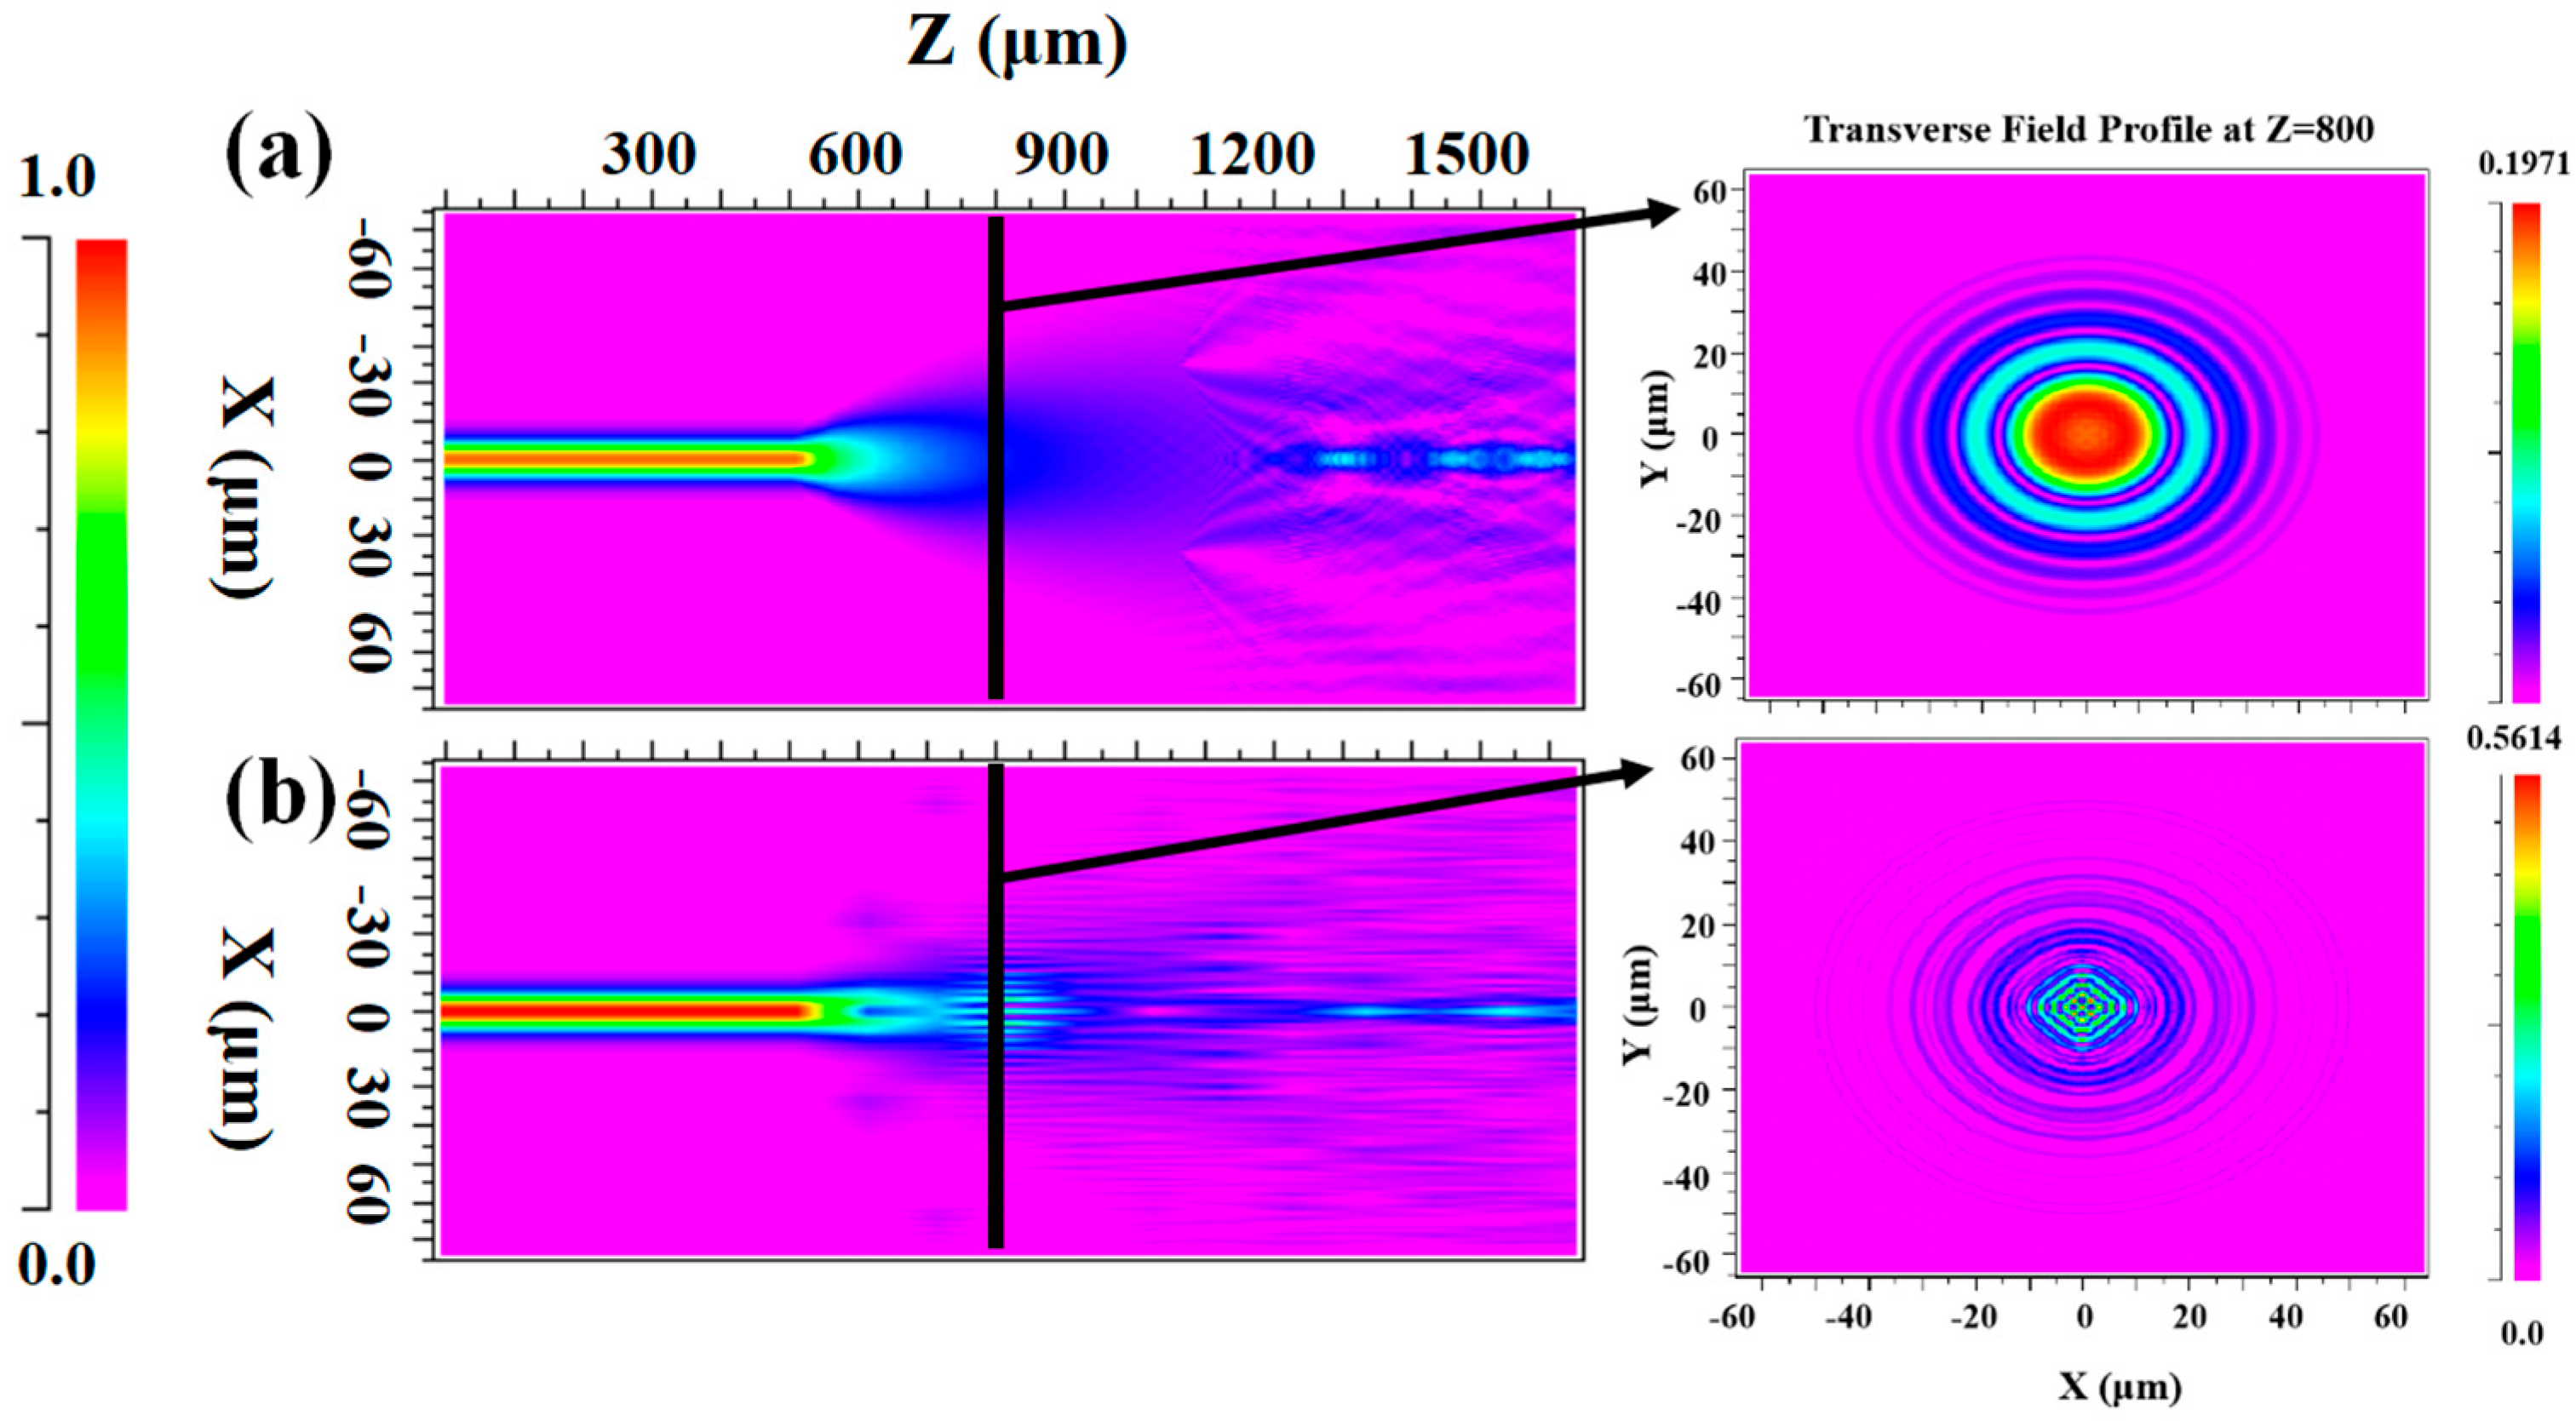
To systematically investigate the optical field distributions in both cylindrical and rice-shaped air cavities, we performed numerical simulations using the finite difference beam propagation method (BPM), as presented in
Figure 3. The relevant parameter settings in the simulation are as follows: the core diameter of SMF is 10 μm, the refractive index is 1.4521, the cladding diameter is 125 μm, and the refractive index is 1.4468. The core diameter of HCF is 50 μm, the refractive index is 1, the cladding diameter is 125 μm, and the refractive index is 1.4440. The diameter of NCF is 125 μm, and the refractive index is 1.4507. Comparing the X-Z plane light field distribution in
Figure 3a,b, more light is coupled into the cladding after passing through the RACs compared to the cylindrical gas cavity. In addition, the cladding patterns were monitored after the cylinder and RACs, respectively, as shown below. The X-Y plane field distribution indicates that the RACs structure helps to enhance light leakage into the cladding, which executes higher-order cladding modes.
3. Fabrication
In this experiment, an SMF with a core diameter of 10 μm and a cladding diameter of 125 μm was selected. The HCF had a core diameter of 50 μm and a cladding diameter of 125 μm, while the NCF also had a diameter of 125 μm. The uniform cladding diameter ensured consistent fusion quality and improved the structural integrity of the UC-MZI. Given the compact nature of the UC-MZI, a precision cutting device was required. To this end, a self-developed fiber precision cutting platform [
19] from our research group was employed. This setup includes two three-dimensional displacement stages (Hengyang Optics), a fiber cutter, and a microscopic imaging system. The coaxial alignment between the fiber clamp and the cutting blade was fine-tuned using the displacement stages to avoid introducing lateral stress. Fusion points were monitored in real time on the display screen, enabling precise control over the cutting length of each fiber segment.
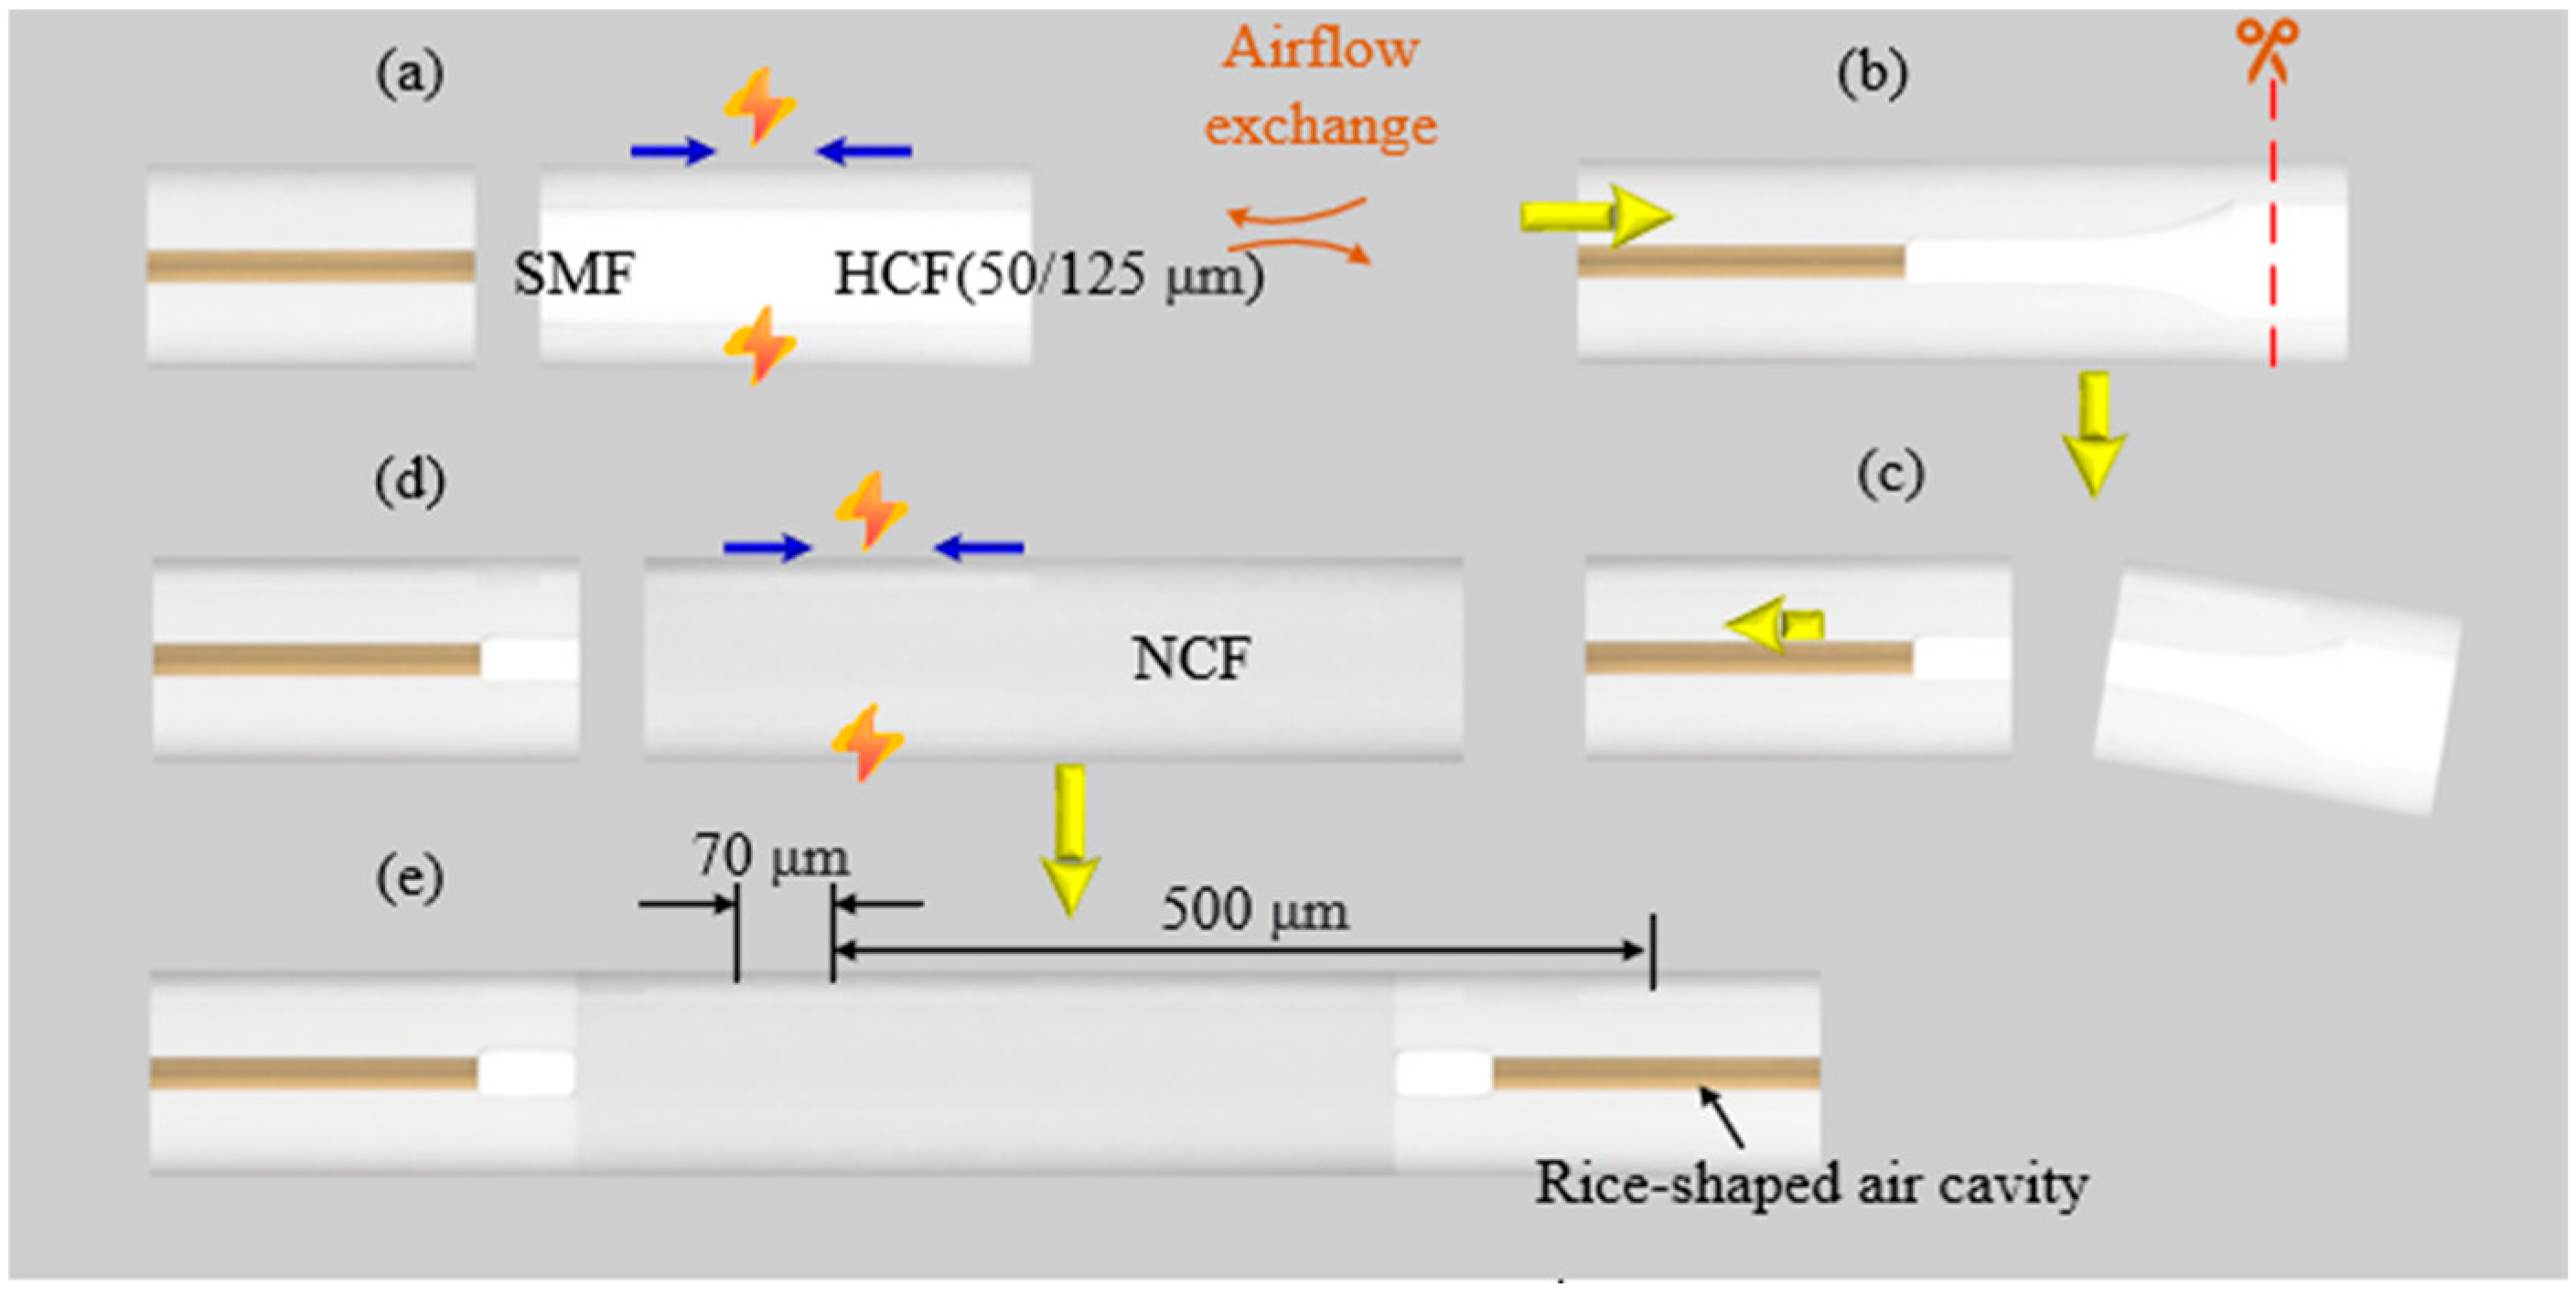
As shown in
Figure 4a, the ends of the SMF and HCF were first cleaved flat and then coaxially aligned using a fiber fusion splicer. Due to the presence of an unsealed hollow air core in the HCF, collapse occurred under strong arc discharge, resulting in a distinct tilt at the fusion interface. After repeated adjustments to stabilize the collapse angle, the following optimized fusion parameters were established: a pre-melt time of 600 ms, pre-melt intensity of 13 bit+, fusion time of 3000 ms, fusion intensity of 45 bit+, advancement distance of 29 μm, and advancement speed of 32. Under these conditions, the hollow air core diameter in the HCF collapsed from 50 μm to 30.6 μm, forming a rounded cavity wall at the fusion junction.
The resulting composite fiber was then mounted on the precision cutting platform. As illustrated in
Figure 4b, the cutting blade was offset by 70 μm from the fusion interface under microscopic observation, and the composite fiber was cleaved with a length error controlled within 1 μm. Subsequently, as shown in
Figure 4c, a segment of NCF was aligned and fused to the prepared composite fiber using the fusion splicer. Since the NCF and SMF exhibit similar melting points, identical fusion parameters were applied to ensure consistency. Because one end of the HCF was already sealed by the SMF, the air cavity did not collapse again during fusion with the NCF, but a rounded cavity wall was formed only at the HCF–NCF junction.
As illustrated in
Figure 4d, after fusion, the cutting blade was repositioned to cut the NCF to a length of 500 μm. The same procedure was repeated on the opposite side, where the HCF and SMF were sequentially fused. The length of the hollow-core fiber remained at 70 μm. As shown in
Figure 4e, the resulting sensor exhibited a symmetrical structure on both sides, with two identical RACs serving as beam expanders and collectors, respectively, forming a typical MZI configuration. The total sensing length of the sensor was 640 μm, significantly shorter than most conventional MZI sensors, thereby demonstrating excellent compactness.
To investigate the effect of the RAC collapse degree on sensor performance, the discharge intensity during fusion was varied to control the degree of HCF collapse. UC-MZIs were fabricated under different discharge intensities and tested for their RI response. Keeping all other fusion parameters constant, the discharge intensities were set at 43+, 45+, 47+, and 50+ bits. The corresponding sensors were labeled Sensor 1, Sensor 2, Sensor 3, and Sensor 4, respectively.
4. Experimental Result
The RI test setup is illustrated in
Figure 5. A broadband light source (BLS) was used as an input light generating device, with the UC-MZI structure positioned between two fixed clamps. An optical spectrum analyzer (OSA) with a resolution of 0.2 nm was employed to monitor the transmission spectrum. All experiments were conducted at room temperature (25 °C). By simulating changes in the external RI, the RI sensing characteristics of the sensors were evaluated. Standard RI matching fluids ranging from 1.36 to 1.43 were used. Based on the results derived from Equation (4), the sensor exhibits higher performance at elevated external RI values. Therefore, the external RI was increased in 0.01 increments from 1.36 to 1.41. For the 1.41–1.43 range, six intermediate RIs (i.e., 1.413, 1.415, 1.417, 1.423, 1.425, and 1.427) were introduced to improve measurement accuracy. After each spectral measurement using the OSA, the sensor structure was carefully cleaned with anhydrous ethanol and left to dry to minimize measurement errors.
The experiment recorded the wavelength responses of dip A and dip B within the RI range of 1.36 to 1.43. The results were subjected to fitting analysis, as illustrated in
Figure 6.
Figure 6a shows the wavelength shifts of the two resonance peaks. As the RI increases, both interference peaks exhibit redshifts to varying degrees, consistent with the theoretical analysis. With increasing RI of the surrounding medium, the cladding RI effectively decreases. According to Equation (3), this results in a shift of the resonant wavelengths toward longer values.
Figure 6b,c presents the fitted curves, revealing a sensitivity turning point at an RI of 1.415. As the external RI approaches the cladding RI of the NCF, the sensitivity of the cladding’s effective RI to external changes is enhanced, resulting in an increased
. Consequently, according to Equation (4), the RI sensitivity also increases, an outcome confirmed by the experimental data.
In the RI range of 1.36 to 1.415, the RI sensitivities of dip A and dip B are 190.36 nm/RIU and 287.02 nm/RIU, respectively. In the higher RI range of 1.415 to 1.43, the sensitivities significantly increase to 1550.41 nm/RIU for dip A and 1810.89 nm/RIU for dip B. Both fitted curves yield regression coefficients (R2) of 0.99, indicating excellent linearity. These results demonstrate that the sensor exhibits high sensitivity in the high-RI range, making it suitable for applications requiring high-precision RI detection.
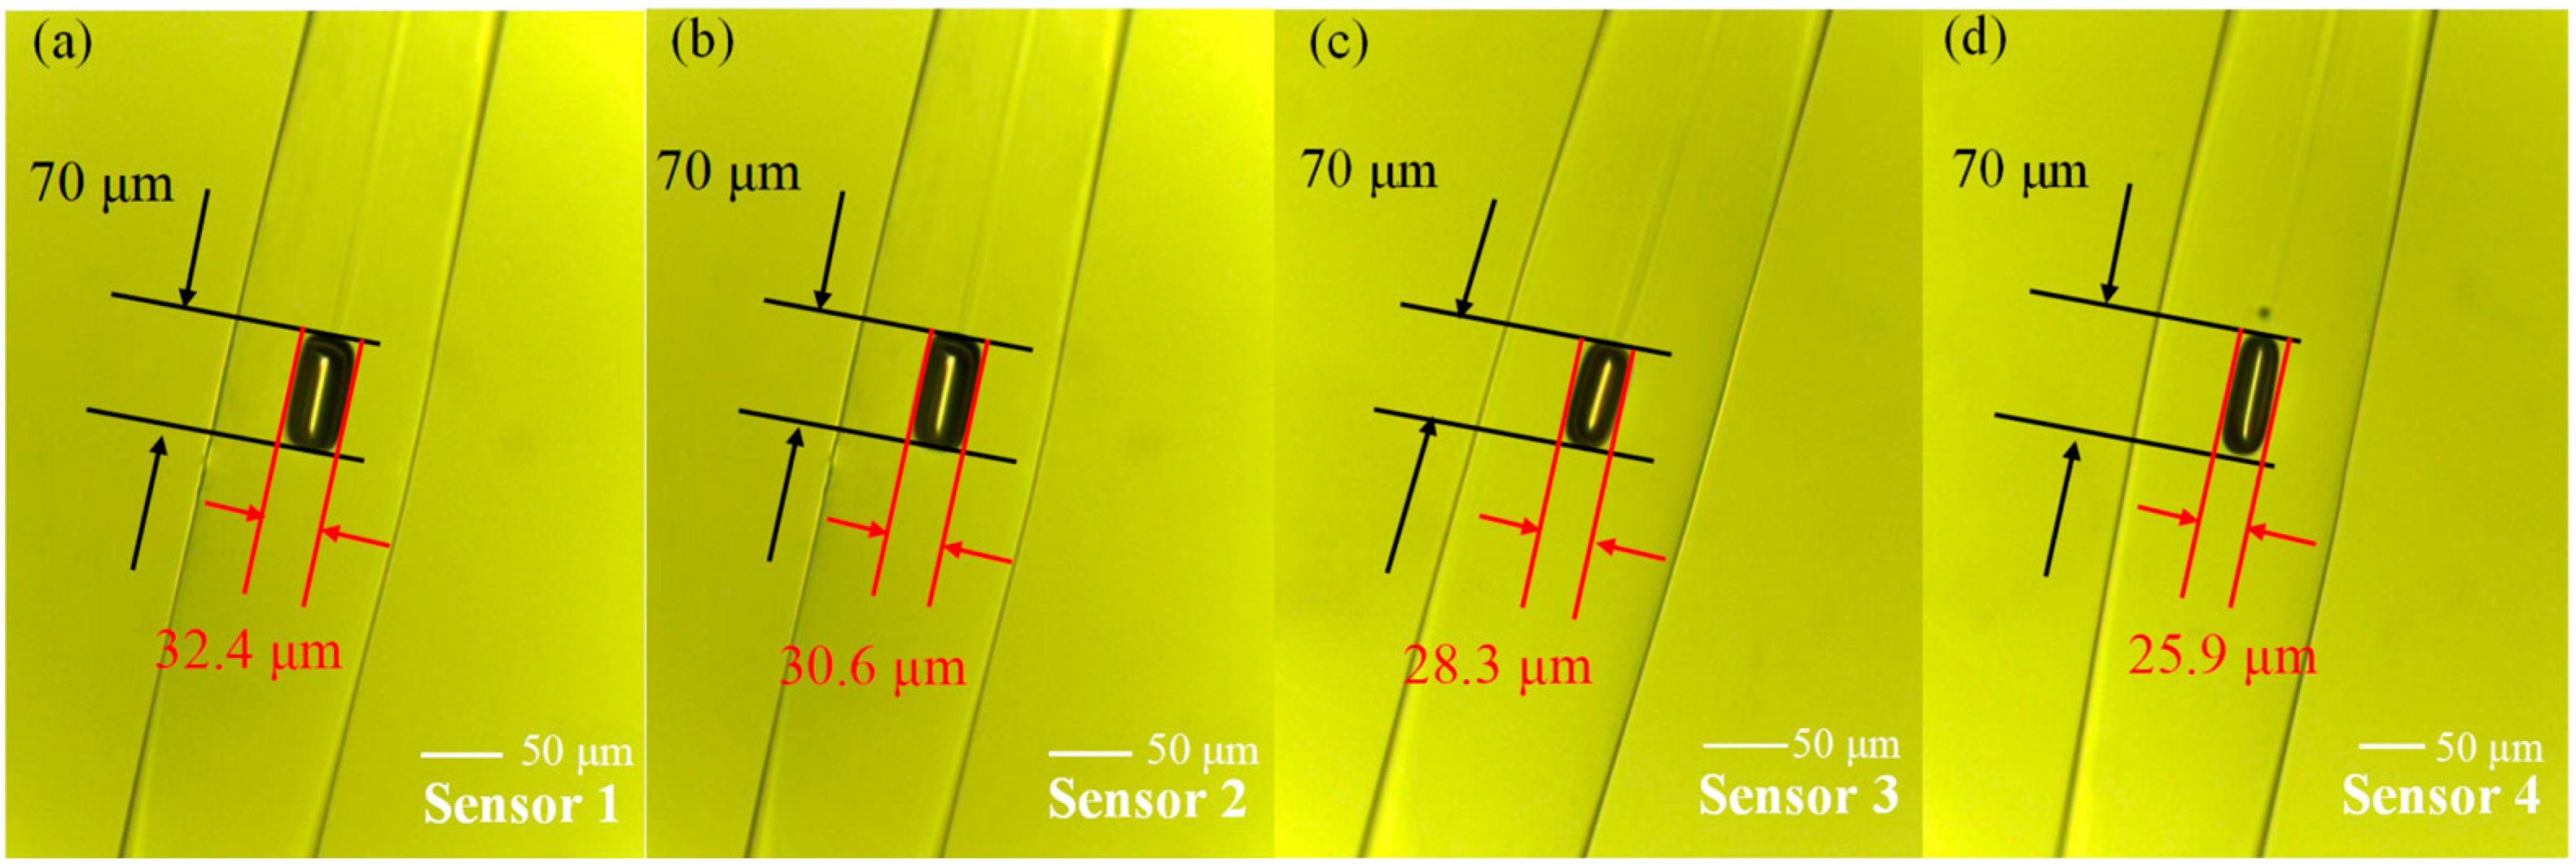
To further investigate the impact of the RAC size on the sensing performance of the UC-MZI, three additional UC-MZIs are prepared by adjusting the fusion parameters. These three sensors are named Sensor 1, 3, and 4. Microscopic images of Sensors 1–4, which were tested, are shown in
Figure 7. With a constant RAC length, the widths of these three UC-MZIs were reduced to 32.4 μm, 30.6 μm, 28.3 μm, and 25.9 μm, respectively. To minimize the influence of the incident wavelength on sensing performance, two resonance peaks centered around 1300 nm were selected for measurement across all samples. The sensing performances of the four samples are presented in
Figure 8, where the two selected resonance peaks exhibit similar trends. The average sensitivities of Sensors 1, 3, and 4 in the RI range of 1.36 to 1.43 are as follows: dip A: 382.85 nm/RIU, 357.14 nm/RIU, and 274.28 nm/RIU, and dip B: 380 nm/RIU, 394.28 nm/RIU, and 317.14 nm/RIU, respectively. In comparison, Sensor 2, with an average sensitivity of 462.85 nm/RIU for dip A and 597.14 nm/RIU for dip B, demonstrates superior sensing performance. The 30.6 μm compression is considered as optimal; however, due to equipment limitations and a small number of sample points, some errors may exist.
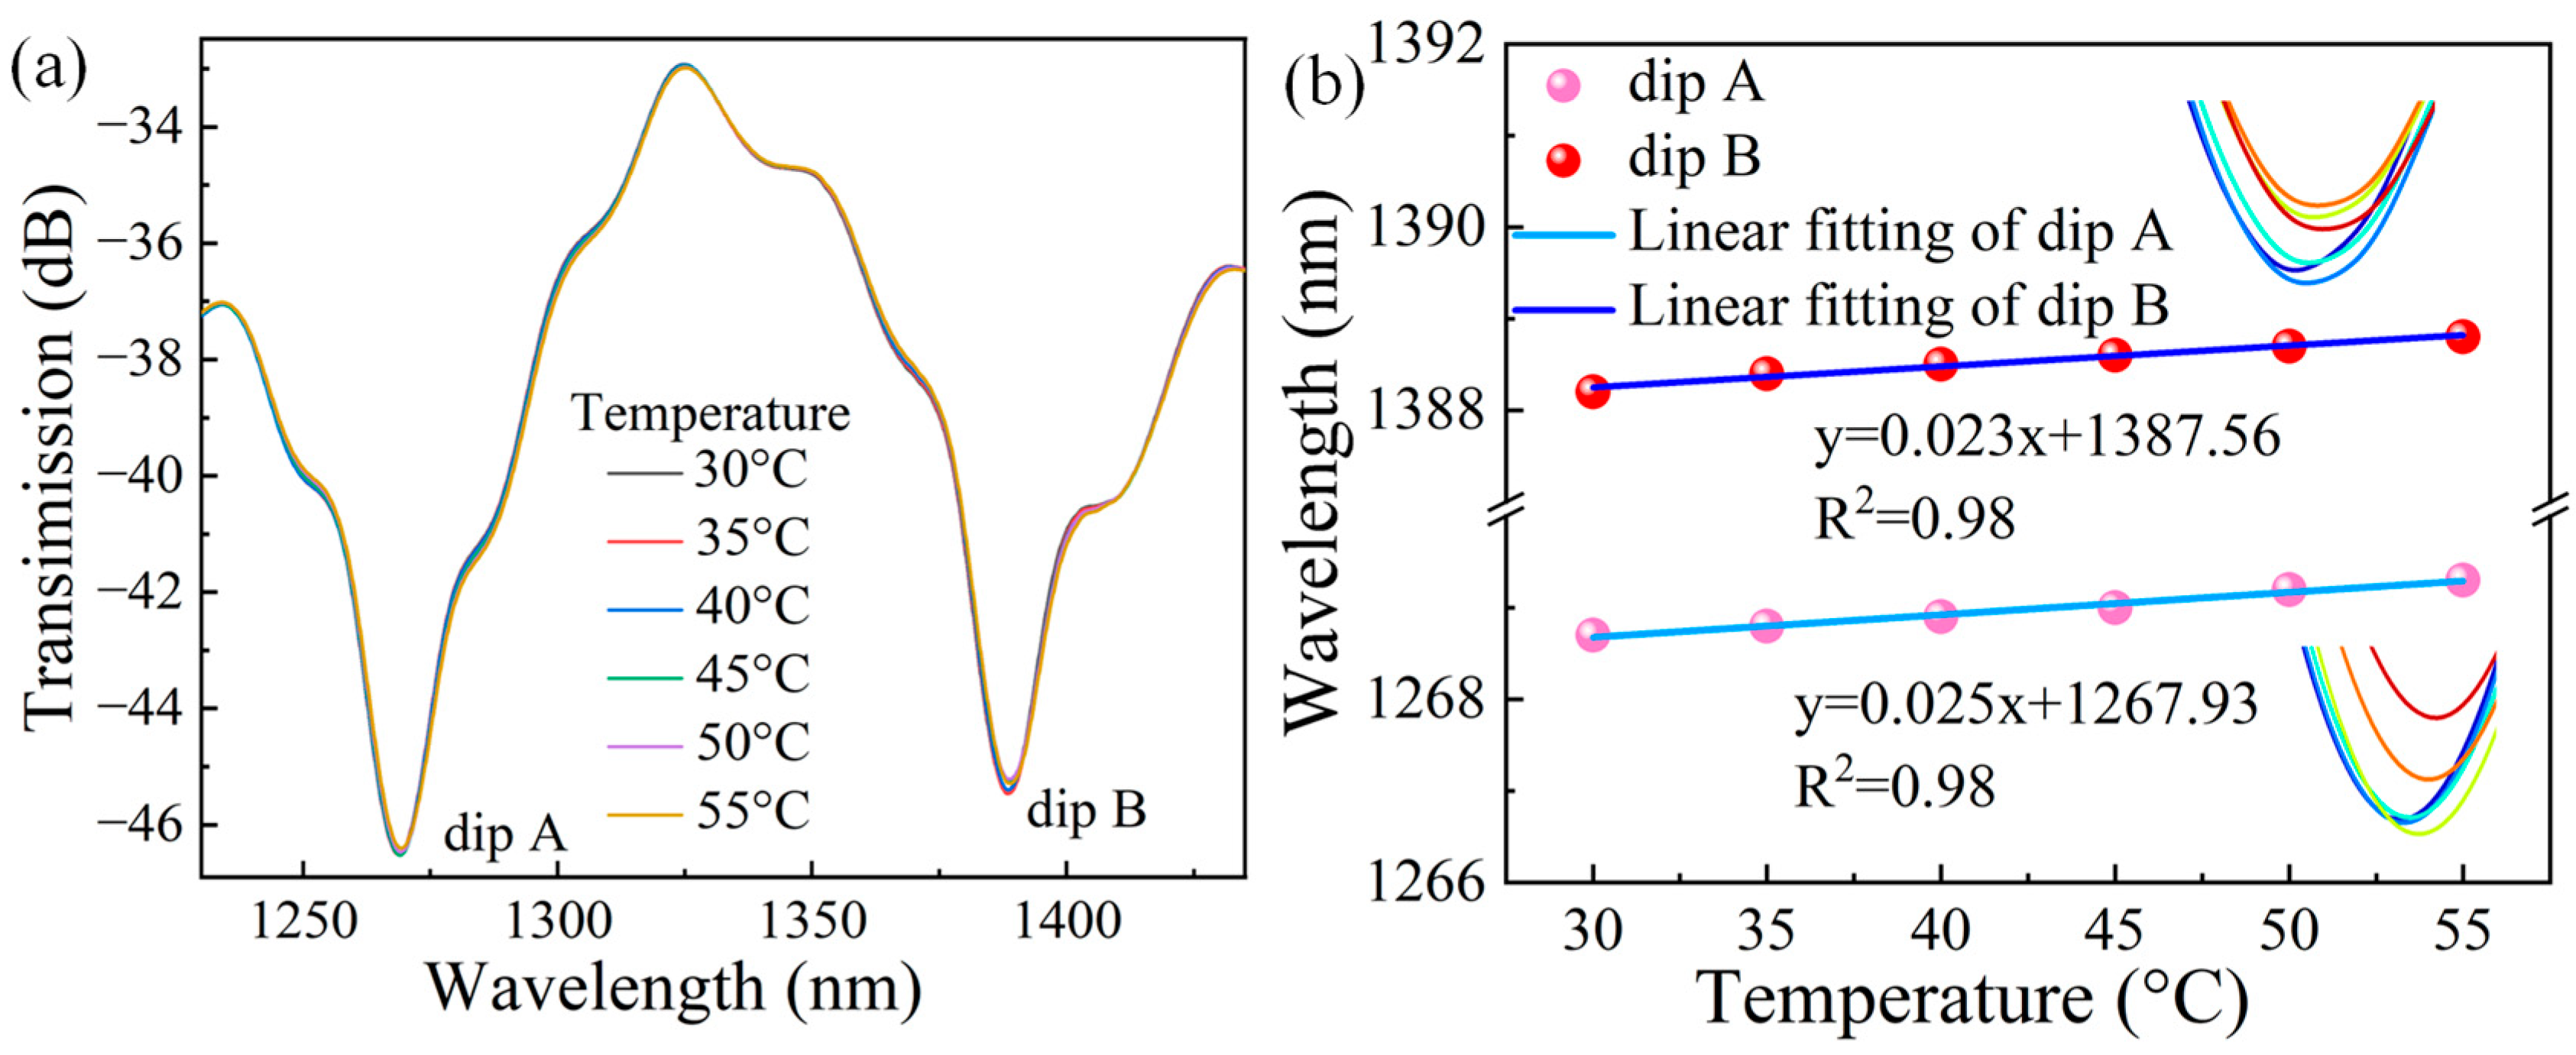
In contrast to the device used for measuring RI sensitivity, the temperature measurement setup included a temperature control platform. The temperature variation range was from 30 °C to 55 °C, with a 5 °C increment.
Figure 9a shows the peak drift of dip A and dip B, while
Figure 9b illustrates the relationship between the peak drift and temperature changes. The temperature sensitivities of dip A and dip B were 23 pm/°C and 25 pm/°C, respectively. The sensitivity to temperature mainly arises from the thermal expansion of the quartz cladding and the fiber core air. The RI-temperature crosstalk can be calculated according to the following formula:
By substituting the temperature sensitivity and refractive index sensitivity of dip A and dip B, the cross sensitivities of the two dips are 1.48 × 10⁻⁵ RIU/° C and 1.38 × 10⁻⁵ RIU/° C, respectively.
6. Conclusions
In summary, this paper proposes and validates an ultra-compact RI sensor based on two RACs. The UC-MZI consists of an SMF-HCF-NCF-HCF-SMF structure, with RACs on both sides created through high discharge intensity during fusion. The total length of the UC-MZI is only 0.64 mm, demonstrating excellent mechanical performance and compact structural dimensions. Experimental results confirm that the RAC provides exceptionally strong beam expansion and reception capabilities, effectively exciting high-order modes in the extremely short NCF section. The impact of different RAC compression degrees on sensor performance is investigated, leading to the identification of the optimal RAC size. Experimental results show that the UC-MZI achieves high RI sensitivity, with sensitivities of 1550.41 nm/RIU and 1810.89 nm/RIU in the 1.415–1.43 RI range, respectively. Additionally, the UC-MZI exhibits low temperature crosstalk of only 1.38 × 10⁻⁵ RIU/°C. The development of this sensor provides valuable insights for small-sized MZI sensors. In the future, it is planned to explore the creation of sensors with high precision for simultaneous temperature and RI measurements by sealing thermosensitive materials, such as glycerol, in the RAC. This approach could be applied to scenarios requiring the simultaneous detection of seawater temperature and RI.


