Article

Exploring the Impact of Inlet Velocity Distribution on the Thermal Performance of a Laser Rod in a Diode Side-Pumped Amplifier

1
Aerospace Information Research Institute, Chinese Academy of Sciences, Beijing 100094, China
2
School of Optoelectronics, University of Chinese Academy of Sciences, Beijing 100049, China
*
Authors to whom correspondence should be addressed.
Photonics 2025, 12(6), 603; https://doi.org/10.3390/photonics12060603
Submission received: 11 April 2025 / Revised: 27 May 2025 / Accepted: 10 June 2025 / Published: 12 June 2025
(This article belongs to the Special Issue Advances in Solid-State Laser Technology and Applications)

Abstract

Research on the thermal analysis of laser diode (LD) side-pumped amplifiers is a critical step in the design of high-power solid-state laser systems. Instead of adopting a standard solid modeling approach that only considers a laser rod, a fluid–structure interaction model is employed for analysis using the FLUENT 2021 R1 software. This model integrates the cooling structure, coolant, and laser rod, incorporating their relevant material parameters. By considering both uniform and non-uniform inlet velocity distributions as loading conditions, the study reveals remarkably different thermal simulation results. The correlation between thermal analysis outcomes and the total inlet flow rates is calculated, while temperature and stress distributions are obtained under a varying internal heat source. It was observed that the non-uniform inlet velocity distribution has little impact on the rod’s maximum temperature but significantly influences the maximum equivalent stress. This finding underscores the necessity of accounting for non-uniform inlet distributions during the design of laser amplifiers to achieve more accurate thermal simulation results and optimize structural reliability.

1. Introduction

Diode-pumped solid-state lasers (DPSSLs) are widely utilized in industrial processing, scientific research, communications, and other domains due to their high efficiency, compact size, lightweight design, and long service life [1,2,3]. DPSSLs predominantly employ the Master Oscillator Power Amplifier (MOPA) architecture, where the power amplifier significantly impacts the output beam quality [4,5]. In contemporary high-power DPSSL systems, multiple LD arrays are typically combined with side-pumped large-diameter laser rods for amplification [6,7]. This configuration is known for its simplicity and reliability, offering high pump energy, scalable optical aperture, and uniform pump power distribution along the rod’s axial length, thus enabling high average output power or pulse energy. However, the primary obstacle to achieving superior output performance stems from the thermal effects induced by high-power pumping [8,9,10], which can degrade or even damage the gain medium. Consequently, thermal analysis assumes a critical role in the design of laser amplifiers, especially for large-diameter laser rods, where thermal management directly influences operational stability and component longevity.
In the side-pumped configuration of multiple LD arrays, coolant is typically designed to flow around the laser rod’s outer surface for efficient heat dissipation [11,12]. Conventional thermal analysis models for laser rods often employ the finite element method, imposing specific boundary conditions on the rod [13,14]. A common practice in such modeling is to apply a convective heat transfer coefficient as a boundary condition to the rod’s surface to simulate coolant heat dissipation [15]. Notably, these models typically focus solely on the rod itself, excluding the coolant and cooling channel from the computational domain. However, the actual heat dissipation performance of the coolant is primarily governed by its physical properties and the geometric design of the cooling channel. In our prior study [16], we developed a fluid–structure interaction model using ANSYS FLUENT 2021 R1 software to analyze thermal distributions in a rod within a laser amplifier system. By integrating computational fluid dynamics and numerical heat transfer analysis [17,18,19], we systematically investigated the correlations between the cooling layer thickness, coolant velocity, inlet pressure, convective heat transfer coefficient, maximum temperature, and maximum equivalent stress in the rod. A key discovery is that the coolant velocity profile at the inlet significantly influences the stress distribution in large-diameter laser rods side-pumped by multiple LD arrays. This paper aims to provide a comprehensive explanation of these findings, offering insights into optimizing cooling system designs for high-power laser amplifiers.

2. Theory

The cooling mechanism of the laser rod by the coolant involves three coupled processes: coolant fluid flow and heat convection, interfacial heat transfer at the fluid–solid boundary, and heat conduction within the solid structure. The cooling fluid is typically modeled as an incompressible viscous fluid. The temperature distribution of the coolant is governed by the convection–diffusion equation, which degenerates into the heat conduction equation in the solid domain where the fluid velocity is zero. These theoretical foundations and assumptions are consistent with those detailed in reference [16]. Based on these theories, the coolant velocity and the temperature distribution of the laser rod can be simulated by using ANSYS FLUENT. By mapping the rod’s temperature results to a static structural analysis module, the thermal stress distribution within the rod can be obtained. The thermal expansion phenomenon induced by a temperature rise in the laser rod can be described microscopically as the displacement of individual elements, which can be represented by U x , U y , and U z . The relationship between the resulting strain and corresponding displacement can be expressed as [20]:
ε x = U x x , ε y = U y y , ε z = U z z γ x y = U x y + U y x , γ x z = U x z + U z x , γ y z = U y z + U z y
ε i   ( i = x , y , z ) and γ i j   ( i , j = x , y , z   &   i j ) , respectively, represent the normal strain and shear strain in various directions. For sufficiently small deformations, Hooke’s law is satisfied between stress and strain:
ε x = 1 E σ x v σ y + σ z + α Δ T ε y = 1 E σ y v σ z + σ x + α Δ T ε z = 1 E σ z v σ x + σ y + α Δ T τ x y = G γ x y ,   τ z x = G γ z x ,   τ y z = G γ y z
where σ is the normal stress, τ is the shear stress, G = E / 2 ( 1 + v ) , E represents Young’s modulus, α is the coefficient of thermal expansion, and v is Poisson’s ratio.
In steady-state conditions, the forces in all directions must satisfy the mechanical equilibrium conditions:
σ x x + τ x y y + τ x z z + F x = 0 τ x y x + σ y y + τ y z z + F y = 0 τ x z x + τ y z y + σ z z + F z = 0
where F i   i = x , y , z is the external force applied to a specific element within the laser rod. In conclusion, by integrating the above equations with appropriate boundary conditions, the stress distribution within the rod can be derived.

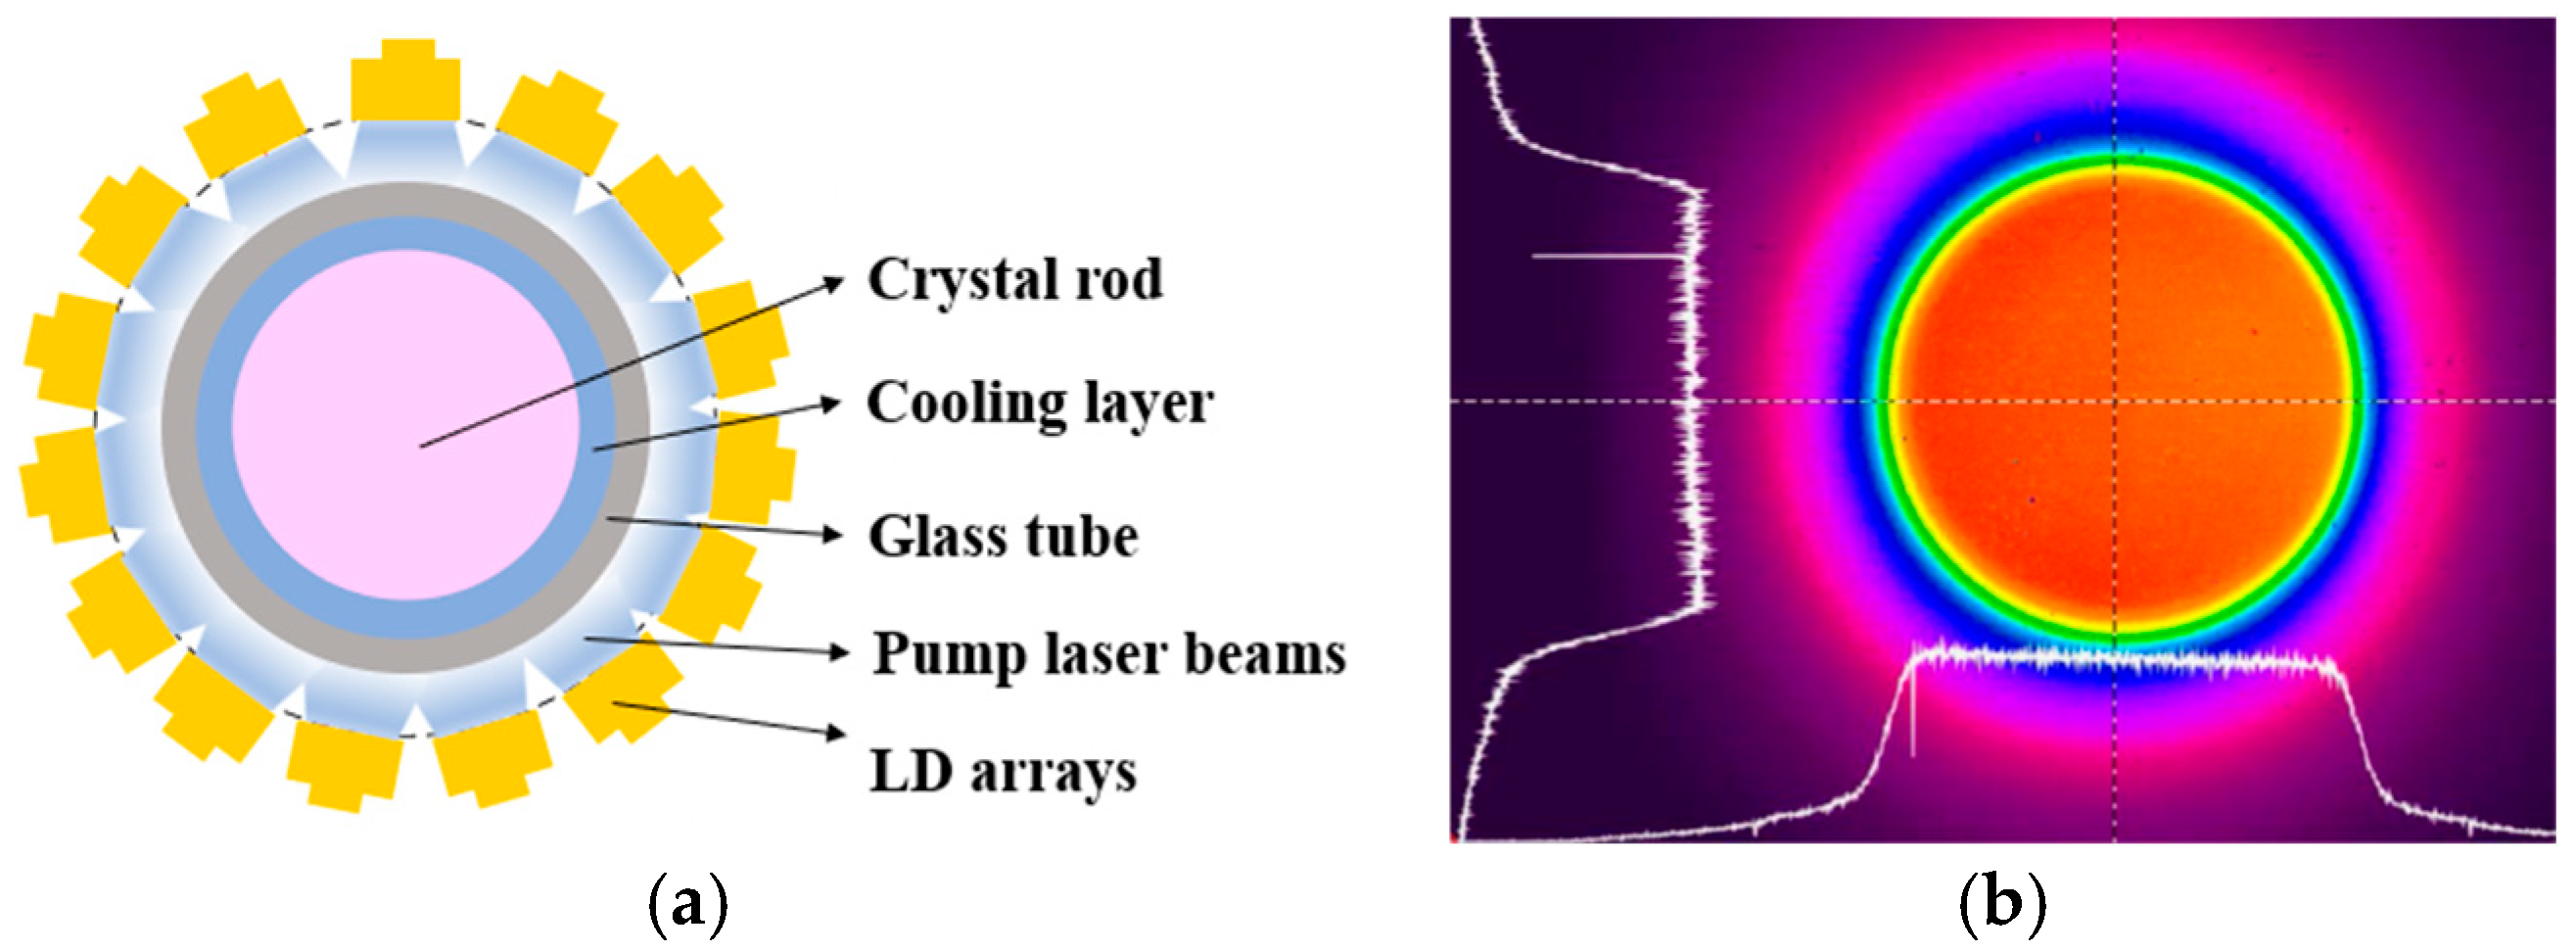
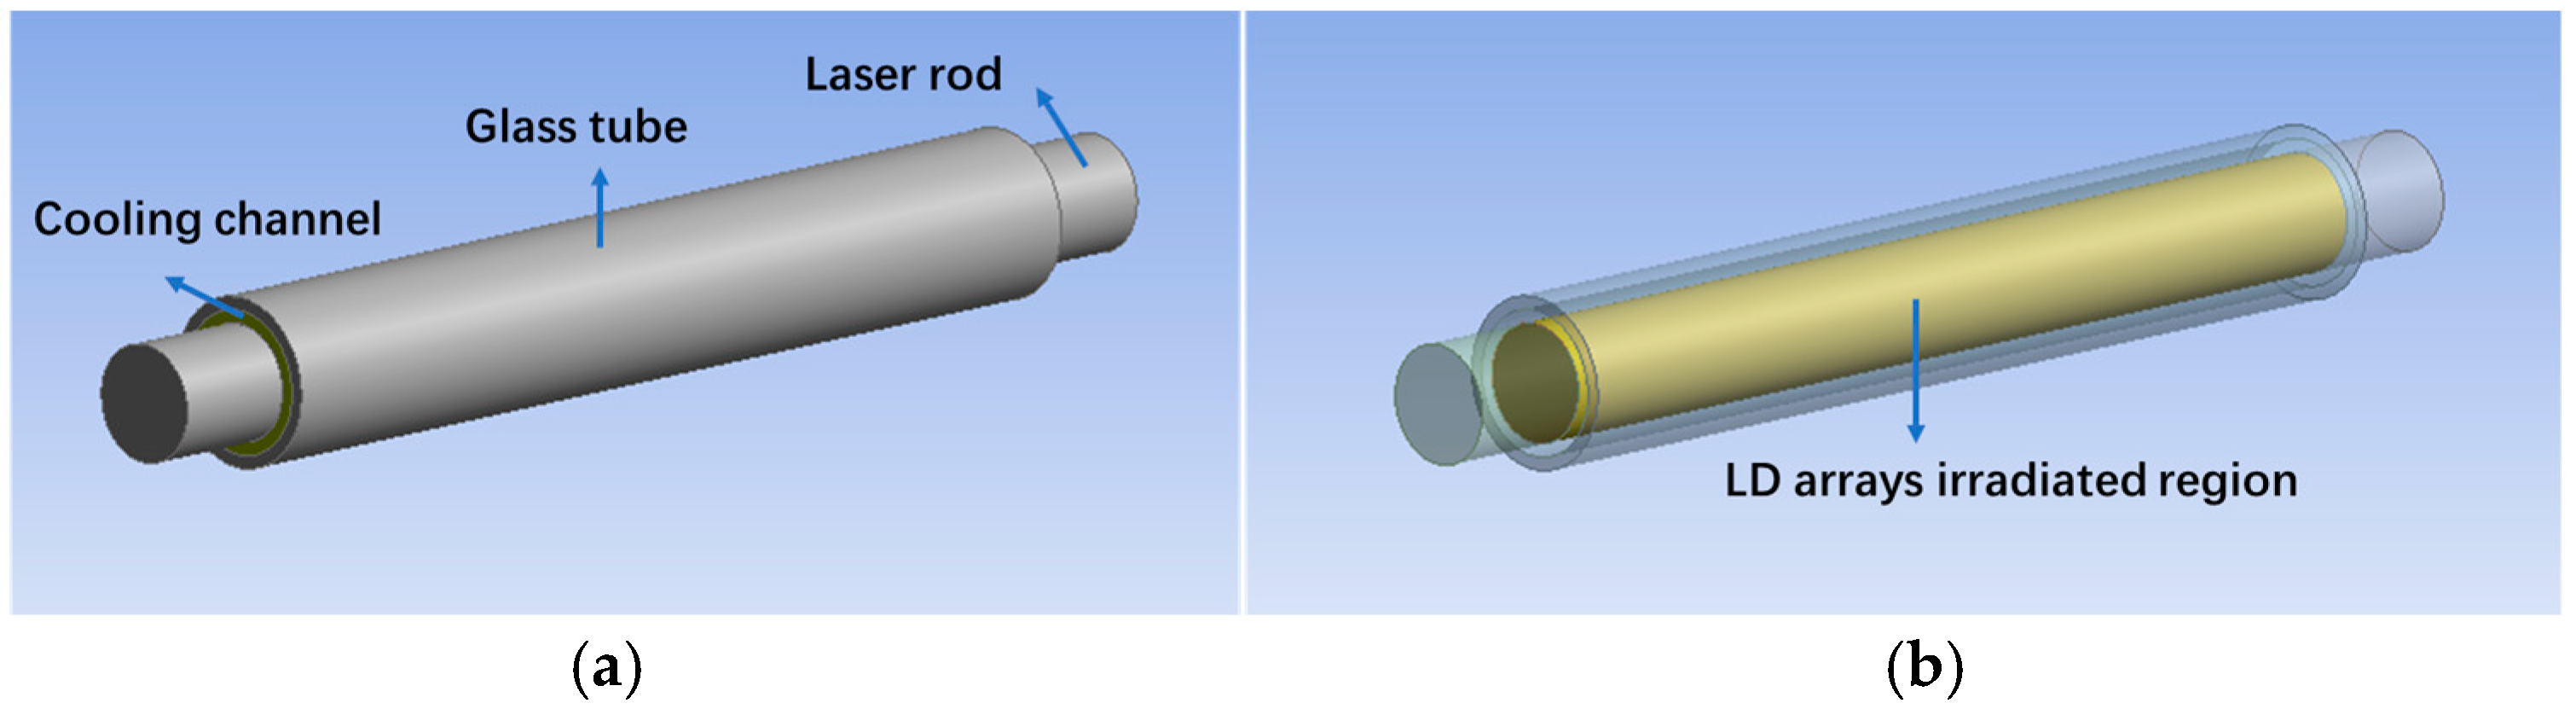
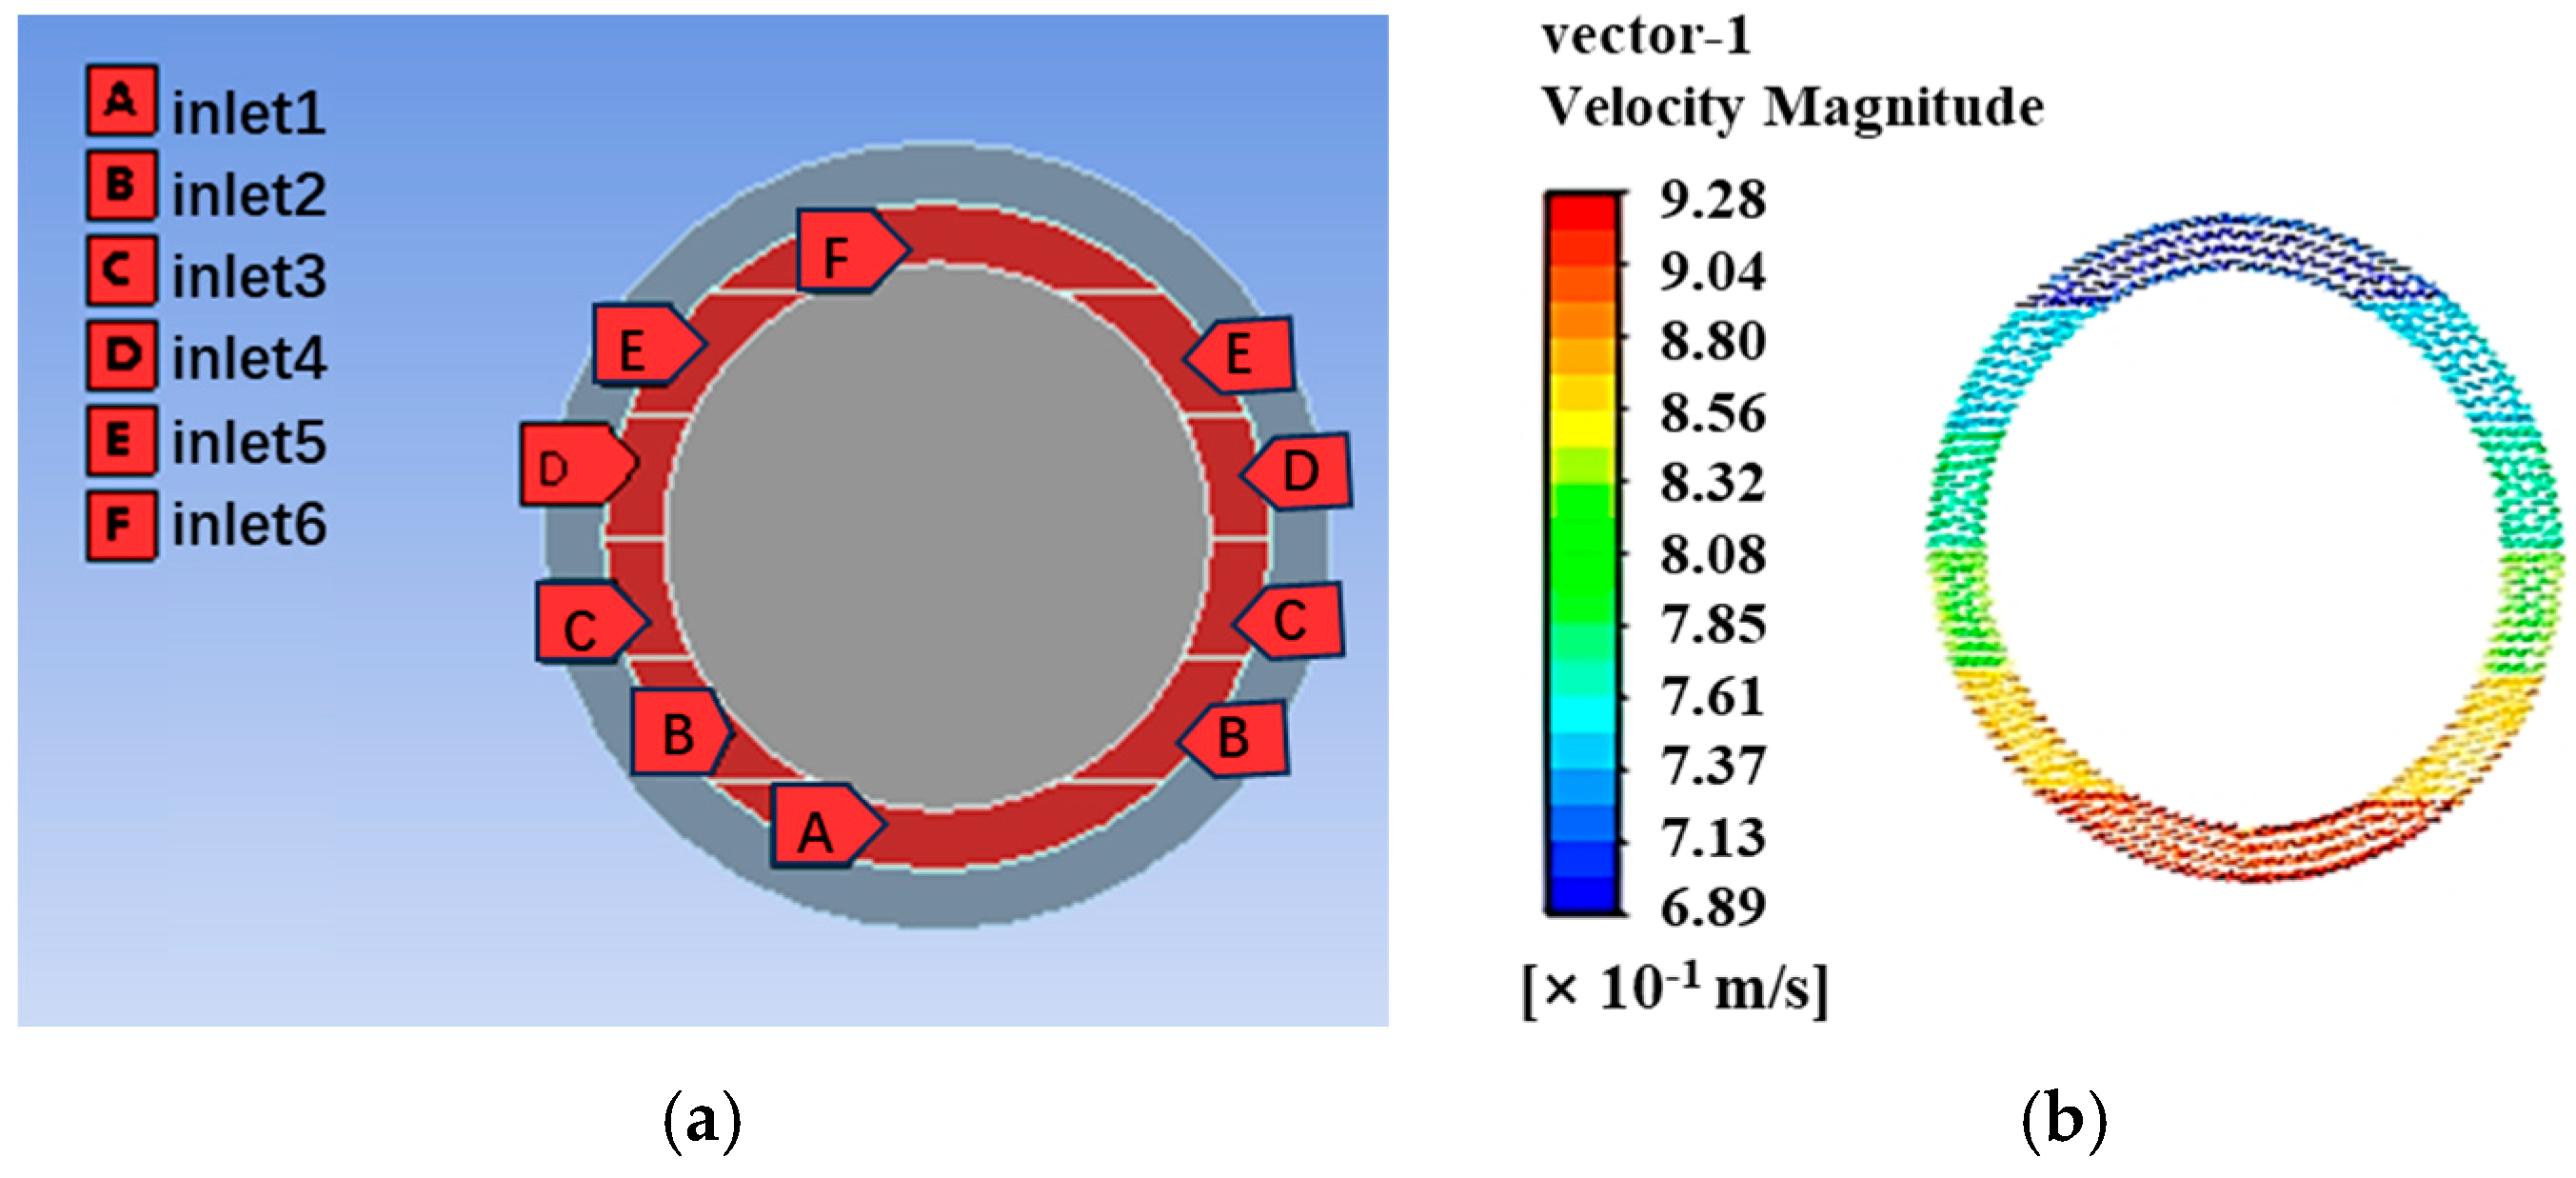
3. Configuration and Modeling

The side-pumped amplifier’s pumping scheme is illustrated in Figure 1a. The rod’s diameter is 18 mm, surrounded by a 2 mm thick cooling layer, and the glass tube has a wall thickness of 2 mm. The effective pumping length is 160 mm, while the total rod length is 200 mm. The structure of multiple annular LD arrays with a wavelength of 802 ± 1 nm is optimized for high-power pumping, and we have studied the realization of uniform fluorescence distribution within the laser rod [21]. In this paper, the detected fluorescence distribution is shown in Figure 1b.
A fluid–structure interaction model consisting of a glass tube, cooling channel, coolant, and laser rod was established in ANSYS FLUENT, as illustrated in Figure 2. The cooling channel is filled with coolant, which enters through one end of the glass tube and exits through the opposite end. Both ends are connected to external structure modules to facilitate coolant circulation. As a result, only the part of the rod enclosed within the glass tube is cooled by the coolant, while the other part is exposed to air to accommodate the laser rod’s fixed support structure.
In the LD-arrays-irradiated region of the laser rod, the absorbed pump laser power is treated as heat power. Generally, the conversion coefficient η is defined as the ratio of pump energy converted to heat power, with a value of 45% used for the laser rod. The LD arrays adopt a pulse pumping working mode and the pulse width, repetition frequency, and pump power are represented by τ , f , and P p u m p , respectively. We assume that the heat power within the rod is uniform for simplicity, and an average pump power is used in order to reduce the simulation time. Therefore, the heat power can be calculated by P p u m p η τ f . We divide it by the volume of the irradiated region as the value of internal heat source in the model. The simulation results in Section 4.1. are calculated when the internal heat source is estimated to be 1.29 × 10⁶ W/m3, corresponding to pump parameters of a 500 μs pulse width, 1 Hz repetition frequency, and 234 kW pump power. The input and output conditions of the simulation model are the fluid velocity inlet and the pressure outlet. Rod surfaces in contact with the coolant adhere to the fluid–structure interaction boundary conditions at the fluid–solid interface, while surfaces without coolant adopt the boundary conditions of natural convection heat exchange with air. The model’s initial temperature is typically set to room temperature 293.15 K. Gravity is also taken into account. The laser rod is a type of Nd glass (N31, Shanghai Institute of Optics and Fine Mechanics, Chinese Academy of Sciences, China), and the coolant is a kind of electronic fluorinated liquid (FC-770, 3M™ Fluorinert™, USA). Key model parameters are listed in Table 1 [22,23].
According to the Reynolds number N R e = ( D 2 D 1 ) v / μ of the coolant in the cooling channel, where v and μ denote the velocity and viscosity of the coolant, the flow of coolant inside the cooling channel can be considered turbulent. Using the FLUENT software, the solving process can be carried out by selecting appropriate simulation conditions [24]. The turbulent flow inside the cooling channel was simulated employing the realizable k-ε model and standard wall functions. The velocity and pressure fields are calculated using the pressure-based coupling algorithm. The second-order upwind scheme is used to improve the calculation accuracy. Through transient fluid–structure coupling calculations, the simulation results of the thermal characteristics and fluid velocity distribution of the system after achieving thermal equilibrium can be obtained.

4. Simulation Results

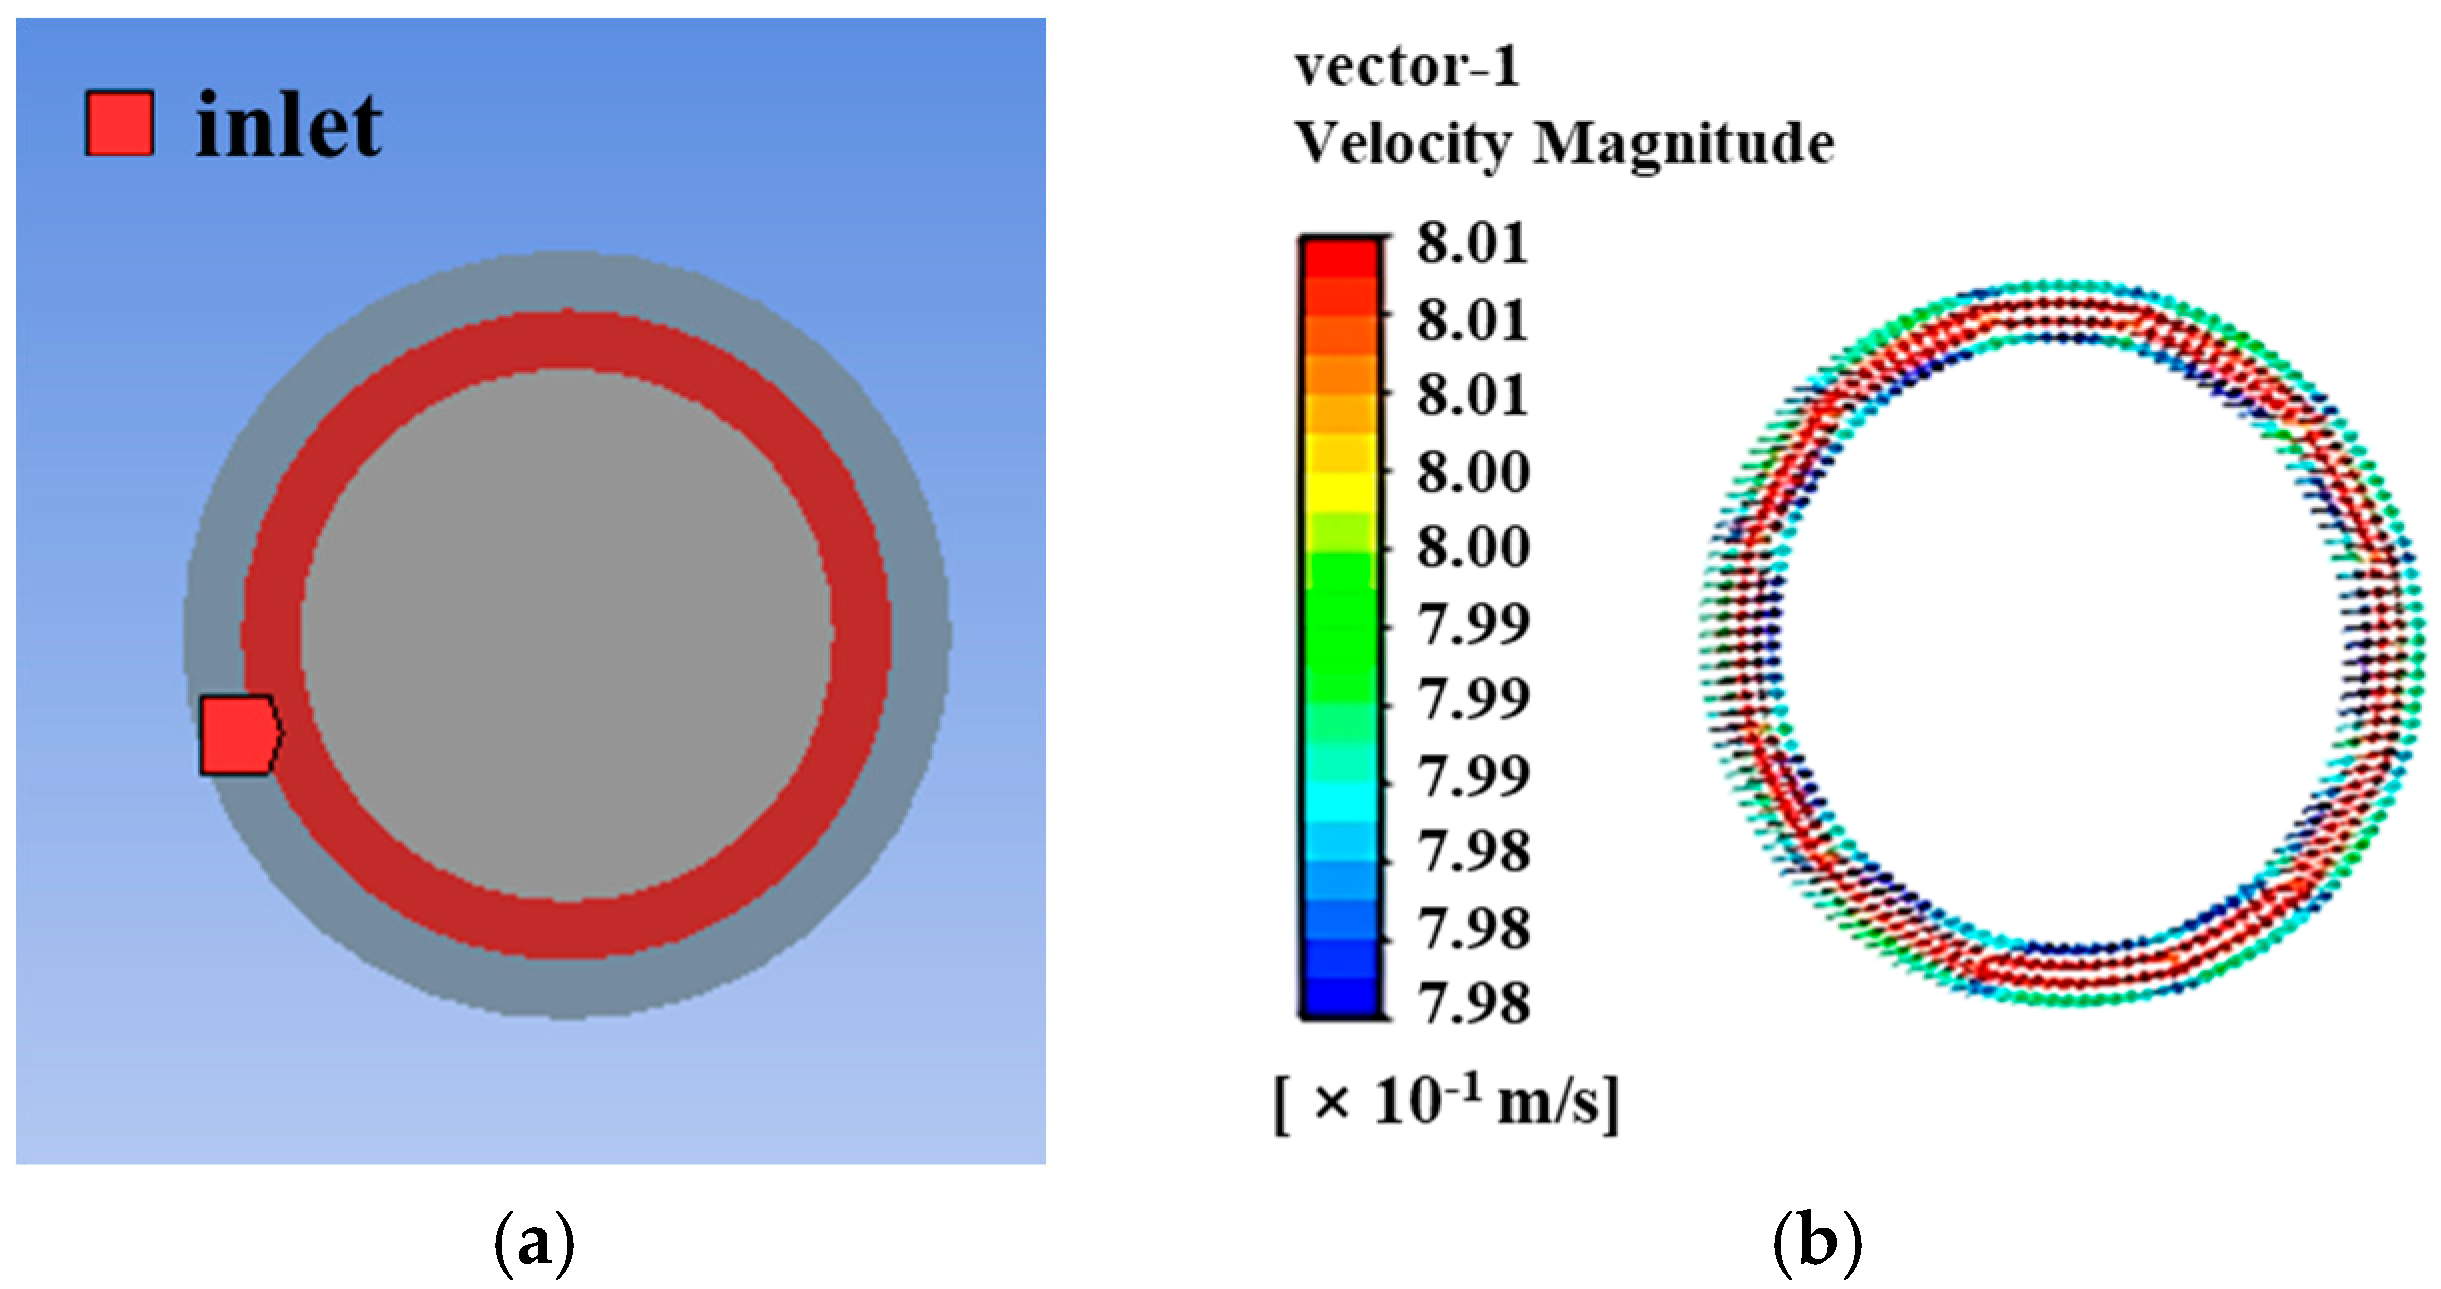
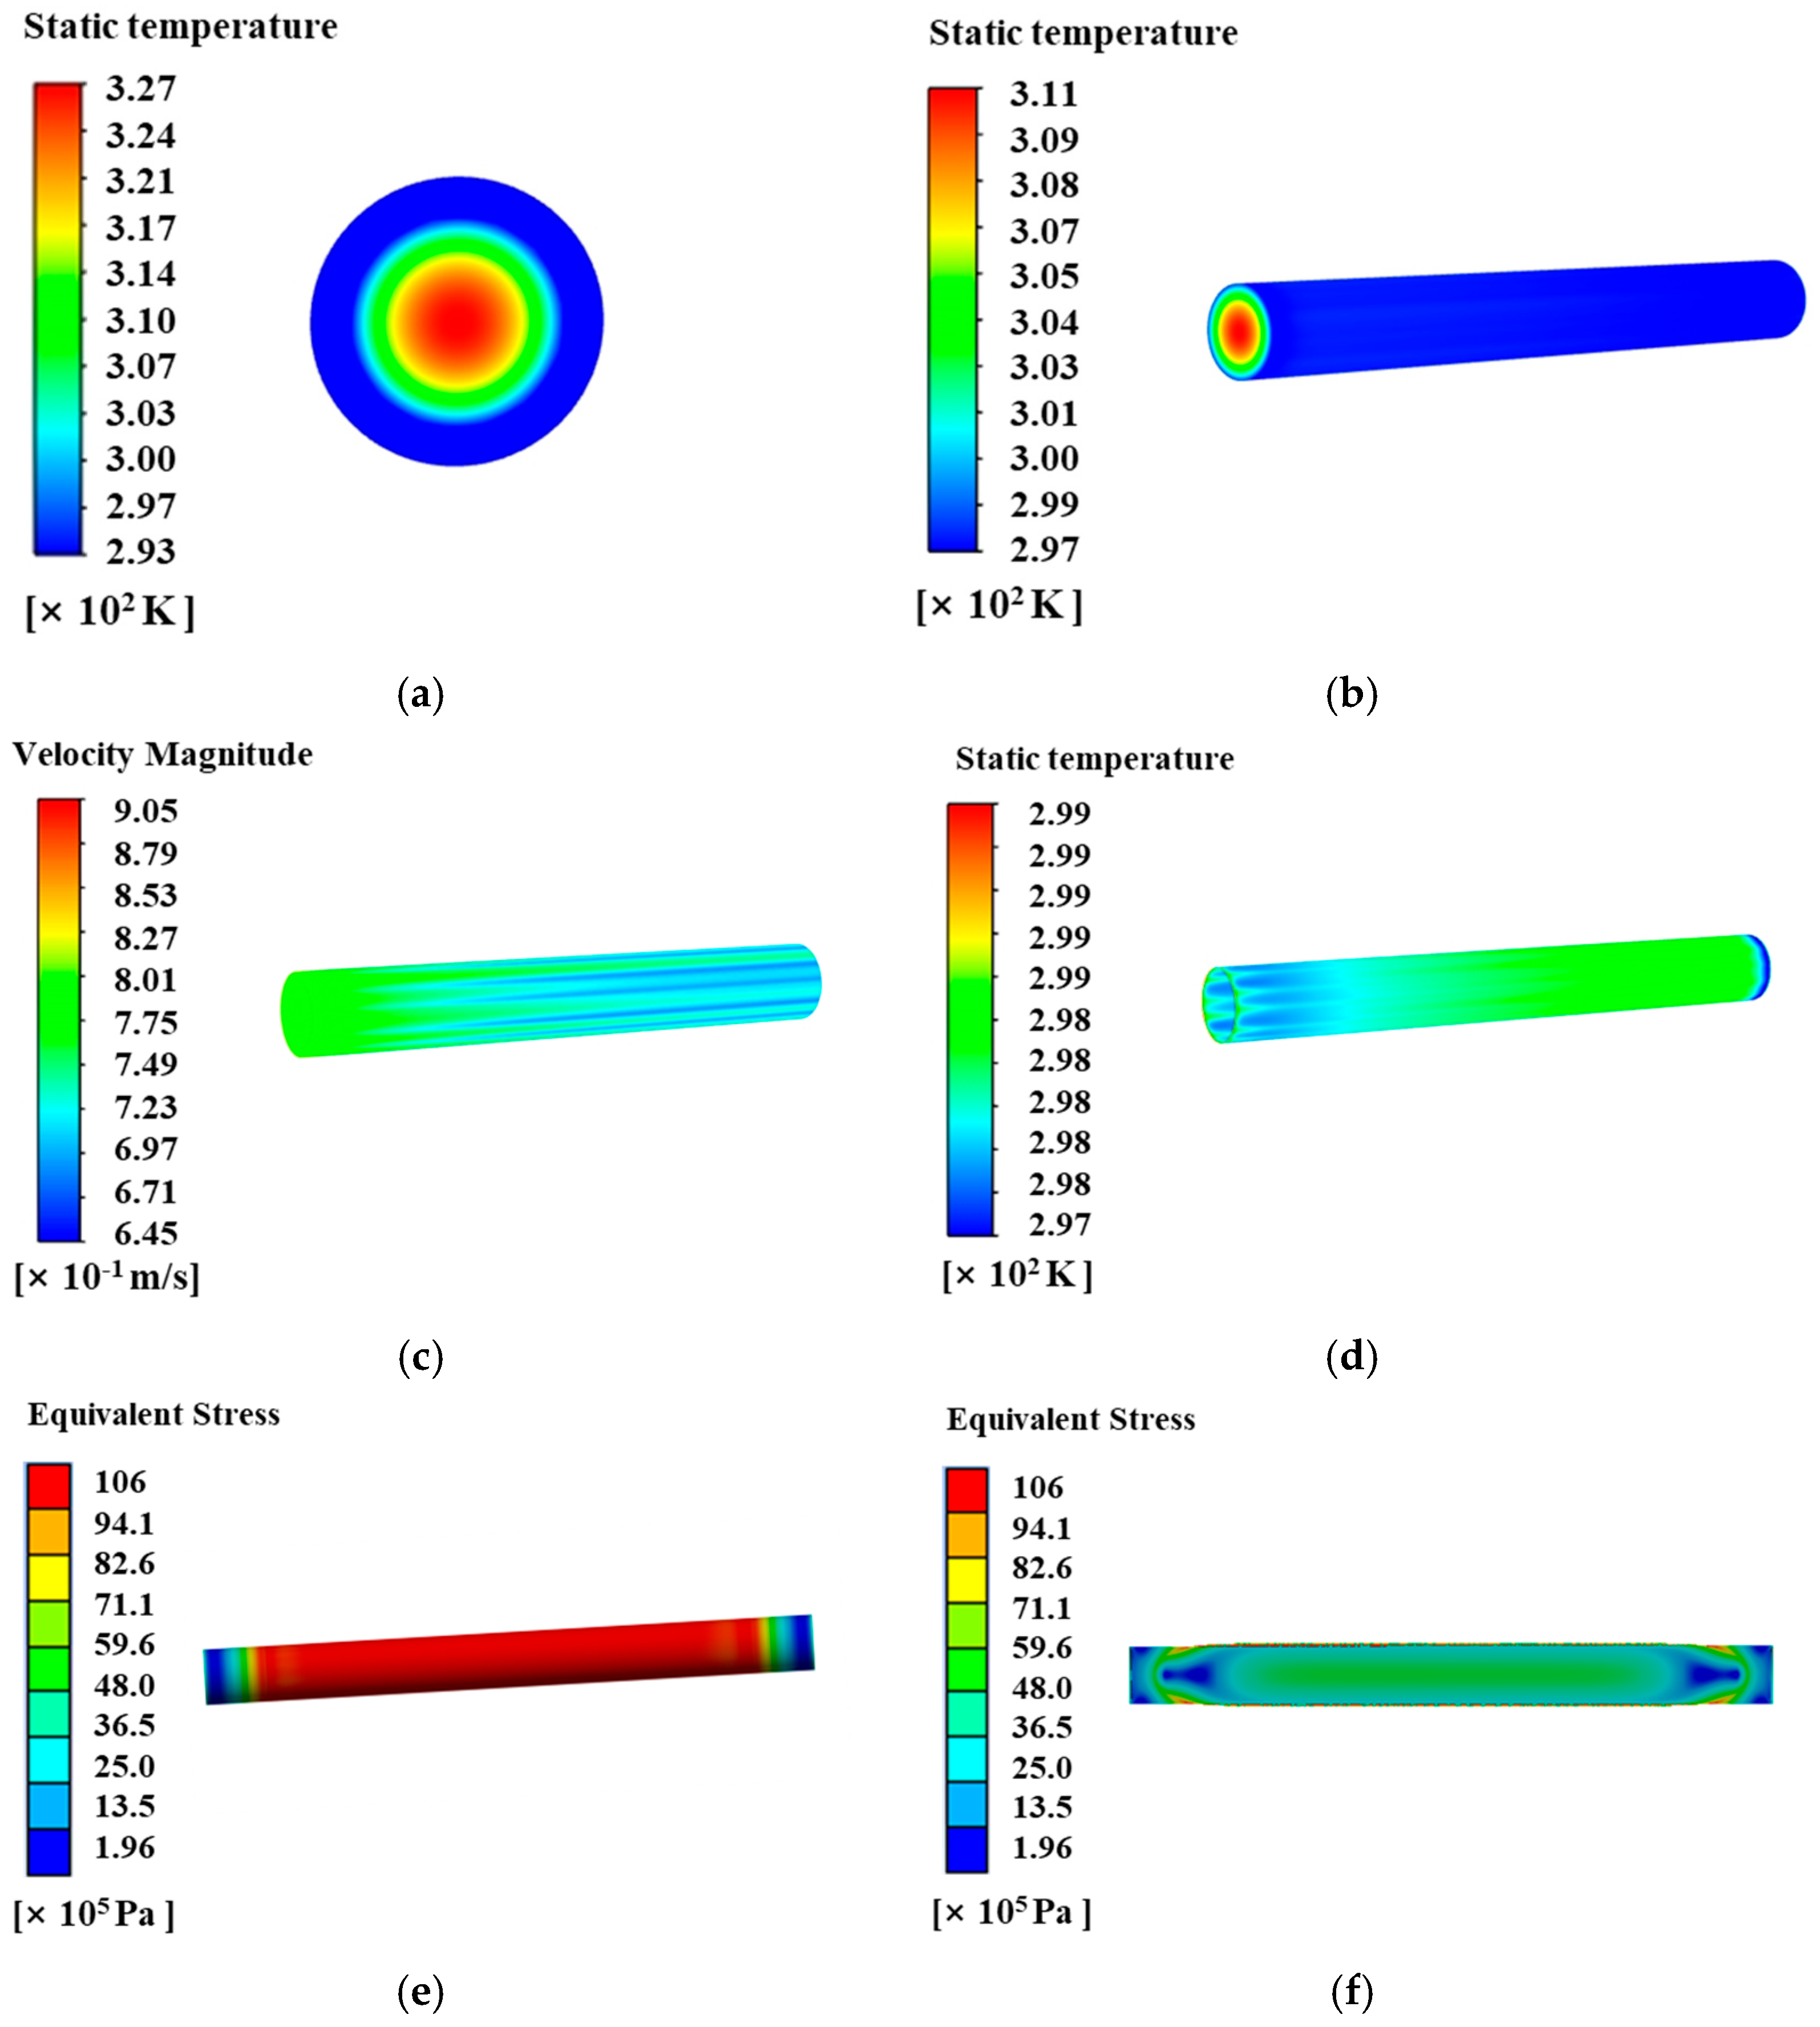
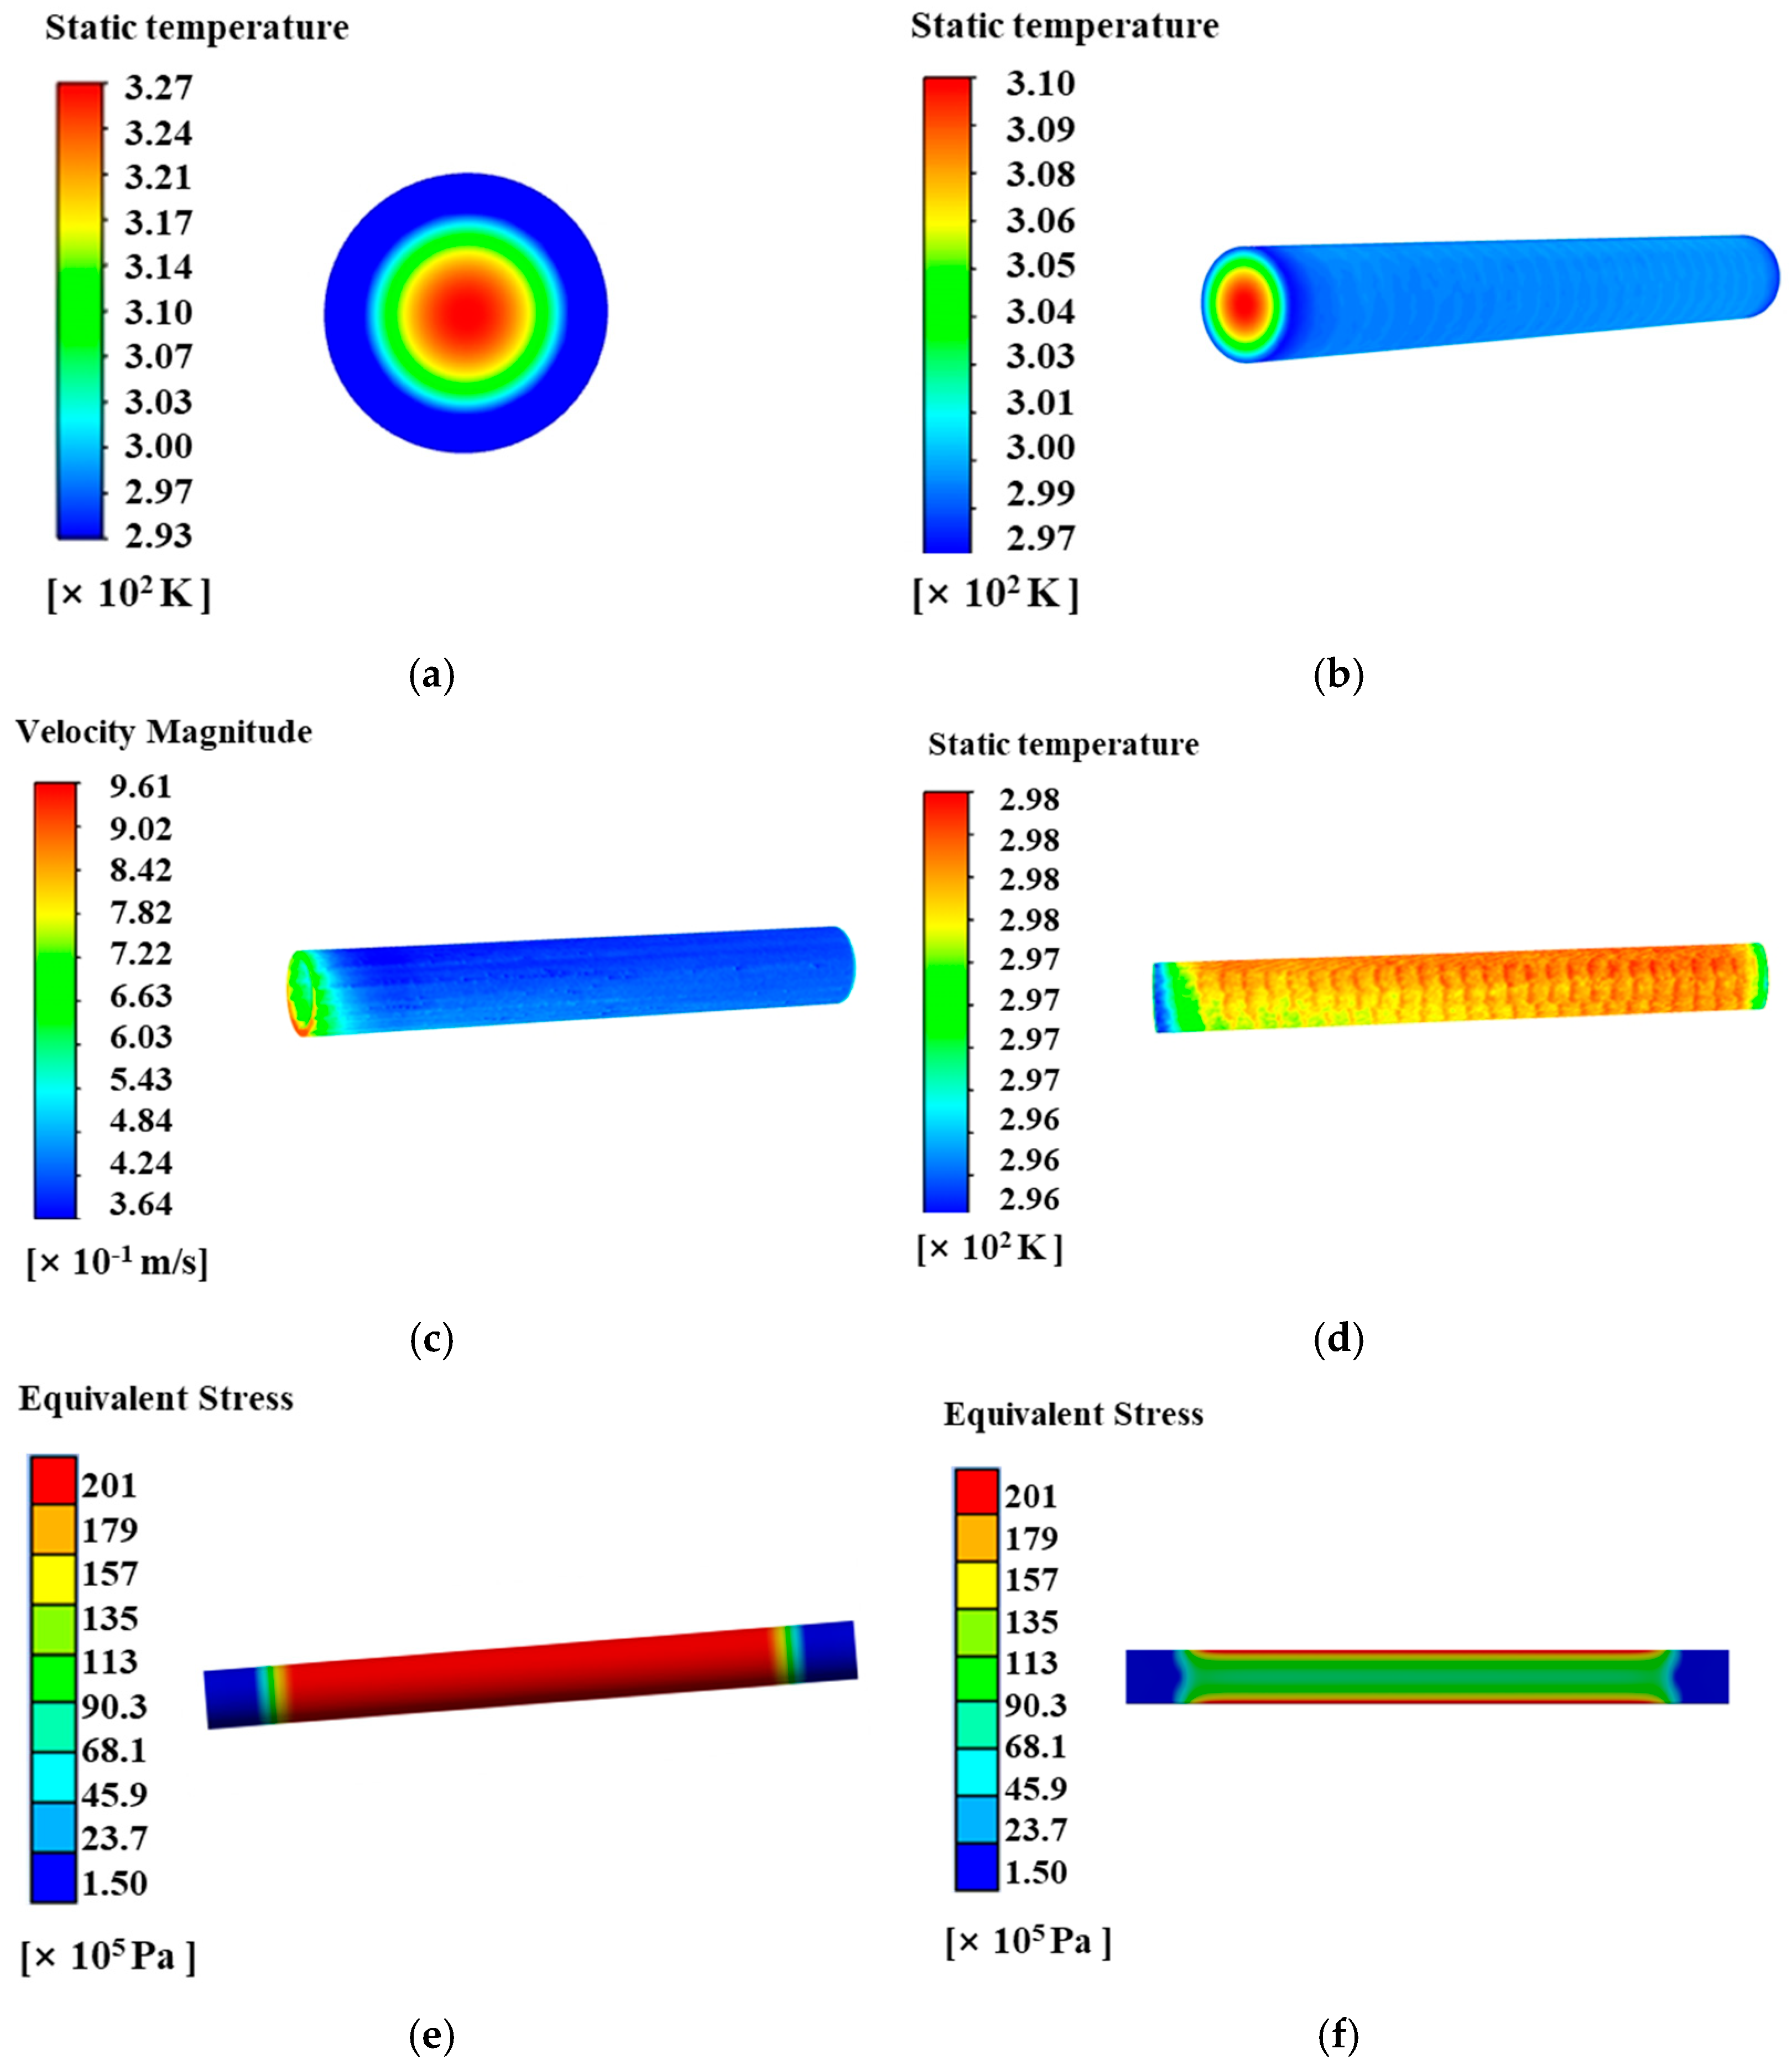
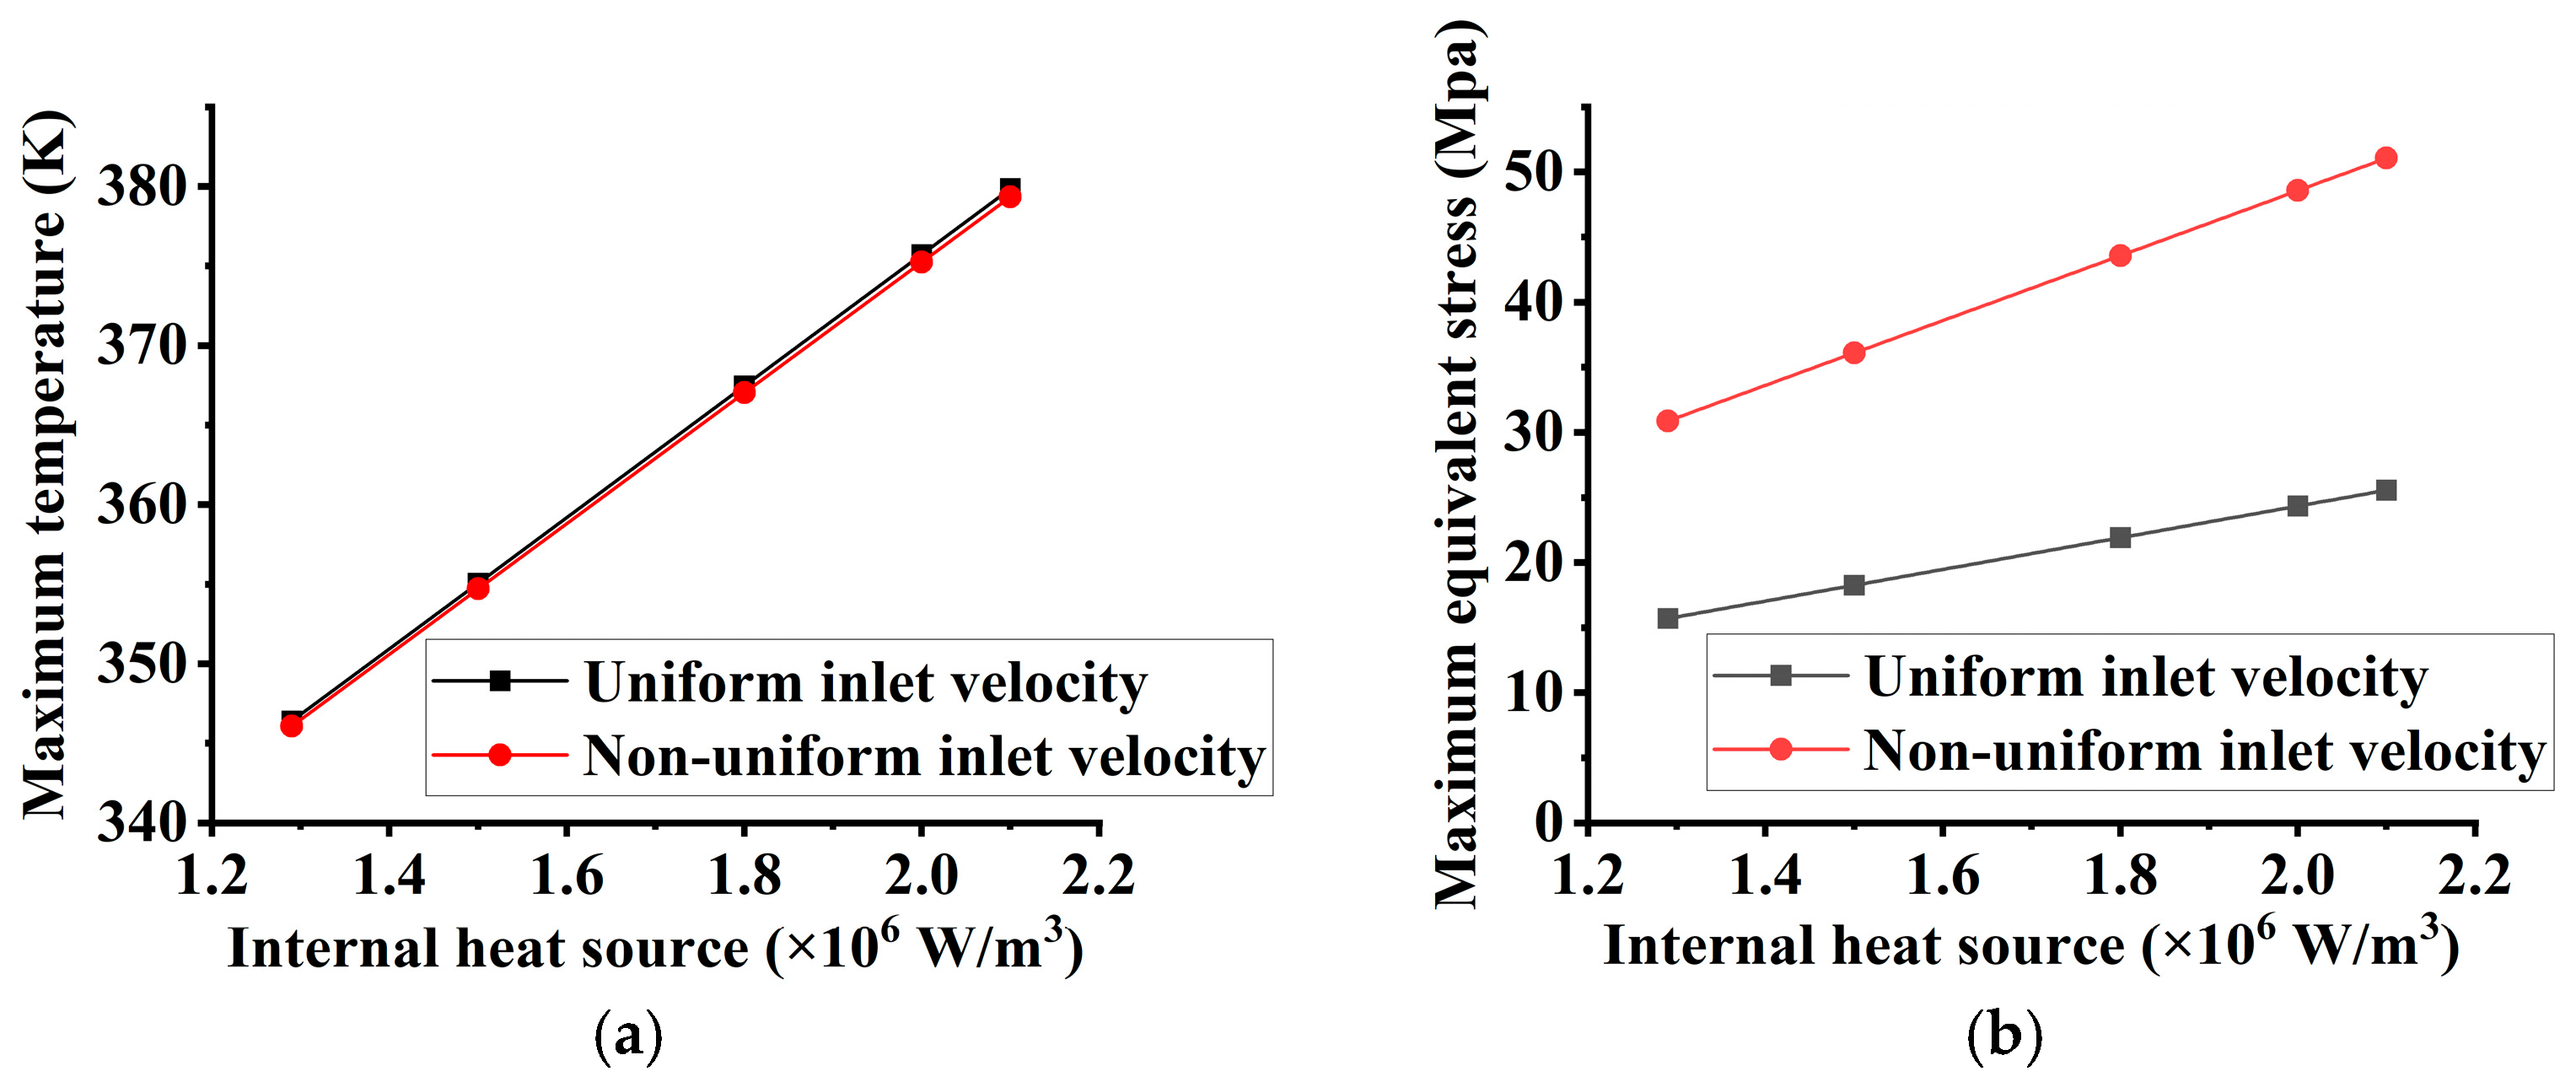
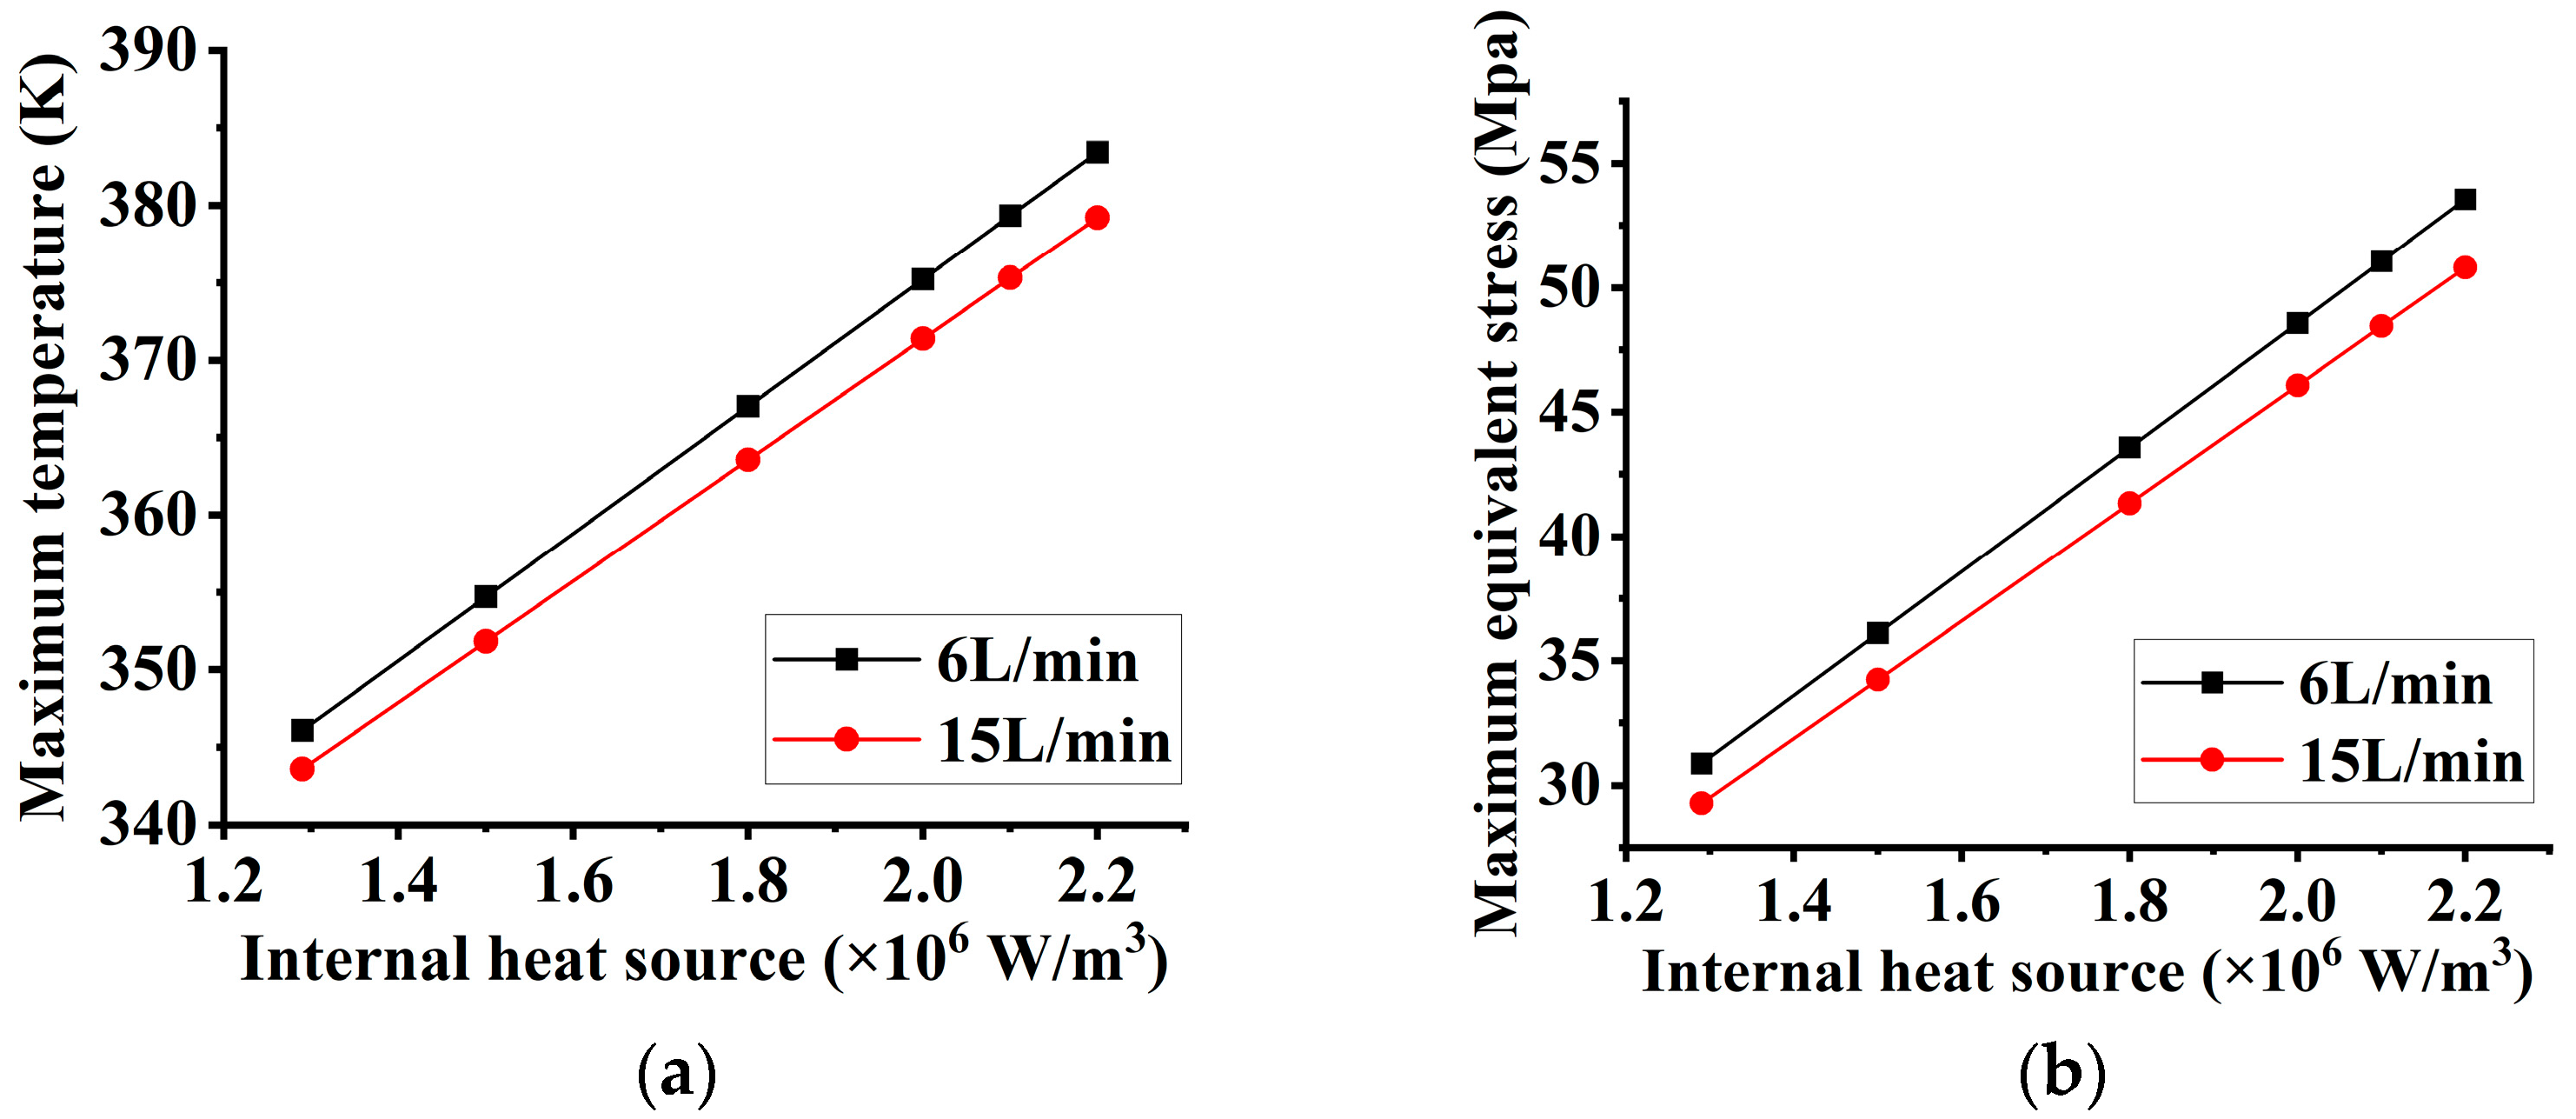
4.1. Unform Inlet Velocity Distribution

Figure 3a displays the inlet area of the cooling channel. The simulation results indicate that at a coolant velocity of 0.8 m/s, the velocity distribution on the inlet surface is unform, as shown in Figure 3b, with the maximum temperature of 327 K occurring at the center of the LD-arrays-irradiated region (Figure 4a). The maximum temperature on the outer surface of the rod is 311 K, as shown in Figure 4b. The coolant velocity distribution in the channel is shown in Figure 4c, which presents a decreasing change from the inlet to the outlet direction. The temperature distribution on the outer surface of the rod is shown in Figure 4d, which is an increasing change from the inlet to the outlet direction. The temperature trend is directly correlated with variations in coolant velocity: regions with higher coolant velocity exhibit more efficient heat dissipation and lower temperatures. The maximum equivalent stress is 10.6 Ma, as illustrated in Figure 4e. The equivalent stress distribution along the z-axis is shown in Figure 4f, and it indicates that the regions where the rod is supported are subjected to greater stress. While the above simulation assumes a uniform inlet velocity distribution, practical cooling structures often impose flow restrictions, leading to non-uniform inlet velocity distributions. Investigating such non-uniform conditions is therefore critical for advancing laser amplifier design and improving thermal management.

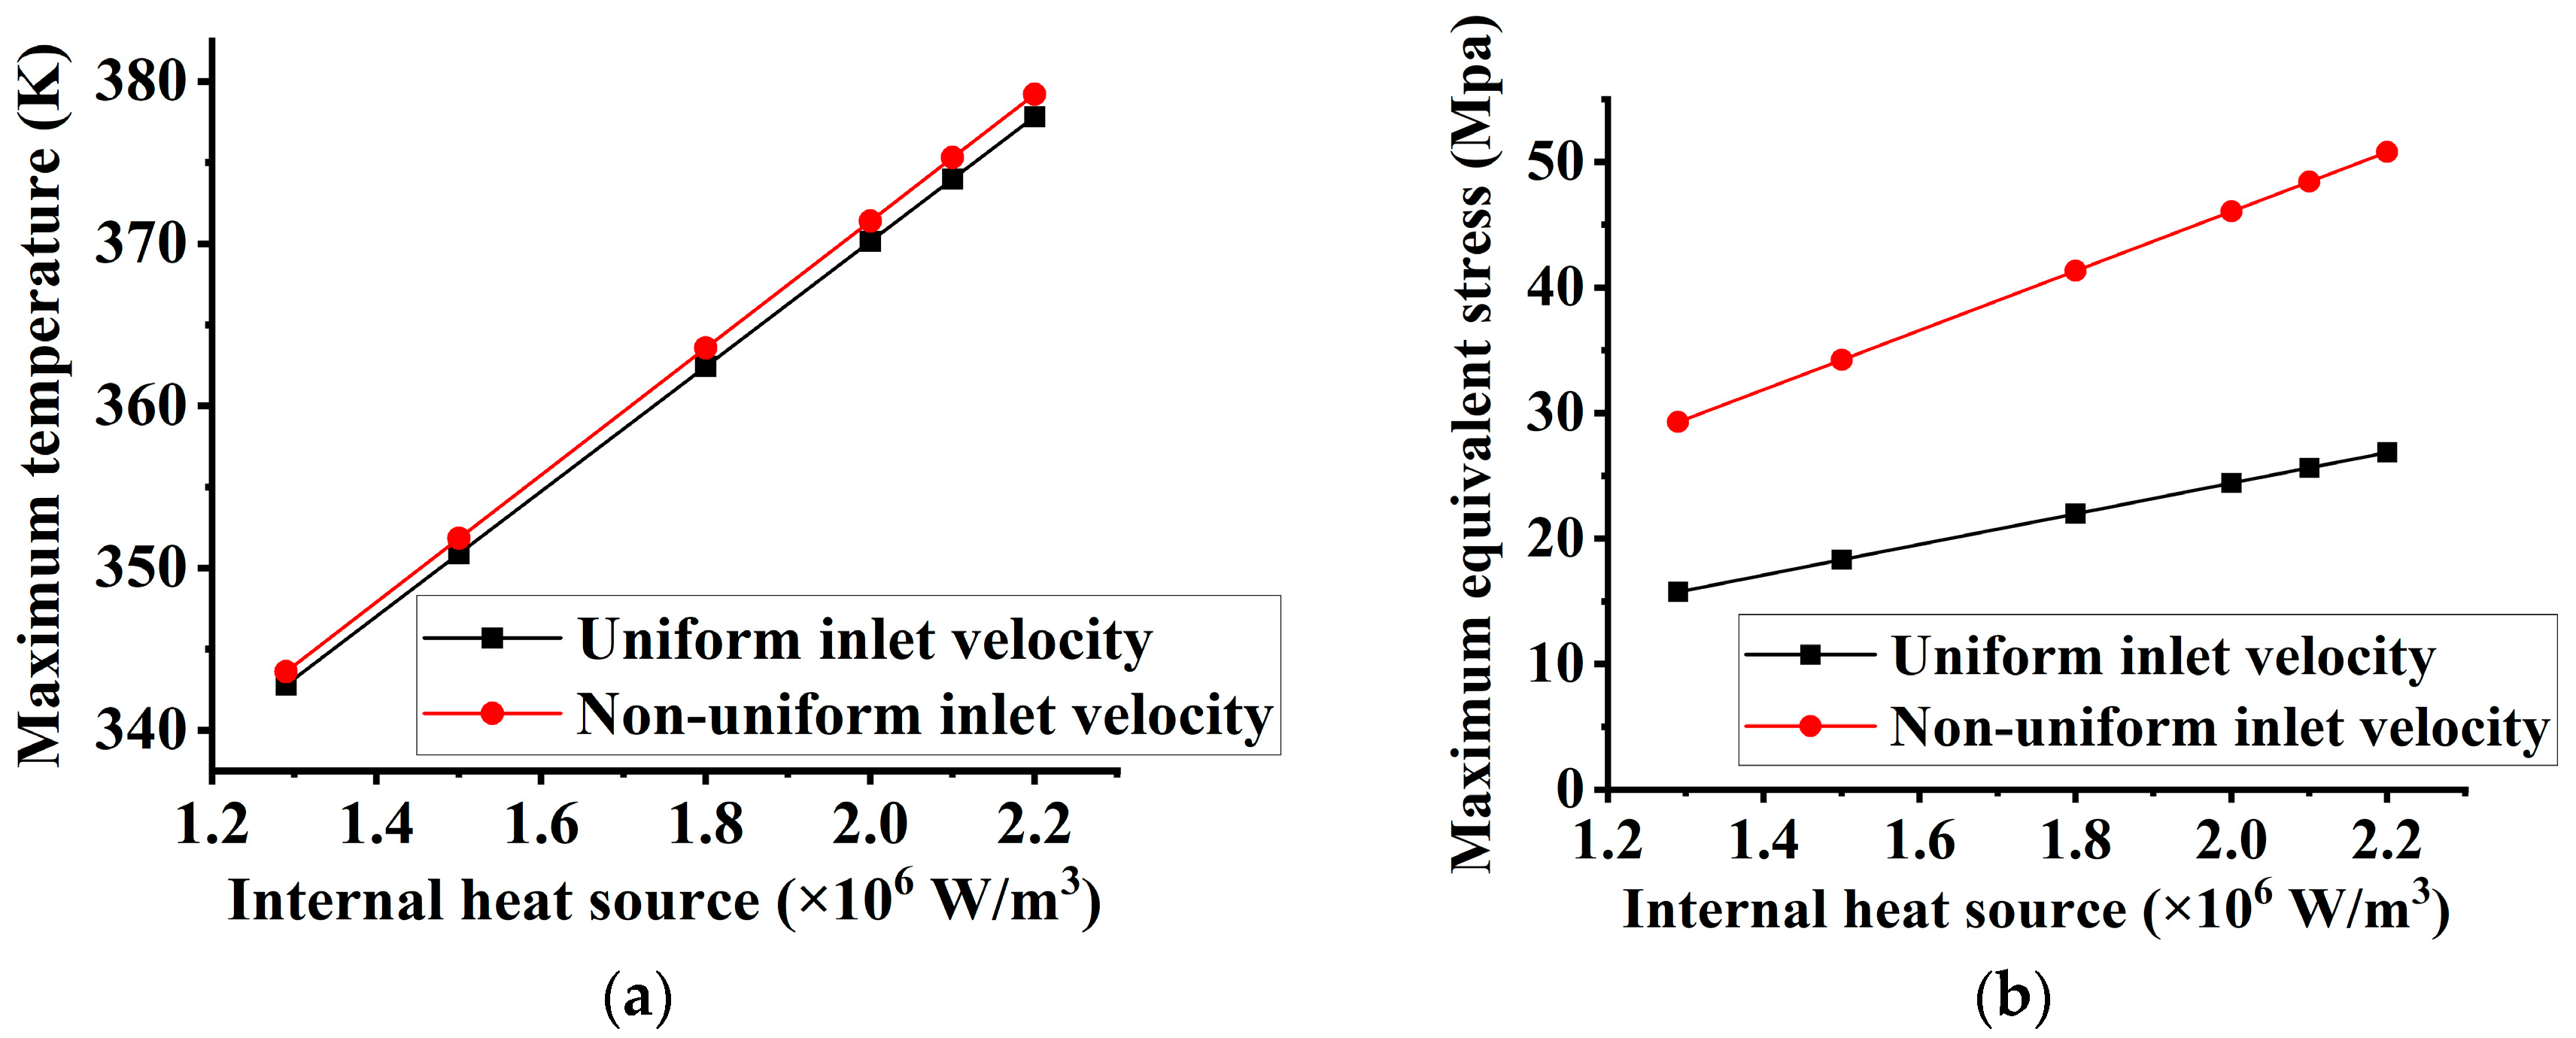
4.2. Non-Uniform Inlet Velocity Distribution

To characterize the effect of non-uniform inlet velocity distribution, the inlet surface is divided into six parts according to the cooling structure design, as shown in Figure 5a. The coolant flows from the cooling structure into the cooling channel through these six input regions. Different amplifiers have their own inlet structures, so the inlet area can be treated in different ways, for example, via continuous flow rate modulation. Here, the velocity decreases gradually from inlet1 to inlet6, and the total inlet flow rate can be calculated by the following:
u f t = i = 1 6 s i v i
where s i and v i are the area and inlet velocity of each part. While ensuring the same total flow rate with the partitioning, the uniform equivalent velocity at the inlet surface (without partitioning) is defined as:
v e q = u f t / i = 1 6 s i
The variation in the maximum or minimum velocity on the inlet surface relative to the equivalent velocity is approximately no more than 20%, which means ( v i n l e t _ max / min v e q ) / v e q ≤ 20%, as proven by the previous simulation. When v e q = 0.8   m / s , with the same total flow rate of 6 L/min and ( v i n l e t _ max / min v e q ) / v e q = 12.5 % , the velocity in each part from inlet1 to inlet6 is set as 0.9, 0.86, 0.82, 0.78, 0.74, and 0.7 m/s. The other solving conditions are the same as those without the partitioning. We hope to use this velocity variation on the inlet surface as a simplified means to investigate some different thermal characteristics. The simulated velocity result on the inlet surface is shown in Figure 5b, which matches the predefined profile. The temperature profile in the center cross-section remains nearly unchanged, as shown in Figure 6a. Other results exhibit some changes, with a non-uniform temperature distribution on the outer surface of the laser rod and an inconsistent coolant velocity distribution in the cooling channel. As shown in Figure 6b, although the maximum temperature value on the outer surface of the laser rod has remained basically unchanged, the temperature distribution on the outer surface of LD arrays irradiated region is not uniform, with some fluctuations that can be more clearly observed in Figure 6d. The coolant velocity distribution in the cooling channel is shown in Figure 6c. Compared to the results in Figure 4c, the velocity values are generally lower. The lower velocity is more likely to cause uneven heat dissipation, which may be the reason for the temperature fluctuations and significant change in terms of the maximum equivalent stress (Figure 6e). In Figure 6f, it also can be seen that the equivalent stress values near the outer surface are greater than at other parts. The maximum equivalent stress has increased to 20.1 MPa, almost doubling the previous value of 10.6 MPa. These results demonstrate that non-uniform inlet velocity distributions lead to a substantial increase in the maximum equivalent stress, while the maximum temperature of the rod remains the same.
To enhance heat dissipation, higher coolant inlet velocities are typically employed. Thermal simulation results are presented in Figure 7 with varying inlet total flow rates. In the case of non-uniform inlet velocity distributions, the velocity decreases equally from inlet1 to inlet6, with inlet1 ( v i n l e t 1 ) having the highest velocity, maintaining the same ratio ( v i n l e t 1 v e q ) / v e q at different flow rates. At a constant total flow rate, there are differences in the trends in the maximum temperature and maximum equivalent stress between the uniform and non-uniform inlet velocities. At an inlet total flow rate of 6 L/min, the maximum temperature with a non-uniform inlet velocity is slightly higher than the uniform case. Conversely, at inlet total flow rates exceeding 10 L/min, the maximum temperature with a non-uniform inlet velocity is consistently slightly lower than the results with a uniform inlet velocity. This indicates that a non-uniform inlet velocity can reduce the maximum temperature rise of the laser rod to some extent at higher flow rates. The maximum equivalent stress results show that as the flow rate increases, the maximum equivalent stress remains nearly consistent under a uniform inlet velocity, whereas it decreases slightly under a non-uniform inlet velocity. Notably, substantial differences exist in the maximum equivalent stress between the two velocity conditions. In most cases, the assumption of a uniform inlet flow velocity can result in a significant discrepancy in the predicted maximum equivalent stress, compared to the actual non-uniform inlet velocity profile. This could be a contributing factor to the tendency of laser rods to fracture in practical applications.
Simulations of the maximum temperature and maximum equivalent stress with an increasing internal heat source are shown in Figure 8. At an inlet total flow rate of 6 L/min, the maximum temperature with a non-uniform inlet velocity remains comparable to the uniform case as the internal heat source increases, indicating that at lower flow rates, a non-uniform inlet velocity has a negligible effect on the maximum temperature. Conversely, the impact of a non-uniform inlet velocity on the maximum equivalent stress is notably higher than that of the uniform conditions. The results reveal that as the internal heat source increases, the maximum equivalent stresses under a uniform and non-uniform inlet velocity show a similar increasing trend but with a widening gap between them. When the internal heat source is 2.1 × 10⁶ W/m3, the maximum equivalent stress with a non-uniform inlet velocity exceeds the laser rod’s fracture limit (51 MPa), predicting that the laser rod would break under these thermal loads. In contrast, the maximum equivalent stress with a uniform inlet velocity only reaches approximately 25 MPa.
In high-power laser amplifiers, inlet flow rates exceeding 6 L/min are commonly used to optimize heat dissipation. When the inlet flow rate is 15 L/min, Figure 9 illustrates the simulated results under varying internal heat source conditions. The maximum temperatures increase with the internal heat source for both inlet velocity distributions, though minor differences exist between the two cases. This implies that non-uniform inlet velocity distributions at higher flow rates have a marginal effect on the maximum temperature. With an increase in the internal heat source, the maximum equivalent stress also exhibits an upward trend, but the growth rate varies. The non-uniform inlet velocity distributions have a more severe impact on the maximum equivalent stress. When the internal heat source is 2.2 × 10⁶ W/m3, the laser rod will fracture due to exceeding its fracture limit. In contrast, under a uniform inlet velocity, the maximum equivalent stress remains at only about 27 MPa below the failure threshold.
Accompanied by the enhancement of internal heat sources, the simulation results in Figure 10 compare and analyze the effects of different flow rates on heat dissipation with a non-uniform inlet velocity. Increasing the coolant flow rate from 6 L/min to 15 L/min enhances the heat dissipation efficiency, leading to a lower maximum temperature and equivalent stress. The rate of changes in both temperature and stress, with an increasing internal heat source, are similar between the two flow rates. When the internal heat source is 2.1 × 10⁶ W/m3, the maximum equivalent stress at 6 L/min exceeds 51 MPa, causing the laser rod to fracture under such loading conditions. However, with a flow rate of 15 L/min, the maximum equivalent stress remains below 50 MPa, and no fracture occurs. As the internal heat rate reaches 2.2 × 10⁶ W/m3, both flow rates result in maximum equivalent stresses exceeding 51 MPa, leading to the occurrence of fracture.

5. Conclusions

In conclusion, through detailed presentation of the temperature and stress simulation results under both uniform and non-uniform inlet velocity distribution conditions, this study reveals that the inlet velocity distribution significantly influences the maximum equivalent stress in laser rods. These findings highlight the necessity of utilizing a fluid–structure interaction model that includes a glass tube, cooling channel, coolant, and laser rod for a more accurate simulation of the thermal performance of side-pumped laser amplifiers, rather than relying solely on standalone laser rod thermal models. By incorporating a non-uniform inlet velocity into the solving conditions, more accurate thermal performance results can be achieved. At higher flow rates, the non-uniform inlet velocity distribution has a negligible effect on the maximum temperature reduction. However, it can induce approximately twice the maximum equivalent stress compared to the uniform case. With the increase in the internal heat source, there is only a slight difference in the maximum temperature results between the two types of inlet velocity distributions, but the maximum equivalent stress results still exhibit significant differences. Conventional simulations often assume uniform inlet velocity distributions for simplicity, but actually, the distribution is non-uniform due to the complex cooling channel structure. When using a uniform inlet velocity as the input condition, the stress results obtained are generally lower than that with a non-uniform inlet velocity distribution, despite similar temperature outcomes. Therefore, it is possible that even if the simulated stress results under uniform conditions lie below the fracture limit, in practical applications under the same thermal loading, the laser rod may still break. This could be attributed to the non-negligible impact of the non-uniform inlet velocity distribution. Hence, in the designing process of laser amplifiers, the actual inlet velocity distribution should be considered, and a fluid–structure interaction model is preferred for more accurate simulation results.

Author Contributions

S.N. performed the modeling and simulation, conducted the analysis of the results, and wrote the draft; J.L. carried out data results verification and code writing; T.Z. provided the software and revised the draft; X.L. gave suggestions on project management and provided helpful discussions on the results. All authors have read and agreed to the published version of the manuscript.

Funding

This research was funded by the second open project of the Palace Museum (No. 202405008, which received public funding from Longfor-Palace Museum Cultural Fund and The Forbidden City Cultural Heritage Conservation Foundation) and Youth Innovation Promotion Association CAS.

Institutional Review Board Statement

Not applicable.

Informed Consent Statement

Not applicable.

Data Availability Statement

Data is contained within the article.

Conflicts of Interest

The authors declare no conflicts of interest.

References

  1. Divoký, M.; Pilař, J.; Hanuš, M.; Navrátil, P.; Denk, O.; Severová, P.; Mason, P.; Butcher, T.; Banerjee, S.; De Vido, M.; et al. 150 J DPSSL operating at 1.5 kW level. Opt. Lett. 2021, 46, 5771–5773. [Google Scholar] [CrossRef] [PubMed]
  2. Xu, J.; Kong, M.; Lin, A.; Song, Y.; Han, J.; Xu, Z.; Wu, B.; Gao, S.; Deng, N. Directly modulated green-light diode-pumped solid-state laser for underwater wireless optical communication. Opt. Lett. 2017, 42, 1664–1667. [Google Scholar] [CrossRef] [PubMed]
  3. Koechner, W. Solid-State Laser Engineering; Springer: New York, NY, USA, 2006. [Google Scholar]
  4. Nomura, J.; Hirosawa, K.; Yanagisawa, T.; Ohata, N.; Imamura, S.; Sakaizawa, D.; Tomii, N. Single-frequency 45-mJ pulses from a MOPA system using an Er,Yb:glass planar waveguide amplifier and a large mode area Er-doped fiber amplifier. Opt. Lett. 2023, 48, 1758–1761. [Google Scholar] [CrossRef] [PubMed]
  5. Kuznetsov, I.; Mukhin, I.; Palashov, O.; Ueda, K.-I. Thin-rod Yb:YAG amplifiers for high average and peak power lasers. Opt. Lett. 2018, 43, 3941–3944. [Google Scholar] [CrossRef] [PubMed]
  6. Zhao, T.; Fan, Z.; Xiao, H.; Huang, K.; Bai, Z.; Ge, W.; Zhang, H. Realizing Gaussian to flat-top beam shaping in traveling-wave amplification. Opt. Express 2017, 25, 33226–33235. [Google Scholar] [CrossRef]
  7. Nie, S.; Zhao, T.; Fan, Z.; Hong, X. Thermal effect of large-diameter laser rod in multi-direction side-pump high power pulsed Nd:YAG laser amplifier. In Proceedings of the International Symposium on Optoelectronic Technology and Application 2016, Beijing, China, 9–11 May 2016; p. 101520H. [Google Scholar]
  8. Ebadian, H.; Maleki, A. Efficient thermal induced birefringence compensation in a QCW diode pumped Nd:YAG laser. Optik 2018, 165, 362–369. [Google Scholar] [CrossRef]
  9. Huang, W.; Guo, J.; Lu, X.; Wang, J.; Fan, W.; Li, X.; Zhu, J. Diode-end-pumped all-liquid-cooled square rod Nd: Glass amplifier with sub-joule energy extraction and ultralow thermal induced wavefront. Opt. Laser Technol. 2022, 152, 108084. [Google Scholar] [CrossRef]
  10. Guoying, F.; Qunfei, O.; Jianguo, C.; Mingzhong, L. Simulation of the thermal effects in diode-pumped rod laser. In Proceedings of the Optical Science and Technology, SPIE’s 48th Annual Meeting, San Diego, CA, USA, 3–8 August 2003; pp. 43–48. [Google Scholar]
  11. Ye, X.; Xu, X.; Ren, H.; Zhang, B.; Lu, Y.; Chen, X.; Zhang, L.; Wei, X.; Wan, M.; He, T. Enhanced high-slope-efficiency and high-power LD side-pumped Er:YSGG laser. Appl. Opt. 2019, 58, 9949–9954. [Google Scholar] [CrossRef] [PubMed]
  12. Zhang, Y.; Gu, H.; Cui, L.; Jiang, J.; Hao, H. Research on the LD side pumping field of solid-state lasers. In Proceedings of the SPIE Security + Defence, Strasbourg, France, 9–12 September 2019; Volume 11162. [Google Scholar]
  13. Wang, W.; Zhao, Q.; Gao, W.; Hu, Z.; Zhao, Q.; Yang, S. Thermo-Optic Numerical Research on Segmented Circular LD Arrays Side-Pumping a Nd:YAG Laser Rod. Appl. Sci. 2020, 10, 7316. [Google Scholar] [CrossRef]
  14. Weber, R.; Neuenschwander, B.; Weber, H.P. Thermal effects in solid-state laser materials. Opt. Mater. 1999, 11, 245–254. [Google Scholar] [CrossRef]
  15. Nie, S.; Zhao, T.; Xiao, H.; Zhao, S. Influence of model characteristic parameters on thermal effect analysis of solid-state laser. In Proceedings of the 24th National Laser Conference & Fifteenth National Conference on Laser Technology and Optoelectronics, Shanghai, China, 17–20 October 2020. [Google Scholar]
  16. Nie, S.; Zhao, T.; Liu, X.; Qu, P.; Yang, Y.; Wang, Y. The Effect of Cooling Layer Thickness and Coolant Velocity on Crystal Thermodynamic Properties in a Laser Amplifier. Micromachines 2023, 14, 299. [Google Scholar] [CrossRef] [PubMed]
  17. Hsu, S.T. Engineering Heat Transfer; D. Van Nostrand Company: Princeton, NJ, USA, 1963. [Google Scholar]
  18. Tao, W. Numerical Heat Transfer; Xi’an Jiaotong University Press: Xi’an, China, 2001. [Google Scholar]
  19. Yang, S.T.W. Heat Transfer; Higher Education Press: Beijing, China, 2006. [Google Scholar]
  20. Ding, J.; Li, Y.; Chen, H.; Cai, Y.; Bai, Z.; Qi, Y.; Yan, B.; Wang, Y.; Lu, Z. Thermal modeling of an external cavity diamond Raman laser. Opt. Laser Technol. 2022, 156, 108578. [Google Scholar] [CrossRef]
  21. Xiao, H.; Zhao, T.; Fan, Z.; Huang, K.; Yu, J. Pump Design of Large-Diameter Axial Non-Uniform Nd:YAG Crystal. Chin. J. Lasers 2015, 42, 0602002. [Google Scholar] [CrossRef]
  22. Wang, X.; Hu, L.; Chen, S.; Tang, J.; Meng, T.; Chen, W.; Weng, Z.; Chen, H.; Hu, J.; Chen, Y.; et al. Review of Development of Nd⁃Doped Laser Glass in China. Chin. J. Lasers 2024, 51, 1101008. [Google Scholar]
  23. Li, J. Study on thermal design and thermal analysis of liquid cooling plate with FC-770. Comput. Meas. Control 2023, 31, 160–165. [Google Scholar]
  24. Wu, G.; Zhao, X.; Shi, D.; Wu, X. Analysis of Fluid–Structure Coupling Vibration Mechanism for Subsea Tree Pipeline Combined with Fluent and Ansys Workbench. Water 2021, 13, 955. [Google Scholar] [CrossRef]
Figure 1. (a) The pumping scheme of a side-pumped laser amplifier; (b) the detected fluorescence distribution.
Photonics 12 00603 g001
Figure 2. The fluid–structure interaction model. (a) Three-dimensional model; (b) LD-arrays-irradiated region in the model.
Photonics 12 00603 g002
Figure 3. (a) The inlet area; (b) the velocity result on the inlet surface.
Photonics 12 00603 g003
Figure 4. The simulation results with unform inlet velocity distribution: (a) the temperature profile in the center cross-section of the laser rod; (b) the temperature distribution on the outer surface of the laser rod; (c) the coolant velocity distribution in the cooling channel; (d) the temperature distribution on the outer surface of LD-arrays-irradiated region of the laser rod; (e) the equivalent stress result of the laser rod; (f) the equivalent stress distribution along the z-axis within the laser rod.
Photonics 12 00603 g004
Figure 5. (a) The six parts at the inlet area; (b) the velocity result on the inlet surface.
Photonics 12 00603 g005
Figure 6. The simulation results with non-unform inlet velocity distribution: (a) the temperature profile in the center cross-section of the laser rod; (b) the temperature distribution on the outer surface of the laser rod; (c) the coolant velocity distribution in the cooling channel; (d) the temperature distribution on the outer surface of LD-arrays-irradiated region of the laser rod; (e) the equivalent stress result of the laser rod; (f) the equivalent stress distribution along the z-axis within the laser rod.
Photonics 12 00603 g006
Figure 7. The results under different inlet total flow rate: (a) maximum temperature results; (b) maximum equivalent stress results.
Photonics 12 00603 g007
Figure 8. The results with different internal heat sources when the flow rate is 6 L/min: (a) maximum temperature results; (b) maximum equivalent stress results.
Photonics 12 00603 g008
Figure 9. The results with different internal heat sources when the flow rate is 15 L/min: (a) maximum temperature results; (b) maximum equivalent stress results.
Photonics 12 00603 g009
Figure 10. The results of different flow rates with non-uniform inlet velocity: (a) maximum temperature results; (b) maximum equivalent stress results.
Photonics 12 00603 g010
Table 1. Parameters used for the model.
Parameter (Materials)Value (Units)
Density (laser rod)2870 kg/m3
Thermal conductivity (laser rod)0.63 W/m/K
Specific heat (laser rod)680 J/kg/K
Coefficient of thermal expansion (laser rod)1.27 × 10⁻⁵ /K
Young’s modulus (laser rod)5.85 × 10¹⁰ Pa
Poisson’s ratio (laser rod)0.232
Density (coolant)1793 kg/m3
Thermal conductivity (coolant)0.063 W/m/K
Specific heat (coolant)1038 J/kg/K
Viscosity (coolant)1.359 × 10⁻³ kg/m/s
Density (glass tube)2200 kg/m3
Thermal conductivity (glass tube)1.4 W/m/K
Specific heat (glass tube)670 J/kg/K
Disclaimer/Publisher’s Note: The statements, opinions and data contained in all publications are solely those of the individual author(s) and contributor(s) and not of MDPI and/or the editor(s). MDPI and/or the editor(s) disclaim responsibility for any injury to people or property resulting from any ideas, methods, instructions or products referred to in the content.

