Article

Large Vessel Segmentation and Microvasculature Quantification Based on Dual-Stream Learning in Optic Disc OCTA Images

by
Jingmin Luan
1,
Zehao Wei
1,
Qiyang Li
1,
Jian Liu
2,
Yao Yu
2,
Dongni Yang
3,
Jia Sun
3,
Nan Lu
3,
Xin Zhu
4 and
Zhenhe Ma
2,*
1
School of Computer and Communication Engineering, Northeastern University at Qinhuangdao, No. 143 Taishan Road, Qinhuangdao 066004, China
2
School of Control Engineering, Northeastern University at Qinhuangdao, No. 143 Taishan Road, Qinhuangdao 066004, China
3
Department of Ophthalmology, The First Hospital of Qinhuangdao, Qinhuangdao 066001, China
4
Department of AI Technology Development, M&D Data Science Center, Institute of Integrated Research, Institute of Science Tokyo, Tokyo 101-0062, Japan
*
Author to whom correspondence should be addressed.
Photonics 2025, 12(6), 588; https://doi.org/10.3390/photonics12060588
Submission received: 7 April 2025 / Revised: 2 June 2025 / Accepted: 6 June 2025 / Published: 9 June 2025
(This article belongs to the Section Biophotonics and Biomedical Optics)

Abstract

Quantification of optic disc microvasculature is crucial for diagnosing various ocular diseases. However, accurate quantification of the microvasculature requires the exclusion of large vessels, such as the central artery and vein, when present. To address the challenge of ineffective learning of edge information, which arises from the adhesion and transposition of large vessels in the optic disc, we developed a segmentation model that generates high-quality edge information in optic disc slices. By integrating dual-stream learning with channel-spatial attention and multi-level attention mechanisms, our model effectively learns both the target’s primary structure and fine details. Compared to state-of-the-art methods, our proposed approach demonstrates superior performance in segmentation accuracy. Superior results were obtained when the model was tested on OCTA images of the optic disc from 10 clinical patients. This underscores the significant contribution of our method in achieving clearly defined multi-task learning while substantially enhancing inference speed.

1. Introduction

1.1. Background and Motivation

The optic disc is a unique region where rich vasculature can be non-invasively observed in a concentrated manner. Extensive studies have demonstrated the close relationship between various optic nerve diseases and the radial peripapillary capillaries [1,2,3], which radiate around the optic disc and are the shallowest microvasculatureof the optic disc [4,5,6]. This microvasculatureprovides nourishment and oxygen to the axons of retinal ganglion cells. Tight junctions between microvascular endothelial cells form the blood–retinal barrier (BRB), which regulates molecular exchange. Changes in vascular density, especially microvascular density, can serve as an important diagnostic basis for diseases. For example, decreased microvessel density can lead to ischemic damage to axons, which, in turn, can lead to glaucomatous optic neuropathy [7], and microvessel leakage or occlusion can lead to BRB destruction, which can lead to diabetic macular edema (DME) or retinal vein occlusion (RVO) [8,9]. Therefore, the quantitative assessment of vascular alterations at the microvascular level can lead to improved auxiliary diagnosis of ocular diseases and better disease severity stratification [7,10,11,12]. We address the effect of large vessels on microvasculature in the optic disc region by designing a dual-flow segmentation model. Shape flow (Gated-SCNN) is designed to capture microvascular morphological features associated with pathological states.

1.2. Literature Review

Optical coherence tomography angiography (OCTA) is a high-resolution, dye-free, and non-invasive imaging technique for observing the retinal vascular system and detecting subtle changes under pathological conditions [13,14]. OCTA has shown significant advantages and is widely used in clinical examinations of eye diseases [15,16]. An OCTA en face image relies on a multilayer B scan to obtain the maximum projection, and the optic disc region contains a rich network of vessels, resulting in overlapping multilayer vessels and leading to irregular and blurred edges. Additionally, in diseases such as vein occlusion and macular edema, blood vessels may adhere to each other. These factors considerably interfere with blood vessel segmentation and quantitative microvasculature analysis of the optic disc, potentially leading to misdiagnosis and missed optimal treatment periods.
Quantifying microvasculaturedirectly in the optic disc is challenging due to the overlapping of larger vessels and microvasculature. Large vessels in the optic disc significantly interfere with microvasculature quantification. Reliable pixel-level segmentation of the optic disc’s vasculature and the removal of larger vessels from the OCTA image are required to accurately quantify optic disc microvasculature. In this study, vessels with a diameter exceeding 50 μ m are defined as large vessels [17]. Accurate segmentation of large vessels in optic disc images is essential for precisely assessing microvascular characteristics.
Traditional methods for vessel segmentation, including thresholding, edge detection, region growing, and active contour models, are efficient and easy to implement but struggle with complex vessel structures [18,19]. Thresholding segments vessels by setting intensity thresholds, performing well in high-contrast images but poorly in noisy or low-contrast ones [20]. Edge detection techniques like the Canny and Sobel methods identify vessel boundaries via intensity gradients but often fail with small or intricate vessels and are sensitive to noise [21]. Region growing expands from a seed point based on intensity similarity but is highly dependent on seed selection and vulnerable to noise [22]. Active contour models capture complex vessel shapes but struggle with blurry boundaries and noise [23]. While traditional methods are useful when resources are limited, their limitations in handling complex vessel structures and noise have prompted the rise of more robust machine learning and deep learning-based techniques.
Recent advances in deep learning (DL) have led to significant improvements in medical image segmentation. Convolutional neural networks (CNNs) and other DL models have demonstrated superior performance in medical image segmentation tasks, surpassing traditional methods in segmentation accuracy [24]. Among these models, U-Net has proven to be an efficient backbone network with remarkable accuracy. Several studies have enhanced U-Net as a backbone [25]. Sharath et al. combined a residual module with U-Net to improve feature fusion and segmentation performance for optic disc and cup segmentation [26]. Guo et al. designed a lightweight network incorporating spatial attention and dropblock mechanisms to enhance small blood vessel segmentation [27]. Foivos et al. proposed the integration of residual methods into the U-Net network for retinal vessel segmentation [28]. However, the vascular morphology of the optic disc is quite complex, with numerous densely packed blood vessels and a high degree of curvature. This complexity makes the standard U-Net model’s approach of multiple down-samplings during the encoding stage ineffective at capturing the features of vessel edges in low-contrast OCTA images. As the number of down-samplings increases, the features of edges and fine vessels may progressively become invisible, significantly affecting quantitative microvasculature analysis.
In this study, we employ a deep learning method to segment large blood vessels, allowing us to separate microvessels by using large vessels as a mask. To improve the recognition of fine details in optic disc vessels, we trained a pixel-level semantic segmentation model. Trunk and edge information were integrated using a dual-stream training approach with adjustable weights for feature learning. The shape stream, utilizing a Gated Convolutional Layer (GCL), filters out noise and extracts high-quality edge information by leveraging contextual data from the regular stream. During the fusion of the target object and edge information, we use the Atrous Spatial Pyramid Pooling (ASPP) module for enhanced feature fusion. Additionally, our model employs residual-like modules, a redesigned Convolutional Block Attention Module (CBAM), and dropout operations to speed up convergence and prevent overfitting. Structural reparameterization allows for multi-branch training while simplifying to a single branch during inference, thereby boosting inference speed.
Finally, we evaluated our model on OCT images of clinical optic discs and conducted ablation experiments to assess each module’s contributions. Our method was compared with other methods for vessel segmentation of the optic disc, demonstrating that our model is highly competitive.

2. Related Works

2.1. U-Net-Based Segmentation Model

With the development of networks based on convolutional neural networks (CNNs), U-Net was proposed for medical image segmentation and has excelled in tackling the challenge of pixel-level classification. Due to the simplicity and outstanding performance of the U-shaped architecture, numerous U-Net-like methods have been continuously developed. Notable examples include UNet++ [29], U2net [30], H-Dense-UNet [31], Res-UNet [28], SA-UNet [27], and SGUNet [32]. To date, great success in medical segmentation has been achieved by U-Net models, owing to their powerful representations.
However, the U-Net framework demonstrates suboptimal performance in preserving critical boundary details during medical image segmentation. A review of previous works shows that various advancements have been made in terms of architectural innovations (including network depth and skip connections) and contextual feature integration. Meanwhile, relatively few studies have specifically targeted high-quality edge information.

2.2. Receptive Fields in Segmentation Models

The receptive field refers to the region of the input data that influences the computation of a particular characteristic. In most current research, there are five options to expand the receptive field of CNN-based models:
Larger convolutional filters: Larger convolutional filters are employed to ensure a wider receptive field compared to smaller convolutions. However, larger kernels are accompanied by more parameters, resulting in slower inference speed.
Atrous convolutions: Atrous convolutions are designed by introducing gaps between filter elements, enabling a larger receptive field to be obtained while maintaining fewer parameters than non-dilated filters. This technique has been successfully applied in architectures like the DeepLab series, achieving strong performance in semantic segmentation tasks [33,34].
Down-sampling: Down-sampling can reduce the spatial dimensions of the features while increasing the receptive field of the inputs.
Skip connections: Skip connections were popularized by ResNet and have been proven effective in mitigating gradient vanishing and enlarging the receptive field [35]. Inspired by the residual structure’s success, further applications have been explored in other baselines [28,31,36].
Multi-scale fusion: Multi-scale fusion is proposed to address similar issues as skip connections and has attracted significant research attention. Notable advancements based on this idea have achieved state-of-the-art (SOTA) performance, particularly in modeling long-range dependencies [33,37].

2.3. Attention Mechanism in CNNs

In human perception, attention plays a pivotal role in the human visual system. One of its important characteristics is its focus on a specific region rather than on the entire image. Drawing inspiration from this idea, attention mechanisms in artificial intelligence for visual applications are broadly categorized into two types: channel attention and spatial attention. These two methods enable networks to learn how to attend to specific features and have shown significant efficacy in various domains, including image segmentation, object detection, and image classification. Hu et al. utilized a residual network as a backbone and employed two fully connected layers to enable channel attention in a network [38]. Woo et al. were the first to combine spatial attention and channel attention [39]. Wang et al. revisited the traditional squeeze-and-excitation (SE) attention mechanism and demonstrated the importance of avoiding dimension reduction and appropriately learning cross-channel dependencies for efficient channel attention. To address the dimension reduction issue in the SE structure, they replaced the two fully connected layers in SENet with a one-dimensional convolution, successfully improving performance [40].

2.4. Dual-Stream Learning

The fundamental assumption of dual-stream learning is that shared information exists between the two tasks. In this way, dual-stream learning is widely employed to extract complementary information about positively related tasks. In the field of deep learning, Li et al. jointly detected salient objects and camouflaged objects to learn the inherent similarities and differences from the tasks’ opposing attributes [41]. Takikawa et al. designed a two-stream structure comprising a regular stream and a shape stream [42]. A gated convolution layer is used by the shape stream to obtain features from the regular stream and fuse them with the regular stream’s outputs to improve segmentation results. Zhen et al. designed a joint semantic segmentation and boundary detection framework and applied a pyramid context module to fuse the tasks [43]. Luo et al. presented a dual-stream framework for referring to segmentation and expression comprehension [44].

3. Methods

Aiming at the complex properties of optic disc vessels, such as their high density, high degree of curvature, and vascular adhesion, we propose a novel semantic segmentation architecture designed to accurately separate large vessels from optic disc images. The perfusion density of the retinal disc microvasculature is quantified using the segmentation result as a mask.

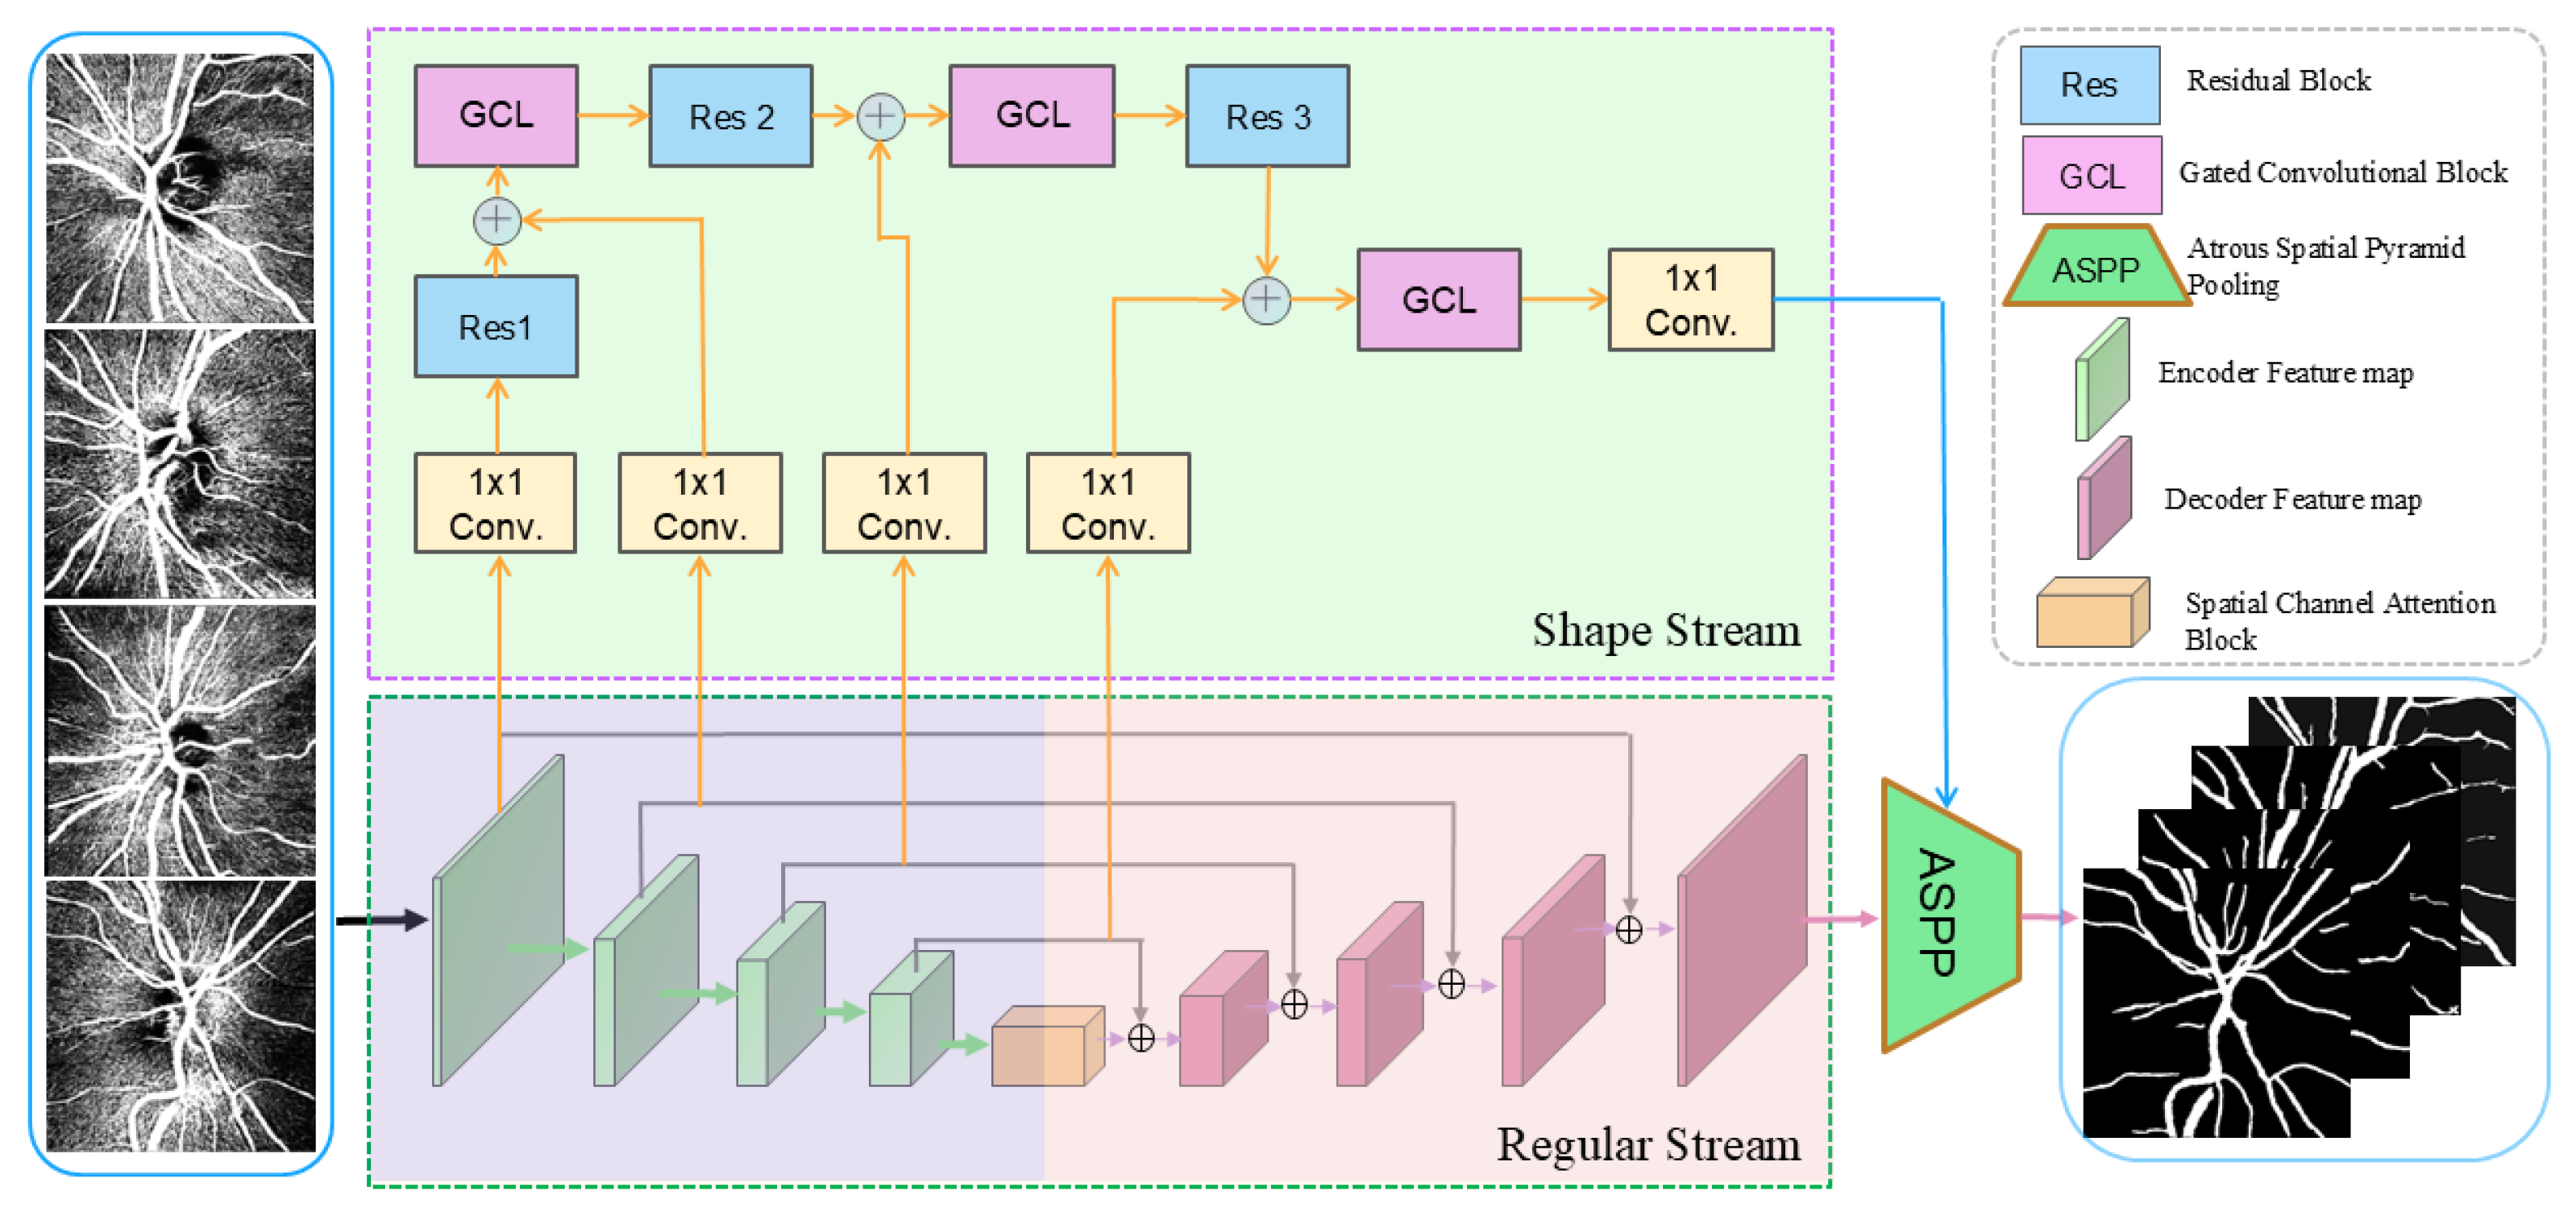
3.1. Network Architecture

The proposed network model is composed of two streams: the regular stream and the shape stream. In the regular stream, a convolutional module integrating residual-like connections and channel-spatial attention is introduced to enhance the model’s expressive ability. A residual-like structure is employed to increase the number of learning branches, while a redesigned channel-spatial attention mechanism ensures that the model’s weights are focused on meaningful feature maps and pixels during inference.
Additionally, we applied dropout to each convolution block during training to increase the number of learning and inference branches while avoiding overfitting. Takikawa et al. proposed G-SCNN, in which the authors pioneered the idea of GCL to help remove noise and produce superior edge information, contributing to the final segmentation [42]. In the shape stream, we apply this idea to the basic U-shaped network to generate the shape stream for our network, allowing the model to learn the targets’ shape information. For the vessels’ main information and edge information, we apply ASPP to the fusion of the regular stream’s texture information and the shape stream’s edge information. Detailed information on the network is shown in Figure 1.

3.2. Channel-Spatial Attention Mechanism

Squeeze-and-Excitation (SE) attention improves the representation power of CNN-based networks by learning the coherence in a channel-wise manner and explicitly encoding the dependency information of features between different channels. However, Efficient Channel Attention (ECA) replaces the fully connected layer in the SE mechanism with a one-dimensional convolution, which improves the network’s interpretability and reduces its parameter computation. As shown in Figure 2, we apply a module that combines channel attention and spatial attention, incorporating the channel attention mechanism proposed by Wang et al. [40] and the spatial attention mechanism proposed by Woo et al. [39].
To calculate channel-wise and spatial attention, the module applies global average pooling (GAP) and max pooling (MP) to the input features ( U [ u 1 , u 2 , u 3 , . . . u C ] ) in a channel-wise manner to encode feature descriptions ( z g R 1 × 1 × C and z m R 1 × 1 × C ). Then, z g and z m pass through an adaptively sized one-dimensional convolution to encode the correlations between different channels, simulating a self-attention mechanism among the channels. This process generates un-normalized attention weights ( W g R 1 × 1 × C and W m R 1 × 1 × C ). Finally, we simply add up W g and W m , then apply sigmoid activation to the sum to obtain the channel attention map ( W R 1 × 1 × C ). In short, the process of the channel attention module in our modified ECA can be summarized using Equations (1)–(3).
z g = F g ( u c ) = 1 H × W i = 1 H i = 1 W u c ( i , j )
z m = F m ( u c ) = m a x i = 1 H i = 1 W u c ( i , j )
W = σ ( C o n v ( z g ) + C o n v ( z m ) )
where F g and F m represent the global average pooling and max pooling operations, σ is the sigmoid activation, and C o n v is the adaptively sized one-dimensional convolution. The size of the kernel can be calculated using Equation (4).
k = l o g 2 C + b γ
After multiplying the channel attention map by the inputs, we start to calculate spatial attention. The inputs ( U R C , H , W ) first pass through a channel-wise GAP and a channel-wise MP, which are spliced to obtain a weight vector ( W s ^ R 2 , H , W ). Then, we use a convolution layer with sigmoid activation to obtain the final weight vector ( W s R 1 , H , W ). In short, the attention can be computed using Equation (5).
W s = σ C o n v ( M a x P o o l ( x ) , A v g P o o l ( x ) )

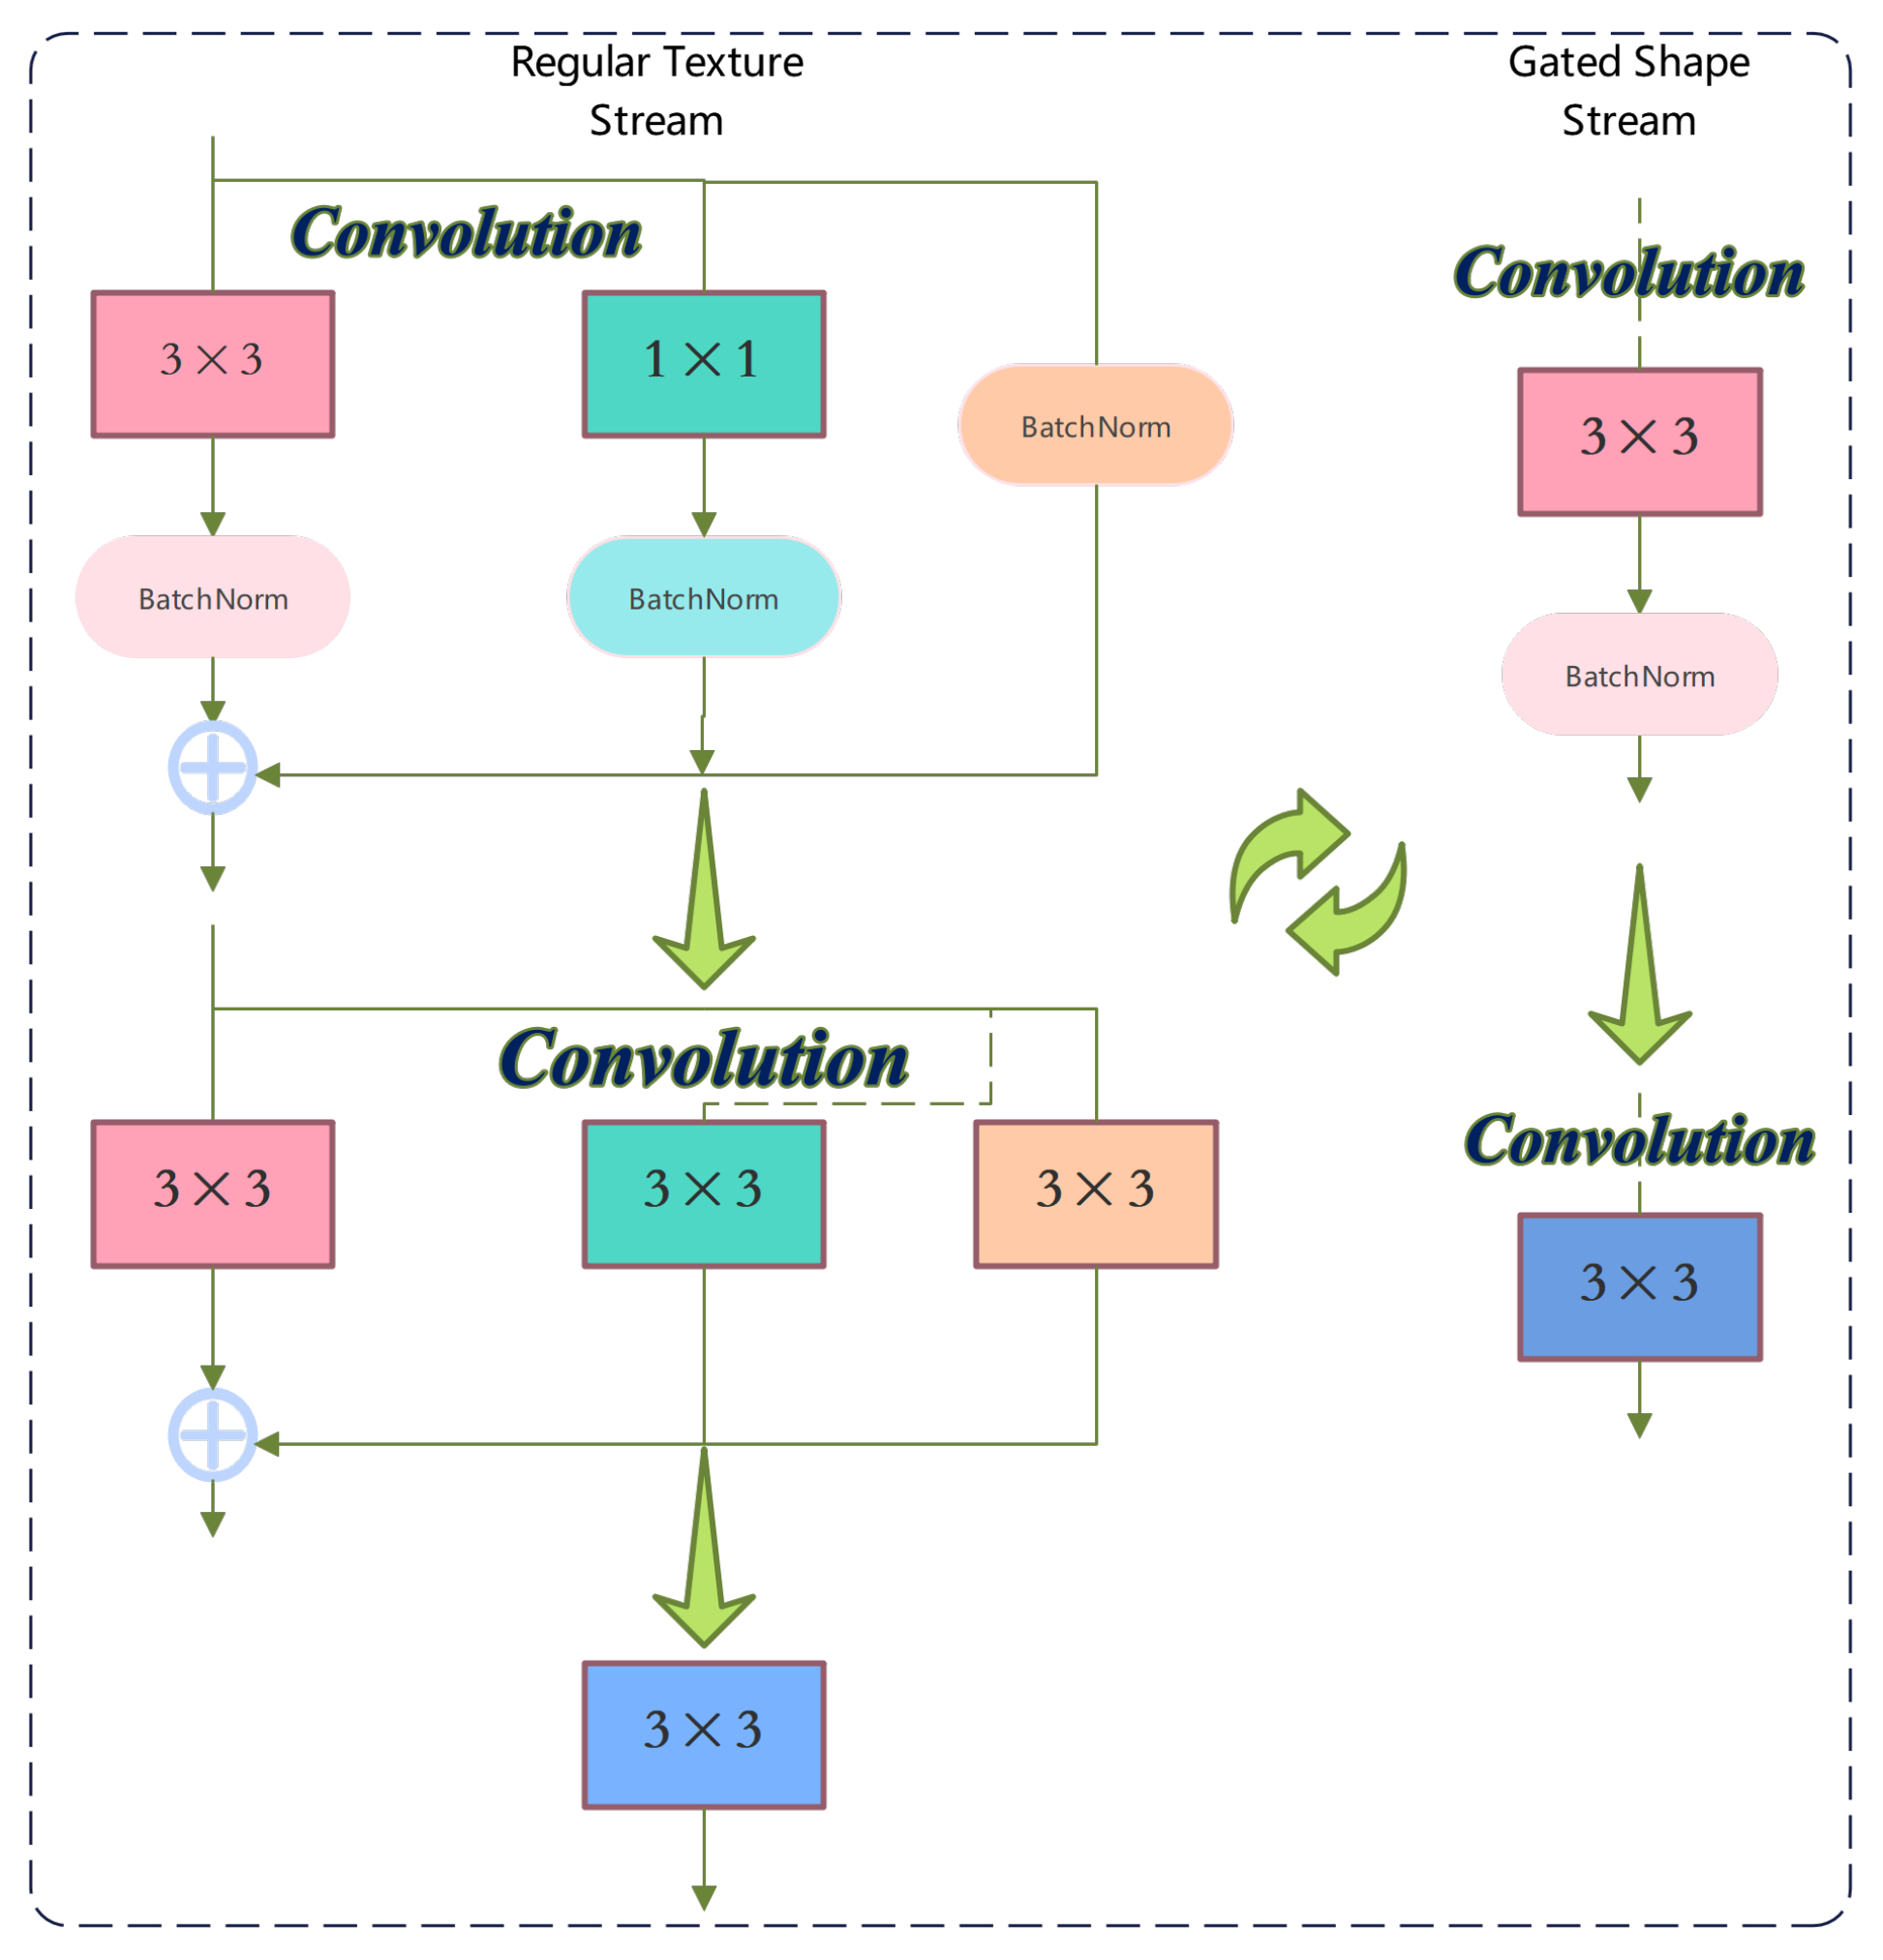
3.3. Structural Re-Parameterization

ResNet [35] has been proven to be effective in improving network training depth and representation. A previous study [45] explained that the multi-branch structure in ResNet acts as an implicit ensemble of various shallow models, enhancing the model’s representation. However, having more branches also means consuming more computational resources. Although parallel convolutions in the branches can be partly performed in parallel, the communication process still slows down the overall inference. Therefore, we introduced a structural re-parameterization mechanism [36,46]. This architecture enables parameter optimization through a multi-branch structure during training while seamlessly consolidating into a single-branch configuration during inference without compromising performance. It reduces models’ parameter size and speeds up inference to some extent. As shown in Figure 3, we use two different re-parameterization schemes during the inference stage: one on the continuous residual convolution blocks in the regular stream and the other on the residual blocks in the shape stream.
In the regular stream, we equivalently convert the multi-branch structure, which consists of a 3 × 3 convolution with its batch normalization (BN) layer, a 1 × 1 convolution, with its BN layer and a standalone BN layer into a single 3 × 3 convolution with a branched structure. Let W ( 3 ) R C 1 × C 2 × 3 × 3 denote the 3 × 3 convolution with C 1 input channels and C 2 output channels and W ( 1 ) R C 1 × C 2 represent the 1 × 1 convolution branch. We use μ ( 3 ) , σ ( 3 ) , γ ( 3 ) , β ( 3 ) to denote the accumulated mean, standard deviation, scaling factor, and bias of the BN layer following the 3 × 3 convolution. Similarly, μ ( 1 ) , σ ( 1 ) , γ ( 1 ) , β ( 1 ) represent the BN layer following the 1 × 1 convolution, and μ ( 0 ) , σ ( 0 ) , γ ( 0 ) , β ( 0 ) are the parameters for the standalone BN layer. Let U R N × C 1 × H 1 × W 1 and U R N × C 2 × H 2 × W 2 represent the input and output of the entire operation block, respectively. Formally, the process of structural reparameterization can be represented as Equation (6).
U = B N ( U W ( 3 ) , μ ( 3 ) , σ ( 3 ) , γ ( 3 ) , β ( 3 ) ) + B N ( U W ( 1 ) , μ ( 1 ) , σ ( 1 ) , γ ( 1 ) , β ( 1 ) ) + B N ( U , μ ( 0 ) , σ ( 0 ) , γ ( 0 ) , β ( 0 ) )

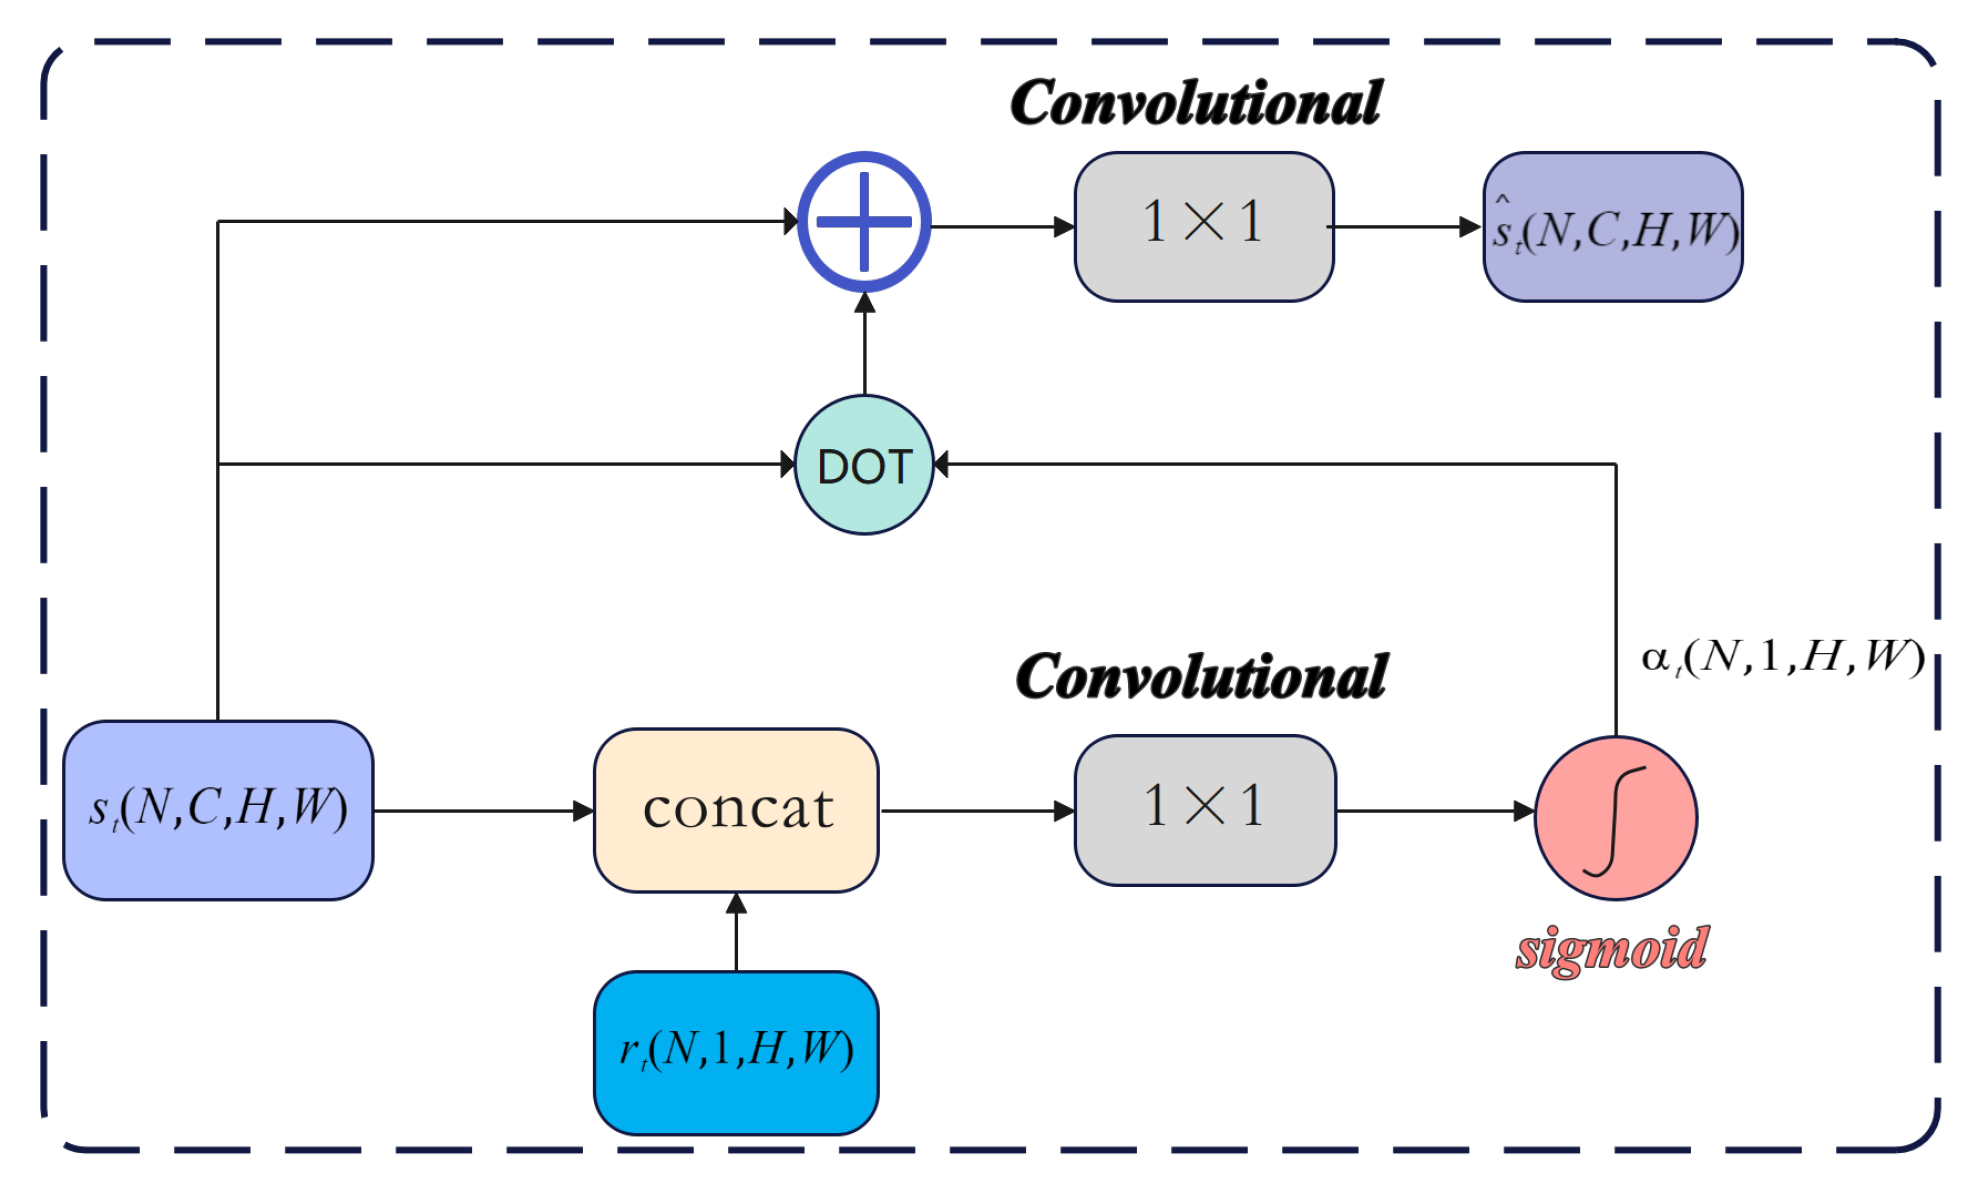
3.4. Gated Convolutional Layer

The gated shape stream operates by processing features extracted from the regular stream’s encoder while simultaneously refining boundary information. In our proposed model, we take the output of the first layer of the regular stream encoder as the initial input for the entire gated shapestream. Then, we use the feature maps after the skip connections of each decoder layer as one of the inputs for each gated convolution. This allows us to better integrate contextual information during the process. However, it should be noted that the main purpose is to minimize the inclusion of regular-stream characteristics in the shape stream, suppressing certain features activated in the regular stream. This allows the shape stream to better focus on learning the shape information of the objects. Hence, we apply the GCL to construct our shape stream.
In Figure 4, the gate convolution has two inputs: the feature maps ( s t ( N , C , H , W ) ) obtained from the residual block in the gated shape stream and the feature maps ( r t ( N , 1 , H , W ) ) extracted from the texture stream after passing through a 1 × 1 convolution layer. To make the gated shape stream focus on learning edge information in the image, we need to selectively suppress the main features from the regular stream and enhance the weight of edge information in the shape stream. Therefore, the main purpose is to obtain an attention map for the shape stream’s feature maps. Formally, we concatenate s t and r t along the channel dimension, then pass them through a 1 × 1 convolution layer to squeeze the number of channels to 1. Finally, we use sigmoid activation to obtain the learned attention map ( α t ( N , 1 , H , W ) ). In short, α t can be computed using Equation (7):
α t = σ ( C 1 × 1 ( s t | | r t ) ) .
where ‖ denotes the concatenation of feature maps from the shape stream and regular stream and σ denotes the sigmoid activation. Then, residual connection is applied to the GCL to prevent gradient vanishing. In short, the GCL is applied to input feature s t as an element-wise product (⊙) with attention map α t . Then, the module performs a residual connection with s t and channel-wise weighting with a 1 × 1 kernel ( w t ) at each pixel (i, j). The GCL is computed using Equation (8):
s t ^ ( i , j ) = ( s t ( i , j ) α t ( i , j ) ) + s t ( i , j ) T w t .

3.5. Quantification of Microvasculature

Accurately quantifying parameters such as the vascular perfusion density (VPD) in the optic disc area is crucial for the diagnosis of retinal diseases. VPD, defined as the ratio of “blood vessel pixels with flow” to “total pixels of the vessel image”, serves as a key indicator for evaluating the perfusion status of the optic disc. In this study, VPD was computed using the “locally adaptive region growing” algorithm, as in our previous work [47]. The algorithm consists of four main steps: (a) selecting initial seed pixels, (b) defining the local region, (c) updating the threshold, and (d) evaluating similarity. Initially, the image histogram is used to automatically select seed pixels with specific gray-level values. A local region surrounding each seed pixel is then selected based on the vessel size, followed by the generation of a threshold derived from the seed pixel values. Pixels with similar characteristics are subsequently incorporated into the object region, which represents a blood vessel. The similarity criterion is determined by the condition requiringthat the difference between two pixels be smaller than the dynamically updated threshold. This process iterates until no further pixels meet the inclusion criteria for the object region.

4. Experiments

For this study, we present the details of the OCT-1 dataset and conduct our experiments on different models. The superiority and robustness of our model are demonstrated in the results. Furthermore, to evaluate the contribution of each component of our model, we conducted ablation experiments that are reported at the end this section to validate the impact of different components on the results.

4.1. Datasets

The research data was collected from October 2022 to January 2023 at the Department of Ophthalmology, the First Hospital of Qinhuangdao City, Hebei Province, China. The OCTA device used was a Spectralis OCTA instrument manufactured by Heidelberg Engineering, Heidelberg, Germany. The OCTA images were collected from the optic disc area of patients with diseases such as Branch Retinal Vein Occlusion (BRVO), Diabetic Retinopathy (DR), and Diabetic Macular Edema (DME). The wavelength of measurement was 870 nm, the A-scan scanning speed was 85,000 Hz, and the scanning range was 4.5 mm × 4.5 mm, centered on the optic disc. During the process of creating the ground truth for the dataset, we collaborated with three experienced ophthalmologists from the Ophthalmology Department of Qinhuangdao First Hospital. Each expert independently annotated the major blood vessels in the OCT optic disc images using Labelme. To ensure the quality and reliability of the annotations, we conducted an intergrader agreement evaluation based on these independent masks.
Detailed information on the dataset and specific transformation is presented in Table 1. Note that the original size of the dataset is too small to apply to our proposed network. To prevent overfitting, we used several augmentation methods on the original images to expand the dataset’s quantity. During the image augmentation process, we avoided using methods that have a significant impact on image pixel values, such as Gaussian blur and gamma transformation, as these methods can blur the boundaries of blood vessels, making them unrecognizable, and potentially damaging the dataset. We also refer to the dataset used in OCT-1 for convenience.

4.2. Data Augmentation and Cross-Validation

To mitigate overfitting and improve model robustness, extensive data augmentation techniques were applied to the original 48 OCT images. These included random rotation, horizontal and vertical flipping, elastic deformation, and random cropping. After augmentation, the dataset size was increased to 576 images with corresponding ground-truth segmentation masks.
To comprehensively evaluate the generalization ability of our model, we employed a five-fold cross-validation strategy. The entire dataset, consisting of 576 augmented OCT retinal images derived from 48 original scans, was randomly partitioned into five equal subsets. In each iteration, four subsets (80%) were used for training, and the remaining one (20%) was used for validation. This process was repeated five times, ensuring that each image appeared exactly once in the validation set. The average performance across the five folds is reported in Table 2.
Model performance was evaluated using several metrics commonly adopted in medical image segmentation tasks, including the Dice coefficient, Intersection over Union (IoU), accuracy, and recall. All metrics were computed for each fold independently, and the mean and standard deviation were calculated to assess the model’s stability. Table 2 shows the results obtained from five-fold cross-validation. The proposed method demonstrated consistent and robust performance across all folds. Specifically, the average Dice coefficient was 86.88 ± 3.44%, and the average IoU was 84.28 ± 1.47%.

4.3. Evaluation Metrics

To evaluate our proposed model, we compared the results with the corresponding ground truth across different metrics. Intersection over union (IoU), accuracy (ACC), the recall rate (Recall), Mean Squared Error (MSE), and Structural Similarity (SSIM) are applied in a pixel-wise comparison to evaluate whether our model accurately predicts the main regions. Additionally, the area under the ROC curve (AUC) can be used to measure the overall performance of the segmentation. The better our model performs, the closer the AUC is to 1.0 .
Furthermore, one of the main objectives of our model is to predict probability maps with high-quality edge information, so we introduce the boundary evaluation metric proposed by Federico et al. [48] to assess our semantic boundaries. The metric computes the F score along the boundaries of the predicted mask, given a small slack in distance. In the following experiments, we set a threshold of three pixels to generate binary maps while computing the F score.

4.4. Implementation Details
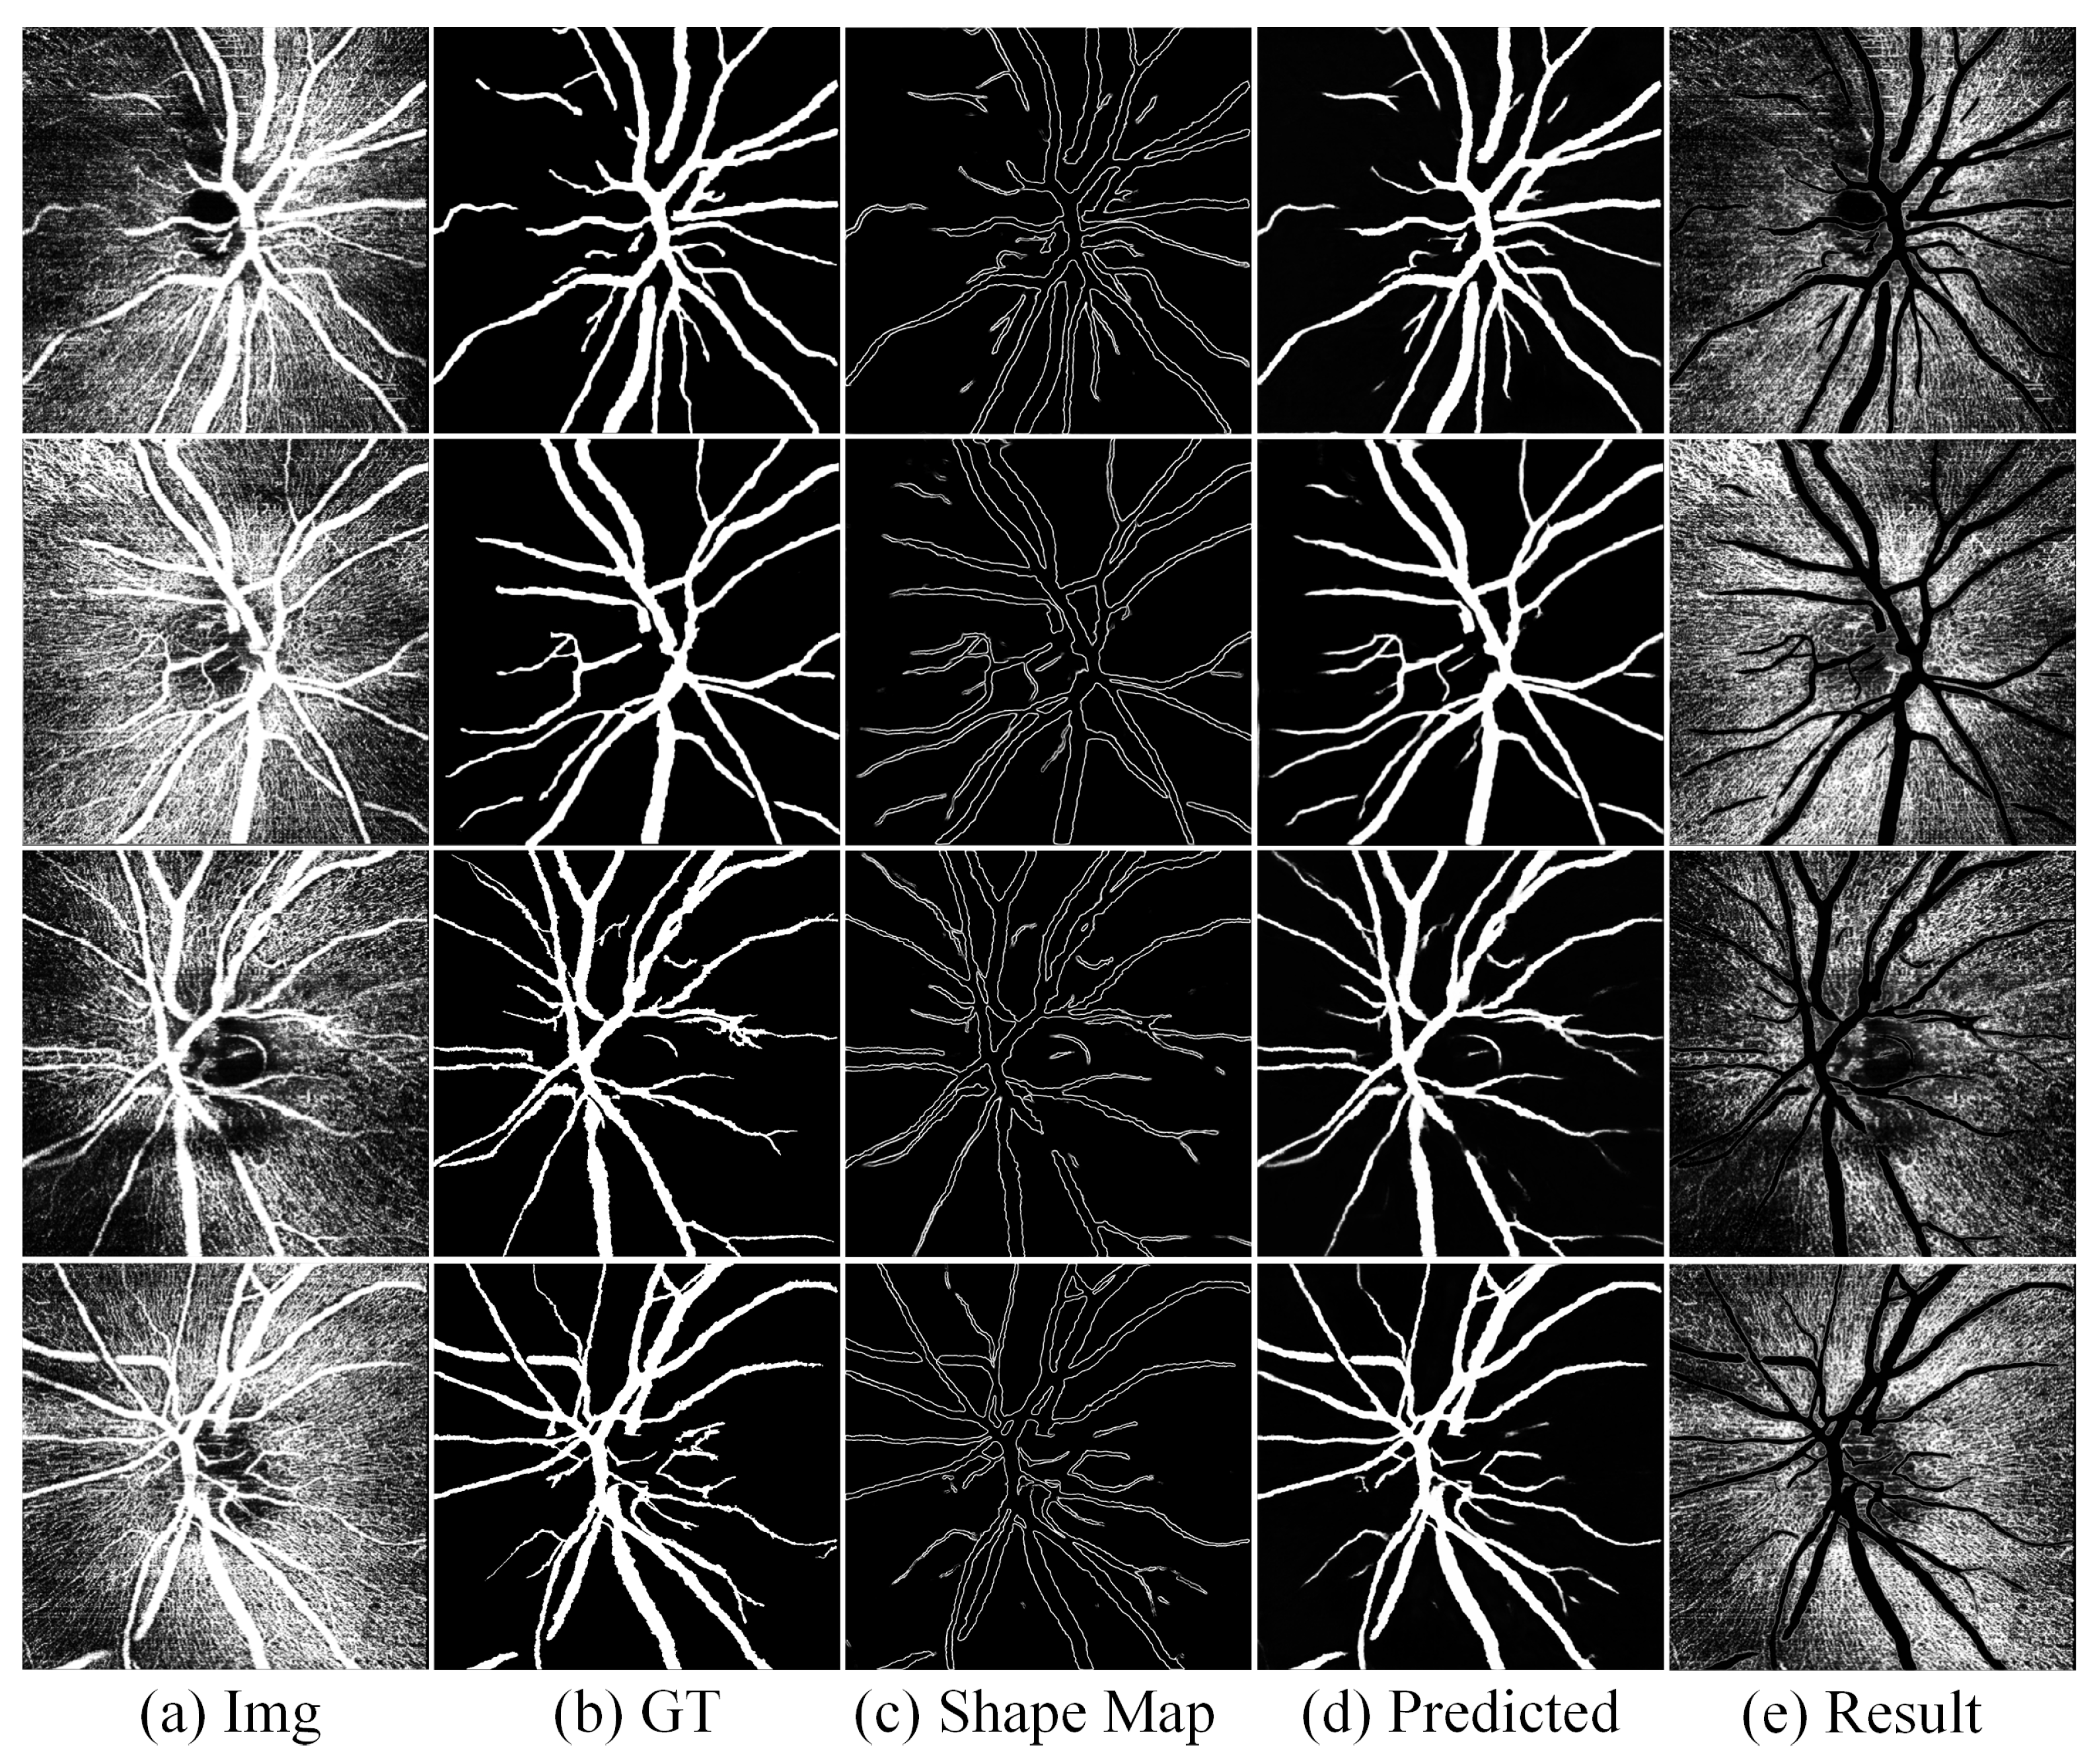
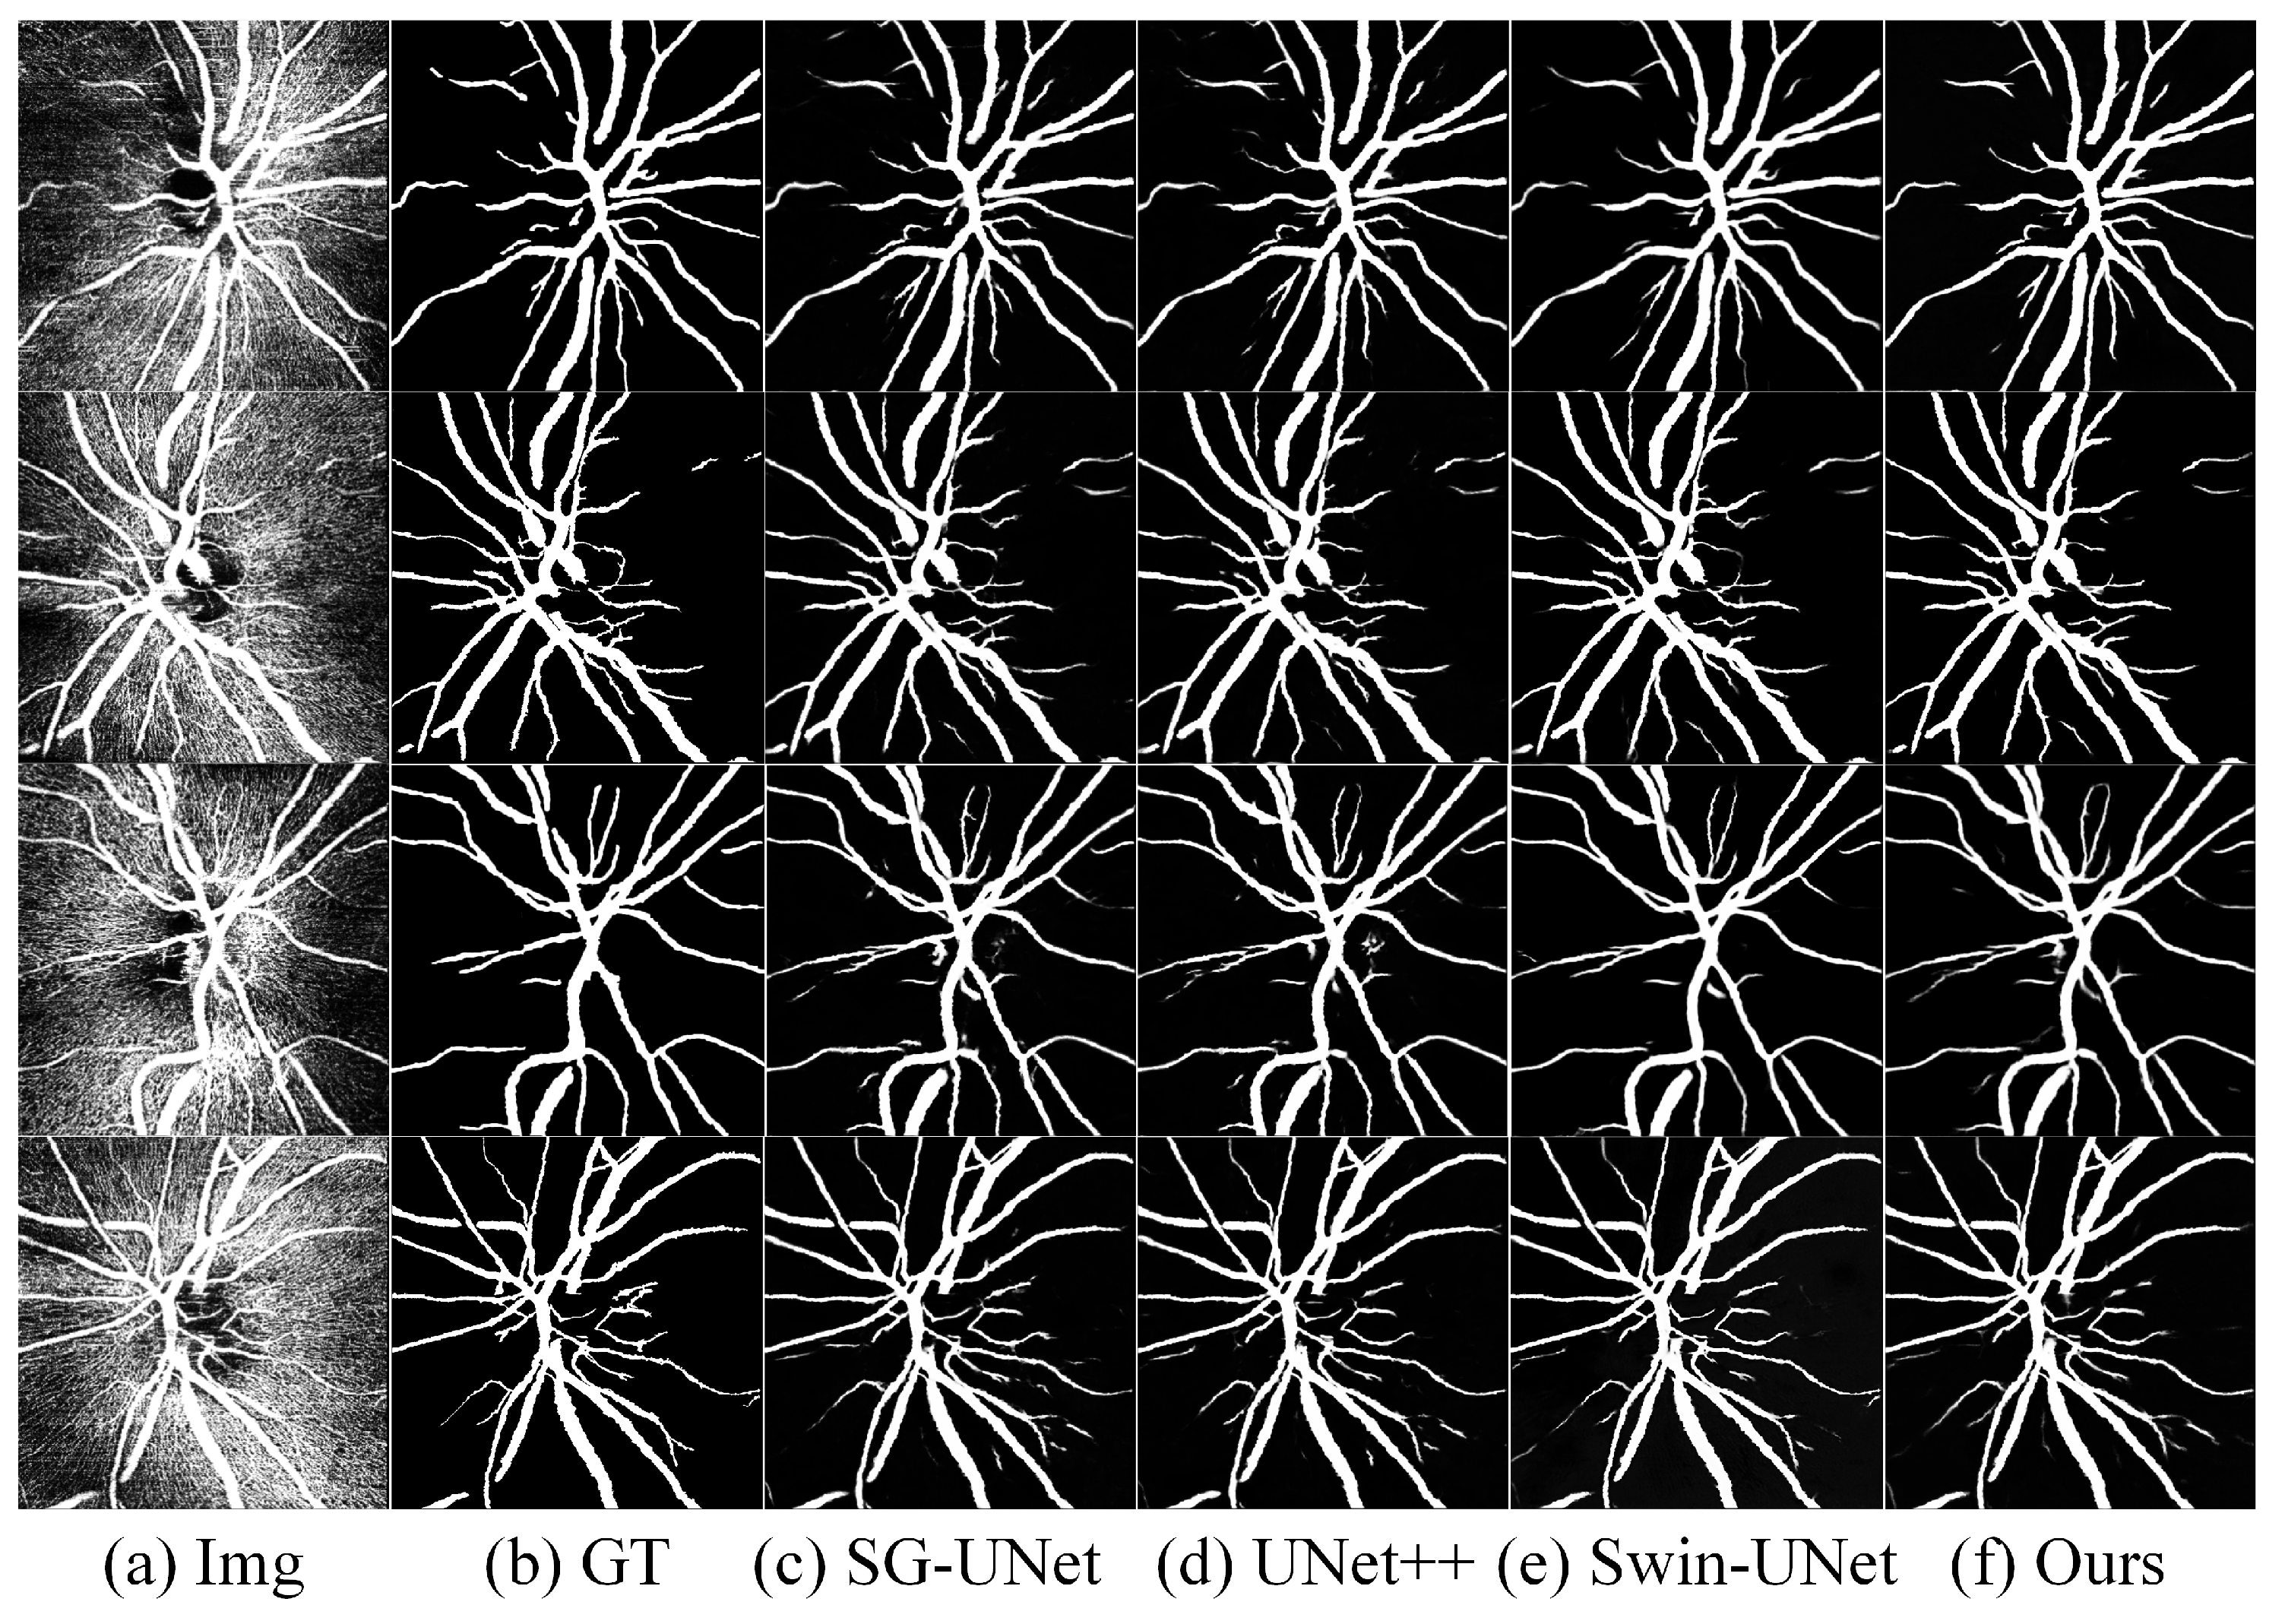
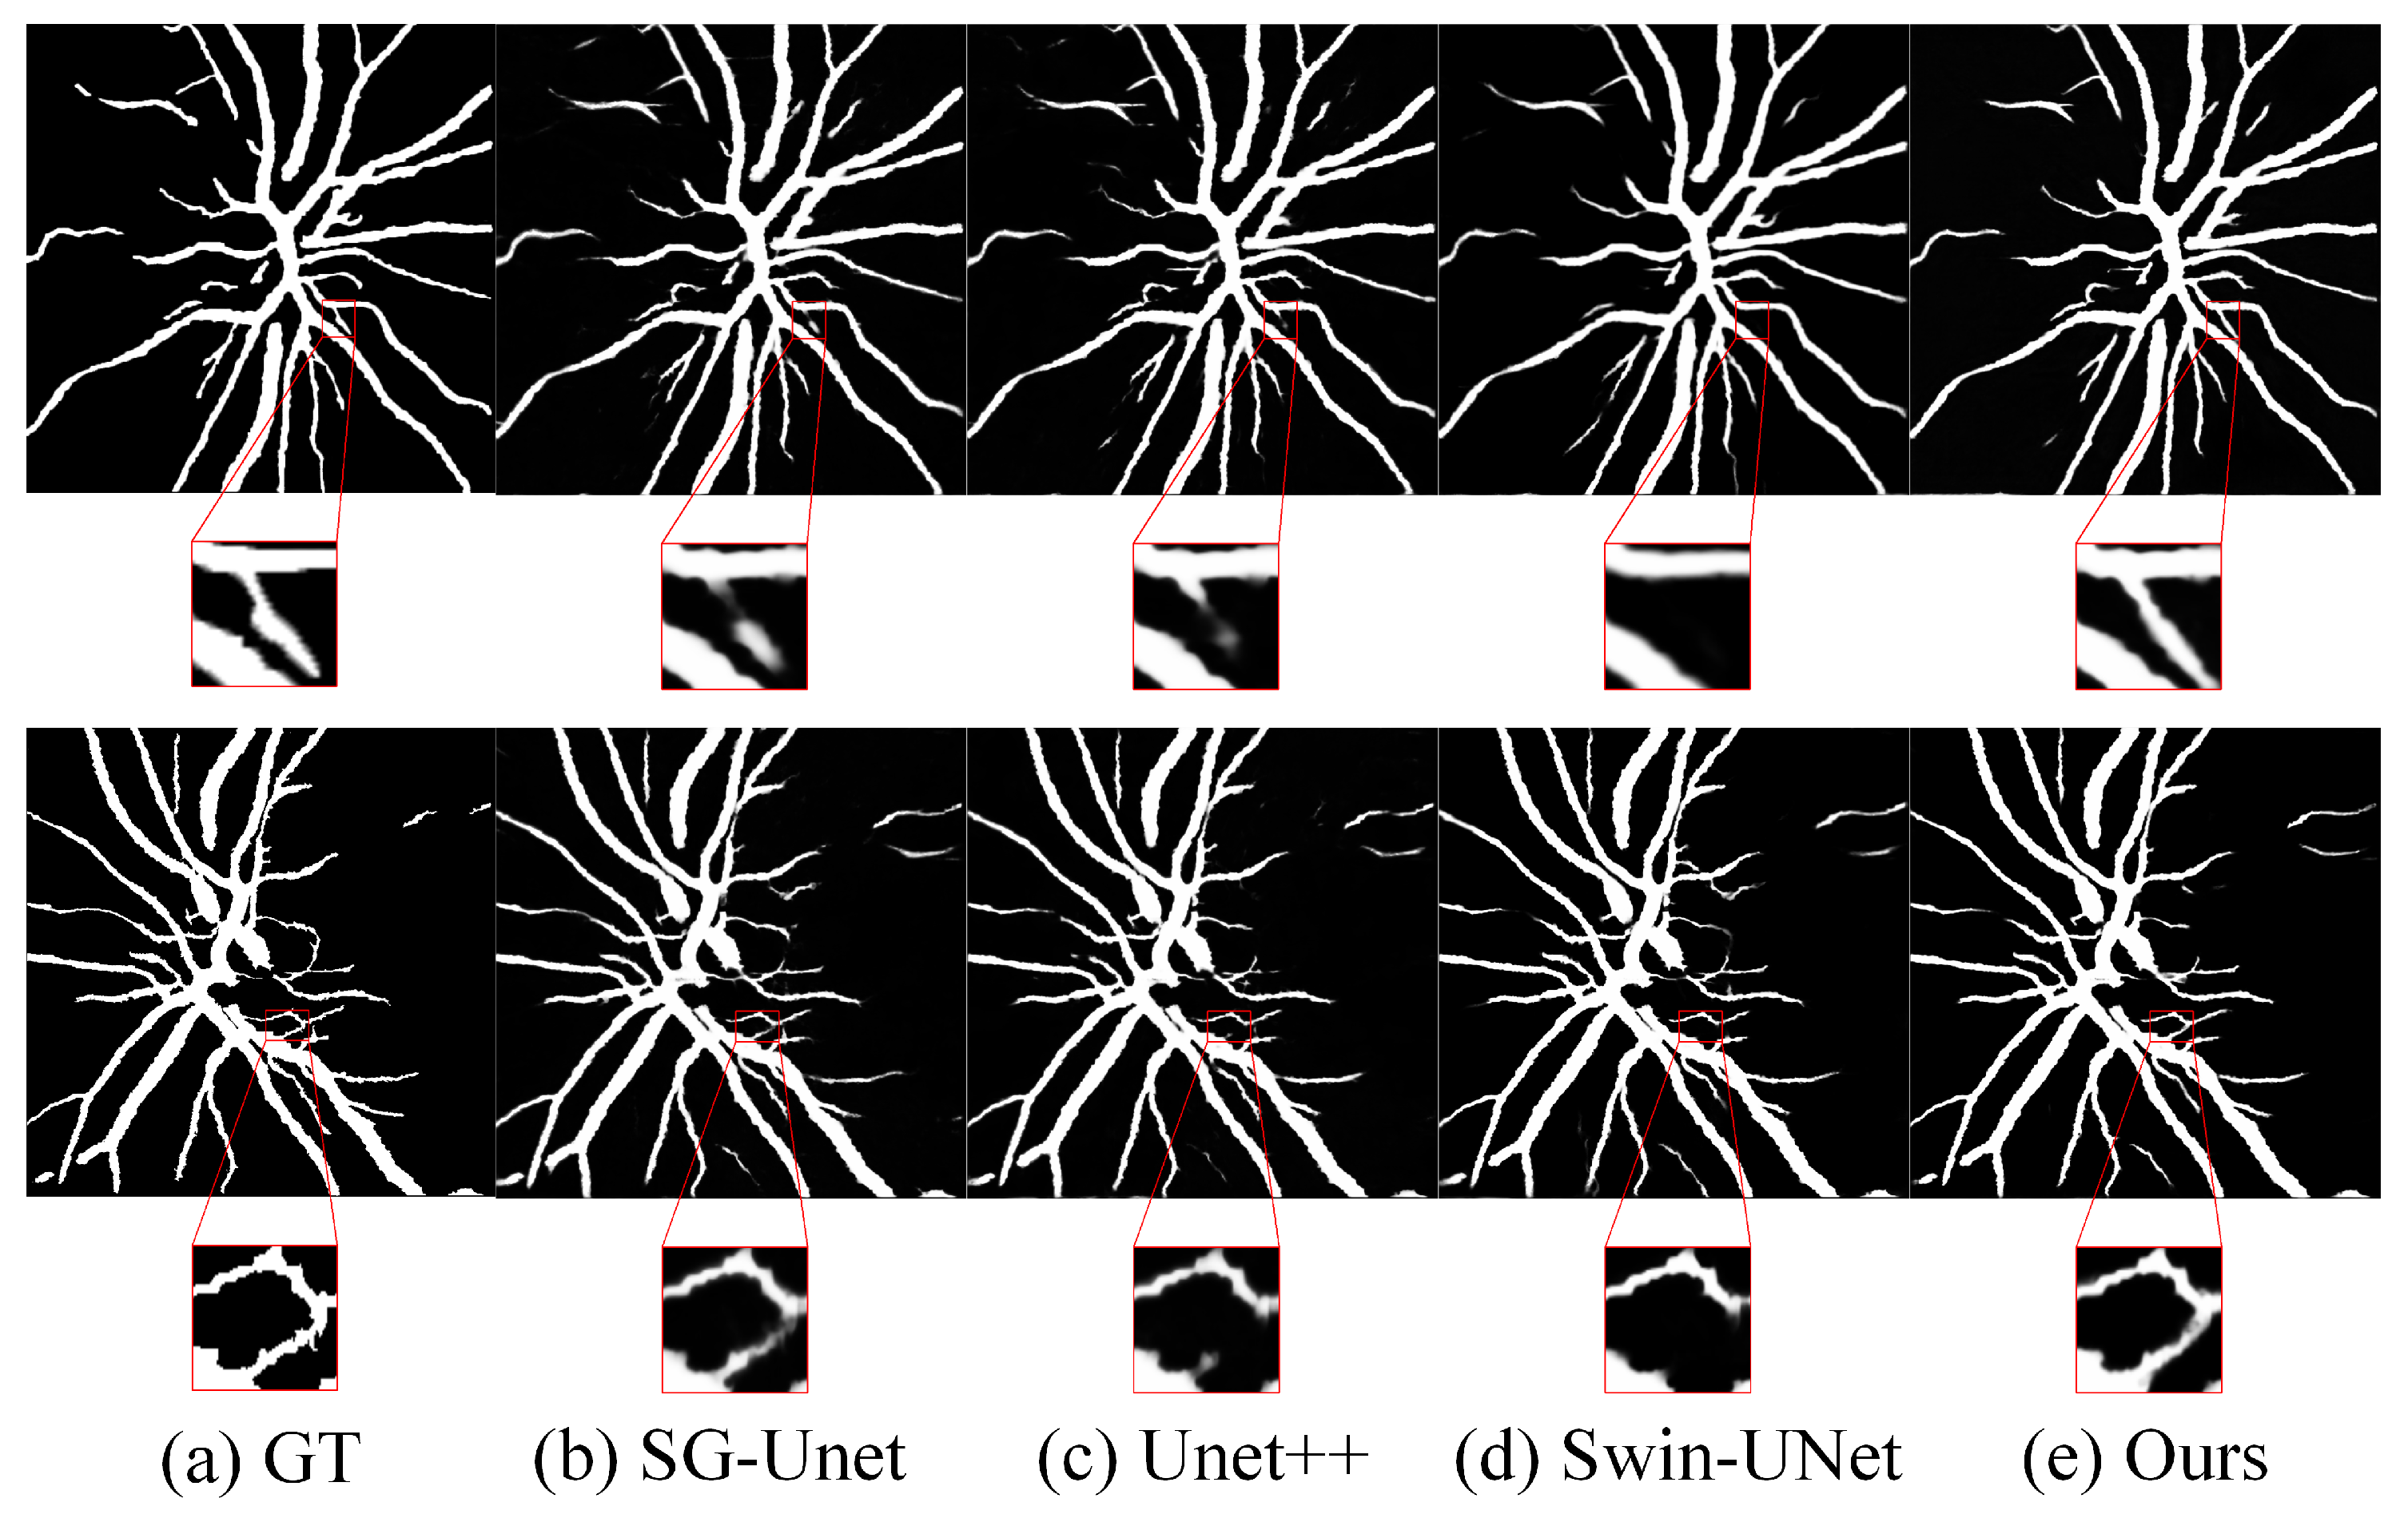
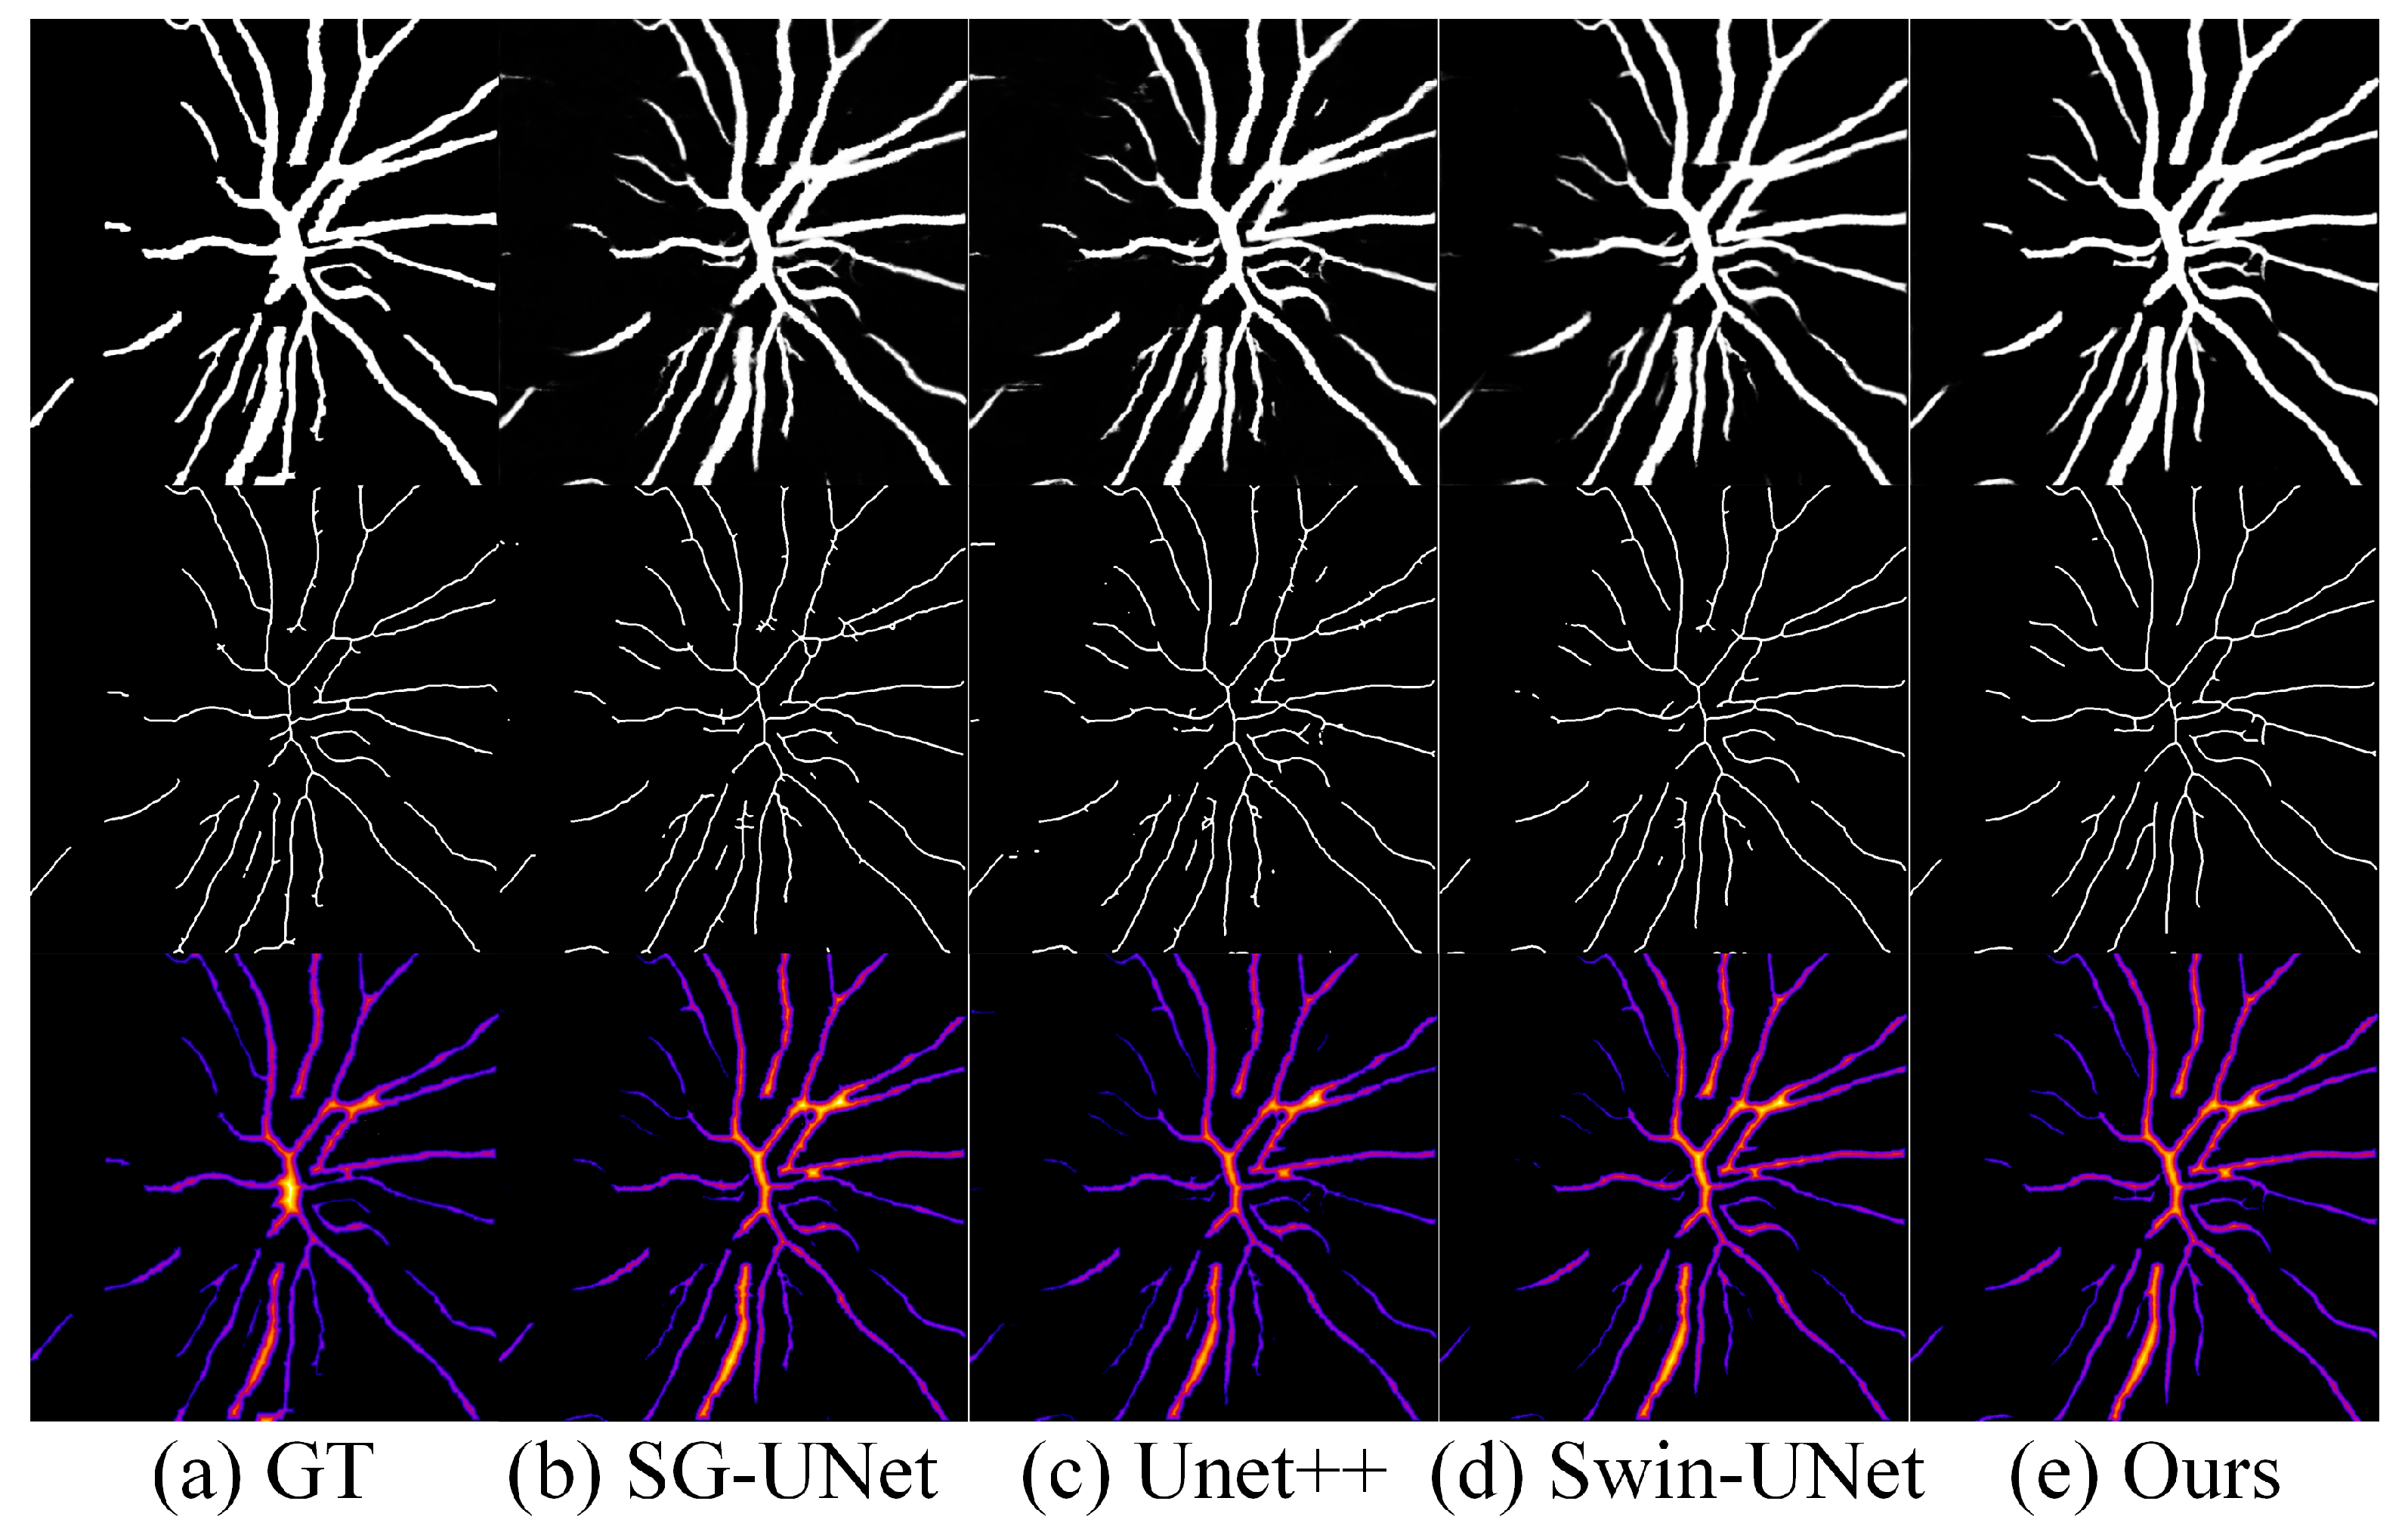
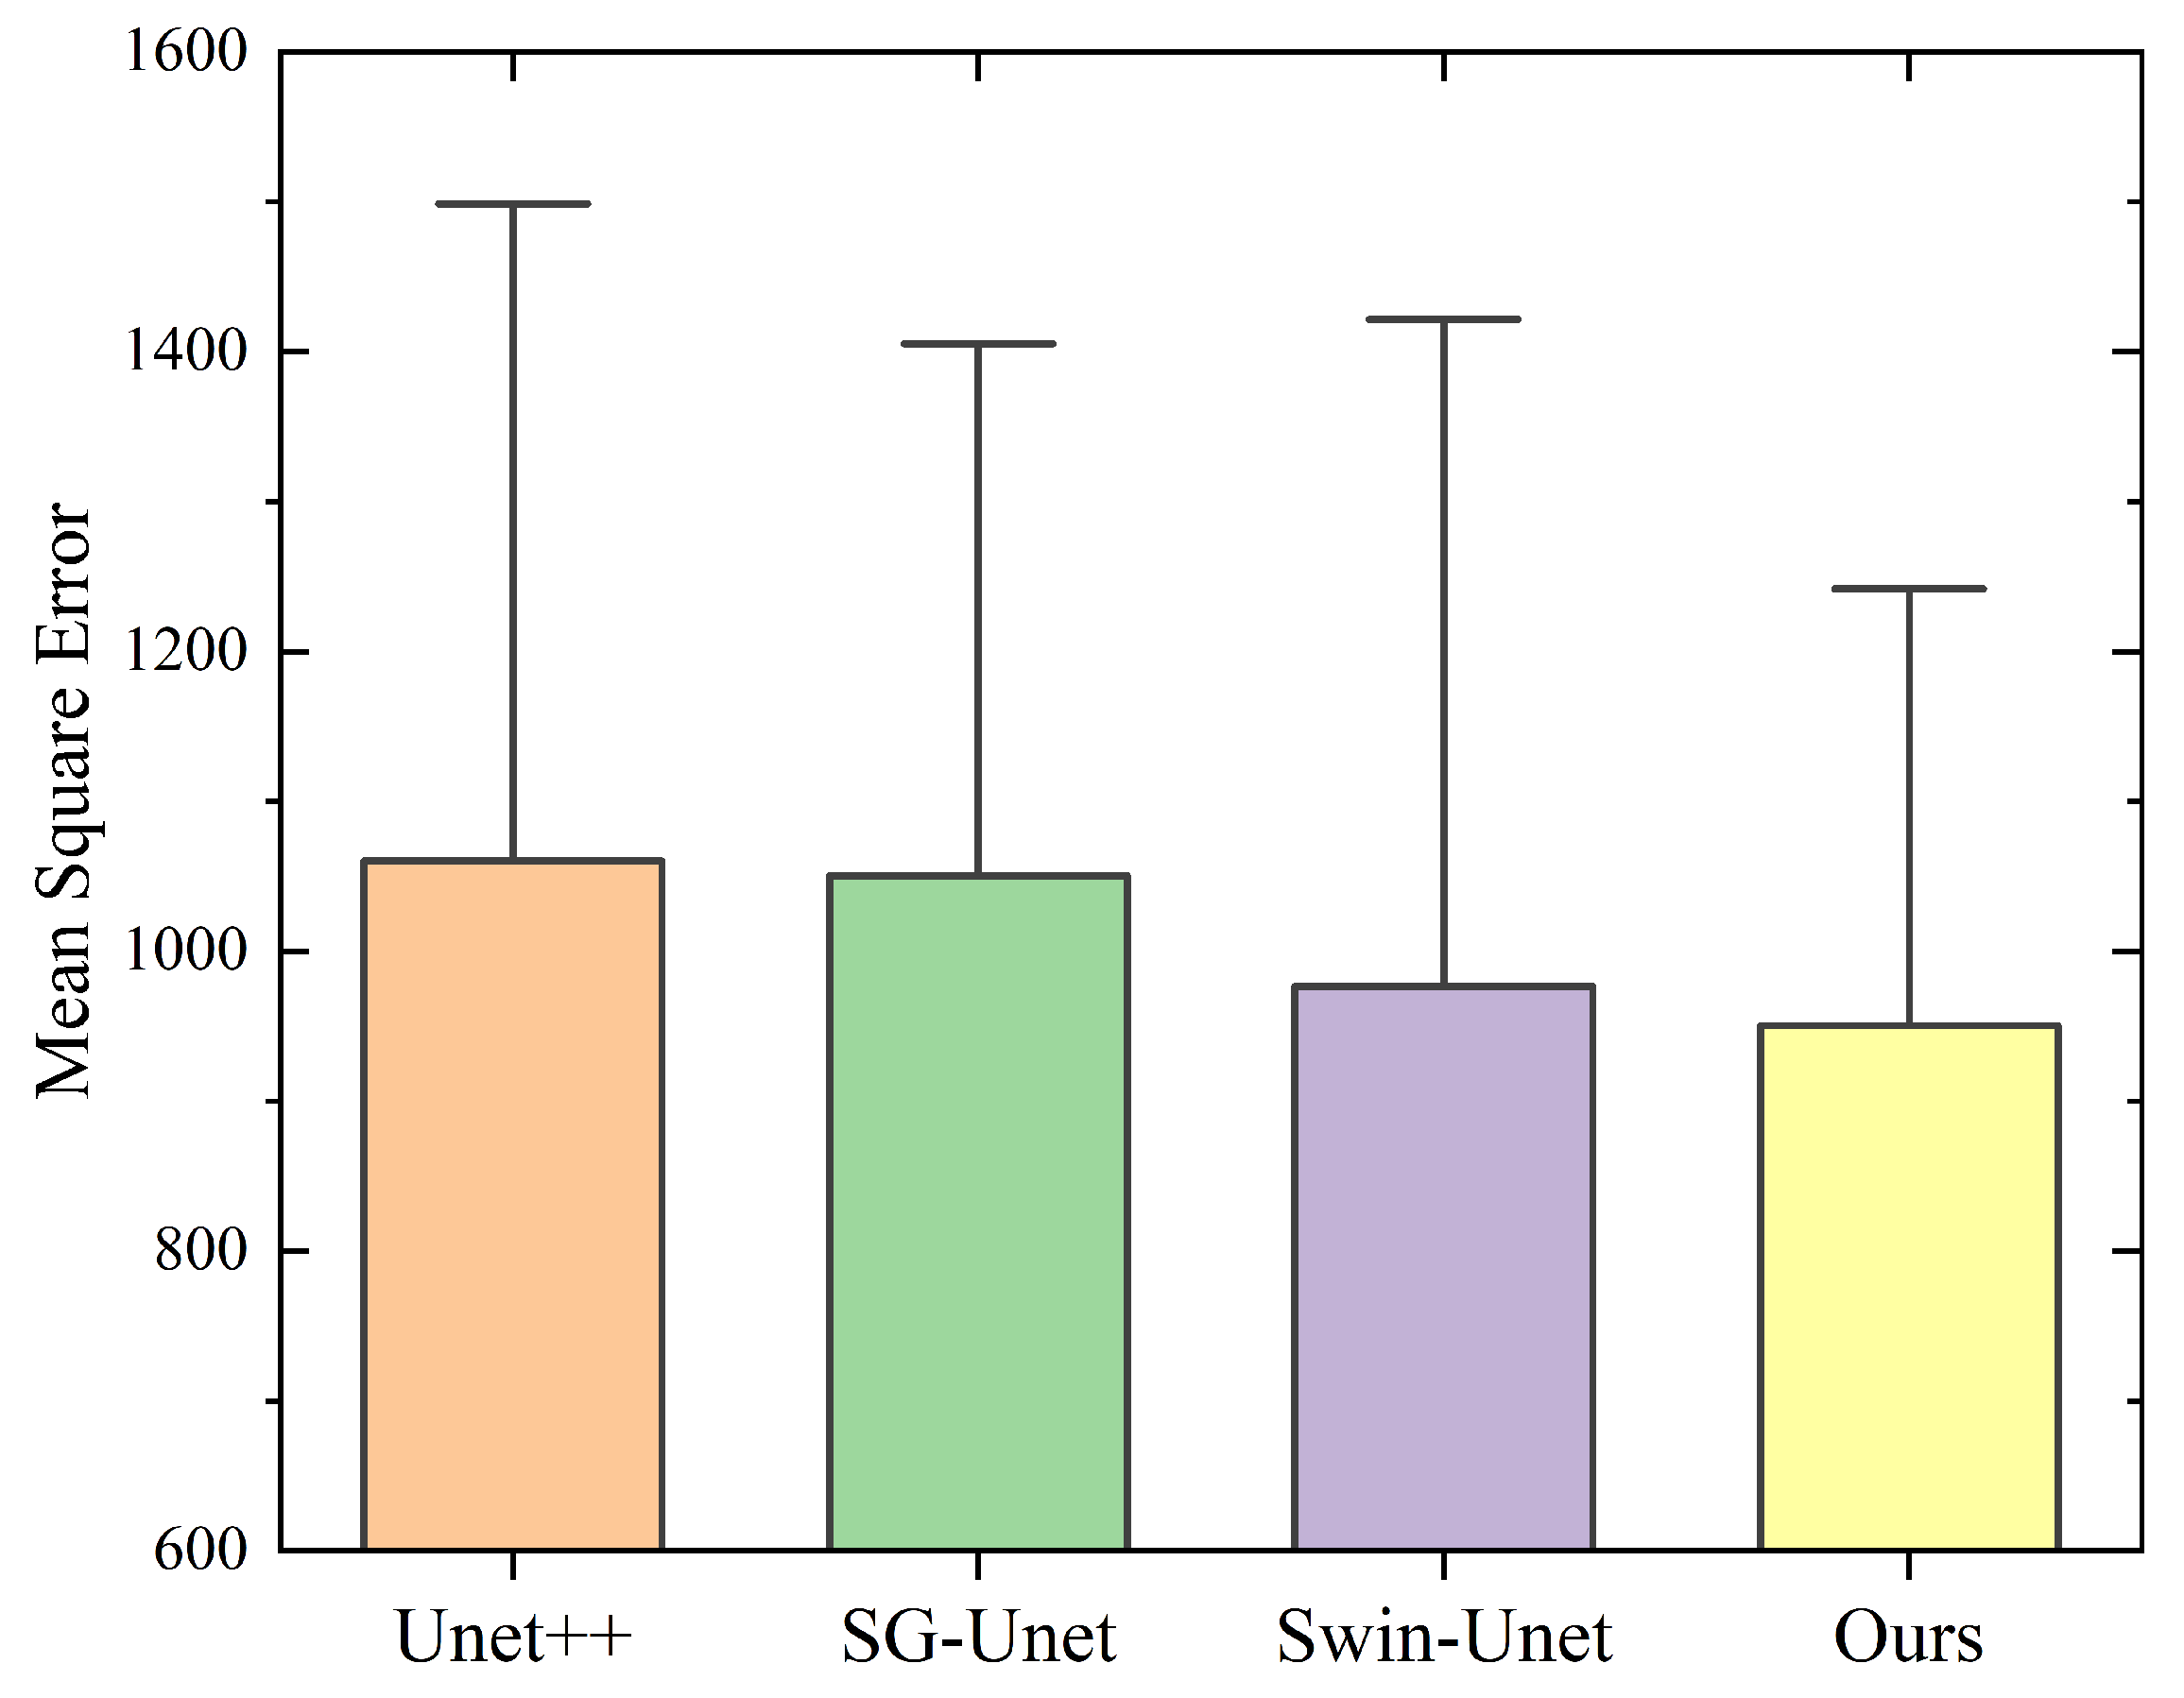
For the OCT-1 dataset, the batch number is set to 8, and the dropout rate is 0.3. The training set and validation set use the same image enhancement methods. As mentioned in Table 1, we apply horizontal flip, vertical flip, and symmetric flip to our dataset. Furthermore, to run the model with limited memory, we apply random cropping on images throughout the entire training.
The Adam optimizer is employed. Specifically, the Dice loss function is applied to the shape stream branch to enhance edge information learning, while the binary cross entropy (BCE) loss is used for the regular stream branch. The number of epochs is 150, and the learning rate is 0.001 for the first 60 epochs, 0.0001 for epochs 61 to 120, and 0.00001 for the last 30 epochs. In the U-shaped regular stream, the number of channels after the first convolution layer is set to 32. During the model initialization stage, we do not use pre-trained weights and, instead, perform Kaiming initialization on the network parameters.
The whole implementation is based on the open-source Pytorch 2.1, and all experiments are run on a NVIDIA A40 GPU (NVIDIA Corporation, Santa Clara, CA, USA) with 48 gigabytes of memory.

4.5. Results

The network was trained on the OCT-1 dataset using a more balanced 8:1:1 split to ensure adequate validation representation and a more consistent class distribution. Additionally, five-fold cross-validation was performed with stratified and shuffled sampling to maintain consistent target-to-background ratios across all folds. These methodologies led to a marked improvement in training stability. Figure 5 presents the performance curves of the Dice coefficient, IoU, and Recall on the validation set. The results demonstrate that our model exhibits strong training stability throughout the learning process. Moreover, the model converges rapidly on both the training and validation sets, achieving competitive performance from the early stages of training.
Figure 6 illustrates the segmentation results on the test set, obtained using models trained through five-fold cross-validation. Subfigure (a) shows the original images from the OCT-1 test set, (b) presents the ground truth refined through consistency evaluation, (c) shows the output of the shape stream, (d) shows the final segmentation results after fusing the conventional and shape streams, and (e) highlights the microvasculature by removing large vessels from the original images. These results facilitate more accurate measurement of microvascular perfusion density, which can further support ophthalmologists in diagnosing retinal diseases.
To demonstrate the competitiveness of our proposed method, we compared it against several state-of-the-art models for retinal vessel segmentation. As shown in Figure 7, all models were trained and evaluated under identical conditions. The quantitative results of this comparison on the OCT-1 test set are summarized in Table 3, highlighting the superior performance of our method.
Compared with strong baselines, our method achieved an average gain of 1.6 percentage points in IoU and 2.5 percentage points in the Dice coefficient. To validate the statistical and practical significance of these improvements, we conducted five independent training runs with different random seeds and performed paired t-tests on the results. The improvements were found to be statistically significant (p < 0.05), and effect size analysis (Cohen’s d > 1.05) further confirmed their practical relevance. In addition, five-fold cross-validation demonstrated the method’s robustness and generalization capability, yielding lower standard deviations in the Dice score (e.g., SD = 0.003 vs. 0.004–0.005 for baselines), which reflects improved training stability. While the numerical improvements may appear modest, its translates to enhanced edge continuity and integrity of the vascular structure—both of which are critical for clinical applications where fine-grained vessel segmentation can directly impact diagnostic accuracy.
Additionally, in order to provide a clearer observation of the difference between the models, we present magnified local views of selectively distinct regions in Figure 8. Our model is capable of generating clearer and well-defined segmentation results for major blood vessels.
To further demonstrate the accuracy and validity of the model’s prediction results, we conducted comparisons using several important medical diagnostic data.
First, we collected diameter information on various branches of the major blood vessels under different models. We classified branches as qualified if their diameters exceeded the threshold (50 μ m) and unqualified otherwise. This allowed us to calculate the Diameter Compliance Rate (DCR) for the different model predictions.
Secondly, we performed statistical analysis on the predicted lengths of the main vascular skeletons and calculated their Main Skeleton Regression Rate (MSRR) using Equation (9).
Lastly, we estimated the perfusion density of microvasculatureunder different models and compared it with the group where microvasculature was extracted using labels. Figure 9 illustrates the skeletonization and distance transformation results of a dataset, while Table 4 records the DCR and MSRR for different models. Figure 10 depicts the distribution of microvascular perfusion density in the test group using different models.
R e g r e s s i o n   R a t e = 1 a b s ( X G X P ) X G
X G represents the ground-truth value obtained by applying the same calculation methods to the corresponding ground truth for each test image. X P represents the predicted value of different models.
In Table 4, it can be observed that our model achieves the highest scores in both the DCR and MSRR metrics, indicating that our model exhibits a high degree of similarity to the ground truth in terms of morphological information, such as diameter and maximum main branch length when separating large blood vessels.
Figure 10 and Figure 11 present the similarity analysis between the segmentation results of different methods and the GT for large vessels. The figure utilizes MSE and SSIM to evaluate the morphological similarity between the segmentation results and GT for large vessels. The indicators can be calculated separately using Equations (10) and (11)–(13).
M S E = 1 H · W i = 0 H 1 j = 0 W 1 x ( i , j ) y ( i , j ) 2
S S I M = ( 2 μ x μ y + C 1 ) ( 2 σ x y + C 2 ) ( μ x 2 + μ y 2 + C 1 ) ( σ x 2 + σ y 2 + C 2 )
μ = 1 H · W i = 0 H 1 j = 0 W 1 I ( i , j )
σ = 1 H + W 1 i = 0 H 1 j = 0 W 1 ( I ( i , j ) μ ) 2
During the computation, we set the size of the sliding window to 11. In Equation (10), H and W represent the height and width of the sliding window, respectively, while x and y denote the pixel values of the two images. In Equation (11), we define C 1 and C 2 as 1 × 10 5 . Equation (12) and Equation (13) represent the calculations for the mean and variance in Equation (11), respectively.
It is evident that our proposed method outperforms other methods, such as SG-UNet, UNet++, and Swin-UNet, in pixel-level segmentation of large vessels. Compared to the segmentation results of SG-UNet, UNet++, and Swin-UNet, our method demonstrates better segmentation performance, particularly in the segmentation of large vessels’ edges and in cases involving vessel adhesion.
The perfusion density of microvasculaturein the retinal vascular network holds significant diagnostic value for conditions like venous occlusion. The ultimate goal of this study is to enhance the accuracy in quantifying the perfusion density of microvasculature. Figure 12 presents the perfusion density statistics of the microvasculatureobtained by different methods. The ground truth’s perfusion density is derived from manual removal of large vessels by three expert ophthalmologists. In Figure 12, the third quartile (Q3) and first quartile (Q1) of GT are 0.715 and 0.405, respectively. Our method calculates Q3 as 0.713 and Q1 as 0.374. It is evident that among the mentioned methods, our approach yields the perfusion density of microvascular that is closest to the GT.

4.6. Ablation Experiment

To test the effectiveness of the modules, we conducted five ablation experiments on the OCT-1 dataset, using (1) our proposed model with or without a gated shape stream, (2) a model with an ASPP fusion module or with a simple convolution fusion module, (3) a model with or without more CBAM attention mechanisms, (4) a model with a regular CBAM module or with a reversed CBAM module, and (5) a model with or without structural re-parameterization. All results are reported in Table 5 and Table 6. All the models were trained with a learning rate of 3 × 10 4 using the Adam optimizer. We applied the same optimizer, learning rate, and image augmentations on all the experimental groups to ensure consistency in the training environment. The performance results on the testing set are shown in the following tables following 100 iterations on the training set.
According to the results, our method achieved the highest score in multiple metrics in the ablation experiments compared to other experimental groups. (1) Removing the shape stream may lead to the loss of edge information. We analyzed the raw data and found that edge pixels accounts for approximately 12% to 16% of the total pixels. This operation results in a significant decrease in the Dice score, indicating that the shape stream can assist the model in understanding edge information. (2) Removing the ASPP fusion module and using a single convolution layer for fusion also decreases the model’s expressive ability, leading to poor performances across multiple metrics in that experimental group. (3) Finally, we explored the role of the attention mechanism in the experiments. When we removed the CBAM module, the scores decreased. However, when we inverted the CBAM module and used a spatial-channel attention module instead, the scores did not change significantly. In fact, some metrics, such as the recall rate, slightly outperformed the original model. Therefore, we can conclude that CBAM contributes to the improvement of the overall expressive ability of the model, with an order of channel-spatial attention that is slightly superior to that of spatial-channel attention. However, in light of the limited practical benefits, we chose to simplify the design to ensure an optimal balance between architectural complexity and overall effectiveness.
The effects of model re-parameterization on computational complexity, model size, and inference efficiency are summarized in Table 4. After re-parameterization, the total number of parameters was reduced from 8.88 million to 8.09 million, representing a reduction of approximately 0.79 million (8.89%). Similarly, the number of floating-point operations (FLOPs) decreased from 287.27 billion to 268.67 billion, a reduction of 18.6 billion FLOPs (6.47%). In terms of inference performance, the average inference time on the test set was reduced from 62.3 ms to 36.9 ms, resulting in a 40.77% decrease in latency. These results collectively demonstrate that re-parameterization effectively improves computational efficiency while reducing the model’s complexity and accelerating its inference performance.
The re-parameterization strategy adopted in our study significantly enhanced the model’s computational efficiency without compromising segmentation performance. By structurally reformulating the model architecture during the inference phase, we achieved a substantial reduction in the parameter count and the number of FLOPs. Notably, the reduction in FLOPs does not degrade model performance, as the training-phase multi-branch structure preserves rich gradient flows and representation power. This suggests that reparameterization successfully decouples training complexity from inference efficiency, a key advantage for real-world applications. However, the trade-off between accuracy and speed should be carefully evaluated—while some methods achieve near-lossless merging, aggressive compression may require fine-tuning to recover precision.

5. Discussion

Optical coherence tomography has become the clinical gold standard for measuring retinal perfusion density due to its non-invasive nature and high-resolution imaging capabilities, offering significant advantages over invasive techniques such as indocyanine green angiography. However, accurately distinguishing microvasculature from large vessels remains a significant technical challenge in the optic disc region, particularly in cases characterized by vessel adhesion, indistinct boundaries, or background noise. To address this problem, we propose a task-specific segmentation architecture that integrates a gated shape stream, attention mechanisms, atrous spatial pyramid pooling, and structural re-parameterization to enhance the model’s ability to capture fine vascular details. This enables more precise segmentation of large vessels and, consequently, improves the accuracy of microvascular density quantification. Our method is uniquely tailored to the optic disc region and explicitly separates large vessels form microvasculature, offering greater clinical relevance for diseases such as glaucoma and diabetic retinopathy.
Building on the motivation for accurate segmentation, it is important to note that during the measurement of microvascular perfusion density—particularly in cases with vessel adhesion—there is a risk of misclassifying large vessels (those with relatively small diameters) as microvasculature or erroneously interpreting background noise as vascular signals. If such data are not appropriately excluded, the calculated microvascular perfusion density may be artificially inflated. Conversely, mistaking microvasculature for large vessels or background noise may lead to their exclusion, resulting in an underestimation of true microvascular density. A further complication arises when segmentation inconsistencies occur—such as when a single large vessel is partially identified as microvasculature and vice versa. While the overall perfusion density may remain unaffected in such cases, morphological discrepancies between the segmented result and the ground truth become apparent. Therefore, accurate morphological analysis of segmented large vessels is essential. As demonstrated in Figure 10, Figure 11 and Figure 12, our algorithm exhibits strong morphological consistency with manual annotations, enabling more precise measurement of microvascular perfusion density and offering a more reliable reference for the diagnosis of ocular diseases.
To ensure the reliability of manual annotations, we conducted an intergrader agreement analysis among three experienced ophthalmologists. Although our original protocol included independent labeling and anonymous scoring, we recognize that these steps alone do not provide a quantitative measure of consistency. Therefore, we performed additional assessments using the Dice coefficient, IoU, and Cohen’s kappa. The results showed high consistency across all metrics, indicating minimal variability between graders. This confirms the robustness of the annotations and supports the reliability of the training data, which is crucial, given the subjective nature of medical image interpretation. Incorporating this analysis enhances the methodological strength of our study and ensures a consistent clinical basis for model development. In addition, to evaluate the model’s generalization beyond the OCT-1 dataset, we tested it on the external DRIVE dataset, which differs substantially in both modality and anatomical focus. Specifically, the DRIVE dataset covers the entire fundus region, whereas the OCT-1 dataset focuses on the optic disc area. Due to these fundamental differences, we did not include the DRIVE results in the main text. Despite the domain shift, our model achieved competitive performance, demonstrating strong robustness and adaptability across diverse imaging scenarios.
The discrepancy between training with cropped images and inference on full-resolution inputs may potentially affect the model’s ability to preserve global vessel continuity and maintain edge integrity. To address this, we implemented a mixed-scale training strategy that probabilistically integrates full-resolution images during training. Experimental results demonstrate that this strategy introduces only minimal performance variations across different configurations, with a slight improvement in F1 score when a small proportion (p = 0.15) of full images is included. This suggests that limited global context during training can enhance the model’s ability to capture long-range vessel structures without incurring substantial computational overhead. Furthermore, the stable results across various probabilities indicate that the model generalizes well despite differences in spatial scale between training and inference. We attribute this robustness, in part, to the inclusion of the ASPP module in our architecture, which aggregates multi-scale features and effectively enlarges the receptive field. This design helps compensate for scale discrepancies, enabling the model to preserve vessel continuity, even when trained predominantly on local image patches. Taken together, these findings support the effectiveness of our training pipeline and suggest that crop-based training remains a viable and efficient approach for OCT vascular segmentation, particularly when computational resources are constrained.

6. Conclusions

To address the challenges of segmenting large vessels adhering to the optic disc region and accurately quantifying microvessels, we propose a novel dual-stream learning approach. Our model effectively enhances the target’s edge information, improving the model’s recognition capability with respect to small objects and edge information. During the training phase, the model enhances its representational capacity by leveraging attention mechanisms and facilitating deep fusion of edge features with main body information through an improved ASPP module. This strengthens the learning of edge information and can produce probability maps with high-quality edge information. During the inference phase, the model uses a structural reparameterization strategy to reduce the computational complexity of the model parameters while ensuring consistent inference results. This approach reduces the latency caused by communication and speeds up the inference process. Extensive validation on retinal vessel segmentation benchmarks demonstrates the framework’s competitive performance, particularly in peripapillary large vessel segmentation, where state-of-the-art metrics are attained compared to contemporary approaches: an F score (2.44% increase), DCR (4.23% increase), and MSRR (2.77% increase).
However, optic disc vessel imaging employs diverse modalities, requiring our model to segment vessels across image formats. Future work will explore style transfer-based network adaptation, task decoupling, and conditional normalization. We also aim to develop a unified framework for pixel-level segmentation of multi-modal optic disc vessel data.
Through these enhancements, robustness in microvascular detail capture across imaging platforms is expected to be improved, thereby advancing clinical utility. This work is regarded as a meaningful step toward bridging the gap between deep learning-based retinal vessel analysis and clinical diagnostic requirements, particularly for early detection of vascular pathologies in diabetic retinopathy and glaucoma.

Author Contributions

Conceptualization, J.L. (Jingmin Luan); Methodology, J.L. (Jingmin Luan); Software, Z.W.; Validation, Q.L. and D.Y.; Formal analysis, J.L. (Jian Liu); Investigation, Y.Y. and X.Z.; Resources, J.S.; Data curation, N.L.; Writing—original draft, J.L. (Jingmin Luan); Project administration, Z.M. All authors have read and agreed to the published version of the manuscript.

Funding

This work was supported by the National Natural Science Foundation of China (62301137).

Institutional Review Board Statement

Not applicable.

Informed Consent Statement

Not applicable.

Data Availability Statement

The data presented in this study are available on request from the corresponding author.

Conflicts of Interest

The authors declare that there are no conflicts of interest relevant to this paper.

References

  1. Oshitari, T.; Hanawa, K.; Adachi-Usami, E. Changes of macular and RNFL thicknesses measured by Stratus OCT in patients with early stage diabetes. Eye 2009, 23, 884–889. [Google Scholar] [CrossRef] [PubMed]
  2. Leung, C.K.; Choi, N.; Weinreb, R.N.; Liu, S.; Ye, C.; Liu, L.; Lai, G.W.; Lau, J.; Lam, D.S. Retinal Nerve Fiber Layer Imaging with Spectral-Domain Optical Coherence Tomography: Pattern of RNFL Defects in Glaucoma. Ophthalmology 2010, 117, 2337–2344. [Google Scholar] [CrossRef] [PubMed]
  3. Robbins, C.B.; Grewal, D.S.; Thompson, A.C.; Soundararajan, S.; Yoon, S.P.; Polascik, B.W.; Scott, B.L.; Fekrat, S. Identifying Peripapillary Radial Capillary Plexus Alterations in Parkinson’s Disease Using OCT Angiography. Ophthalmol. Retin. 2022, 6, 29–36. [Google Scholar] [CrossRef]
  4. Yu, P.K.; Cringle, S.J.; Yu, D.Y. Correlation between the radial peripapillary capillaries and the retinal nerve fibre layer in the normal human retina. Exp. Eye Res. 2014, 129, 83–92. [Google Scholar] [CrossRef]
  5. Henkind, P. Radial peripapillary capillaries of the retina. I. Anatomy: Human and comparative. Br. J. Ophthalmol. 1967, 51, 115–123. [Google Scholar] [CrossRef]
  6. Yu, P.; Balaratnasingam, C.; Xu, J.; Morgan, W.; Mammo, Z.; Han, S.; Mackenzie, P.; Merkur, A.; Kirker, A.; Albiani, D.; et al. Label-free density measurements of radial peripapillary capillaries in the human retina. PLoS ONE 2015, 10, e0135151. [Google Scholar] [CrossRef] [PubMed]
  7. Yarmohammadi, A.; Zangwill, L.M.; Diniz-Filho, A.; Suh, M.H.; Yousefi, S.; Saunders, L.J.; Belghith, A.; Manalastas, P.I.C.; Medeiros, F.A.; Weinreb, R.N. Relationship between optical coherence tomography angiography vessel density and severity of visual field loss in glaucoma. Ophthalmology 2016, 123, 2498–2508. [Google Scholar] [CrossRef]
  8. Wong, T.Y.; Scott, I.U. Retinal-Vein Occlusion. N. Engl. J. Med. 2010, 363, 2135–2144. [Google Scholar] [CrossRef]
  9. Waheed, N.K.; Rosen, R.B.; Jia, Y.; Munk, M.R.; Huang, D.; Fawzi, A.; Chong, V.; Nguyen, Q.D.; Sepah, Y.; Pearce, E. Optical coherence tomography angiography in diabetic retinopathy. Prog. Retin. Eye Res. 2023, 97, 101206. [Google Scholar] [CrossRef]
  10. Wang, X.; Jiang, C.; Kong, X.; Yu, X.; Sun, X. Peripapillary retinal vessel density in eyes with acute primary angle closure: An optical coherence tomography angiography study. Graefe’s Arch. Clin. Exp. Ophthalmol. Albrecht Von Graefes Arch. Fur Klin. Und Exp. Ophthalmol. 2017, 255, 1013–1018. [Google Scholar] [CrossRef]
  11. Scripsema, N.K.; Garcia, P.M.; Bavier, R.D.; Chui, T.Y.P.; Krawitz, B.D.; Mo, S.; Agemy, S.A.; Xu, L.; Lin, Y.B.; Panarelli, J.F.; et al. Optical Coherence Tomography Angiography Analysis of Perfused Peripapillary Capillaries in Primary Open-Angle Glaucoma and Normal-Tension Glaucoma. Investig. Ophthalmol. Vis. Sci. 2016, 57, OCT611–OCT620. [Google Scholar] [CrossRef]
  12. Rao, H.L.; Pradhan, Z.S.; Weinreb, R.N.; Reddy, H.B.; Riyazuddin, M.; Dasari, S.; Palakurthy, M.; Puttaiah, N.K.; Rao, D.A.S.; Webers, C.A.B. Regional Comparisons of Optical Coherence Tomography Angiography Vessel Density in Primary Open-Angle Glaucoma. Am. J. Ophthalmol. 2016, 171, 75–83. [Google Scholar] [CrossRef]
  13. Huang, D.; Swanson, E.A.; Lin, C.P.; Schuman, J.S.; Stinson, W.G.; Chang, W.; Hee, M.R.; Flotte, T.; Gregory, K.; Puliafito, C.A. Optical coherence tomography. Science 1991, 254, 1178–1181. [Google Scholar] [CrossRef]
  14. Naseripour, M.; Falavarjani, K.G.; Mirshahi, R.; Sedaghat, A. Optical coherence tomography angiography (OCTA) applications in ocular oncology. Eye 2020, 34, 1535–1545. [Google Scholar] [CrossRef]
  15. Çalışkan, N.E.; Doğan, M.; Çalışkan, A.; Gobeka, H.H.; Ay, İ.E. Optical coherence tomography angiography evaluation of retinal and optic disc microvascular morphological characteristics in retinal vein occlusion. Photodiagnosis Photodyn. Ther. 2023, 41, 103244. [Google Scholar] [CrossRef] [PubMed]
  16. Ishibazawa, A.; Nagaoka, T.; Takahashi, A.; Omae, T.; Tani, T.; Sogawa, K.; Yokota, H.; Yoshida, A. Optical Coherence Tomography Angiography in Diabetic Retinopathy: A Prospective Pilot Study. Am. J. Ophthalmol. 2015, 160, 35–44.e1. [Google Scholar] [CrossRef] [PubMed]
  17. Zheng, W.W.; Huang, S.H.; Zheng, Y.; Zuo, J.J.; Qian, S.S.; Zhou, T.Y.; Lin, B. Observational Study of Retinal Branch Vein Occlusion in the Macular Region using DART-OCTA. Int. Eye Sci. 2022, 22, 1391–1395. (In Chinese) [Google Scholar]
  18. Goliaš, M.; Šikudová, E. Retinal blood vessel segmentation and inpainting networks with multi-level self-attention. Biomed. Signal Process. Control 2025, 102, 107343. [Google Scholar] [CrossRef]
  19. Zhang, T.Y.; Suen, C.Y. A fast parallel algorithm for thinning digital patterns. Commun. ACM 1984, 27, 236–239. [Google Scholar] [CrossRef]
  20. Otsu, N. A Threshold Selection Method from Gray-Level Histograms. IEEE Trans. Syst. Man, Cybern. 1979, 9, 62–66. [Google Scholar] [CrossRef]
  21. Canny, J. A Computational Approach to Edge Detection. IEEE Trans. Pattern Anal. Mach. Intell. 1986, PAMI-8, 679–698. [Google Scholar] [CrossRef]
  22. Adams, R.; Bischof, L. Seeded region growing. IEEE Trans. Pattern Anal. Mach. Intell. 1994, 16, 641–647. [Google Scholar] [CrossRef]
  23. Kass, M.; Witkin, A.; Terzopoulos, D. Snakes: Active contour models. IJCV 1988, 1, 321–331. [Google Scholar] [CrossRef]
  24. Khandouzi, A.; Ariafar, A.; Mashayekhpour, Z.; Pazira, M.; Baleghi, Y. Retinal Vessel Segmentation, a Review of Classic and Deep Methods. Ann. Biomed. Eng. 2022, 50, 1292–1314. [Google Scholar] [CrossRef] [PubMed]
  25. Ronneberger, O.; Fischer, P.; Brox, T. U-Net: Convolutional Networks for Biomedical Image Segmentation. arXiv 2015, arXiv:1505.04597. [Google Scholar]
  26. Shankaranarayana, S.M.; Ram, K.; Mitra, K.; Sivaprakasam, M. Joint Optic Disc and Cup Segmentation Using Fully Convolutional and Adversarial Networks. In Proceedings of the International Workshop on Fetal and Infant Image Analysis International Workshop on Ophthalmic Medical Image Analysis, Québec, QC, Canada, 14 September 2017; pp. 168–176. [Google Scholar]
  27. Guo, C.; Szemenyei, M.; Yi, Y.; Wang, W.; Chen, B.; Fan, C. SA-UNet: Spatial Attention U-Net for Retinal Vessel Segmentation. In Proceedings of the 2020 25th International Conference on Pattern Recognition (ICPR), Milan, Italy, 10–15 January 2021; pp. 1236–1242. [Google Scholar] [CrossRef]
  28. Diakogiannis, F.I.; Waldner, F.; Caccetta, P.; Wu, C. ResUNet-a: A deep learning framework for semantic segmentation of remotely sensed data. ISPRS J. Photogramm. Remote Sens. 2020, 162, 94–114. [Google Scholar] [CrossRef]
  29. Zhou, Z.; Rahman Siddiquee, M.M. UNet++: A Nested U-Net Architecture for Medical Image Segmentation. In Deep Learning in Medical Image Analysis and Multimodal Learning for Clinical Decision Support; Springer: Cham, Switzerland, 2018. [Google Scholar]
  30. Qin, X.; Zhang, Z.; Huang, C.; Dehghan, M. U2-Net: Going deeper with nested U-structure for salient object detection. Pattern Recognit. 2020, 106, 107404. [Google Scholar] [CrossRef]
  31. Li, X.; Chen, H.; Qi, X.; Dou, Q.; Fu, C.W.; Heng, P.A. H-DenseUNet: Hybrid Densely Connected UNet for Liver and Tumor Segmentation From CT Volumes. IEEE Trans. Med Imaging 2018, 37, 2663–2674. [Google Scholar] [CrossRef]
  32. Lei, T.; Sun, R.; Du, X.; Fu, H.; Zhang, C.; Nandi, A.K. SGU-Net: Shape-Guided Ultralight Network for Abdominal Image Segmentation. IEEE J. Biomed. Health Inform. 2023, 27, 1431–1442. [Google Scholar] [CrossRef]
  33. Chen, L.C.; Papandreou, G.; Kokkinos, I.; Murphy, K.; Yuille, A.L. DeepLab: Semantic Image Segmentation with Deep Convolutional Nets, Atrous Convolution, and Fully Connected CRFs. IEEE Trans. Pattern Anal. Mach. Intell. 2018, 40, 834–848. [Google Scholar] [CrossRef]
  34. Chen, L.C.; Papandreou, G.; Schroff, F.; Adam, H. Rethinking Atrous Convolution for Semantic Image Segmentation. arXiv 2017, arXiv:1706.05587. [Google Scholar]
  35. He, K.; Zhang, X.; Ren, S.; Sun, J. Deep Residual Learning for Image Recognition. In Proceedings of the IEEE Conference on Computer Vision and Pattern Recognition (CVPR), Las Vegas, NV, USA, 27–30 June 2016. [Google Scholar]
  36. Ding, X.; Zhang, X.; Ma, N.; Han, J.; Ding, G.; Sun, J. RepVGG: Making VGG-Style ConvNets Great Again. In Proceedings of the IEEE/CVF Conference on Computer Vision and Pattern Recognition (CVPR), Nashville, TN, USA, 19–25 June 2021; pp. 13733–13742. [Google Scholar]
  37. He, K.; Zhang, X.; Ren, S.; Sun, J. Spatial Pyramid Pooling in Deep Convolutional Networks for Visual Recognition. IEEE Trans. Pattern Anal. Mach. Intell. 2015, 37, 1904–1916. [Google Scholar] [CrossRef] [PubMed]
  38. Hu, J.; Shen, L.; Sun, G. Squeeze-and-Excitation Networks. In Proceedings of the IEEE Conference on Computer Vision and Pattern Recognition (CVPR), Salt Lake City, UT, USA, 18–22 June 2018. [Google Scholar]
  39. Woo, S.; Park, J.; Lee, J.Y.; Kweon, I.S. CBAM: Convolutional Block Attention Module. In Proceedings of the Computer Vision—ECCV 2018, Munich, Germany, 8–14 September 2018; Ferrari, V., Hebert, M., Sminchisescu, C., Weiss, Y., Eds.; Springer: Cham, Switzerland, 2018; pp. 3–19. [Google Scholar]
  40. Wang, Q.; Wu, B.; Zhu, P.; Li, P.; Zuo, W.; Hu, Q. ECA-Net: Efficient Channel Attention for Deep Convolutional Neural Networks. In Proceedings of the 2020 IEEE/CVF Conference on Computer Vision and Pattern Recognition (CVPR), Seattle, WA, USA, 14–19 June 2020; pp. 11531–11539. [Google Scholar]
  41. Li, A.; Zhang, J.; Lv, Y.; Zhang, T.; Zhong, Y.; He, M.; Dai, Y. Joint Salient Object Detection and Camouflaged Object Detection via Uncertainty-aware Learning. arXiv 2023, arXiv:2307.04651. [Google Scholar]
  42. Takikawa, T.; Acuna, D.; Jampani, V.; Fidler, S. Gated-SCNN: Gated Shape CNNs for Semantic Segmentation. In Proceedings of the 2019 IEEE/CVF International Conference on Computer Vision (ICCV), Seoul, Republic of Korea, 27 October–2 November 2019; pp. 5228–5237. [Google Scholar] [CrossRef]
  43. Zhen, M.; Wang, J.; Zhou, L.; Li, S.; Shen, T.; Shang, J.; Fang, T.; Quan, L. Joint Semantic Segmentation and Boundary Detection Using Iterative Pyramid Contexts. In Proceedings of the IEEE/CVF Conference on Computer Vision and Pattern Recognition (CVPR), Seattle, WA, USA, 14–19 June 2020. [Google Scholar]
  44. Luo, G.; Zhou, Y.; Sun, X.; Cao, L.; Wu, C.; Deng, C.; Ji, R. Multi-Task Collaborative Network for Joint Referring Expression Comprehension and Segmentation. In Proceedings of the IEEE/CVF Conference on Computer Vision and Pattern Recognition (CVPR), Seattle, WA, USA, 14–19 June 2020. [Google Scholar]
  45. Veit, A.; Wilber, M.J.; Belongie, S. Residual Networks Behave Like Ensembles of Relatively Shallow Networks. In Advances in Neural Information Processing Systems (NIPS); Curran Associates, Inc.: Red Hook, NY, USA, 2016. [Google Scholar]
  46. Ding, X.; Zhang, X.; Han, J.; Ding, G. Diverse Branch Block: Building a Convolution as an Inception-Like Unit. In Proceedings of the IEEE/CVF Conference on Computer Vision and Pattern Recognition (CVPR), Nashville, TN, USA, 19–25 June 2021; pp. 10886–10895. [Google Scholar]
  47. Ma, Z.; Ding, N.; Yu, Y.; Ma, Y.; Yuan, X.; Wang, Y.; Zhao, Y.; Luan, J.; Liu, J. Quantification of cerebral vascular perfusion density via optical coherence tomography based on locally adaptive regional growth. Appl. Opt. 2018, 57, 10117–10124. [Google Scholar] [CrossRef]
  48. Perazzi, F.; Pont-Tuset, J.; McWilliams, B.; Gool, L.V.; Gross, M.; Sorkine-Hornung, A. A Benchmark Dataset and Evaluation Methodology for Video Object Segmentation. In Proceedings of the IEEE Conference on Computer Vision and Pattern Recognition (CVPR), Las Vegas, NV, USA, 27–30 June 2016. [Google Scholar]
Figure 1. Diagram of our proposed network.
Photonics 12 00588 g001
Figure 2. Redesigned convolutional block attention module.
Photonics 12 00588 g002
Figure 3. Structural re-parameterization applied to the regular stream’s continuous convolution block and the gated shape stream’s residual block.
Photonics 12 00588 g003
Figure 4. Gated convolutional block.
Photonics 12 00588 g004
Figure 5. Score of our method in the training of 150 iterations.
Photonics 12 00588 g005
Figure 6. Result of model on the OCT-1 test dataset. (a) Original images; (b) ground truth; (c) shape stream outputs; (d) final segmentation results; (e) original images with large vessels removed.
Photonics 12 00588 g006
Figure 7. (a) Test images from our OCT-1 dataset; (b) corresponding ground-truth segmentation; (c) segmentation by SG-UNet; (d) segmentation by UNet++; (e) segmentation by Swin-UNet; (f) segmentation by our model.
Photonics 12 00588 g007
Figure 8. Enlarged view of the details of our method’s results. (a) corresponding ground-truth segmentation; (b) segmentation by SG-UNet; (c) segmentation by UNet++; (d) segmentation by Swin-UNet; (e) segmentation by our model.
Photonics 12 00588 g008
Figure 9. Skeletonization and distance transformation results of large vessels.
Photonics 12 00588 g009
Figure 10. Analysis of the MSE between large vessel segmentation results and ground truth (GT).
Photonics 12 00588 g010
Figure 11. Analysis of SSIM between large vessel segmentation results and ground truth (GT).
Photonics 12 00588 g011
Figure 12. The perfusion density of the microvascular network.
Photonics 12 00588 g012
Table 1. Performance of our proposed model on OCT-1.
DatasetOCT-1
Obtained fromOCTA images captured from the patients in local hospital
Train/Validation/Test460/58/58 (8:1:1)
Resolution (pixels) 962 ( ± 5 ) × 972 ( ± 5 )
Resize (pixels) 1008 × 1008
Augumentation methods(1) Random crops; (2) horizontal flips;
(3) vertical flips; (4) diagonal flips.
Table 2. Performance of the proposed method based on 5-fold cross-validation.
FoldDiceIoUAccuracyRecall
10.87790.83570.95580.9632
20.90220.86040.96410.9579
30.87410.85900.95260.9759
40.88080.83670.95480.9644
50.80870.82230.92750.9741
Mean ± SD 0.8688 ± 0.0344 0.8428 ± 0.0147 0.9510 ± 0.0142 0.9671 ± 0.0072
Table 3. Comprehensive performance comparison (5-Fold CV results).
MethodAcc
(Mean ± SD)
IoU
(Mean ± SD)
Dice
(Mean ± SD)
Recall
(Mean ± SD)
vs. Ours
(p-Value)
Effect Size
(Cohen’s d)
SG-Unet0.9645 ± 0.00280.8393 ± 0.00350.8063 ± 0.00410.9402 ± 0.0047<0.001 **1.92
UNet++0.9672 ± 0.00230.8412 ± 0.00310.8124 ± 0.00460.9573 ± 0.00420.002 **1.37
Swin-UNet0.9725 ± 0.00260.8467 ± 0.00330.8215 ± 0.00480.9415 ± 0.00450.006 **1.05
Ours0.9785 ± 0.00190.8625 ± 0.00270.8461 ± 0.00300.9447 ± 0.0038//
Asterisks are used to denote the statistical significance level of test results. One asterisk (*) indicates p < 0.05, suggesting that the result is statistically significant. Two asterisks (**) indicate p < 0.01, implying that the result is highly significant. Bold represents the best results.
Table 4. Comparison of medical indicators.
ModelSG-UNetUNet++Swin-UNetOurs
DCR0.66810.70220.67750.7319
MSRR0.94610.94100.93980.9723
Bold represents the best results.
Table 5. Ablation studies of our proposed modules in a network.
ModelAccF ScoreIoURecall
Ours0.97850.84610.86250.9487
w/o Shape Stream0.95530.78610.83160.9235
w/o ASPP0.96180.82430.82940.9364
w/o CBAM0.96840.83170.84370.9353
r CBAM0.97360.84200.85730.9496
Bold represents the best results.
Table 6. Ablation study of re-parameterization.
ModelTotalTrainableNon-TrainableTimeFLOPs
w/o re-parameterization8,885,2958,885,295062 ms/frame287 G
w re-parameterization8,095,0878,095,087037 ms/frame268 G
Disclaimer/Publisher’s Note: The statements, opinions and data contained in all publications are solely those of the individual author(s) and contributor(s) and not of MDPI and/or the editor(s). MDPI and/or the editor(s) disclaim responsibility for any injury to people or property resulting from any ideas, methods, instructions or products referred to in the content.

