Article

Complete Dispersion Measurement for Few-Mode Fibers with Large Mode Numbers Enabled by Multiplexer-Assisted S2

1
State Key Laboratory of Precision Measuring Technology and Instruments, Key Laboratory of Opto-Electronic Information Technology of Ministry of Education, Tianjin Key Laboratory of Integrated Opto-Electronics Technologies and Devices, School of Precision Instruments and Opto-Electronics Engineering, Tianjin University, Tianjin 300072, China
2
Peng Cheng Laboratory, Shenzhen 518038, China
*
Authors to whom correspondence should be addressed.
These authors contributed equally to this work.
Photonics 2025, 12(6), 561; https://doi.org/10.3390/photonics12060561
Submission received: 6 May 2025 / Revised: 28 May 2025 / Accepted: 30 May 2025 / Published: 3 June 2025

Abstract

:
With the widespread use and increasing importance of few-mode fibers (FMFs), comprehensive dispersion measurement for FMFs with large mode numbers is in urgent demand. Among existing methods, spatially and spectrally resolved (S2) imaging technique offers distinct advantages for measuring differential mode group delay (DMGD) and chromatic dispersion (CD) parameters. However, it suffers from several limitations such as uncontrollable mode excitation and an inability to measure absolute CD. In this study, we enhance the traditional S2 method, making it possible to effectively measure the complete dispersion for high-mode-count FMFs. By introducing a mode multiplexer (MMUX), selectively and proportionally mode excitation can be realized. Combined with a tunable delay line array, the misalignment of the MMUX’s fiber pigtail lengths is canceled. Additionally, with the help of a reference path capable of generating planar light, the measurement of the absolute CD is enabled. Based on the enhanced MMUX-assisted S2, a simultaneous DMGD and absolute CD measurement for an FMF supporting up to six LP modes is conducted, which has not been previously demonstrated with a single S2-based system. The proposed paradigm significantly expands the mode number of FMF measurable by S2, enriches the parameters that S2 can cover, and even has great inspiration for other measurement methods.

1. Introduction

With the rapid development of data services, such as the Internet of Things, artificial intelligence, and virtual reality, network traffic has grown exponentially in recent years. Mode-division multiplexing (MDM) based on few-mode fibers (FMFs) has been introduced to significantly increase optical communication systems’ capacity [1,2,3,4]. As a mainstream trend, MDM transmissions with a capacity increase of one order of magnitude have always been pursued [5,6,7], meaning that FMFs with more than 10 spatial modes are highly desirable. Fibers with large mode numbers are also widely used in the sensing field [8]. However, multiple-input multiple-output (MIMO) digital signal processing (DSP) is usually required to equalize the mode crosstalk, modal dispersion, as well as chromatic dispersion (CD) [9], whose computational complexity increases dramatically with the group delay spread induced by modal dispersion [10]. Therefore, there is also an urgent demand for FMFs with an extremely low differential mode group delay (DMGD). After the design and drawing of FMFs, it is essential to further iteratively optimize the fiber based on precisely characterized dispersion parameters. In addition, the accurate measurement of the absolute CD parameters for each mode can help feedback necessary information to MIMO DSP. Unfortunately, while FMFs with large mode numbers have been extensively utilized [11,12], there remains a lack of comprehensive dispersion measuring methods.
Several typical methods applied to characterize the dispersion parameters of FMFs include the time of flight (ToF) [13], optical low-coherence interference (OLCI) [14,15], spectral interferometric technique [16,17], optical frequency domain reflectometry (OFDR) [18,19], and spatially and spectrally resolved (S2) imaging [20,21]. Generally, the ToF technique launches a narrow pulse into a long FMF with a certain offset to excite multiple modes simultaneously and detects the delay between different modes for DMGD calculation. However, it has relatively low accuracy and requires expensive equipment. Focusing on the maximum capable mode number, ToF supports a DMGD characterization of up to nine LP modes [22], as well as an absolute CD measurement of up to four LP modes [13]. The OLCI technique is mainly based on Michelson interferometers and a broadband incoherent optical source, which can improve spatial resolution and sensitivity. But it also suffers from a high equipment price and a complex setup. The highest achievement in characterizing both DMGD and absolute CD of FMFs through OLCI is four LP modes [15]. The spectral interference technique records electrical spectral interference signals to extract the dispersion information, which requires high radio frequency processing and a complex setup. To date, the spectral interferometry method has been able to characterize the dispersion of FMFs with four LP modes [16], while the CD measurement is limited to relative values among the modes instead of the absolute ones. In addition, OFDR enables the acquisition of distributed dispersion parameters by analyzing the backward Rayleigh scattering spectra. However, the computational complexity is significantly high. Also, the DMGD measurement is likewise restricted to four LP modes, while the absolute CD information is lacking [19]. Overall, the mentioned methods above for measuring DMGD and CD of FMFs are all limited to four LP modes, while obtaining absolute CD simultaneously is not so easy.
In contrast, the S2 technique offers distinct advantages, including a simple setup, low cost, and fast speed. Furthermore, it allows the light field distribution-reconstruction for the high-order modes (HOMs), which serves as a means to verify the affiliation of the measurement results [23]. Due to the superiority of the S2 technique, it has been widely applied [24,25,26,27,28]. In recent years, the S2 system has evolved not only to characterize the DMGD and multi-path interference of FMFs, but also to measure the bend loss of individual modes [29] and monitor the HOM suppression in fiber amplifiers [30,31]. Apart from these parameters, the CD of FMFs can also significantly affect the signal quality of MDM systems. However, there are no reports on absolute CD measurement using S2 to date, limited by its native architecture. Furthermore, FMFs employed in long-haul MDM systems are evolving towards an increase in mode numbers, presenting challenges for precise mode excitation with lateral fiber offset in the S2 system [32,33]. While a report claims that S2 can be employed to characterize DMGD of an FMF with up to nine LP modes [33], the results may have revealed issues, such as non-discrete peaks and an absence of a reconstructed mode distribution.
In this paper, we enhance the existing S2 method by introducing a mode multiplexer (MMUX) for precise mode excitation, thereby addressing the difficulty of uncontrollable mode excitation in high-mode-count FMFs. Combined with a tunable delay line array (TDLA), the misalignment of the MMUX’s fiber pigtail lengths is canceled, avoiding its effect on the measurement results. In order to enable the measurement of the absolute CD, a reference path capable of generating planar light is intentionally added to the system. Based on this enhanced MMUX-assisted S2, the comprehensive DMGD and absolute CD measurement for an FMF supporting up to 6 LP modes (10 spatial modes) over the C-band is achieved. To our knowledge, among works that use a single method to perform simultaneous DMGD and absolute CD measurements, we have measured the highest number of fiber modes. In summary, this work expands the mode number of the FMF under testing and overcomes the limitation of conventional S2 in measuring absolute CD, providing a flexible and compact solution for the complete dispersion characterization of FMFs with large mode numbers.

2. Principle of MMUX-Assisted S2 Technique

A typical S2 system is shown in Figure 1a for the explanation of its measurement principle. Without loss of generality, assuming the length of the fiber under test (FUT) is L and taking only the LP01 and LP11 mode as an example, the light intensity distribution at the output end of the FUT can be expressed as follows [2]:
I x , y , L , ω = I 1 ψ 1 ( x , y ) 2 + I 2 ψ 2 ( x , y ) 2 + 2 Re A 1 A 2 * ψ 1 ( x , y ) ψ 2 * ( x , y ) e i β 2 ω β 1 ω L
where A m represents the electric field amplitudes of the m-th order mode, corresponding to the LP01 and LP11 mode here. Likewise, I m , ψ m ( x , y ) and β m represent the intensity, the normalized electric field distributions and the propagation constant, respectively. Considering the dispersion characteristics of the FUT, we can perform Taylor expansion on β at the central angular frequency ω 0 :
β ω = β ω 0 + d β d ω ω = ω 0 ω ω 0 + 1 2 d β 2 d ω 2 ω = ω 0 ω ω 0 2 + ...
where Δ ω represents the difference between the angular frequency ω and ω 0 . The first term of Equation (2) solely represents the value of β at ω 0 , while the coefficients of the second and third terms reflect the DMGD and CD information of the FUT, respectively. Subsequently, Equation (1) can be rewritten as follows:
I x , y , L , Δ ω = I 1 ψ 1 ( x , y ) 2 + I 2 ψ 2 ( x , y ) 2 + 2 A 1 A 2 * ψ 1 ( x , y ) ψ 2 * ( x , y ) cos ( Δ ω Δ τ 2 1 + Δ ϕ 2 1 ( x , y ) )
where Δ ϕ m n represents the sum of the phase difference between the m- and n-th modes after propagation through the FUT and the argument of the overall complex coefficient, and Δ τ m n denotes the DMGD between the two modes. According to Equation (3), the output light intensity exhibits a periodic variation versus optical frequency. In fact, the output light field is a weighted superposition of LP01 and LP11 modes. Finally, the DMGD can be extracted by performing a fast Fourier transform (FFT) along the frequency dimension on the collected image data sets. Meanwhile, once the beat frequency is determined, the intensity distribution of LP11 can be reconstructed using a carefully designed bandpass filter pixel by pixel. Of course, DMGD measurements and intensity distribution recovery are only reliable and accurate when the relationship I 1 I 2 is satisfied.
Generally, an FMF often supports more than two spatial modes. In order to precisely recover the distribution of each HOM, a near-planar light mode with the highest intensity is required, which is usually served by the FM. To achieve this practically, an offset-based mode excitation is commonly applied at the input face of the FUT, ensuring that the excited power of the fundamental mode (FM) is significantly greater than that of the HOMs, as shown in Figure 1a. Consequently, only the interference terms between the FM and HOMs remain, while the interference terms among HOMs are effectively drowned out. Given the number of supported modes equals M, Equation (3) can be expanded as follows:
I x , y , L , Δ ω = I 1 ψ 1 ( x , y ) 2 + m = 2 M 2 A 1 A m * ψ 1 ( x , y ) ψ m * ( x , y ) cos ( Δ ω Δ τ m 1 + Δ ϕ m 1 ( x , y ) )
However, for FUTs with large mode numbers, offset alignment may encounter issues such as difficulty in effectively launching all HOMs or an imbalance in the power ratio of launched modes. In this scenario, the interference between the modes becomes really confusing. In addition to the interference between the FM and HOMs, the interference among HOMs themselves becomes non-negligible. Finally, Equation (4) will take the following form:
I x , y , L , Δ ω = m = 1 M I m ψ m ( x , y ) 2 + m = 1 M n = 1 , m n M 2 A m A n * ψ m ( x , y ) ψ n * ( x , y ) cos ( Δ ω Δ τ m n + Δ ϕ m n ( x , y ) )
As a consequence, the DMGD-related results obtained after FFT would exhibit too many discrete peaks, which may even be mixed into an obvious region with energy fluctuations, making it impossible to extract accurate DMGD information [34]. To avoid this issue, it is wise to selectively and proportionally generate each mode. This can be achieved by introducing an MMUX before the FUT, as depicted in Figure 1b. By exciting only the FM and one HOM at a time, only one distinct FFT peak appears, whose location corresponds to the exact DMGD value. At this stage, m and n in Equation (5) can be chosen arbitrarily to measure a specific HOM, as long as the number of modes supported by the MMUX is sufficient. With the help of variable optical attenuators (VOAs), A m and A m can also be arbitrarily controlled to satisfy I 1 I m . Finally, for the measurement of the m-th HOM, Equation (5) can be simplified to the following:
I x , y , L , Δ ω = I 1 ψ 1 ( x , y ) 2 + 2 A 1 A m * ψ 1 ( x , y ) ψ m * ( x , y ) cos ( Δ ω Δ τ m 1 + Δ ϕ m 1 ( x , y ) )

3. Alignment for Optical Paths of MMUX’s Pigtails

Although introducing an MMUX and VOAs into S2 can help realize controllable mode excitation, the length differences in the MMUX’s optical paths could significantly affect the time-related measurement results, especially for DMGDs. Generally, the extra relative delays among LP modes arise not only from the difference in the propagation speeds of various LP modes within the several-meter scaled few-mode pigtail, but also from the length difference among the single-mode pigtails, which is usually up to several centimeters. For example, assuming the length of the FUT is 100 m, a 1 cm-long difference between two pigtails of the MMUX would introduce a 500 ps/km error onto the DMGD results, which is too fatal to be accepted. Therefore, the relative delays among the pigtails of the MMUX need to be calibrated inline before measuring. Here, we use the variant S2 system shown in Figure 2a for time-domain calibration, where the TDLA is used for subsequent alignment. After that, the influence of the few-mode pigtail and single-mode pigtails can be canceled in theory. Note that only six ports of the MMUX are used here, because the FUT is expected to be a 6-LP FMF, while only one mode in the degenerate group needs to be noticed. The MMUX used in this paper is a commercial multi-plane light conversion device, supporting up to six LP modes. Its typical insertion loss and mode-dependent loss are 2.77 dB and 1.21 dB, respectively, and the maximum crosstalk is only −21.05 dB. The available delay range of the TDLA is from 0 to 660 ps, corresponding to a maximum pigtail mismatch of 13.2 cm it can compensate for.
Firstly, the length differences between the single-mode pigtails of the MMUX we used, measured initially via a ruler, are within 2 cm. Those correspond to total delays of less than 100 ps, which is already within the normal measurement range of a conventional S2. For the convenience of subsequent adjustment, the initial delay values T1–T6 of the paths of the TDLA associated with each mode are uniformly set to 100 ps. Note that the use of a ruler for this preliminary measurement is intended to roughly align the pigtails’ lengths, thereby improving the robustness of the calibration processes.
After the rough calibration, length differences between the single-mode ports inside the MMUX device may still exist, which cannot be measured via a ruler. Therefore, precise calibration is required based on the system shown in Figure 2a. In fact, the key principle of the calibration system is similar to that of the S2 system for characterizing the DMGDs of FMFs. Here, the FM path is considered as a common reference, and the optical coupler’s (OC) lower arm is switched to connect HOM paths one by one. The obtained data is then processed by FFT, and the peak locations corresponding to the relative delays between FM and HOM paths are extracted, as shown in Figure 2b. Subsequently, the extracted delay values Tm are used to adjust the corresponding HOM paths inside the TDLA. After that, the calibration is conducted again for verification of the alignment effectiveness. It should be noted that since the minimum step size for delay adjustment of TDLA is 0.5 ps, Tm for each HOM path is selected as close to the peak locations shown in Figure 2b as possible. After the delay adjustment, the relative delays among the six paths are reduced to a level that the system cannot distinguish, with the six corresponding peak locations all being moved to near zero. In order to deal with the possible opposite adjustment direction, the process is then repeated until no relative delay is detected, thus completing the whole alignment. According to the absolute peak locations and the right adjustment direction, the maximum difference in relative delay between path 3 and 5 is revealed to be 84 ps, and the corresponding length difference is 1.7 cm, matching the ruler measurement results.
In the calibration experiment mentioned above, the frequency sweep interval of the TLS is set as Δf = 5 GHz, and the number of obtained images N is set as 512. The calibration system’s alignment accuracy is 1 / ( Δ f * N ) [35], calculated as about 0.4 ps. Since the minimum step size of TDLA used in the experiment is slightly greater, i.e., 0.5 ps, the final accuracy of the path alignment is considered to be 0.5 ps.

4. Measurement for the DMGDs and Absolute CDs of a 6-LP FMF

Upon completion of the optical path alignment, we immediately characterize a 200 m-long graded-index FMF supporting six LP modes with a low-designed DMGD based on the MMUX-assisted S2 shown in Figure 1b. The central wavelength of the TLS is set to 1550 nm, and Δf and N are set to 3 GHz and 512, respectively. The DMGD results between different HOMs and the FM, along with the reconstructed optical field distributions at the peak locations, are presented in Figure 3d–h and their insets. By extracting the phase of the interferogram at each peak point and combining it with the intensity information, we can obtain holograms containing both intensity and phase information; the intensity of the hologram represents the amplitude of the optical field whilst a cyclic colormap is used for the phase, as shown in the insets of Figure 3.
For comparison, we also characterize the fiber by the typical S2 system without the inclusion of the TDLA and MMUX. The lateral offset between the single-mode fiber and the FUT is adjusted by approximately 1 µm, 2 µm, and 3 µm, respectively, to achieve sufficient mode excitation, whose results are shown in Figure 3a–c. Obviously, without the participation of TDLA and MMUX, the curves exhibit energy fluctuation regions that are approximately 10 dB higher than the noise floor. However, no distinct peaks are observed in this region, making it impossible to determine DMGD values or to reconstruct the optical field distributions of the HOMs. This can be supported by the holograms recovered at the near-zero locations in Figure 3a–c. At an offset of 1 µm, the mode excitation may be very insufficient, while at an offset of 3 µm, the proportion of HOMs becomes dominant.
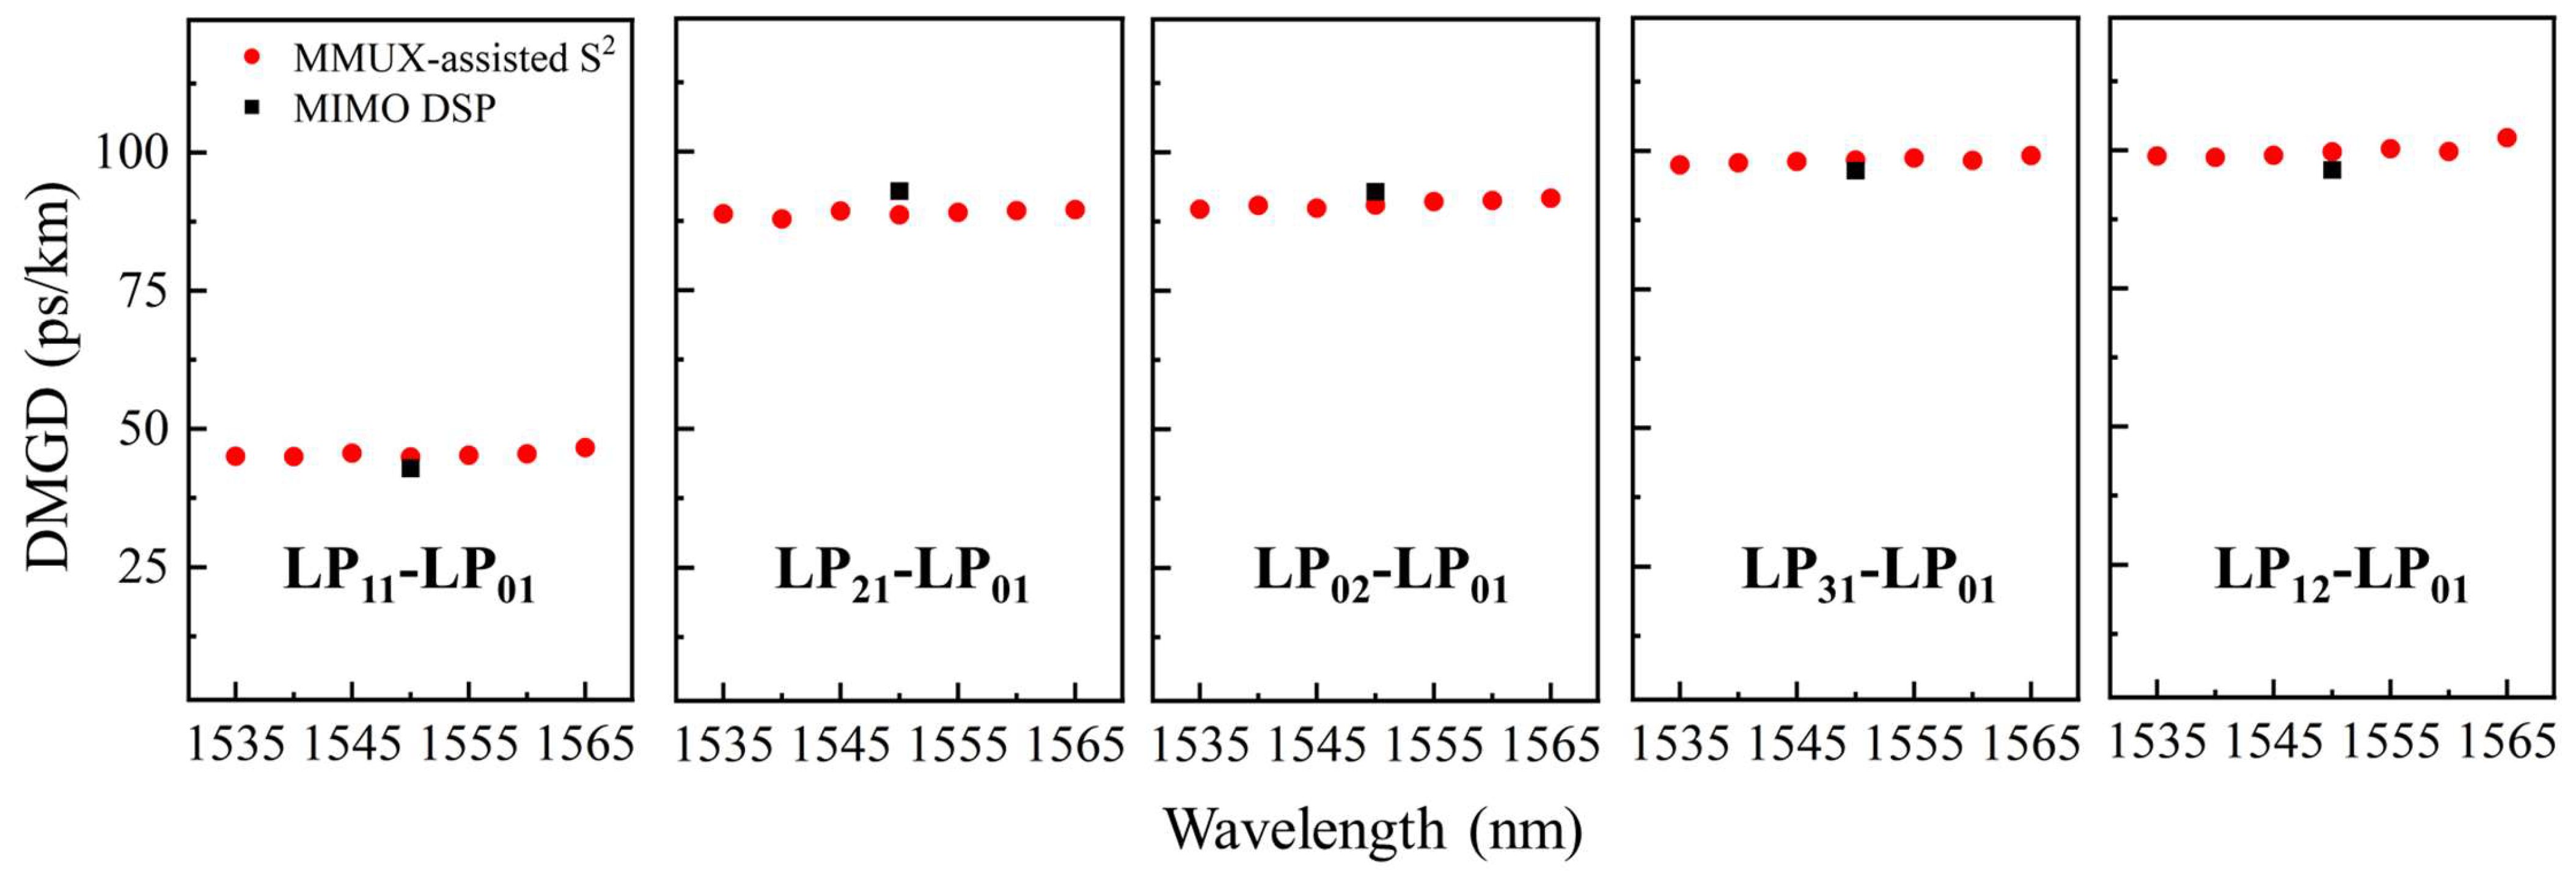
In contrast, when the TDLA and MMUX are added, the curves shown in Figure 3d–h reveal clear peaks for each HOM. The DMGD values between each HOM and the FM are measured to be 44.91, 88.59, 90.44, 98.34, and 99.67 ps/km, respectively, and the optical field distributions of the HOMs closely resemble the ideal mode patterns. This demonstrates that the results with TDLA and MMUX are significantly better than those without, thus confirming our argument above. Furthermore, the DMGDs of the FUT over the whole C-band can be measured, as plotted in Figure 4.
To verify the accuracy of the proposed method, we conduct a single-span transmission via a 10.16 km-long FMF, which is of the same origin as the FUT. Then, the DMGD results are calculated through the MIMO DSP method at 1550 nm [6]. It can be seen that the errors between the DMGD results measured by the proposed S2 and the MIMO DSP-based method are all less than 5%. As regards the accuracy evaluation process of path alignment mentioned above, the accuracy of the DMGD measurement is calculated as about 0.6 ps/km.
After completing the DMGD measurement, we enhance the S2 system to enable the measurement of the absolute CD of FMFs. A reference path capable of generating planar light is added to the system in Figure 1b, as shown in Figure 5a. By switching OC to only connect the FM path, we can obtain the interference images between the FM and the reference planar light via a beam splitter (BS). These images are then subjected to FFT analysis, yielding a peak corresponding to the relative time delay between the FM and the planar light. By varying the central wavelength of the TLS, we can obtain the time delays of the FM over the C-band, as indicated by the circle in Figure 5b. Since the length of the free-space reference path is extremely short, it can be neglected in comparison to the 200 m-long FUT. Therefore, the time delay value ( τ ) in Figure 5b can be considered solely generated by the FM.
As we know, for a fiber of length L, CD can be expressed as follows:
C D = 1 L d τ d λ
At the beginning, we calculate the second-order polynomial fitted relationship between τ and wavelength, as indicated by the solid line in Figure 5b, whose function is as follows:
τ = 6.20 × 10 3 λ 2 15.38 λ + 9012.66
where the units of τ and λ are ps and nm, respectively. Subsequently, the absolute CD curve of the FM can be obtained through Equation (7), whose function is as follows:
C D F M = 6.20 × 10 2 λ 76.88
where the unit of CD is ps/nm/km. Based on the above derivation, we can plot the absolute CD of the FM over the C-band in Figure 5c.
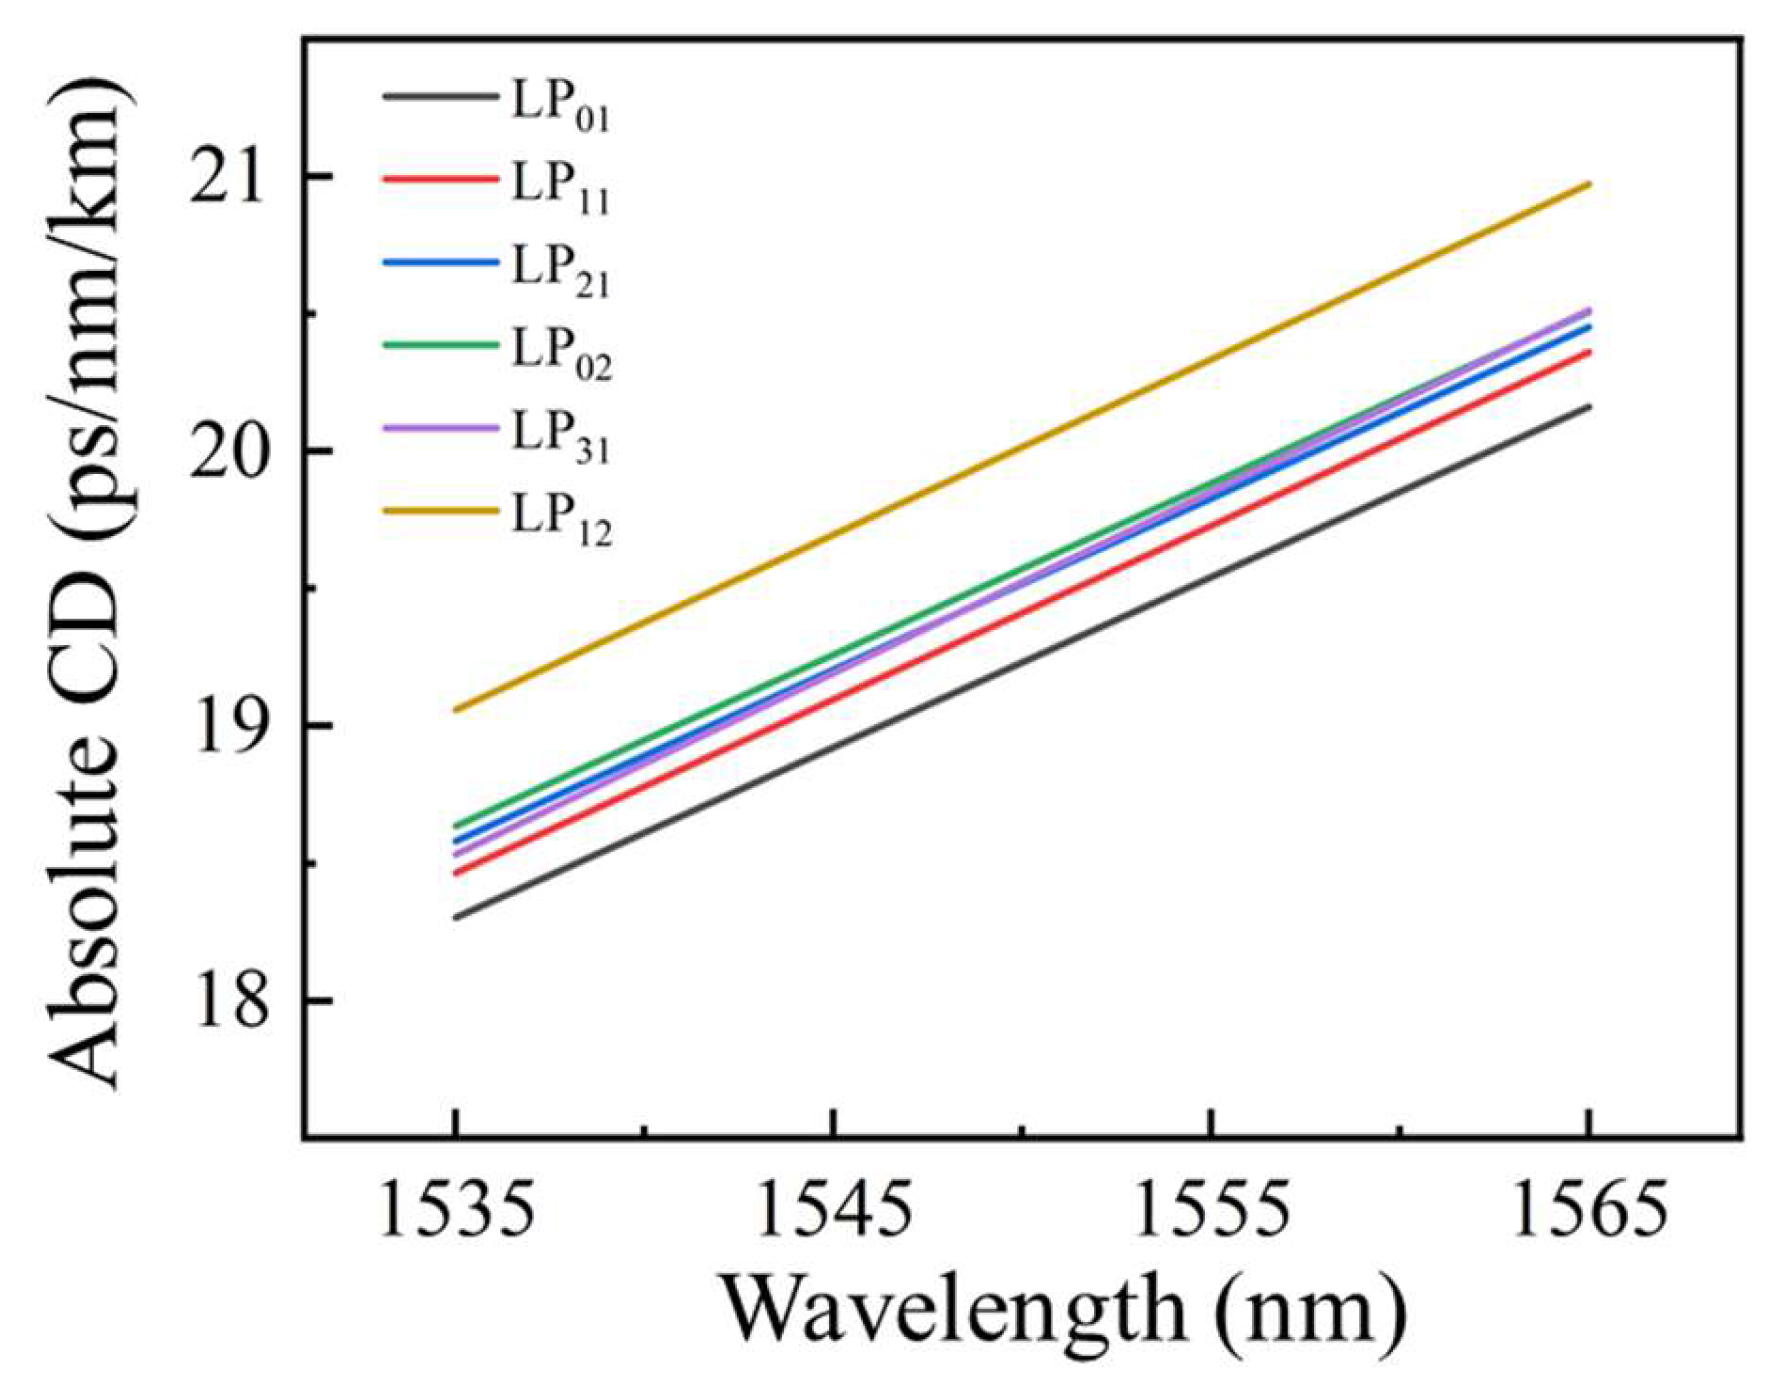
Apart from the absolute CD of the FM, we can derive the relative CD relationships between HOMs and the FM using their DMGD information in Figure 4. By also performing a second-order polynomial fit to DMGD relationships followed by differential operation, the linear CD differences between HOMs and the FM can be extracted. By directly adding this to the absolute CD of the FM individually, we can determine the absolute CD of all modes over the C-band, as shown in Figure 6.
So far, we have enhanced the traditional S2 method by introducing TDLA, MMUX, and an additional optical reference path, making it possible to effectively measure the complete dispersion for high-mode-count FMFs, including the DMGD and absolute CD of all spatial modes. At 1550 nm, the typical CD values of each LP mode are found to be 19.23, 19.41, 19.52, 19.57, 19.52, and 20.01 ps/nm/km, respectively.

5. Discussion and Conclusions

In conclusion, we enhance the existing S2 system by incorporating an MMUX to selectively and proportionally generate each mode in FMFs, addressing the difficulty of uncontrollable mode excitation when characterizing high-mode-count FMFs. Additionally, the TDLA introduction, self-calibration, and pigtail-length alignment prior to the measurement stage help resolve the time-related issues induced by the MMUX, with a path alignment accuracy of 0.5 ps. Then, a DMGD measurement for a six-LP-mode FMF is conducted based on the MMUX-assisted S2, with the specific values ranging from 44.91 to 99.67 ps/km. The errors between the DMGD results measured by the proposed S2 and the MIMO DSP-based method are all less than 5%. Meanwhile, a reference path capable of generating planar light is intentionally added to the system, enabling the measurement of the absolute CD. The measurement results demonstrate that the proposed method provides a flexible and compact solution for the complete dispersion characterization of FMFs with large mode numbers.

Author Contributions

Conceptualization, Z.Y., Y.L. and L.Z.; validation, B.Z., H.W. and Z.L.; formal analysis, B.Z.; investigation, B.Z. and Z.Y.; resources, Z.Y. and L.Z.; data curation, B.Z.; writing—original draft preparation, B.Z.; writing—review and editing, Z.Y., Y.L. and L.Z.; supervision, Z.Y., Y.L. and L.Z.; project administration, Z.Y., Y.L., Z.H. and L.Z. All authors have read and agreed to the published version of the manuscript.

Funding

National Key R&D Program of China (No. 2024YF0726500); National Natural Science Foundation of China (NSFC) (No. 62405217); Tianjin Natural Science Foundation (23JCQNJC01580); National Key R&D Program of Sichuan Province, China (No. 2025YFHZ0020).

Institutional Review Board Statement

Not applicable.

Informed Consent Statement

Not applicable.

Data Availability Statement

Data is contained within the article.

Acknowledgments

We acknowledge support by the Advanced Integrated Optoelectronics Facility at Tianjin University. We sincerely thank Chengcheng Hou from the 41st Institute of China Electronics Technology Group Corporation for providing the test equipment, and thank Qiushi Huang, Wei Sun, Min Yan, Xianyu Zhang and Zhenhua Liu from Jiangsu Alpha Optic-electric Technology Co., Ltd. for their help in the few-mode fibers.

Conflicts of Interest

The authors declare no conflicts of interest.

References

  1. Richardson, D.J.; Fini, J.M.; Nelson, L.E. Space-Division Multiplexing in Optical Fibres. Nat. Photonics 2013, 7, 354–362. [Google Scholar] [CrossRef]
  2. Li, G.; Bai, N.; Zhao, N.; Xia, C. Space-Division Multiplexing: The next Frontier in Optical Communication. Adv. Opt. Photonics 2014, 6, 413–487. [Google Scholar] [CrossRef]
  3. Van Uden, R.G.H.; Correa, R.A.; Lopez, E.A.; Huijskens, F.M.; Xia, C.; Li, G.; Schülzgen, A.; De Waardt, H.; Koonen, A.M.J.; Okonkwo, C.M. Ultra-High-Density Spatial Division Multiplexing with a Few-Mode Multicore Fibre. Nat. Photonics 2014, 8, 865–870. [Google Scholar] [CrossRef]
  4. Li, A.; Chen, X.; Al Amin, A.; Ye, J.; Shieh, W. Space-Division Multiplexed High-Speed Superchannel Transmission Over Few-Mode Fiber. J. Light. Technol. 2012, 30, 3953–3964. [Google Scholar] [CrossRef]
  5. Beppu, S.; Igarashi, K.; Kikuta, M.; Soma, D.; Nagai, T.; Saito, Y.; Takahashi, H.; Tsuritani, T.; Morita, I.; Suzuki, M. Weakly Coupled 10-Mode-Division Multiplexed Transmission over 48-Km Few-Mode Fibers with Real-Time Coherent MIMO Receivers. Opt. Express 2020, 28, 19655–19668. [Google Scholar] [CrossRef]
  6. Shibahara, K.; Hoshi, M.; Miyamoto, Y. 10-Spatial-Mode 1300-Km Transmission Over 6-LP Graded Index Few-Mode Fiber With 36-Ns Modal Dispersion. J. Light. Technol. 2024, 42, 1257–1264. [Google Scholar] [CrossRef]
  7. Rademacher, G.; Puttnam, B.J.; Luis, R.S.; Galdino, L.; Maruyama, R.; Aikawa, K.; Awaji, Y.; Furukawa, H. Space-Division Multiplexed Transmission in the S-Band over 55 Km Few-Mode Fibers. Opt. Express 2020, 28, 27037–27043. [Google Scholar] [CrossRef]
  8. Dehdashti Jahromi, H. Performance Analysis of Transmissive Modified Cladding Optical Fibre Sensors. IET Optoelectron. 2022, 16, 63–71. [Google Scholar] [CrossRef]
  9. Ho, K.-P.; Kahn, J.M. Linear Propagation Effects in Mode-Division Multiplexing Systems. J. Light. Technol. 2014, 32, 614–628. [Google Scholar] [CrossRef]
  10. Liu, H.; Wen, H.; Huang, B.; Correa, R.A.; Sillard, P.; Chen, H.; Li, Z.; Li, G. Reducing Group Delay Spread Using Uniform Long-Period Gratings. Sci. Rep. 2018, 8, 3882. [Google Scholar] [CrossRef]
  11. Zhou, X.; Urata, R.; Liu, H. Beyond 1 Tb/s Intra-Data Center Interconnect Technology: IM-DD OR Coherent? J. Light. Technol. 2020, 38, 475–484. [Google Scholar] [CrossRef]
  12. Tauber, D.; Smith, B.; Lewis, D.; Muhigana, E.; Nissov, M.; Govan, D.; Hu, J.; Zhou, Y.; Wang, J.; Jiang, W.-J.; et al. Role of Coherent Systems in the Next DCI Generation. J. Light. Technol. 2023, 41, 1139–1151. [Google Scholar] [CrossRef]
  13. Cheng, J.; Pedersen, M.E.V.; Wang, K.; Xu, C.; Grüner-Nielsen, L.; Jakobsen, D. Time-Domain Multimode Dispersion Measurement in a Higher-Order-Mode Fiber. Opt. Lett. 2012, 37, 347–349. [Google Scholar] [CrossRef]
  14. Gabet, R.; Hamel, P.; Jaouen, Y.; Obaton, A.-F.; Lanticq, V.; Debarge, G. Versatile Characterization of Specialty Fibers Using the Phase-Sensitive Optical Low-Coherence Reflectometry Technique. J. Light. Technol. 2009, 27, 3021–3033. [Google Scholar] [CrossRef]
  15. Gabet, R.; Le Cren, E.; Jin, C.; Gadonna, M.; Ung, B.; Sillard, P.; Nguyen, H.G.; Jaouen, Y.; Thual, M.; LaRochelle, S. Complete Dispersion Characterization of Few Mode Fibers by OLCI Technique. J. Light. Technol. 2015, 33, 1155–1160. [Google Scholar] [CrossRef]
  16. Li, J.; Zhou, Y.; Feng, Y.; Li, Z. Modal Dispersion Characterization of Few-Mode Fiber Based on Electrical Spectral Interferometry with Optical Frequency Comb. Opt. Fiber Technol. 2017, 38, 75–79. [Google Scholar] [CrossRef]
  17. Yang, Z.; Mi, R.; Zhao, N.; Zhang, L.; Li, G. Simultaneous Measurement of Chromatic and Modal Dispersion in FMFs Using Microwave Photonic Techniques. IEEE Photonics J. 2017, 9, 1–9. [Google Scholar] [CrossRef]
  18. Veronese, R.; Galtarossa, A.; Palmieri, L. Distributed Characterization of Few-Mode Fibers Based on Optical Frequency Domain Reflectometry. J. Light. Technol. 2020, 38, 4843–4849. [Google Scholar] [CrossRef]
  19. Veronese, R.; Cappelletti, M.; Fontaine, N.K.; Chen, H.; Mazur, M.; Ryf, R.; Santagiustina, M.; Galtarossa, A.; Palmieri, L. Mode Selective Distributed Characterization of Few-Mode Fibers. J. Light. Technol. 2025, 43, 3982–3988. [Google Scholar] [CrossRef]
  20. Nicholson, J.W.; Yablon, A.D.; Ramachandran, S.; Ghalmi, S. Spatially and Spectrally Resolved Imaging of Modal Content in Large-Mode-Area Fibers. Opt. Express 2008, 16, 7233–7243. [Google Scholar] [CrossRef]
  21. Blin, S.; Nguyen, D.M.; Nguyen, T.M.; Provino, L.; Thual, M.; Chartier, T. Simple Modal Analysis Method for Multi-Mode Fibers. In Proceedings of the 2009 35th European Conference on Optical Communication, Vienna, Austria; 2009. [Google Scholar]
  22. Sillard, P.; Molin, D.; Bigot-Astruc, M.; De Jongh, K.; Achten, F.; Velazquez-Benitez, A.M.; Amezcua-Correa, R.; Okonkwo, C.M. Low-Differential-Mode-Group-Delay 9-LP-Mode Fiber. J. Light. Technol. 2016, 34, 425–430. [Google Scholar] [CrossRef]
  23. Boccuzzi, K.A.; Marciante, J.R. Limitations of the S2 (Spatially and Spectrally Resolved) Imaging Technique. OSA Contin. 2021, 4, 3276–3286. [Google Scholar] [CrossRef]
  24. Rubio, E.A.L. Modified S2 Imaging Modal Decomposition Technique in Few Mode Fibers. Matemática 2020, 18. Available online: https://www.revistas.espol.edu.ec/index.php/matematica/article/view/694 (accessed on 23 May 2025).
  25. Yu, J.; Tan, F.; Yu, C. Few-Mode Fiber Characterization System Based on the Spatially and Spectrally Imaging Technique. Sensors 2022, 22, 1809. [Google Scholar] [CrossRef]
  26. Yu, J.; Tan, F.; Yu, C. Mode Dispersion Measurement of Few-Mode Fiber Utilizing S2 Technique. In Proceedings of the 2021 Opto-Electronics and Communications Conference (OECC), Hong Kong, China, 3–7 July 2021; pp. 1–3. [Google Scholar]
  27. Gray, D.R.; Petrovich, M.N.; Sandoghchi, S.R.; Wheeler, N.V.; Baddela, N.K.; Jasion, G.T.; Bradley, T.; Richardson, D.J.; Poletti, F. Real-Time Modal Analysis via Wavelength-Swept Spatial and Spectral (S2) Imaging. IEEE Photonics Technol. Lett. 2016, 28, 1034–1037. [Google Scholar] [CrossRef]
  28. Newkirk, A.V.; Antonio-Lopez, J.E.; Anderson, J.; Alvarez-Aguirre, R.; Eznaveh, Z.S.; Lopez-Galmiche, G.; Amezcua-Correa, R.; Schülzgen, A. Modal Analysis of Antiresonant Hollow Core Fibers Using S2 Imaging. Opt. Lett. 2016, 41, 3277–3280. [Google Scholar] [CrossRef]
  29. Leandro, L.; Grüner-Nielsen, L.; Rottwitt, K. Mode Resolved Bend-Loss Analysis in Few-Mode Fibers Using Spatially and Spectrally Resolved Imaging. Opt. Lett. 2015, 40, 4583–4586. [Google Scholar] [CrossRef]
  30. Gausmann, S.; Antonio-Lopez, J.E.; Anderson, J.; Wittek, S.; Eznaveh, S.E.; Jang, H.-J.; Habib, M.S.; Cook, J.; Richardson, M.C.; Correa, R.A.; et al. S2 Measurements Showing Suppression of Higher Order Modes in Confined Rare Earth Doped Large Core Fibers. J. Light. Technol. 2020, 38, 1953–1958. [Google Scholar] [CrossRef]
  31. Huang, B.; Chen, H.; Fontaine, N.K.; Jin, C.; Shang, K.; Ryf, R.; Essiambre, R.-J.; Ung, B.; Messaddeq, Y.; LaRochelle, S.; et al. Spatially and Spectrally Resolved Gain Characterization of Space-Division Multiplexing Amplifiers With Coherent Swept-Wavelength Reflectometry. J. Light. Technol. 2017, 35, 741–747. [Google Scholar] [CrossRef]
  32. Nicholson, J.W.; Meng, L.; Fini, J.M.; Windeler, R.S.; DeSantolo, A.; Monberg, E.; DiMarcello, F.; Dulashko, Y.; Hassan, M.; Ortiz, R. Measuring Higher-Order Modes in a Low-Loss, Hollow-Core, Photonic-Bandgap Fiber. Opt. Express 2012, 20, 20494–20505. [Google Scholar] [CrossRef]
  33. Jensen, R.V.; Grüner-Nielsen, L.; Wong, N.H.L.; Sun, Y.; Jung, Y.; Richardson, D.J. Demonstration of a 9 LP-Mode Transmission Fiber with Low DMD and Loss. In Proceedings of the Optical Fiber Communication Conference; OSA: Los Angeles, CA, USA, 2015; p. W2A.34. [Google Scholar]
  34. Nguyen, D.M.; Blin, S.; Nguyen, T.N.; Le, S.D.; Provino, L.; Thual, M.; Chartier, T. Modal Decomposition Technique for Multimode Fibers. Appl. Opt. 2012, 51, 450–456. [Google Scholar] [CrossRef] [PubMed]
  35. Wang, L.; Jin, C.; Messaddeq, Y.; LaRochelle, S. Microwave Interferometric Technique for Characterizing Few Mode Fibers. IEEE Photonics Technol. Lett. 2014, 26, 1695–1698. [Google Scholar] [CrossRef]
Figure 1. Schematics of a typical S2 system (a) and the modified S2 system with TDLA and MMUX introduced (b).
Photonics 12 00561 g001
Figure 2. (a) Measurement setup for path calibration and alignment. (b) The evolution of relative delays before and after the adjustment of TDLA, with the latter six peaks overlapping near the zero position.
Photonics 12 00561 g002
Figure 3. (ac) DMGD-related results measured by typical S2 when offsets are 1 µm, 2 µm, and 3 µm. (dh) DMGD-related results measured by MMUX-assisted S2 for the 5 HOMs. The intensity of the inset hologram represents the amplitude of the optical field whilst a cyclic colormap is for the phase.
Photonics 12 00561 g003
Figure 4. DMGD results over the C-band measured by MMUX-assisted S2 and DSP-based method.
Photonics 12 00561 g004
Figure 5. (a) Setup for absolute CD measurement, where a reference path is added. (b) The delay of the FM over the C-band. (c) The calculated absolute CD of the FM over the C-band.
Photonics 12 00561 g005
Figure 6. CD curves of all modes over the C-band.
Photonics 12 00561 g006
Disclaimer/Publisher’s Note: The statements, opinions and data contained in all publications are solely those of the individual author(s) and contributor(s) and not of MDPI and/or the editor(s). MDPI and/or the editor(s) disclaim responsibility for any injury to people or property resulting from any ideas, methods, instructions or products referred to in the content.