Article

Precise Temperature Measurement Through Wavelength Modulation Heterodyne Phase-Sensitive Dispersion Spectroscopy

1
MIIT Key Laboratory of Complex-Field Intelligent Exploration, School of Optics and Photonics, Beijing Institute of Technology, Beijing 100081, China
2
The 41st Research Institute of China Electronics Technology Group Corporation, Qingdao 266555, China
3
School of Instrumentation and Opto-Electronic Engineering, Beihang University, Beijing 100191, China
*
Author to whom correspondence should be addressed.
Photonics 2025, 12(6), 537; https://doi.org/10.3390/photonics12060537
Submission received: 15 April 2025 / Revised: 12 May 2025 / Accepted: 16 May 2025 / Published: 26 May 2025
(This article belongs to the Section Lasers, Light Sources and Sensors)

Abstract

:
This work proposes a precise temperature measurement method based on wavelength modulation heterodyne phase-sensitive dispersion spectroscopy (WM-HPSDS). Before the light intensity of the laser was modulated by an electro-optic modulator to generate a three-tone beam, the laser produced additional wavelength modulation by superimposing a high-frequency sinusoidal waveform on a slow sawtooth wave. The second harmonic peak value of the H2O dispersion phase at 7185.59 cm−1 and 7182.94 cm−1 was used to extract temperature through two-line thermometry. The experiment was carried out on a water-based thermostat and an acoustically excited Bunsen burner. The extracted temperatures of the thermostat agreed well with the reference temperature, and the deviation was within 1.5 °C. The measurement stability of the Bunsen burner flame was approximately 10.4 dB higher than that of direct HPSDS. Furthermore, measuring the peak values under varying laser powers demonstrated that WM-HPSDS was immune to optical power fluctuations. Therefore, this method has potential for measuring temperature in harsh environments.

1. Introduction

Gas temperature detection plays a vital role in various industrial applications, such as combustion diagnosis, chemical reaction monitoring, and medical testing [1,2,3]. Laser-based gas temperature sensing has been identified as a potent and stable tool, which is less affected by the measurement environment and has gained popularity for its non-invasive, sensitive, and robust properties.
In the past, absorption spectroscopy was one of the most widely used methods in laser-based gas temperature sensing [4]. The typical technical solution is tunable diode laser absorption spectroscopy (TDLAS), which is widely used to measure gas temperature and species concentration due to its fast response, high sensitivity, and low cost [5]. Two typical methods of TDLAS are widely adopted, namely, direct absorption spectroscopy (DAS) and wavelength modulation spectroscopy (WMS). Compared with DAS, WMS can provide a high-fidelity measurement of gas properties based on various harmonic normalization techniques and shows greater application potential [6]. However, when the transmitted laser intensity’s variance with time is detected by photodetectors, the absorption-based measurements have inherent limitations, such as a limited dynamic range, a nonlinear response of absorption intensity to gas concentration, and a direct impact of light intensity fluctuation on the measured absorption signal [7,8].
Compared with absorption spectroscopy, dispersion spectroscopy has attracted extensive attention due to the advantages of immunity to laser power fluctuations, enhanced dynamic range, and calibration-free operation [9,10]. Dispersion spectroscopy utilizes the anomalous refractive index variation near a molecular transition, which has been demonstrated using chirped laser dispersion spectroscopy (CLaDS) and heterodyne phase-sensitive dispersion spectroscopy (HPSDS) [11,12]. CLaDS is a relatively mature method of molecular dispersion measurement, which extracts dispersion information from the instantaneous frequency shift of the beat note [13], whereas, HPSDS is designed to extract phase information related to molecular dispersion through phase demodulation while eliminating the need for chirped lasers [14,15]. In addition, referring to the light source modulation method of CLaDS, HPSDS has also realized the measurement of gas concentration and temperature in mid-infrared and near-infrared, respectively, through the electro-optic modulator and direct current modulation of laser sources [16,17,18,19].
However, so far, few studies have reported the use of laser dispersion spectroscopy for gas temperature measurement. The first application of laser dispersion spectroscopy in the field of temperature measurement was used to measure the temperature of water molecules in laminar flame in 2018 [16]. The experimental results show that the dispersion spectrum can be combined with the two-wire temperature measurement method to achieve temperature measurement. In addition, in laminar flame, the uncertainty estimation of dispersion measurement is almost the same as that of DAS measurement [20]. Considering the immunity to the fluctuation of laser intensity, we used the laser dispersion spectrum to measure the temperature of water molecules in the complex turbulent flame [21]. The results indicate that in complex turbulent combustion, HPSDS has a higher signal-to-noise ratio and more convergent measurement results than laser absorption spectroscopy.
Recently, wavelength modulation heterodyne phase-sensitive dispersion spectroscopy (WM-HPSDS) based on a quantum cascade laser (QCL) at 5.2 µm has been developed for the detection of trace gases [22]. A transition from direct HPSDS to WM-HPSDS is analogous to the transition from DAS to WMS. This technology can be used to significantly improve the sensitivity of conventional direct HPSDS gas concentration measurement. Therefore, this technology is expected to be further used for gas temperature measurement with higher stability.
In this paper, based on the WM-HPSDS technique, a method of measuring temperature via two-line thermometry is presented. A near-infrared distributed feedback (DFB) laser was used as a light source to measure the dispersion spectra of water vapor (H2O) transitions at 7185.59 cm−1 and 7182.94 cm−1. The sensitivity of this pair of lines to temperature measurement has been demonstrated in absorption spectroscopy [23]. The temperature calculation was realized through the monotonic relationship between the ratio of peak values of the two main peaks and the temperature. A water-based thermostat and an acoustically excited Bunsen burner were used to evaluate the proposed method and compare it with the traditional direct HPSDS temperature measurement.

2. Theory

In the WM HPSDS system, the center wavelength of the semiconductor laser is tuned near to the absorption peak by adjusting the temperature of the laser, and then the output wavelength and amplitude of the laser are modulated by injecting a current into the laser.
In the swept mode, the laser modulation signal is a low-frequency sawtooth wave superimposed on a high-frequency sinusoidal wave. The low-frequency sawtooth wave serves to modulate the central wavelength of the laser to sweep through the characteristic absorption spectrum of the gas, thus obtaining the characteristic dispersion spectrum of the accompanying absorption of the gas. The sine wave modulation is combined with phase-sensitive detection to obtain the multiple-harmonic signals of the dispersion phase.
In conventional HPSDS, the beam from the laser passes through an intensity modulator with frequency Ω to generate a three-tone beam. The dispersion signal is encoded as the instantaneous phase of the heterodyne beat-note around carrier frequency Ω and is given by [24],
φ = ω 0 L 2 c n ω 0 + Ω n ω 0 Ω
where ω0 is the center optical frequency, c is the light speed in vacuum, L is the path length through the sample, n(ω) is the refractive index at ω, and Ω is the modulation frequency.
When the sinusoidal modulation frequency of the injected current is fm, the instantaneous frequency ω(t) of the emitted light from the laser can be expressed as follows:
ω t = ω 0 + m cos 2 π f m t .
where m is the amplitude of modulation frequency, fm is the sinusoidal modulation frequency, and t is the time. Therefore, the dispersion phase signal becomes
φ ω , t = ω t L 2 c n ω t + Ω n ω t Ω .
The subsequent phase-sensitive detection provides access to the Fourier coefficients of the in-phase and quadrature components of the phase-demodulated signal. Components of the n-th harmonic are given by
a n ω = 2 f m 0 1 f m φ ω , t cos 2 n π f m t d t .
b n ω = 2 f m 0 1 f m φ ω , t sin 2 n π f m t d t
In the n-th harmonic signal, the contribution of the baseline has been fully suppressed [25]. The harmonic signal can be used to extract the target gas parameters.
In harmonic demodulation, since the center of even-order harmonic signals is the maximum value, it is often used as a measurement signal. And the second harmonic (2f) signal is most commonly used to calculate gas parameters. This is because as the harmonics increase, the peak-to-peak value of the signal will significantly decrease, as shown in Figure 1a. The center of odd-order harmonic terms is zero, which is not suitable for calculation. Therefore, the second harmonic signal was selected as the WM-HPSDS signal for detection. Figure 1b presents the representative WM-HPSDS-2f signal obtained from the thermostat. The WM-HPSDS-2f signal was obtained from the second harmonic of the LIA2. This measurement was carried out at a modulation depth of 50 mV, which was determined by the peak-to-peak voltage (mV) of the 10 kHz sinusoidal modulation applied to the DFB laser driver. The 2f peak values of the two lines were also shown in the plot. In contrast with previous research, the peak value was selected to calculate the gas temperature instead of the peak-to-peak value in this method, which was similar to the absorption-based WMS method and provided a simpler calculation.
When the temperature fluctuates, the variation in the peak value can be compared with the variation in the line strength with the temperature. Therefore, for this experiment, we chose two-line thermometry as the temperature measurement method. The measured gas temperature can be obtained according to the selected spectral line ratio variation, which changes monotonously with the temperature. Figure 2 shows the variation in the peak value and ratio of the simulated second harmonic signal of the two spectral lines with temperature. This demonstrates that the peak ratio of 7185.59 cm−1 to 7182.94 cm−1 varies monotonically with temperature in the temperature range of interest. Therefore, two-line thermometry can also be used for temperature sensing based on WM-HPSDS. The 2f peak values of the two isolated H2O spectral lines at different temperatures were numerically simulated and a lookup table from the peak ratios to temperature was established. In the experiment, the peak ratio of the measured value was compared with the items in the lookup table to extract the temperature value by interpolation [18].

3. Sensor Configuration and Parameter Optimization

3.1. Sensor Configuration

To improve the sensitivity of the heterodyne phase-sensitive dispersion spectroscopy (HPSDS) and to achieve true baseline-free detection. The wavelength modulation (WM)-HPSDS has been developed to address the main limitations of conventional HPSDS, with higher sensitivity [22]. The experimental setup is shown in Figure 3. The main differences from the direct HPSDS were the modulation method of the laser and the demodulation method of the signal.
A DFB laser at 1391.70 nm exploited the H2O line at 7185.59 cm−1 and 7182.94 cm−1 by an injection current with sawtooth wave modulation at 10 Hz. An additional relatively high-frequency sinusoidal modulation at 10 kHz was superimposed to modulate the optical angular frequency and perform wavelength modulation. To perform HPSDS-based detection, the DFB laser emission was intensity modulated by a high-frequency modulation signal (Ω1 = 1.5 GHz), using a fiber-coupled electro-optical modulator (EOM) driven by a radio-frequency signal generator (RFSG1). Meanwhile, the output bias voltage of the bias controller (BC) was entered into the EOM to enhance the sideband [14]. As a result, a three-tone beam with two sidebands separated from the optical carrier by ±Ω1 was generated. Note that the RF signal was divided into two channels that had the same frequency and initial phase by using a power splitter (P1). Then, the three-tone beam from the EOM was collimated by a collimator and passed through the thermostat with a laser path of 0.3 m for laser dispersion measurement of the water vapors inside. After passing through the thermostat, the beam impinged on a square-law photodetector (PD) to generate the beat note signal. If the beam experiences dispersion in the vicinity of the absorption line of the target gas, the phase of the beat note will be modulated, which carries several harmonics of spectroscopic information in the WM-HPSDS detection technique.
In this experiment, the WM-HPSDS signal was monitored by performing demodulation using two lock-in amplifiers (LIA1 and LIA2). The detected beat note signal was converted into an electrical signal by PD and then mixed with a sinusoidal waveform of the same phase but a slightly different frequency (Ω2 = 1.4998 GHz) generated by another radio-frequency signal generator (RFSG2) through the mixer (M1). The frequency of the beat note signal was downconverted to 200 kHz and then received by LIA1 as the input signal for phase demodulation. The reference signal of the LIA1 was the mixed signal of the two radio-frequency signal generators by the M2. Therefore, the demodulated phase of the beat note was obtained from the first harmonic of the LIA1. Then, the demodulated phase was received by LIA2 as the input signal for harmonic demodulation. The reference signal of the LIA2 was the 10 kHz sinusoidal modulation signal from the function generator.

3.2. Parameter Optimization

The amplitude of the peak value was determined by the modulation depth [22]. Figure 4 illustrates the variation in the peak values at 7185.59 cm−1 and 7182.94 cm−1 for different modulation depths. Both maximum peak values of the two lines were observed at 90 mV. Meanwhile, the standard deviations of the peak values repeated 100 times at the same modulation depth show that the two spectral lines have similar noise levels at different modulation depths. Therefore, setting the modulation depth of the DFB laser at 1391.70 nm to 90 mV in this experiment can provide the optimal modulation depth of the selected two spectral lines simultaneously and allows us to maintain the highest signal-to-noise ratio (SNR).

3.3. Temperature Devices

This experiment uses two temperature devices, a water-based thermostat for static temperature measurement and an acoustically excited Bunsen burner for dynamic temperature measurement.
The water-based thermostat used for static temperature measurement, as shown in Figure 5a, produces a stable and uniform temperature path from room temperature to 100 °C, and its temperature deviation is within 0.1K. The reference temperature of the water-based thermostat is measured by the built-in thermal resistance.
To evaluate the measurement ability of the proposed method for dynamic temperature measurement. The butane–air premixed Bunsen burner with a loudspeaker fixed at the bottom was used for dynamic flame monitoring, as shown in Figure 5b,c. A loudspeaker was installed at the bottom of the burner, and the sound was driven by a sinusoidal signal. Temperatures fluctuate with the excitation of the loudspeaker driven by the external sinusoidal signal [23].

4. Results and Discussion

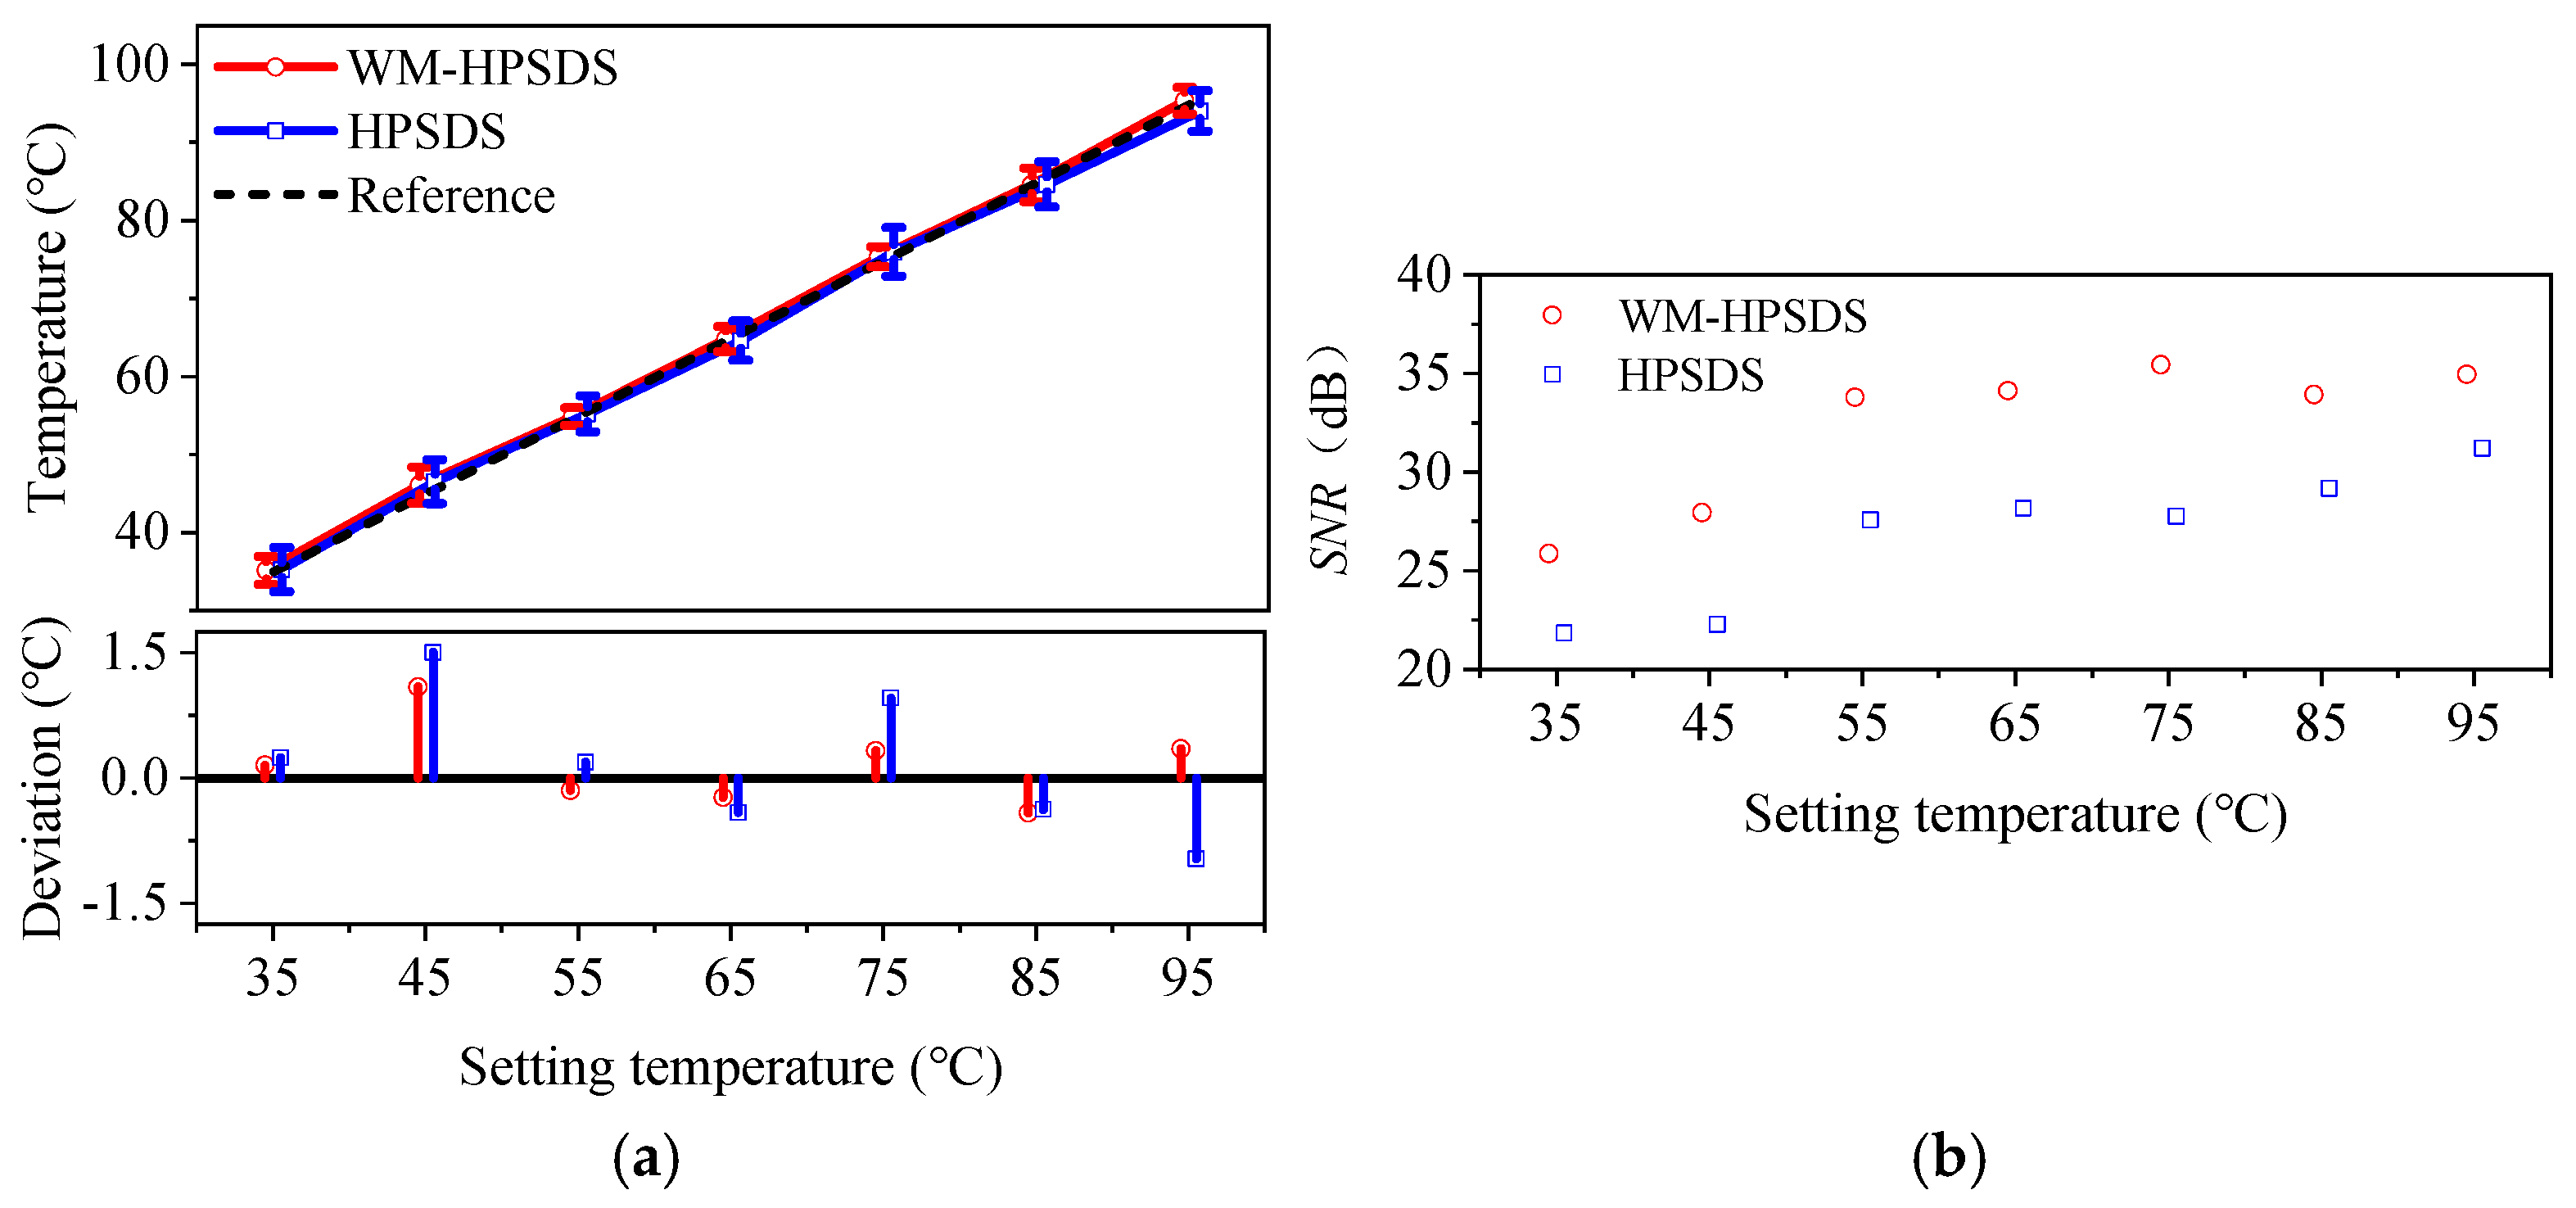
4.1. Static Temperature Measurement Results

Performance evaluations of the proposed method were compared with traditional direct HPSDS measurement. In this experimental setup, the HPSDS realization method was used to remove the 10 kHz sinusoidal modulation given to the laser controller and then obtain the phase signal of HPSDS from the first harmonic of the LIA1. The HPSDS-based temperature results were obtained by two-line thermometry [18]. The gas temperatures achieved by using the WM-HPSDS and HPSDS were compared with the reference temperature of the water-based thermostat from 35 °C to 95 °C at a step of 10 °C.
Figure 6a shows the results of the temperature measurement. The averaged values of temperatures coincide with the reference. WM-HPSDS can obtain a temperature measurement accuracy equivalent to that of traditional direct HPSDS. Specifically, the temperature measurement deviation was within 1.5 °C and slightly less than that of the HPSDS method. The signal-to-noise ratio (SNR) was used to evaluate the repeatability of temperature measurement results [19]. One hundred repetitions were applied to the temperature SNRs for the repeatability evaluations; the temperature SNRs of WM-HPSDS and HPSDS are shown in Figure 6b. When the gas temperature was the same, the SNR of WM-HPSDS was 4.8 dB higher on average than that of direct HPSDS.
Immunity to laser intensity fluctuations is a significant advantage of dispersion spectroscopy [26]. The inherent immunity to laser intensity fluctuations was verified by modifying the incident laser power with a variable optical attenuator (VOA) after the EOM. With the modulation frequency of 90 mV determined for WM-HPSDS, Figure 7 illustrates the peak values of the two H2O spectral lines measured at the setting temperature of the thermostat at 80 °C for different incident laser power, and the fluctuation was within 1%. It is observed that a 50% variation in laser power had little impact on the peak values of the WM-HPSDS signal. Furthermore, it can be seen from the error bar that similar noise levels were maintained at varying laser intensities.

4.2. Dynamic Temperature Measurement Results

In this experiment, the scanning frequency of the laser was set to 500 Hz. Flame temperature values of 10 s were extracted from the setup using HPSDS and WM-HPSDS. Figure 8a depicts the comparison of the normalized spectrum of the temperature measured at 45Hz. The acoustic excitation frequency at 45 Hz and its second harmonic was captured by two methods. Additionally, compared to HPSDS, the third harmonic was also captured by WM-HPSDS. The SNR of the spectral strength at the target excitation frequency reflects the ability to identify the varying gas temperature. The mean value of spectrum strength of the part outside the excitation frequency, such as the black box in Figure 8a, was selected as the level of noise. The SNRs of different acoustical excitation frequencies are shown in Figure 8b. The SNR of WM-HPSDS was 10.4 dB higher on average than that of HPSDS.

5. Conclusions

In conclusion, this paper reported the first temperature measurement to be obtained using near-infrared WM-HPSDS. This technique combines the advantages of dispersion spectroscopy and wavelength modulation technology, i.e., immunity to laser power fluctuations and a higher signal-to-noise ratio. Two spectral lines of water covering 7185.59 cm−1 and 7182.94 cm−1 were simultaneously detected using a near-infrared BDF laser at 1391.70 nm. The peak values of the second harmonic signal of the dispersion phase were used to obtain the temperature through a pre-calculated lookup table in conjunction with two-line thermometry, and this method has been demonstrated in a water-based thermostat and an acoustically excited Bunsen burner. The sensor based on WM-HPSDS is robust and precise and compared with the HPSDS method, the signal-to-noise ratio is 10.4 dB higher on average. There are relatively few studies which have focused on temperature measurement using laser dispersion spectroscopy, and this paper further extends WM-HPSDS to temperature measurement to enrich the dispersion spectroscopy technology and application areas. The potential and feasibility of WM-HPSDS sensors for temperature measurement in harsh environments are expected to be realized in the future.

Author Contributions

Conceptualization, G.W. and R.W.; methodology, R.W.; software, R.W.; validation, R.W.; formal analysis, R.W.; investigation, G.W.; resources, R.W. and W.Z.; data curation, R.W.; writing—original draft preparation, R.W.; writing—review and editing, G.W.; visualization, R.W.; supervision, W.Z.; project administration, W.Z.; funding acquisition, G.W. and R.W. All authors have read and agreed to the published version of the manuscript.

Funding

This research was funded by the National Key Research and Development Program of China, grant number 2024YFF0726500.

Institutional Review Board Statement

Not applicable.

Informed Consent Statement

Not applicable.

Data Availability Statement

The raw data supporting the conclusions of this article will be made available by the authors on request.

Conflicts of Interest

The authors declare no conflicts of interest.

References

  1. Goldenstein, C.S.; Spearrin, R.M.; Jeffries, J.B.; Hanson, R.K. Infrared Laser-Absorption Sensing for Combustion Gases. Prog. Energy Combust. Sci. 2017, 60, 132–176. [Google Scholar] [CrossRef]
  2. Li, J.; Zhang, C.; Wei, Y.; Du, Z.; Sun, F.; Ji, Y.; Yang, X.; Liu, C. In Situ, Portable and Robust Laser Sensor for Simultaneous Measurement of Ammonia, Water Vapor and Temperature in Denitrification Processes of Coal Fired Power Plants. Sens. Actuators B Chem. 2020, 305, 127533. [Google Scholar] [CrossRef]
  3. Duan, K.; Ma, L.; Yi, Y.; Ren, W. Tunable Diode Laser-Based Two-Line Thermometry: A Noncontact Thermometer for Active Body Temperature Measurement. Appl. Opt. 2021, 60, 7036–7042. [Google Scholar] [CrossRef] [PubMed]
  4. Sane, A.; Satija, A.; Lucht, R.P.; Gore, J.P. Simultaneous CO Concentration and Temperature Measurements Using Tunable Diode Laser Absorption Spectroscopy near 2.3 Μm. Appl. Phys. B 2014, 117, 7–18. [Google Scholar] [CrossRef]
  5. Benoy, T.; Wilson, D.; Lengden, M.; Armstrong, I.; Stewart, G.; Johnstone, W. Measurement of CO2 Concentration and Temperature in an Aero Engine Exhaust Plume Using Wavelength Modulation Spectroscopy. IEEE Sens. J. 2017, 17, 6409–6417. [Google Scholar] [CrossRef]
  6. Qu, Z.; Ghorbani, R.; Valiev, D.; Schmidt, F.M. Calibration-Free Scanned Wavelength Modulation Spectroscopy—Application to H2O and Temperature Sensing in Flames. Opt. Express 2015, 23, 16492. [Google Scholar] [CrossRef]
  7. Schultz, I.A.; Goldenstein, C.S.; Jeffries, J.B.; Hanson, R.K.; Rockwell, R.D.; Goyne, C.P. Diode Laser Absorption Sensor for Combustion Progress in a Model Scramjet. J. Propuls. Power 2014, 30, 550–557. [Google Scholar] [CrossRef]
  8. Murzyn, C.; Sims, A.; Krier, H.; Glumac, N. High Speed Temperature, Pressure, and Water Vapor Concentration Measurement in Explosive Fireballs Using Tunable Diode Laser Absorption Spectroscopy. Opt. Lasers Eng. 2018, 110, 186–192. [Google Scholar] [CrossRef]
  9. Martín-Mateos, P.; Acedo, P. Heterodyne Phase-Sensitive Detection for Calibration-Free Molecular Dispersion Spectroscopy. Opt. Express 2014, 22, 15143. [Google Scholar] [CrossRef]
  10. Wysocki, G.; Weidmann, D. Molecular Dispersion Spectroscopy for Chemical Sensing Using Chirped Mid-Infrared Quantum Cascade Laser. Opt. Express 2010, 18, 26123. [Google Scholar] [CrossRef]
  11. Nikodem, M.; Wysocki, G. Measuring Optically Thick Molecular Samples Using Chirped Laser Dispersion Spectroscopy. Opt. Lett. 2013, 38, 3834. [Google Scholar] [CrossRef] [PubMed]
  12. Nikodem, M.; Plant, G.; Sonnenfroh, D.; Wysocki, G. Open-Path Sensor for Atmospheric Methane Based on Chirped Laser Dispersion Spectroscopy. Appl. Phys. B 2015, 119, 3–9. [Google Scholar] [CrossRef]
  13. Nikodem, M.; Weidmann, D.; Smith, C.; Wysocki, G. Signal-to-Noise Ratio in Chirped Laser Dispersion Spectroscopy. Opt. Express 2012, 20, 644. [Google Scholar] [CrossRef]
  14. Ding, W.; Sun, L.; Yi, L.; Ming, X. Dual-Sideband Heterodyne of Dispersion Spectroscopy Based on Phase-Sensitive Detection. Appl. Opt. 2016, 55, 8698. [Google Scholar] [CrossRef]
  15. Martín-Mateos, P.; Hayden, J.; Acedo, P.; Lendl, B. Heterodyne Phase-Sensitive Dispersion Spectroscopy in the Mid-Infrared with a Quantum Cascade Laser. Anal. Chem. 2017, 89, 5916–5922. [Google Scholar] [CrossRef]
  16. Ma, L.; Wang, Z.; Cheong, K.-P.; Ning, H.; Ren, W. Temperature and H2O Sensing in Laminar Premixed Flames Using Mid-Infrared Heterodyne Phase-Sensitive Dispersion Spectroscopy. Appl. Phys. B 2018, 124, 117. [Google Scholar] [CrossRef]
  17. Duan, K.; Hu, M.; Ji, Y.; Lu, Z.; Yao, S.; Ren, W. High-Temperature Ammonia Detection Using Heterodyne Phase-Sensitive Dispersion Spectroscopy at 9.06 Μm. Fuel 2022, 325, 124852. [Google Scholar] [CrossRef]
  18. Wang, R.; Xu, L.; Huang, A.; Cao, Z. Simultaneous Telemetry of Temperature and Vibration by Laser Dispersion Spectroscopy. Opt. Lett. 2022, 47, 3956. [Google Scholar] [CrossRef]
  19. Wang, R.; Pang, Y.; Tang, X. Simultaneous Measurement of Temperature and Water Concentration Using a Novel Laser Dispersion Spectrum Extraction Method Immune to Carrier Phase Variation. Opt. Lasers Eng. 2023, 164, 107497. [Google Scholar] [CrossRef]
  20. Ma, L.; Wang, Z.; Cheong, K.-P.; Ning, H.; Ren, W. Mid-Infrared Heterodyne Phase-Sensitive Dispersion Spectroscopy in Flame Measurements. Proc. Combust. Inst. 2019, 37, 1329–1336. [Google Scholar] [CrossRef]
  21. Wang, R.; Xu, L. High-Precision Temperature Measurement Using Frequency-Division Multiplexing Laser Dispersion Spectroscopy for Dynamic Combustion Monitoring. IEEE Trans. Instrum. Meas. 2024, 73, 7003108. [Google Scholar] [CrossRef]
  22. Hu, M.; Ren, W. Wavelength-Modulation Dispersion Spectroscopy of NO with Heterodyne Phase-Sensitive Detection. Opt. Lett. 2022, 47, 2899. [Google Scholar] [CrossRef]
  23. Xu, L.; Hou, G.; Qiu, S.; Huang, A.; Zhang, H.; Cao, Z. Noise Immune TDLAS Temperature Measurement Through Spectrum Shifting by Using a Mach–Zehnder Interferometer. IEEE Trans. Instrum. Meas. 2021, 70, 7004009. [Google Scholar] [CrossRef]
  24. Wang, Z.; Cheong, K.-P.; Li, M.; Wang, Q.; Ren, W. Theoretical and Experimental Study of Heterodyne Phase-Sensitive Dispersion Spectroscopy with an Injection-Current-Modulated Quantum Cascade Laser. Sensors 2020, 20, 6176. [Google Scholar] [CrossRef]
  25. Nikodem, M.; Weidmann, D.; Wysocki, G. Chirped Laser Dispersion Spectroscopy with Harmonic Detection of Molecular Spectra. Appl. Phys. B 2012, 109, 477–483. [Google Scholar] [CrossRef]
  26. Hu, M.; Ventura, A.; Hayashi, J.G.; Poletti, F.; Yao, S.; Ren, W. Trace Gas Detection in a Hollow-Core Antiresonant Fiber with Heterodyne Phase-Sensitive Dispersion Spectroscopy. Sens. Actuators B Chem. 2022, 363, 131774. [Google Scholar] [CrossRef]
Figure 1. Measurement signals of WM-HPSDS. (a) Comparison of multiple order harmonic signals. (b) Representative measurement WM-HPSDS-2f signal of the dispersion spectra of H2O transitions at 7185.59 cm−1 and 7182.94 cm−1.
Photonics 12 00537 g001
Figure 2. The peak values of the simulated second harmonic signal and the peak ratio of the 7185.59 cm−1 to 7182.94 cm−1 spectral line as a function of temperature.
Photonics 12 00537 g002
Figure 3. The WM-HPSDS experimental system of a water-based thermostat for temperature measurement evaluation. FG: function generator; LC: laser controller; DFB: distributed feedback lasers; EOM: electro-optical modulator; VOA: variable optical attenuator; BC: bias controller; C: collimator; PD: photodetector; M1, M2: mixers; P1, P2: power splitters; RFSG1, RFSG2: radio-frequency signal generators; LIA1, LIA2: lock-in amplifiers; DAQ: data acquisition card.
Photonics 12 00537 g003
Figure 4. Variations in the peak value with the modulation depth and standard deviations of the peak values repeated 100 times.
Photonics 12 00537 g004
Figure 5. The temperature devices. (a) The water-based thermostat. (b) The schematic diagram. (c) Photograph of the Bunsen burner.
Photonics 12 00537 g005
Figure 6. Temperature measurement results obtained using WM-HPSDS and HPSDS. (a) The temperature result and deviation from the reference temperature. (b) The temperature SNR. The X-axis was deliberately separated by a small interval along the horizontal axis for easy observations.
Photonics 12 00537 g006
Figure 7. Measured WM-HPSDS-2f peak values of H2O at varied laser powers. The error bars represent the standard deviation over the steady-state test at 80 °C repeated 100 times.
Photonics 12 00537 g007
Figure 8. Results on the Bunsen burner. (a) The normalized spectrum of acoustic excitation frequency at 45 Hz. (b) SNRs of different acoustic excitation frequencies.
Photonics 12 00537 g008
Disclaimer/Publisher’s Note: The statements, opinions and data contained in all publications are solely those of the individual author(s) and contributor(s) and not of MDPI and/or the editor(s). MDPI and/or the editor(s) disclaim responsibility for any injury to people or property resulting from any ideas, methods, instructions or products referred to in the content.

