Abstract
High-repetition-rate targets present an opportunity for developing diagnostic tools for on-demand calibration at high-power laser facilities for consistent performance and reproducibility during experimental campaigns. The non-linear change in transmission associated with a laser-driven plasma mirror, based on high-repetition rate targets, has been used in a Frequency Resolved Optical Gating (FROG) configuration to analyze the spectral phase for near-infrared pulses far from the Fourier limit. Three types of targets were compared for characterizing pulses in the 1–8 ps range: a glass slide, a polymer tape, and a thin liquid sheet created by two impinging micrometer-scale jets. The thin liquid film had the best mechanical stability and introduced the least spectral distortion, allowing the most robust reconstruction of the temporal intensity profile. The spectral phase was reconstructed using a non-iterative algorithm, which reproduced the second-order phase distortions induced with an acousto-optic programmable dispersive filter with an RMS error of 6.2%, leading to measured pulse durations with an RMS deviation ranging from 1% for pulses of 6.8–7.8 ps up to 7.5% for pulses around 1 ps.
1. Introduction
Few-picosecond pulses are employed to optimize material processing and experimental diagnostics in state-of-the-art laser facilities. Picosecond lasers produce high-energy, short-duration pulses for applications that require balance between energy deposition and thermal diffusion such as industrial machining and medical dermatology [1,2,3,4]. Characterizing these pulses is challenging due to their relatively small intensity, which limits the use of nonlinear techniques used with femtosecond pulses, such as second harmonic generation.
An additional challenge for characterization arises at facility-scale high-power laser systems. Due to their complex architecture, thermal loading, and sensitivity to environmental conditions, they are prone to instabilities, including day-to-day spectral and energy fluctuations [5,6]. These instabilities can affect the reproducibility and accuracy of user experiments, especially in experimental campaigns spanning over multiple days. As a result, there is a strong need for robust, rapid diagnostic tools that enable daily spectral and temporal characterization of the laser.
Early methods for pulse duration measurements, such as streak cameras [7] and silicon-chip-based oscilloscopes [8], provided sub-picosecond resolution. Recent advances include temporal-imaging systems with 1.2 ps resolution [9] and metamaterial-based detectors achieving 500 GHz bandwidths [10]. Spectral interferometry [11] and SEA TADPOLE [12] extended measurement windows to hundreds of picoseconds with 71 fs resolution [13]. Other methods like GRENOUILLE [14] and STRIPED FISH [15] provide spatiotemporal characterization up to 10 ps [16]. Recent techniques, such as chirp-coefficient bisection iteration [17], enhance phase-intensity reconstruction for pulses from femtoseconds to picoseconds.
The plasma mirror frequency-resolved optical gating (PM-FROG) technique [18,19] can be adapted for high-intensity measurements of arbitrary pulse durations in the picosecond range. This method was used to retrieve the spectral phase of 360 ps strongly chirped pulses in the near-infrared, with a temporal resolution of 2 ps, using a non-iterative algorithm. Further studies applied PM-FROG to characterize vacuum ultraviolet (VUV) pulses ranging from 20 fs to 1 ps, using various implementations of an iterative, generalized projection algorithm for waveform retrieval [20,21,22]. The characterization of VUV pulses using the PM-FROG method with an iterative algorithm was extended to high repetition rates using a liquid sheet target as the substrate for plasma mirror [23].
Using a similar pump–probe approach, frequency-resolved optical switching FROSt [24,25] operates through a transmittance switch by promoting electrons to the conduction band of a dielectric, a reversible process. Plasma-induced FROSt (PI-FROSt) [26,27] instead utilizes a plasma lens generated in a gas by a pump pulse, which diffracts a probe pulse and produces a spectrogram via an eclipsing method.
Many high-power laser facilities now provide high-repetition-rate target systems, offering an opportunity to integrate diagnostic procedures that leverage them. Here, we used PM-FROG based on high-repetition-rate targets, along with a non-iterative algorithm, to extend the temporal characterization and reconstruction of near-infrared pulses in the 1–8 ps range. The temporal phase was retrieved directly from the spectra of light transmitted through the plasma mirror as the delays between the pulse and plasma mirror formation were scanned. This direct retrieval approach improves robustness and minimizes errors in phase reconstruction compared to conventional iterative algorithms, which frequently fail to converge in the presence of noise [28].
Several high-repetition-rate targets for plasma mirror generation were compared to assess their performance during measurements at 1 Hz, performed in a pump–probe configuration using the two arms of the High-Power Laser System (HPLS) at the Extreme Light Infrastructure–Nuclear Physics (ELI-NP) facility in Măgurele, Romania [29].
The targets investigated in this study were a glass microscope slide, a Zeonor® polymer tape (Zeon Corporation, Tokyo, Japan), and a liquid sheet. All three targets are compatible with operation at repetition rates of 1 Hz and exhibit good optical transmission around 800 nm, which corresponds to the central wavelength of the laser used. These targets were selected as representative examples of increasing complexity in implementation: the translating microscope slide is the most straightforward to integrate into the experimental setup, while the liquid sheet presents the highest complexity, involving precise fluid delivery and stabilization. The three targets have different thicknesses, from one millimeter to a few micrometers.
2. Materials and Methods
2.1. HPLS Architecture and Dispersion Management
The High-Power Laser System (HPLS) at ELI-NP in Magurele, Romania is a state-of-the-art hybrid laser system delivering two 10 PW femtosecond pulses [30]. It combines Ti:Sa chirped pulse amplification with picosecond optical parametric chirped pulse amplification to achieve high-intensity, high-contrast pulses with broad spectral bandwidth. The system’s dual arms can each deliver 100 TW, 1 PW, and 10 PW pulses at 10 Hz, 1 Hz, and 1/60 Hz, respectively. This configuration allows flexibility for various experimental setups, with the arms used independently or together based on experimental needs.
Dispersion management within the laser chain occurs in multiple stages. Initially, the pulse is stretched to approximately 900 ps using an Offner stretcher, which is necessary for the 10 PW amplifiers but excessive for the 100 TW and 1 PW configurations. Therefore, a partial compressor is employed to compress the pulses to 600 ps in the lower power configurations. Motorized stages in the stretcher allow for coarse adjustments to pulse duration, while an acousto-optic programmable dispersive filter (AOPDF, Dazzler from Fastlite, now Amplitude, Pessac, France) [31] enables fine-tuning of the spectral phase critical for optimal compression. Given that ELI-NP is a user facility, this flexibility in pulse duration at the picosecond scale is needed to accommodate a wide range of experiments, and an accurate temporal characterization at this timescale is essential to ensure precise control and reproducibility of the laser pulses.
In this experiment, two types of pulses were utilized: long pulses around 8 ps, generated by detuning the stretcher, and short pulses around 1 ps created by adding second-order dispersion from the AOPDF.
2.2. Experimental Setup
The setup used laser pulses from the two 1 PW arms of the HPLS system. On Arm A, the pulse was first amplified and then attenuated with optical wedges to 8 mJ. On Arm B, the amplification was inhibited by delaying the pump laser pulses from the seed pulse, reducing the energy to 25 µJ.
Figure 1 shows the experimental setup, which was positioned at the exit of the two PW compressors. Synchronized laser pulses from both arms were focused in the same point on a transparent target. Pulse A was compressed temporally to generate a plasma mirror on the target, while Pulse B was stretched to durations between 1 and 8 ps through coarse adjustments of the stretcher on Arm B followed by fine tuning with the AOPDF. The delay between pulses was controlled using a delay line such that the plasma mirror produced by Pulse A formed while Pulse B passed through the target, thus Pulse B was partly transmitted and partly reflected. Since Pulse B is chirped, the formation of the mirror causes a spectral cutoff in Pulse B, which encodes the arrival time of Pulse A and allows for precise delay measurements [32]. The spectra of the transmitted part of Pulse B were measured with a fiber-coupled spectrometer over a range of pulse delays that corresponded to the plasma mirror forming from before to after the arrival of Pulse B. The spectrometer (HR4000, Ocean Optics inc., Orlando, FL, USA) had a dynamic range of 1300:1 for a single acquisition and 0.02 nm spectral resolution, but the effective resolution was 0.7 nm because the data had to be smoothed to reliably locate the spectral cutoff.
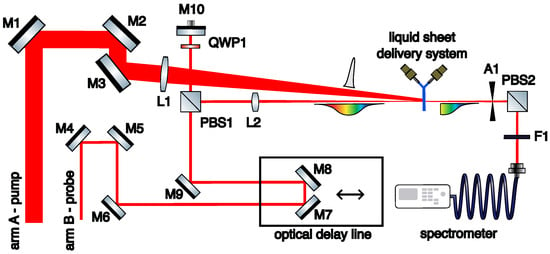
Figure 1.
Experimental setup for PM-FROG using a 24 fs, 8 mJ, 50 mm diameter, compressed pump pulse and a chirped (1–8 ps), 25 µJ, 20 mm diameter probe pulse. M1-10—mirrors, L1—lens f = 1000 mm, L2—lens f = 600 mm, PBS1-2—polarizing beamsplitter cube, QWP1—quarter waveplate, F1—filter, A1—aperture.
2.3. High-Repetition-Rate Solid Targets
The plasma mirror is generated by ablation, which also damages the surface of the target. It can attenuate and degrade the transmitted part of Pulse B. Therefore, a fresh target surface is needed for each pulse, and for most rapid measurements it must be refreshed at the pulse rate of the laser system. Here, all the targets used had a high repetition rate, i.e., they can be used at the nominal pulse rate of the laser. Two types of transparent solid targets were employed. The first was a glass microscope slide made from soda-lime glass, approximately 1 mm thick. The slide was attached at both ends in a holder mounted on a motorized translation stage, which moved the slide continuously and ensured that a fresh surface of the glass was exposed for each laser shot.
The second target was a cyclic olefin polymer (COP) tape (Zeonor®), 100 µm thick [33]. The tape was mounted in an in-house built system that rolled the tape continuously between a spring-loaded drum at one end and a motorized rotating drum at the other. The motor-controlled mechanism enabled continuous pulling of the tape, presenting a new section of the target for each laser pulse.
The tape was approximately 2 m long, which allowed for longer scanning periods compared to the microscope slide measuring 75 mm long. In contrast to the microscope slide, the tape could be continuously refreshed over a larger surface area, providing more target material for each experiment. In principle, long scanning times can be achieved using a raster scan of the slide, but we found that changing the direction of the motion of the slide led to noisy measurements, so the number of shots per scan was limited to what could fit in one translation of the slide. This restriction made the tape target system more advantageous for long-term monitoring of the pulse properties.
2.4. High-Repetition-Rate Liquid Target
The third high-repetition-rate target employed in this work was a thin liquid film produced by colliding two liquid microjets. Figure 2 illustrates the liquid film setup, which uses two nozzles, each with a 50 µm diameter, positioned at an angle of 90 degrees relative to each other. The nozzles were fed with deionized water from a reservoir pressurized with nitrogen. The system was operated at a nitrogen overpressure of 2.4 bar, achieving a total flow rate of approximately 4.5 mL/min. This setup ensured a continuous and uniform liquid film, providing a suitable and reproducible surface for plasma mirror generation.
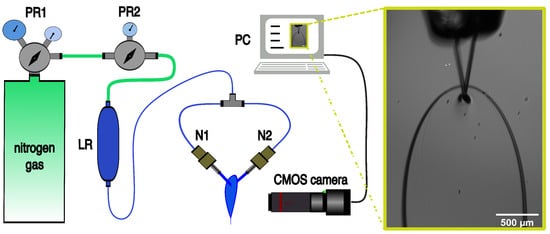
Figure 2.
Experimental setup for creating and imaging targets from two colliding microjets. PR1, PR2—pressure regulator, LR—liquid reservoir, N1, N2—nozzles. Image of the liquid sheet used in the PM-FROG experiment, formed from two 50 µm nozzles at 90 degrees angle and 2.4 bar supply pressure.
2.5. Phase Reconstruction Algorithm
We used a direct, non-iterative algorithm to extract the spectral phase from the PM-FROG measurements. The raw data consist of runs during which the transmitted spectra of Pulse B were recorded as a delay between the two pulses was scanned. In this section, we use a measurement taken with the best-performing target, the liquid sheet, to demonstrate the reconstruction algorithm. Figure 3 shows the raw data for a 1 ps pulse sampled using a plasma mirror, displayed as a 2D spectrogram. First, the cutoff wavelengths in each of the spectra were found by choosing the point where the transmission of the plasma mirror switching reached 50%. The cutoff points are also shown in Figure 3. Outside the region where the plasma mirror forms during Pulse B, the cutoffs are noisy, which is an artifact caused by the difficulty of normalizing spectra. However, the noisy range of the data is outside the spectral sweep, and is not used in the analysis.
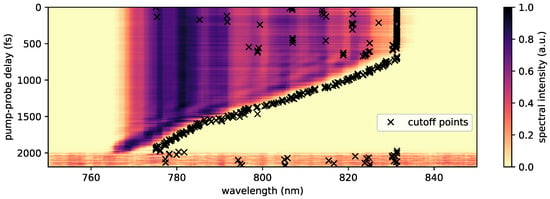
Figure 3.
Spectrogram over multiple pulses at different positions of the translation stage, showing spectral cutting on a liquid target substrate. Each new spectrum is acquired after an optical path step of 0.002 mm, corresponding to a delay of 6.6 fs.
A mapping function was constructed between cutoff wavelength and the delay between the two pulses introduced by the additional optical path of the delay stage where
The corresponding angular frequency is obtained as
Figure 4 shows a plot of the retrieved angular frequency, and of the corresponding wavelength, as a function of the delay introduced by the translation stage. Noisy data outside the spectral sweep were discarded, and the sweep data were fitted with a 7th-order polynomial, generating a continuous function needed to compute the temporal phase.
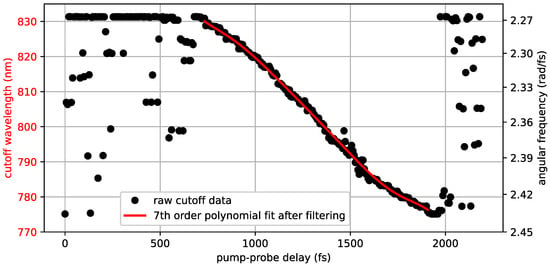
Figure 4.
The instantaneous angular frequency of the cutoff as a function of the delay introduced between the two pulses during the full scan.
The instantaneous angular frequency is related to the temporal phase of the pulse via the following equation:
where represents the central angular frequency. The temporal phase is obtained by the following integration:
The temporal–spectral mapping function , defined by the cutoff points, is bijective on the region of interest. This ensures that for each time t, there is a unique angular frequency , and vice versa. Because of this, the inverse mapping exists and is well-defined, enabling a transition from the temporal domain to the spectral domain.
For a complete characterization of the pulse, whether in the temporal or spectral domain, it is necessary to know both the amplitude and the phase of the electric field. In our case, spectral domain characterization requires knowledge of the spectral phase. The spectral phase can be determined from the temporal phase using the inverse mapping , yielding
By performing a Taylor series expansion around the central frequency, as shown in Equation (6), one can extract the spectral phase components. For this study, we are particularly interested in the second-order dispersion , also known as the group delay dispersion (GDD), which accounts for the amount of linear chirp introduced in the pulse.
In principle, higher-order dispersion coefficients can be fitted. For the present data set, a third-order coefficient can be fitted, and it leads to a nearly identical phase to the second order. Higher-order coefficients could not be determined reliably due to the noise in the low-intensity regions of the spectrum.
A direct time domain approach was used to reconstruct the pulses. Using the mapping function , the spectrum can be rearranged to determine the intensity of each spectral component in time. The amplitude is computed as the square root of the spectral intensity:
The electric field in the time domain, , can then be expressed as
where is the temporal phase of the pulse.
The intensity profile of the pulse is then given by the square of the magnitude of the complex electric field in the time domain:
This method enables a detailed reconstruction of the time-domain characteristics of the pulse, revealing its temporal shape and evolution. An example of the reconstructed intensity profile using this approach is shown in Figure 5.

Figure 5.
(a) Reconstructed temporal intensity profile of a 1.27 ps pulse along with its retrieved temporal phase acquired through a PM-FROG measurement performed on a liquid sheet as plasma mirror substrate. (b) Plot showing the measured spectrum and the retrieved spectral phase of the pulse.
Our analysis procedure assumes that the stretched pulse duration significantly exceeds the time scale of plasma mirror formation. This assumption allowed us to neglect small phase shifts that may be caused by the convolution of the laser pulse’s temporal waveform with the temporal variation in the complex transmission coefficient of the plasma mirror.
3. Results and Discussion
3.1. Validation of the Pulse Duration and GDD Retrieval Method
Several measurements were conducted using long pulses with durations around 8 ps using the glass slide as substrate for the plasma mirror. A range of GDD values were introduced using the AOPDF, resulting in pulses with different properties. Their duration and spectral phase were then retrieved, enabling a comparison between the relative dispersion added through the AOPDF and the differences in the absolute second-order dispersion values obtained via the PM-FROG method.
Figure 6a shows a comparison between the added dispersion from the AOPDF and the relative change in the retrieved GDD when using the glass slide. The measured GDD differences deviate from the applied GDD changes with a RMS relative error of 6.2%. Furthermore, Figure 6b compares the retrieved pulse duration values with the theoretically expected pulse durations, which were calculated from the Fourier-limited pulse corresponding to the reference spectrum, using the formula from ref. [34]. The measurements have a 1% RMS deviation from the theoretically expected values, which confirms the successful implementation of the PM-FROG method.
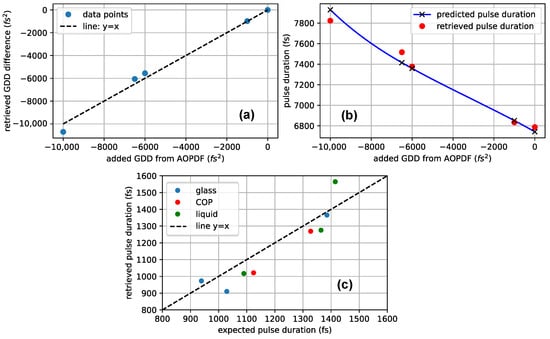
Figure 6.
(a) Comparison between the added dispersion from the AOPDF and the relative change in the retrieved GDD from measurements performed using the glass slide. The point at (0, 0) is chosen as reference by subtracting the absolute value introduced by the AOPDF from the x axis and the absolute retrieved GDD from the y axis. All the points are plotted relative to this point to show the accuracy of the measurement. (b) Retrieved pulse duration values compared to the theoretically expected pulse durations, calculated from the Fourier-limited pulse of the reference spectrum and the retrieved GDD value from measurements performed using the glass slide. (c) Results of pulse duration measurements after stretching the pulses to approximately 1 ps with the AOPDF compared to their expected pulse duration calculated from the retrieved GDD values and the Fourier limited pulse duration of the measured spectrum.
Figure 6c shows pulse duration measurements conducted on pulses stretched from their Fourier limit to approximately 1 ps using the AOPDF. These measurements were performed for three substrate types: glass, cyclo-olefin polymer (COP), and liquid water. To account for variations in experimental conditions, such as day to day spectrum variability and spectral drift between different scans taken on the same day, the Fourier-limited pulse duration used as a reference for theoretical calculations was determined by averaging the first 40 full spectra recorded at the beginning of the scans. The plot displays the retrieved pulse duration, as determined through reconstruction, against the theoretical pulse duration predicted based on the retrieved group delay dispersion (GDD) and Fourier-limited pulse duration. The data show a 7.5% RMS deviation from the expected values. The larger relative error for 1 ps pulses, compared to 8 ps pulses, was likely caused by the spectral noise introduced by the substrate material, and it is discussed in the next subsection.
3.2. Substrate Material Comparison for Reconstruction of 1 ps Pulses
As pulse duration was reduced to approximately 1 ps, significant issues with data quality began to emerge, contrasting with the reliable data collected for longer pulses around 8 ps. The setup used at 8 ps became ineffective at 1 ps due to an enhanced spectral noise, introduced most probably by the onset of self-phase modulation (SPM) within the microscope slide. Figure 7 illustrates this additional noise. The first row of graphs shows the mean spectrum and its standard deviation recorded before the interaction with the substratefor one measurement. The three substrates were tested on different days of the experimental campaign, and the spectra of the HPLS pulse were significantly different, but the spectra remained relatively stable within one measurement. The second row shows the average spectra recorded after the pulse passed through the three targets for the same measurements as in the first row. While the spectra of the incoming pulses were relatively stable, the spectra recorded after the interaction with the high-repetition targets became noisier, and for the glass slide, new spectral components appeared in the blue part of the spectrum. The emergence of spectral components towards the blue part of the spectrum indicates spectral broadening, which is typically caused by self-phase modulation (SPM). SPM is a nonlinear optical effect where the refractive index of a material changes in response to the intensity of the light passing through it. This change in refractive index leads to a frequency shift of different parts of the pulse, resulting in spectral broadening. This effect becomes significant when thicker substrates are used [35]. Reducing the intensity of the pulse being characterized could mitigate noise resulting from nonlinear effects; however, this approach would also decrease the signal-to-noise ratio of the recorded spectra, rendering them unusable for temporal characterization.
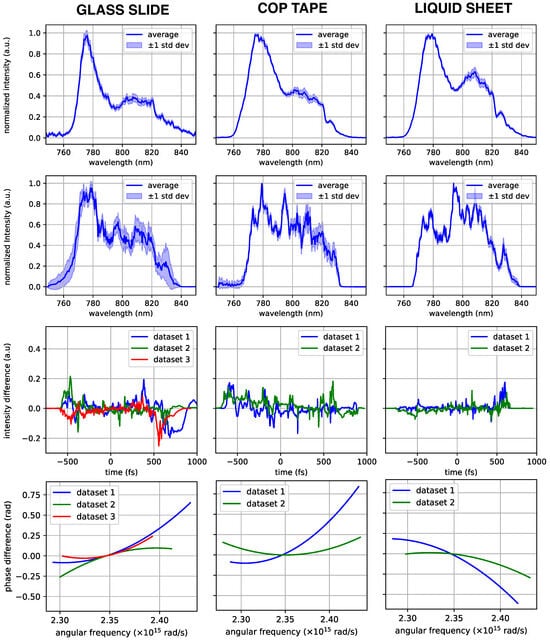
Figure 7.
Row 1: mean spectrum and standard deviation recorded at the output of the laser amplifiers before interaction with the substrates. Row 2: average spectrum and standard deviation recorded during measurements with three substrates—glass, cyclo-olefin polymer (COP), and liquid—on different days. Significant spectral broadening in the blue region is observed for the glass substrate, attributed to self-phase modulation (SPM). Row 3: differences in temporal intensity between odd- and even-numbered subsets of the recorded spectra. The liquid substrate shows the smallest differences, indicating reduced noise and higher precision in temporal intensity reconstruction. Each data set corresponds to a different measurement taken on the same day using the same substrate. Row 4: differences in spectral phase between odd- and even-numbered subsets, showing minimal variation across the three substrates.
The spectrum of the input pulse drifted slightly from measurement to measurement. To assess the precision of the reconstruction of the pulse temporal intensity and spectral phase, we sampled from the same measurement two distinct data sets that had a negligible drift relative to each other. Specifically, the recorded data from each measurement were divided into two subsets: one comprising odd-numbered spectra and the other comprising even-numbered spectra. The differences in spectral phase and intensity between these subsets were then calculated and plotted for each measurement and material, as shown in the third and fourth rows of Figure 7. The results show that the temporal intensity differences were significantly smaller for the liquid substrate, indicating reduced noise and higher precision in the measurements. In contrast, the differences in the retrieved spectral phase exhibit minimal variation across the three substrates, suggesting that the substrate material has a limited influence on the accuracy of the spectral phase reconstruction.
3.3. Advantages of Liquid Sheet Approach
The liquid sheet consistently provided less noisy and more reliable data for 1 ps pulses than the glass and COP targets. This suggests that the reduced thickness of the pellicle-in the micrometer scale-minimizes nonlinear effects, making it a more suitable choice for pulse measurements in the picosecond range.
All targets were optically aligned such that the compressed beam was focused on the front surface of the target. Since the plasma mirror forms on the front surface of the target, the optical delay was not influenced by the target’s overall thickness. A delay offset is caused by propagation of the transmitted part of the probe pulse through the material, but this is common to all measurements and does not influence the measurements.
In addition, the mechanical stability of the three target types was assessed by monitoring the displacement of the front surface in the direction of the beam. The pump beam impinges on the substrate at an angle of 8° from the probe which is normal to the substrate. Consequently, spatial drifts in and out of the focal plane can be translated into temporal noise in the measurement, calculated as
where is the spatial displacement and c is the speed of light. The liquid sheet displacements had a standard deviation of less than 1 µm while the microscope slide and COP drifted from the focal plane by 2 µm and 22 µm, respectively. The largest drift corresponds to <1 fs noise introduced in the temporal retrieval, hence the influence of the target displacements on the measurement is expected to be negligible.
4. Conclusions
In this work, a non-iterative PM-FROG method was demonstrated as an effective approach for temporal characterization of near-infrared pulses with durations ranging from 1 to 8 ps. This approach simplifies the phase-retrieval process by eliminating the need for iterative algorithms, enhancing robustness.
The method was validated by analyzing group delay dispersion (GDD) variations using pulses extended to 8 ps, with tunable dispersion added through stretcher adjustments and AOPDF settings. The PM-FROG measurements successfully reconstructed the second-order phase distortions induced by the AOPDF with an RMS error of 6.2%. The measured pulse durations had a RMS deviation of 1% for pulses in the range of 6.8–7.8 ps and up to 7.5% for shorter pulses near 1 ps. These results confirm the accuracy and reliability of the method for characterizing chirped picosecond pulses far from the Fourier limit. This method is not suitable for pulses near the Fourier limit: femtosecond pulses would be too short relative to the plasma formation time, while picosecond pulses would have a bandwidth too narrow for sampling with a plasma mirror. Also, our method can only be applied to chirped pulses, which encode time delay information in the spectral domain.
The liquid target provided the most consistent and reliable pulse reconstructions and had the smallest spectral distortions and the best mechanical stability. The pulse reconstructions from the glass and COP substrates had higher variability due to nonlinear effects induced by their material properties and thickness, such as self-phase modulation. The thin liquid sheet, created by two impinging micrometer-scale jets, can also sustain longer-duration experiments using a large liquid reservoir. These advantages make the liquid sheet particularly suitable for high-repetition-rate experiments at high-intensity laser facilities.
Author Contributions
Conceptualization, D.U.; methodology, Ș.P.; software, Ș.P.; validation, Ș.P.; formal analysis, Ș.P.; investigation, Ș.P., A.N., A.-M.L., D.G.M., A.D., C.A., C.A.S., D.U.; resources, I.D., D.U., C.A.S.; data curation, Ș.P., A.N., A.-M.L.; writing—original draft preparation, Ș.P., C.A.S., D.U.; writing—review and editing, Ș.P., D.G.M., C.A.S., D.U.; visualization, Ș.P.; supervision, D.U.; project administration, D.U.; funding acquisition, I.D., D.U. All authors have read and agreed to the published version of the manuscript.
Funding
The operation of ELI-NP is financed by the Romanian Ministry for Research, Innovation and Digitalization through the ELI-NP IOSIN program and the Nucleu program PN 23 21 01 05. This work was supported by ELI-RO/2023/LASCOMB, funded by the Institute of Atomic Physics, Romania and by the European Union’s Horizon 2020 Framework Programme under grant agreement number 871161 (IMPULSE). S.P., A.D., C.A. and D.U. acknowledge support from ELI-RO/DFG/2023_001 ARNPhot, funded by the Institute of Atomic Physics, Romania. C.A.S. acknowledges support from the Executive Agency for Higher Education, Research, Development and Innovation (UEFISCDI) under PN-IV-2.2 MCD-2023-0045, Mobilities Program. The building of ELI-NP was funded by the Romanian Government and the European Union through the European Regional Development Fund and the Competitiveness Operational Programme (1/07.07.2016, COP, ID 1334), as part of the Extreme Light Infrastructure—Nuclear Physics (ELI-NP) Phase II project.
Institutional Review Board Statement
Not applicable.
Informed Consent Statement
Not applicable.
Data Availability Statement
Data underlying the results presented in this paper may be obtained from the authors upon reasonable request.
Acknowledgments
The authors thank Elena Stroici, Daniel Popa, Thales LAS, and ELI-NP laser operating teams for technical assistance.
Conflicts of Interest
The authors declare no conflicts of interest.
Abbreviations
The following abbreviations are used in this manuscript:
| FROG | frequency-resolved optical gating |
| PM-FROG | plasma mirror–frequency resolved optical gating |
| VUV | vacuum ultraviolet |
| AOPDF | acousto-optic programmable dispersive filter |
| COP | cyclic olefin polymer |
| GDD | group delay dispersion |
| SPM | self-phase modulation |
References
- Weingarten, K. High Energy Picosecond Lasers: Ready for Prime Time. Laser Tech. J. 2009, 6, 51–54. [Google Scholar] [CrossRef]
- Stankevič, V.; Čermák, A.; Mikalauskas, S.; Kožmín, P.; Indrišiūnas, S.; Račiukaitis, G. Processing of ultra-hard materials with picosecond pulses: From research work to industrial applications. J. Laser Appl. 2018, 30, 032202. [Google Scholar] [CrossRef]
- Torbeck, R.L.; Schilling, L.; Khorasani, H.; Dover, J.S.; Arndt, K.A.; Saedi, N. Evolution of the Picosecond Laser: A Review of Literature. Dermatol. Surg. 2019, 45, 183. [Google Scholar] [CrossRef]
- Forbat, E.; Al-Niaimi, F. The use of picosecond lasers beyond tattoos. J. Cosmet. Laser Ther. 2016, 18, 345–347. [Google Scholar] [CrossRef] [PubMed]
- Rasskazov, G.; Lozovoy, V.V.; Dantus, M. Spectral amplitude and phase noise characterization of titanium-sapphire lasers. Opt. Express 2015, 23, 23597–23602. [Google Scholar] [CrossRef]
- Kohrell, F.; Barber, S.; Jensen, K.; Doss, C.; Berger, C.; Schroeder, C.; Esarey, E.; Grüner, F.; van Tilborg, J. Investigation of correlations between spectral phase fluctuations of the laser pulse and the performance of an LPA. In Nuclear Instruments and Methods in Physics Research Section A: Accelerators, Spectrometers, Detectors and Associated Equipment; Elsevier: Amsterdam, The Netherlands, 2025; p. 170267. [Google Scholar]
- Schelev, M.Y.; Richardson, M.C.; Alcock, A.J. Image converter streak camera with picosecond resolution. Appl. Phys. Lett. 1971, 18, 354–357. [Google Scholar] [CrossRef]
- Foster, M.A.; Salem, R.; Geraghty, D.F.; Turner-Foster, A.C.; Lipson, M.; Gaeta, A.L. Silicon-chip-based ultrafast optical oscilloscope. Nature 2008, 456, 81–84. [Google Scholar] [CrossRef]
- Broaddus, D.H.; Foster, M.A.; Kuzucu, O.; Turner-Foster, A.C.; Koch, K.W.; Lipson, M.; Gaeta, A.L. Temporal-imaging system with simple external-clock triggering. Opt. Express 2010, 18, 14262–14269. [Google Scholar] [CrossRef]
- Koepfli, S.M.; Baumann, M.; Koyaz, Y.; Gadola, R.; Güngör, A.; Keller, K.; Horst, Y.; Nashashibi, S.; Schwanninger, R.; Doderer, M.; et al. Metamaterial graphene photodetector with bandwidth exceeding 500 gigahertz. Science 2023, 380, 1169–1174. [Google Scholar] [CrossRef]
- Froehly, C.; Lacourt, A.; Viénot, J.C. Time impulse response and time frequency response of optical pupils.:Experimental confirmations and applications. Nouv. Rev. D’Optique 1973, 4, 183. [Google Scholar] [CrossRef]
- Bowlan, P.; Gabolde, P.; Shreenath, A.; McGresham, K.; Trebino, R.; Akturk, S. Crossed-beam spectral interferometry: A simple, high-spectral-resolution method for completely characterizing complex ultrashort pulses in real time. Opt. Express 2006, 14, 11892–11900. [Google Scholar] [CrossRef] [PubMed]
- Cohen, J.; Bowlan, P.; Chauhan, V.; Trebino, R. Measuring temporally complex ultrashort pulses using multiple-delay crossed-beam spectral interferometry. Opt. Express 2010, 18, 6583–6597. [Google Scholar] [CrossRef] [PubMed]
- Cohen, J.; Lee, D.; Chauhan, V.; Vaughan, P.; Trebino, R. Highly simplified device for measuring the intensity and phase of picosecond pulses. Opt. Express 2010, 18, 17484–17497. [Google Scholar] [CrossRef]
- Gabolde, P.; Trebino, R. Single-shot measurement of the full spatio-temporal field of ultrashort pulses with multi-spectral digital holography. Opt. Express 2006, 14, 11460–11467. [Google Scholar] [CrossRef]
- Trebino, R.; Jafari, R.; Akturk, S.A.; Bowlan, P.; Guang, Z.; Zhu, P.; Escoto, E.; Steinmeyer, G. Highly reliable measurement of ultrashort laser pulses. J. Appl. Phys. 2020, 128, 171103. [Google Scholar] [CrossRef]
- Gao, G.; Shen, Y.; Deng, D.; Meng, Y.; He, L.; Gong, M.; Zhang, H. Chirp-coefficient bisection iteration method for phase-intensity reconstruction of chirped pulses. Opt. Rev. 2018, 25, 598–607. [Google Scholar] [CrossRef]
- Ungureanu, R.G.; Cojocaru, G.V.; Banici, R.A.; Ursescu, D. Phase measurement in long chirped pulses with spectral phase jumps. Opt. Express 2014, 22, 15918. [Google Scholar] [CrossRef] [PubMed]
- Michelmann, K.; Wagner, U.; Feurer, T.; Teubner, U.; Förster, E.; Sauerbrey, R. Measurement of the Page function of an ultrashort laser pulse. Opt. Commun. 2001, 198, 163–170. [Google Scholar] [CrossRef]
- Itakura, R.; Kumada, T.; Nakano, M.; Akagi, H. Frequency-resolved optical gating for characterization of VUV pulses using ultrafast plasma mirror switching. Opt. Express 2015, 23, 10914–10924. [Google Scholar] [CrossRef]
- Itakura, R.; Kumada, T.; Nakano, M.; Akagi, H. Plasma-mirror frequency-resolved optical gating for simultaneous retrieval of a chirped vacuum-ultraviolet waveform and time-dependent reflectivity. High Power Laser Sci. Eng. 2016, 4, e18. [Google Scholar] [CrossRef]
- Itakura, R.; Akagi, H.; Otobe, T. Characterization of 20-fs VUV pulses by plasma-mirror frequency-resolved optical gating. Opt. Lett. 2019, 44, 2282–2285. [Google Scholar] [CrossRef]
- Endo, T.; Tsubouchi, M.; Itakura, R. Plasma-mirror frequency-resolved optical gating using a liquid-sheet jet in ultraviolet region. Opt. Lett. 2019, 44, 3234–3237. [Google Scholar] [CrossRef] [PubMed]
- Leblanc, A.; Lassonde, P.; Petit, S.; Delagnes, J.C.; Haddad, E.; Ernotte, G.; Bionta, M.; Gruson, V.; Schmidt, B.; Ibrahim, H.; et al. Phase-matching-free pulse retrieval based on transient absorption in solids. Opt. Express 2019, 27, 28998–29015. [Google Scholar] [CrossRef]
- Longa, A.; Kumar, M.; Lassonde, P.; Ibrahim, H.; Legare, F.; Leblanc, A. Spectral phase sensitivity of frequency resolved optical switching for broadband IR pulse characterization. Opt. Express 2022, 30, 7968–7975. [Google Scholar] [CrossRef] [PubMed]
- Bhalavi, R.K.; Bejot, P.; Leblanc, A.; Dubrouil, A.; Billard, F.; Faucher, O.; Hertz, E. Phase-matching-free ultrashort laser pulse characterization from a transient plasma lens. Opt. Lett. 2024, 49, 1321–1324. [Google Scholar] [CrossRef] [PubMed]
- Béjot, P.; Kumar Bhalavi, R.; Leblanc, A.; Dubrouil, A.; Billard, F.; Faucher, O.; Hertz, E. Temporal Characterization of Laser Pulses Using an Air-Based Knife-Edge Technique. Adv. Photonics Res. 2025, 6, 2400074. [Google Scholar] [CrossRef]
- Geib, N.C.; Zilk, M.; Pertsch, T.; Eilenberger, F. Common pulse retrieval algorithm: A fast and universal method to retrieve ultrashort pulses. Optica 2019, 6, 495–505. [Google Scholar] [CrossRef]
- Lureau, F.; Matras, G.; Chalus, O.; Derycke, C.; Morbieu, T.; Radier, C.; Casagrande, O.; Laux, S.; Ricaud, S.; Rey, G.; et al. High-energy hybrid femtosecond laser system demonstrating 2 × 10 PW capability. High Power Laser Sci. Eng. 2020, 8, e43. [Google Scholar] [CrossRef]
- Radier, C.; Chalus, O.; Charbonneau, M.; Thambirajah, S.; Deschamps, G.; David, S.; Barbe, J.; Etter, E.; Matras, G.; Ricaud, S.; et al. 10 PW peak power femtosecond laser pulses at ELI-NP. High Power Laser Sci. Eng. 2022, 10, e21. [Google Scholar] [CrossRef]
- Verluise, F.; Laude, V.; Cheng, Z.; Spielmann, C.; Tournois, P. Amplitude and phase control of ultrashort pulses by use of an acousto-optic programmable dispersive filter: Pulse compression and shaping. Opt. Lett. 2000, 25, 575–577. [Google Scholar] [CrossRef]
- Nazîru, A.B.; Popa, Ş.; Lupu, A.M.; Matei, D.G.; Dumitru, A.; Nistor, D.; Toma, A.; Văsescu, L.; Dăncuş, I.; Stan, C.A.; et al. Drift-free, 11 fs pulse delay stability in dual-arm PW-class laser systems. High Power Laser Sci. Eng. 2024, 12, e64. [Google Scholar] [CrossRef]
- Wheeler, J.; Bleotu, G.P.; Naziru, A.; Fabbri, R.; Masruri, M.; Secareanu, R.; Farinella, D.M.; Cojocaru, G.; Ungureanu, R.; Baynard, E.; et al. Compressing High Energy Lasers through Optical Polymer Films. Photonics 2022, 9, 715. [Google Scholar] [CrossRef]
- Syed, R.; Uiterwaal, C.J. Ultrafast pulse duration measurement method of near-infrared pulses for a broad range of wavelengths using two-photon absorption in a liquid and fluorescent dye solution. Rev. Sci. Instrum. 2023, 94, 103006. [Google Scholar] [CrossRef] [PubMed]
- Fisher, R.A.; Kelley, P.; Gustafson, T. Subpicosecond pulse generation using the optical Kerr effect. Appl. Phys. Lett. 1969, 14, 140–143. [Google Scholar] [CrossRef]
Disclaimer/Publisher’s Note: The statements, opinions and data contained in all publications are solely those of the individual author(s) and contributor(s) and not of MDPI and/or the editor(s). MDPI and/or the editor(s) disclaim responsibility for any injury to people or property resulting from any ideas, methods, instructions or products referred to in the content. |
© 2025 by the authors. Licensee MDPI, Basel, Switzerland. This article is an open access article distributed under the terms and conditions of the Creative Commons Attribution (CC BY) license (https://creativecommons.org/licenses/by/4.0/).