Article

Intelligent Resource Allocation for Immersive VoD Multimedia in NG-EPON and B5G Converged Access Networks

by
Razat Kharga
1,
AliAkbar Nikoukar
2,* and
I-Shyan Hwang
1,*
1
Department of Computer Science and Engineering, Yuan Ze University, Taoyuan City 32003, Taiwan
2
Department of Mathematics, College of Science, Yasouj University, Yasouj 75918-74831, Iran
*
Authors to whom correspondence should be addressed.
Photonics 2025, 12(6), 528; https://doi.org/10.3390/photonics12060528
Submission received: 10 April 2025 / Revised: 17 May 2025 / Accepted: 21 May 2025 / Published: 22 May 2025
(This article belongs to the Section Optical Communication and Network)

Abstract

:
Immersive content streaming services are becoming increasingly popular on video on demand (VoD) platforms due to the growing interest in extended reality (XR) and spatial experiences. Unlike traditional VoD, immersive VoD (IVoD) offers more engaging and interactive content beyond conventional 2D video. IVoD requires substantial bandwidth and minimal latency to deliver its interactive XR experiences. This research examines intelligent resource allocation for IVoD services across NG-EPON and B5G X-haul converged networks. A proposed software-defined networking (SDN) framework employs artificial neural networks (ANN) with a backpropagation technique to predict bandwidth control based on traffic patterns and network conditions. The new immersive video storage, field-programmable gate array (FPGA), Queue Manager, and logical layer components are added to the existing OLT and ONU hardware architecture to implement the SDN framework. The SDN framework manages the entire network, predicts bandwidth requirements, and operates the immersive media dynamic bandwidth allocation (IMS-DBA) algorithm to efficiently allocate bandwidth to IVoD network traffic, ensuring that QoS metrics are met for IM services. Simulation results demonstrate that the proposed framework significantly enhances mean packet delay by up to 3% and improves packet drop probability by up to 4% as the traffic load varies from light to high across different scenarios, leading to enhanced overall QoS performance.

1. Introduction

The rapidly evolving technology in virtual reality (VR), augmented reality (AR), and extended reality (XR) has brought immense development in the multimedia sector, resulting in highly engaging content referred to as ‘immersive multimedia’ or ‘immersive media’ (IM). Moreover, IM technologies represent a transformative paradigm shift in various domains, including human–computer interaction (HCI), information and communication technology (ICT), and society at large, to deliver engaging and interactive user experiences [1]. According to the Brainy Insights report [2], in 2023, the global spatial computing market reached a valuation of USD 108.9 billion. The market is anticipated to expand at a compound annual growth rate (CAGR) of 22.3% from 2024 to 2033, ultimately achieving a value of USD 815.2 billion by 2033. This emerging trend of adopting VR, AR, and XR technologies has significantly impacted video streaming and video on demand (VoD) as the demand for personalized and immersive content continues to grow. Unlike traditional VoD, immersive VoD (IVoD) provides more engaging and interactive dynamic content beyond conventional 2D video. While many VoD and over-the-top (OTT) players are experimenting with this latest streaming technology, several new participants have yet to adopt the most reliable technology to deliver immersive video content. Similar to standard VoD content, IVoD can be uploaded to streaming platforms. The filming technique and the technology employed for access are the key factors that render it immersive, hence the term immersive VoD streaming.
Moreover, the growing demand for ultra-high-quality and user-oriented immersive multimedia services requires robust network infrastructures supporting high data rates, low latency, and seamless connectivity, as supported by the next generation networks (NGNs) [3]. One probable candidate is fixed wireless access (FWA) networks, which aim to offer consistent services through fixed and mobile access methods. The optical access network (OAN) encompasses the wired realm, while 5G and beyond 5G (B5G) radio services support the wireless sector [4]. These two distinct technologies complement each other, as optical access networks offer massive bandwidth but limited mobility, and wireless networks provide mobility but have limited bandwidth. Further, the advent of artificial intelligence (AI) and machine learning (ML) together with the implementation of optical X-haul for 5G and B5G technology, will substantially change network management, optimize resource allocation, and improve immersive multimedia experiences [5].
This research study requires centralized control management that ensures optical and wireless resources are coordinated and optimized, ensuring resources are efficiently allocated to end users, based on service type, user demand, and network conditions. Centralized systems continuously monitor traffic load, bandwidth availability, and latency across multiple nodes in the network through software-defined networking (SDN) platforms. Predictive resource allocation techniques efficiently deliver high-quality immersive video across devices under diverse network conditions to meet immersive content’s high bandwidth and low latency requirements. This is achieved using user internet behavior, historical traffic data, and other network conditions.
The main contribution of this work is the design and implementation of a comprehensive SDN-based intelligent resource allocation framework tailored for converged NG-EPON and B5G X-haul access networks, addressing the stringent requirements of immersive VoD (IVoD) services. The proposed unified architecture introduces an SD-OLT with FPGA and ANN capabilities. These components enable real-time traffic prediction and dynamic bandwidth control. A predictive bandwidth allocation mechanism based on an ANN with a backpropagation learning model is enhanced by a dynamic threshold adjustment scheme that continuously fine-tunes prediction accuracy according to the network feedback. The immersive media service–dynamic bandwidth allocation (IMS-DBA) algorithm is developed to operationalize this model.
The following sections of the paper are organized as outlined below. Section 2 analyzes the literature concerning resource allocation techniques for VoD using various predictive schemes in NG-EPON and B5G Xhaul networks. Section 3 provides a detailed discussion of the system model, encompassing the NGEPON and B5G X-haul deployment framework, the proposed SD-OLT for IVoD storage, and the SD-ONU architecture for traffic classification. Section 4 outlines the research methodologies employed in this study, followed by a description of the proposed ANN-based predicted bandwidth and allocation method in Section 5. Section 6 assesses system performance via simulations, and finally, Section 7 presents a conclusion and probable research studies in the future.

2. Related Works

Numerous studies have been conducted to improve traditional VoD services, specifically on EPON networks [6,7]. This study has also been extended to FWA networks [8,9]. The primary focus of these studies includes improving performance, resource management, and user experience. Immersive videos require a large bandwidth and a low-latency network for content delivery.
Authors in [10] conducted an extensive comparative survey of various algorithms and techniques to enhance latency performance through efficient bandwidth allocation techniques. They further discuss enhancing intelligent bandwidth allocation through AI and ML techniques. Notably, dynamic bandwidth allocation (DBA) algorithms dynamically allocate the upstream transmission window (TW) to the connected optical network unit (ONU) for transmission to reduce the uplink latency. These schemes can be categorized into traditional or predictive schemes. In traditional DBA schemes [11], the central optical line terminal OLT often allocates bandwidth (BWalloc) based on the bandwidth demanded by ONU-BS (BWreq). In predictive DBA schemes [12], the central OLT allocates additional estimated bandwidth (BWpred) on top of BWreq. BWpred reduces uplink latency by transmitting newly received packets without the bandwidth Request and Grant process between the ONU-base station (ONU-BS) and the central OLT.
Numerous studies have been conducted over the years to estimate bandwidth prediction (BWpred) using statistical estimation algorithms, including constant bit rate [13], packet arrival time [14], and a regression model [15] in a hybrid FWA system. However, these techniques, though better than the traditional approach, are restricted due to various factors. Utilizing AI and ML algorithms to enhance system performance in future networks such as NG-EPON & B5G has led to a notable transition in adopting these approaches for intelligently allocating network resources. Various supervised and unsupervised learning algorithms, such as Random Forest, Decision Tree, kNN, Naive Bayes, and R-programming, have been utilized [16] to predict packet delay, which is an essential factor in determining (BWpred). Moreover, the popularity of ANN models for handling complex non-linear patterns in network traffic, along with their improved prediction accuracy and adaptability in dynamic environments, makes them an ideal choice for bandwidth predictive schemes in EPON networks [17,18]. Table 1 shows a comparative overview of studies estimating bandwidth schemes.
Therefore, predictive bandwidth methods utilize historical data and traffic patterns to estimate ONU-BS bandwidth demands. However, both under-prediction and over-prediction of the BWpred estimation are possible. While under-prediction increases packet queuing delay, over-prediction may increase the polling cycle, thereby deteriorating QoS performance. A dynamic threshold adjustment for bandwidth prediction is thus necessary to balance the actual usage of bandwidth (BWreq) with predicted bandwidth demands (BWpred). This research study utilizes a backpropagation ANN technique to fairly adjust the bandwidth demands of the users in the NG-EPON & B5G X-haul access network, supporting QoS metrics for IVoD delivery services.

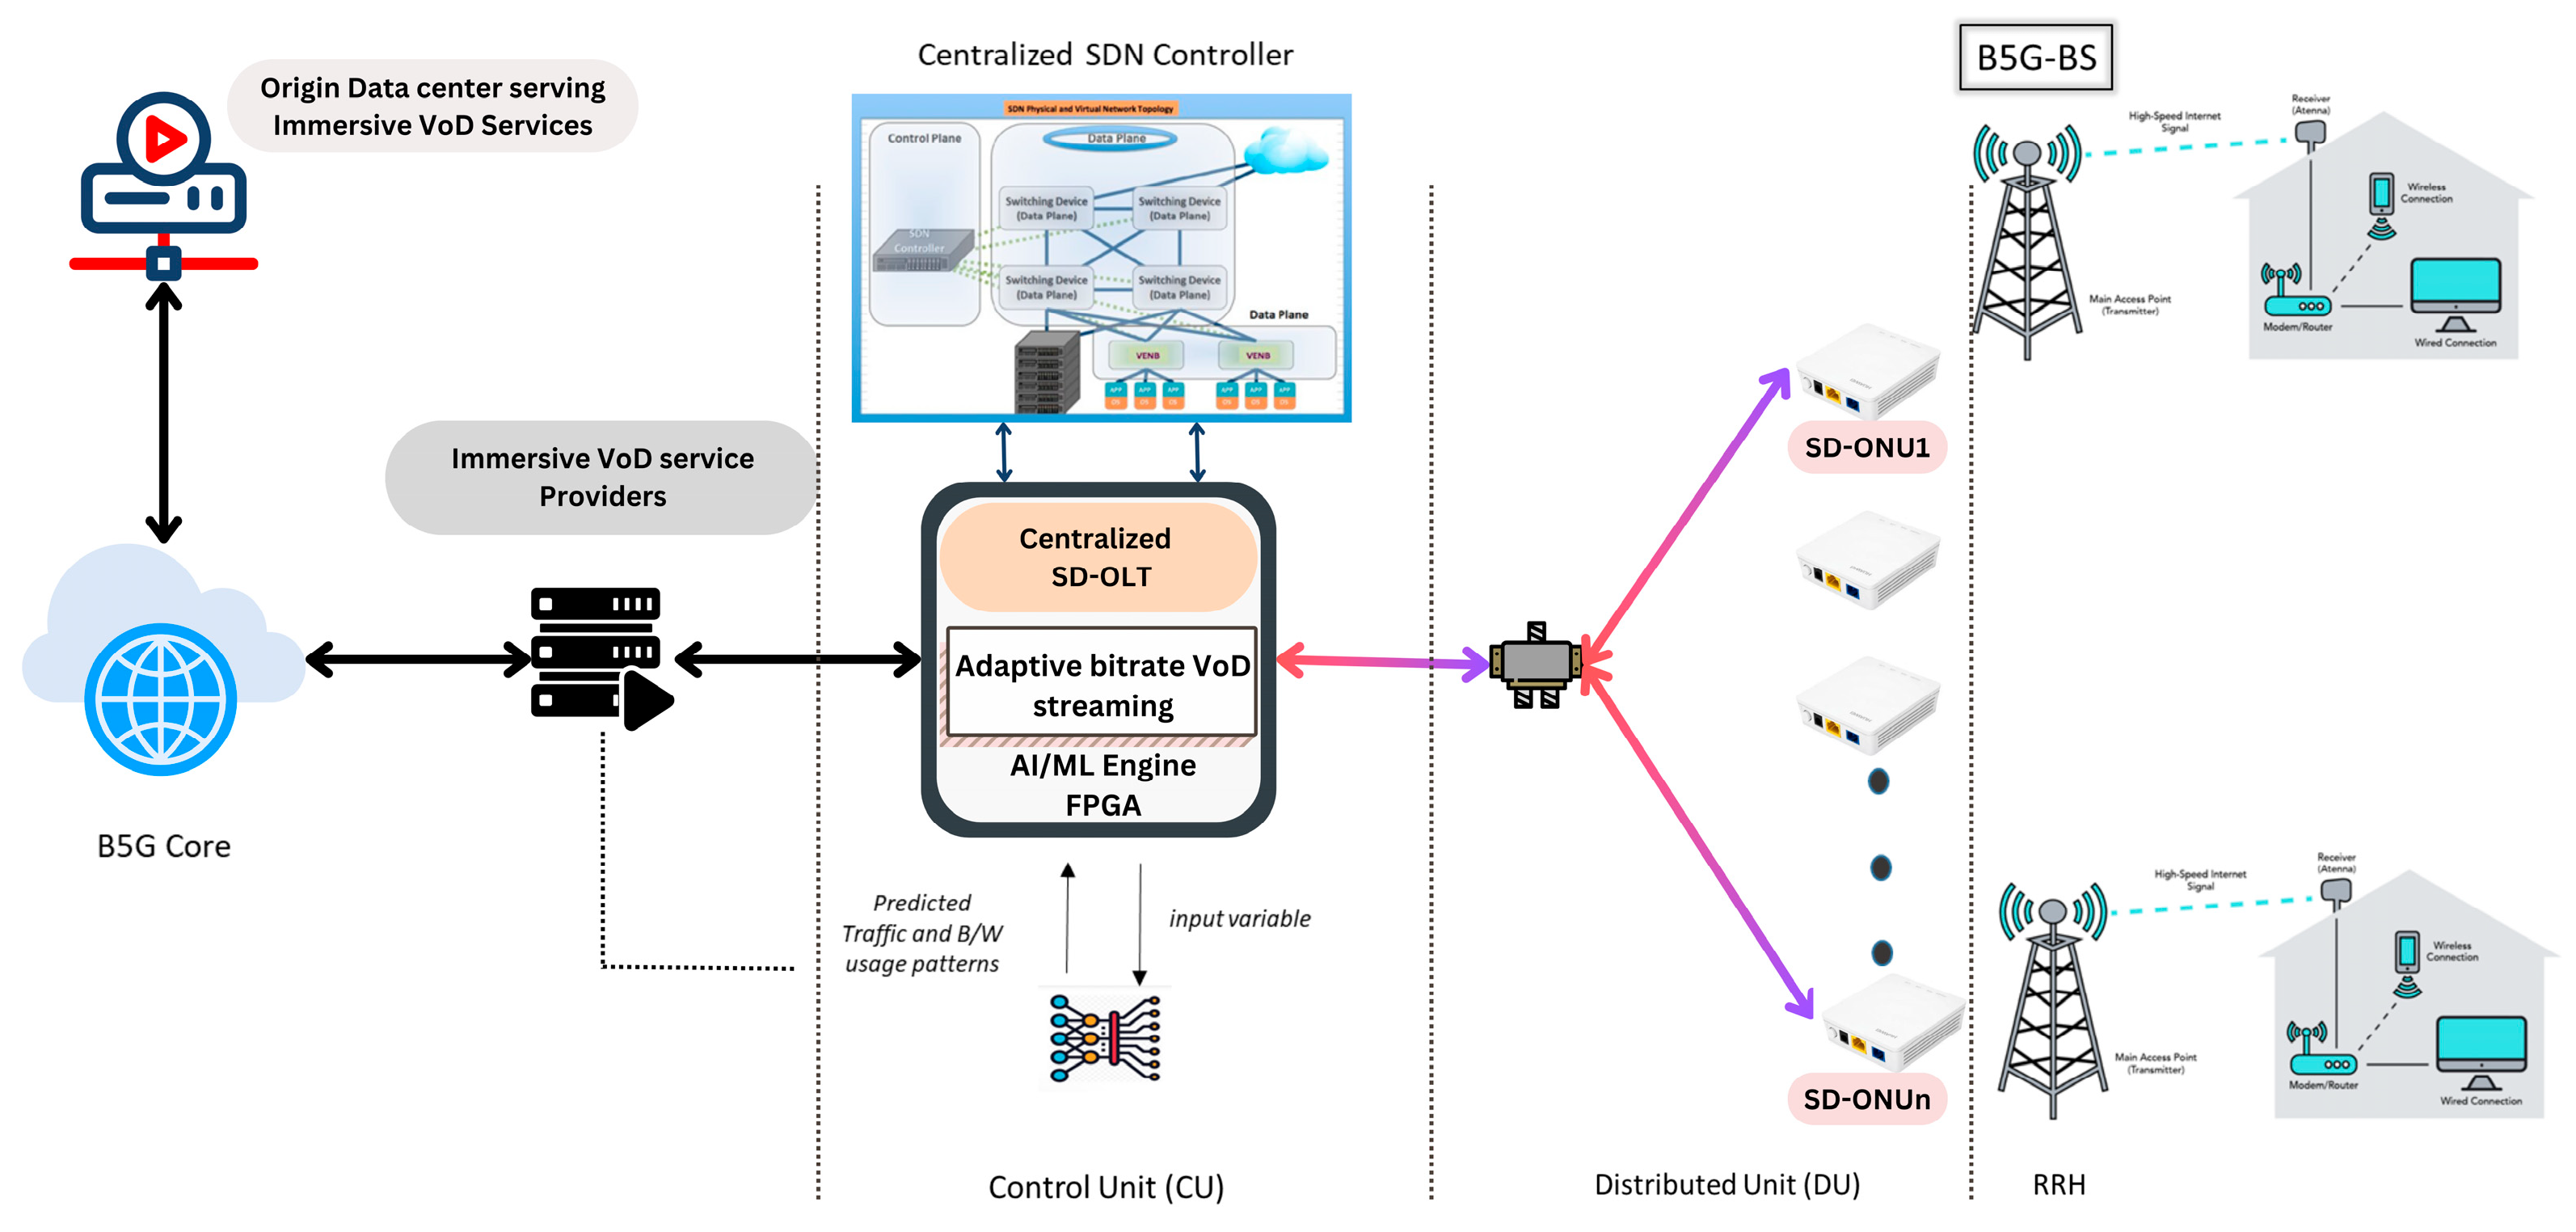
3. Framework for Centralized Storage and Delivery of Immersive VoD

Figure 1 presents a framework for centralized SDN-based intelligent resource allocation in the NG-EPON and B5G X-haul access network. This framework includes an optical backhaul utilizing NG-EPON to support the wireless fronthaul B5G base station (B5G-BS), enabling users to access immersive content. A cloud-based origin data center globally stores IVoD content. An IVoD service platform caches the IVoD content at the software-defined (SD-OLT) storage units (video servers) by replicating the content specific to the end users. This content can be accessed by multiple software-defined (SD-ONU) users using the pull mechanism from these servers. SD-OLT is embedded with AI/ML field-programmable gate array (FPGA) components to assist with training and testing data traffic usage patterns for bandwidth allocation predictions, allowing IVoD service platforms to push/cache video streams, specifically immersive content.
The optical distribution network (ODN) consists of a symmetrical single optical fiber with a capacity of 25 Gbp/s downlink and 10 Gbp/s uplink, linking the central SD-OLT with the SD-ONUs/B5G-BS of the FWA network. Passive optical splitter-combiners (PSCs) distribute the downstream optical signal into multiple output channels linked to the SD-ONUs in the network through a broadcasting technique while aggregating the upstream optical signals into a single path directed back to the SD-OLT utilizing time division multiple access (TDMA).

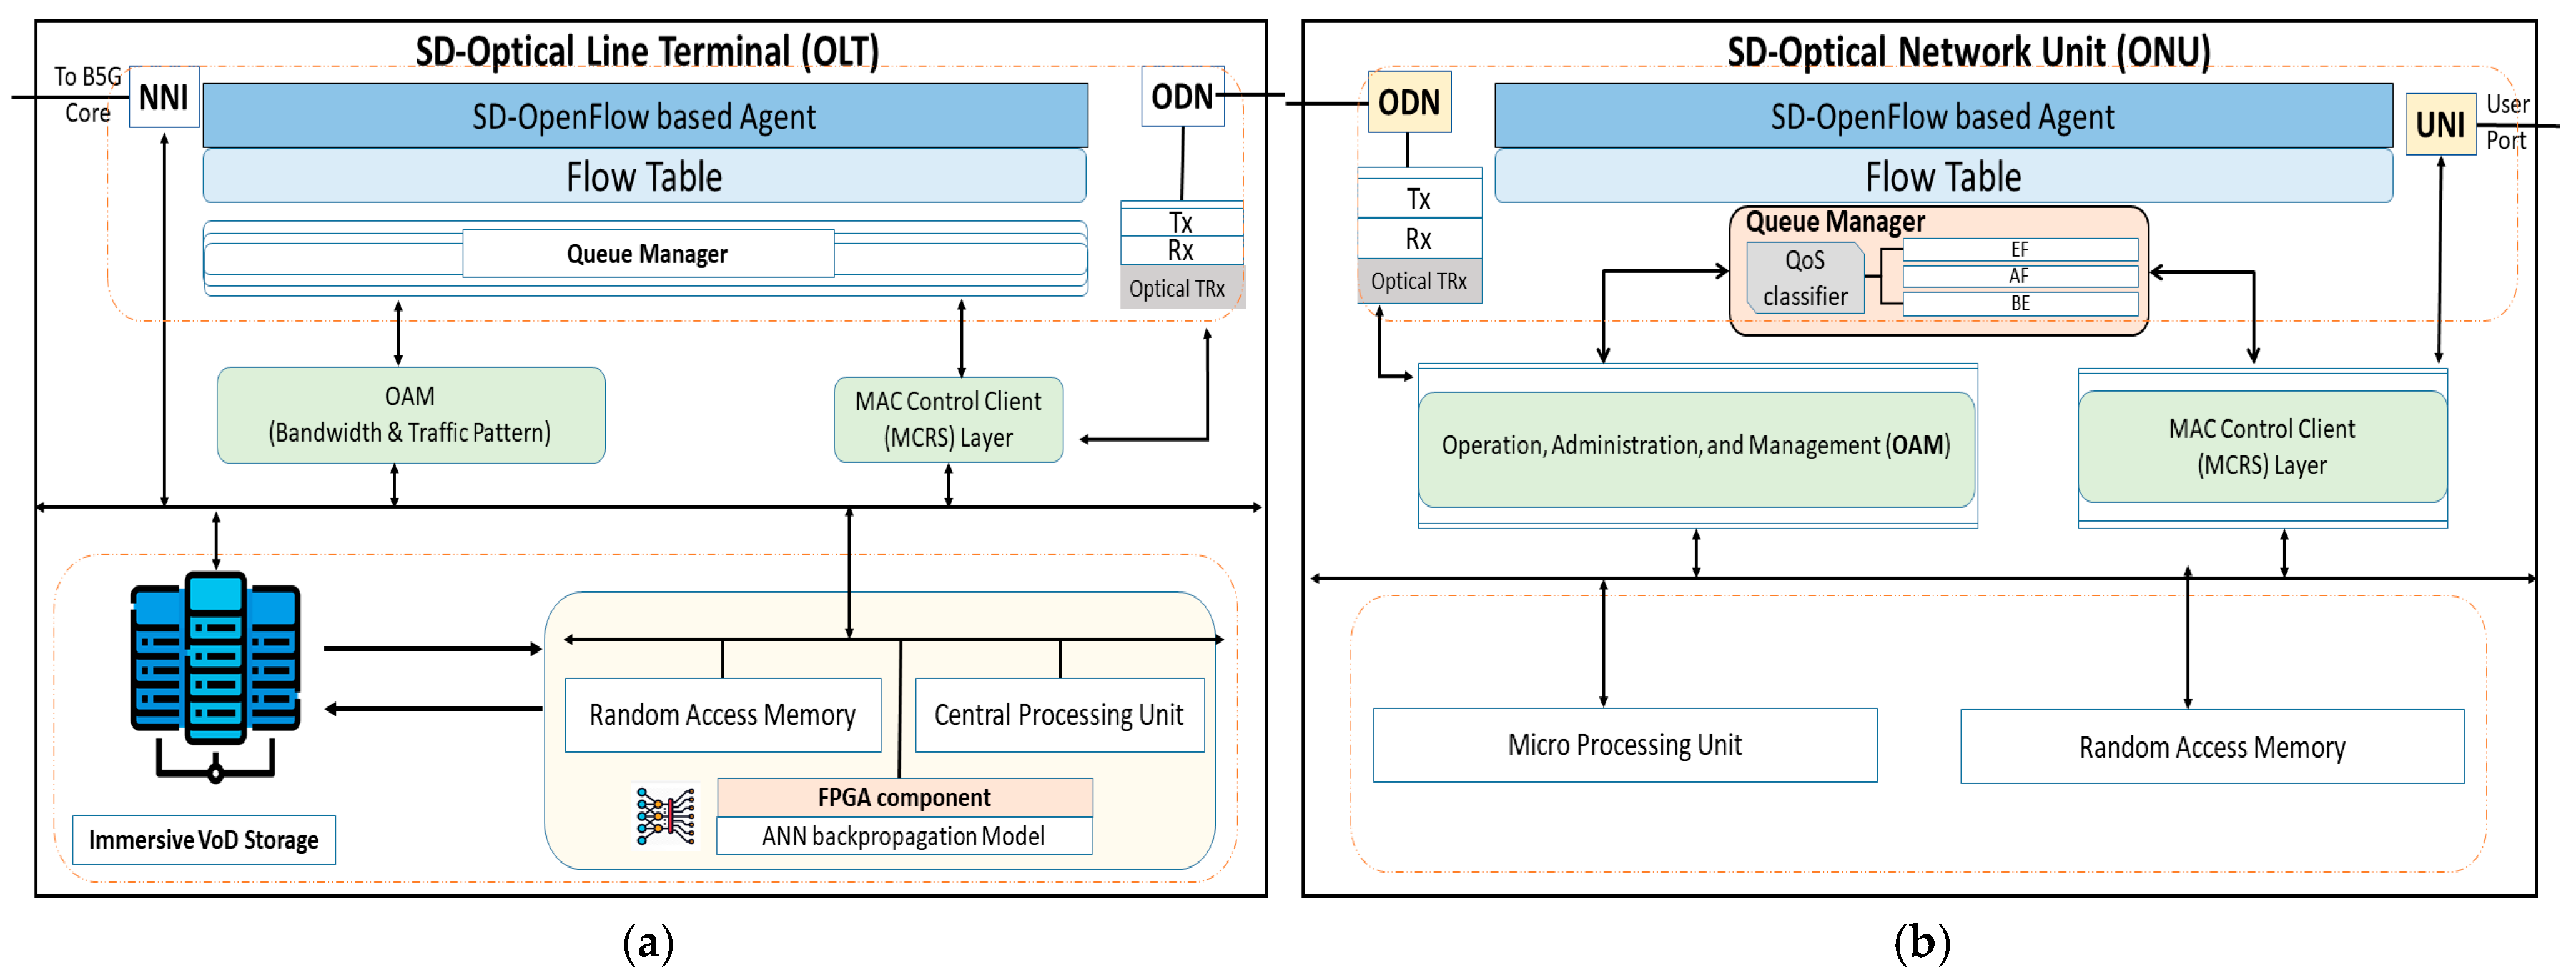
3.1. Enhanced SD-OLT with Immersive VoD Storage

Figure 2a presents the proposed integration of the ANN model within the SD-OLT utilizing the FPGA component. This FPGA component is specifically designed and configured to effectively handle the training and testing of data using the ANN backpropagation model. Additionally, it includes an IVoD storage server mechanism designed for caching immersive video content adapted to predicted traffic patterns and bandwidth utilization. The SD-OLT connects to the B5G core network via the Network-to-Network Interface (NNI). The centralized SD-OLT, utilizing an SDN mechanism, governs all primary network processing within the FWA network. This entity serves as a critical gateway for control and transmission operations. The SD-OLT is the sole downstream device with access to the transmission medium, facilitating arbitration among multiple logical MACs through GATE messages. In the upstream configuration, a single receiver at the SD-OLT is time-shared among multiple SD-ONU transmitters, which combine upstream transmissions onto a single strand of single-mode fiber that utilizes the same physical connection for ODNs. The Multi-Point Control Protocol (MPCP) governs access to the upstream channel. In this configuration, the SD-OLT serves as the master device within the network, whereas the SD-ONUs operate as slave devices.

3.2. SD-ONU Operations for Traffic Classification

Figure 2b illustrates the SD-ONU in conjunction with the Queue Manager, which prioritizes traffic based on expedited forwarding (EF), assured forwarding (AF), including IVoD, and best effort (BE). The ONUs at the user end facilitate connections to the central network, enabling internet access via the User-to-Network (UNI) interface. The capabilities of these SD-ONUs are defined per the most recent IEEE 802.3ca standard [19]. The logical layer manages several network functions, including bandwidth management, access control, and packet management at the user end. The IEEE 802.3ca standard incorporates several specialized functionalities, including the Operations, Administration, and Maintenance (OAM) Client, Media Access Control (MAC) client, Multi-Channel Reconciliation Sublayer (MCRS), and Logical Link Identification (LLID) for connectivity with the SD-OLT situated at the central office. An SD-ONU remains inactive and does not transmit signals until it receives the registration process. Upon detection and registration, a data request is transmitted to the SD-OLT only when authorized. This mitigates technical problems related to unanticipated transmission and noise buildup at the SD-OLT receiver. While the centralized SD-OLT does introduce certain overheads, its benefits, including intelligent traffic control, dynamic bandwidth allocation, and immersive service quality assurance, significantly outweigh the drawbacks; hence, the central office SD-OLT predominantly governs most functions and operations. This study aims to integrate SD-OLT network components with the ANN model to facilitate intelligent networking for bandwidth predictions in the NG-EPON and B5G X-haul access networks.

4. Methodology

4.1. Problem Formulation

By analyzing historical data traffic patterns for predictive bandwidth schemes, ANN can significantly improve DBA in NG-EPON and B5G X-haul access networks. An ANN, through backpropagation, modifies error according to the weights Wij and biases bj using the dynamical threshold adjustment technique between the predicted bandwidth output ŷt and the actual output yt.
Let X t represent the historical data input features representing traffic patterns from SD-ONU REPORTs, QoS metrics, and network metrics such as previously allocated bandwidth collected from the SD-ONU/B5G-BS over time t − 1, as given by Equation (1):
X t = [ y t k , y t k + 1 , , y t 1 ] ,
where k is the sliding window size of the previous time step dataset.
The predicted output bandwidth demand at time t is given by Equation (2):
y ^ t = ʄ ( X t ) ,
where ʄ activation function is learned by the backpropagation ANN.
The task is to minimize the prediction error Ɛ by dynamically adjusting the threshold parameters for each cycle.
In the context of NG-EPON & B5G X-haul access networks supporting IVoD service delivery, the idea is to seamlessly incorporate ANN models for bandwidth prediction, with dynamic threshold adjustments, into the NG-EPON DBA algorithm. Hence, an IM-DBA is proposed specifically to handle these services while fulfilling network QoS parameters.

4.2. ANN Model Workflow

4.2.1. Sliding Window for Feature Preparation

The first task in the problem definition is to construct an input matrix X T , with the sliding window size k corresponding to each row. This value of k is empirically determined based on each cycle time of the historical dataset collected over a time period. Equation (3) below shows X T for model training and testing, with the total number of time steps T:
X T = [ y 1 y 2   y k   y 2 y 3 y k + 1 y T k y T k + 1 y T 1 ]

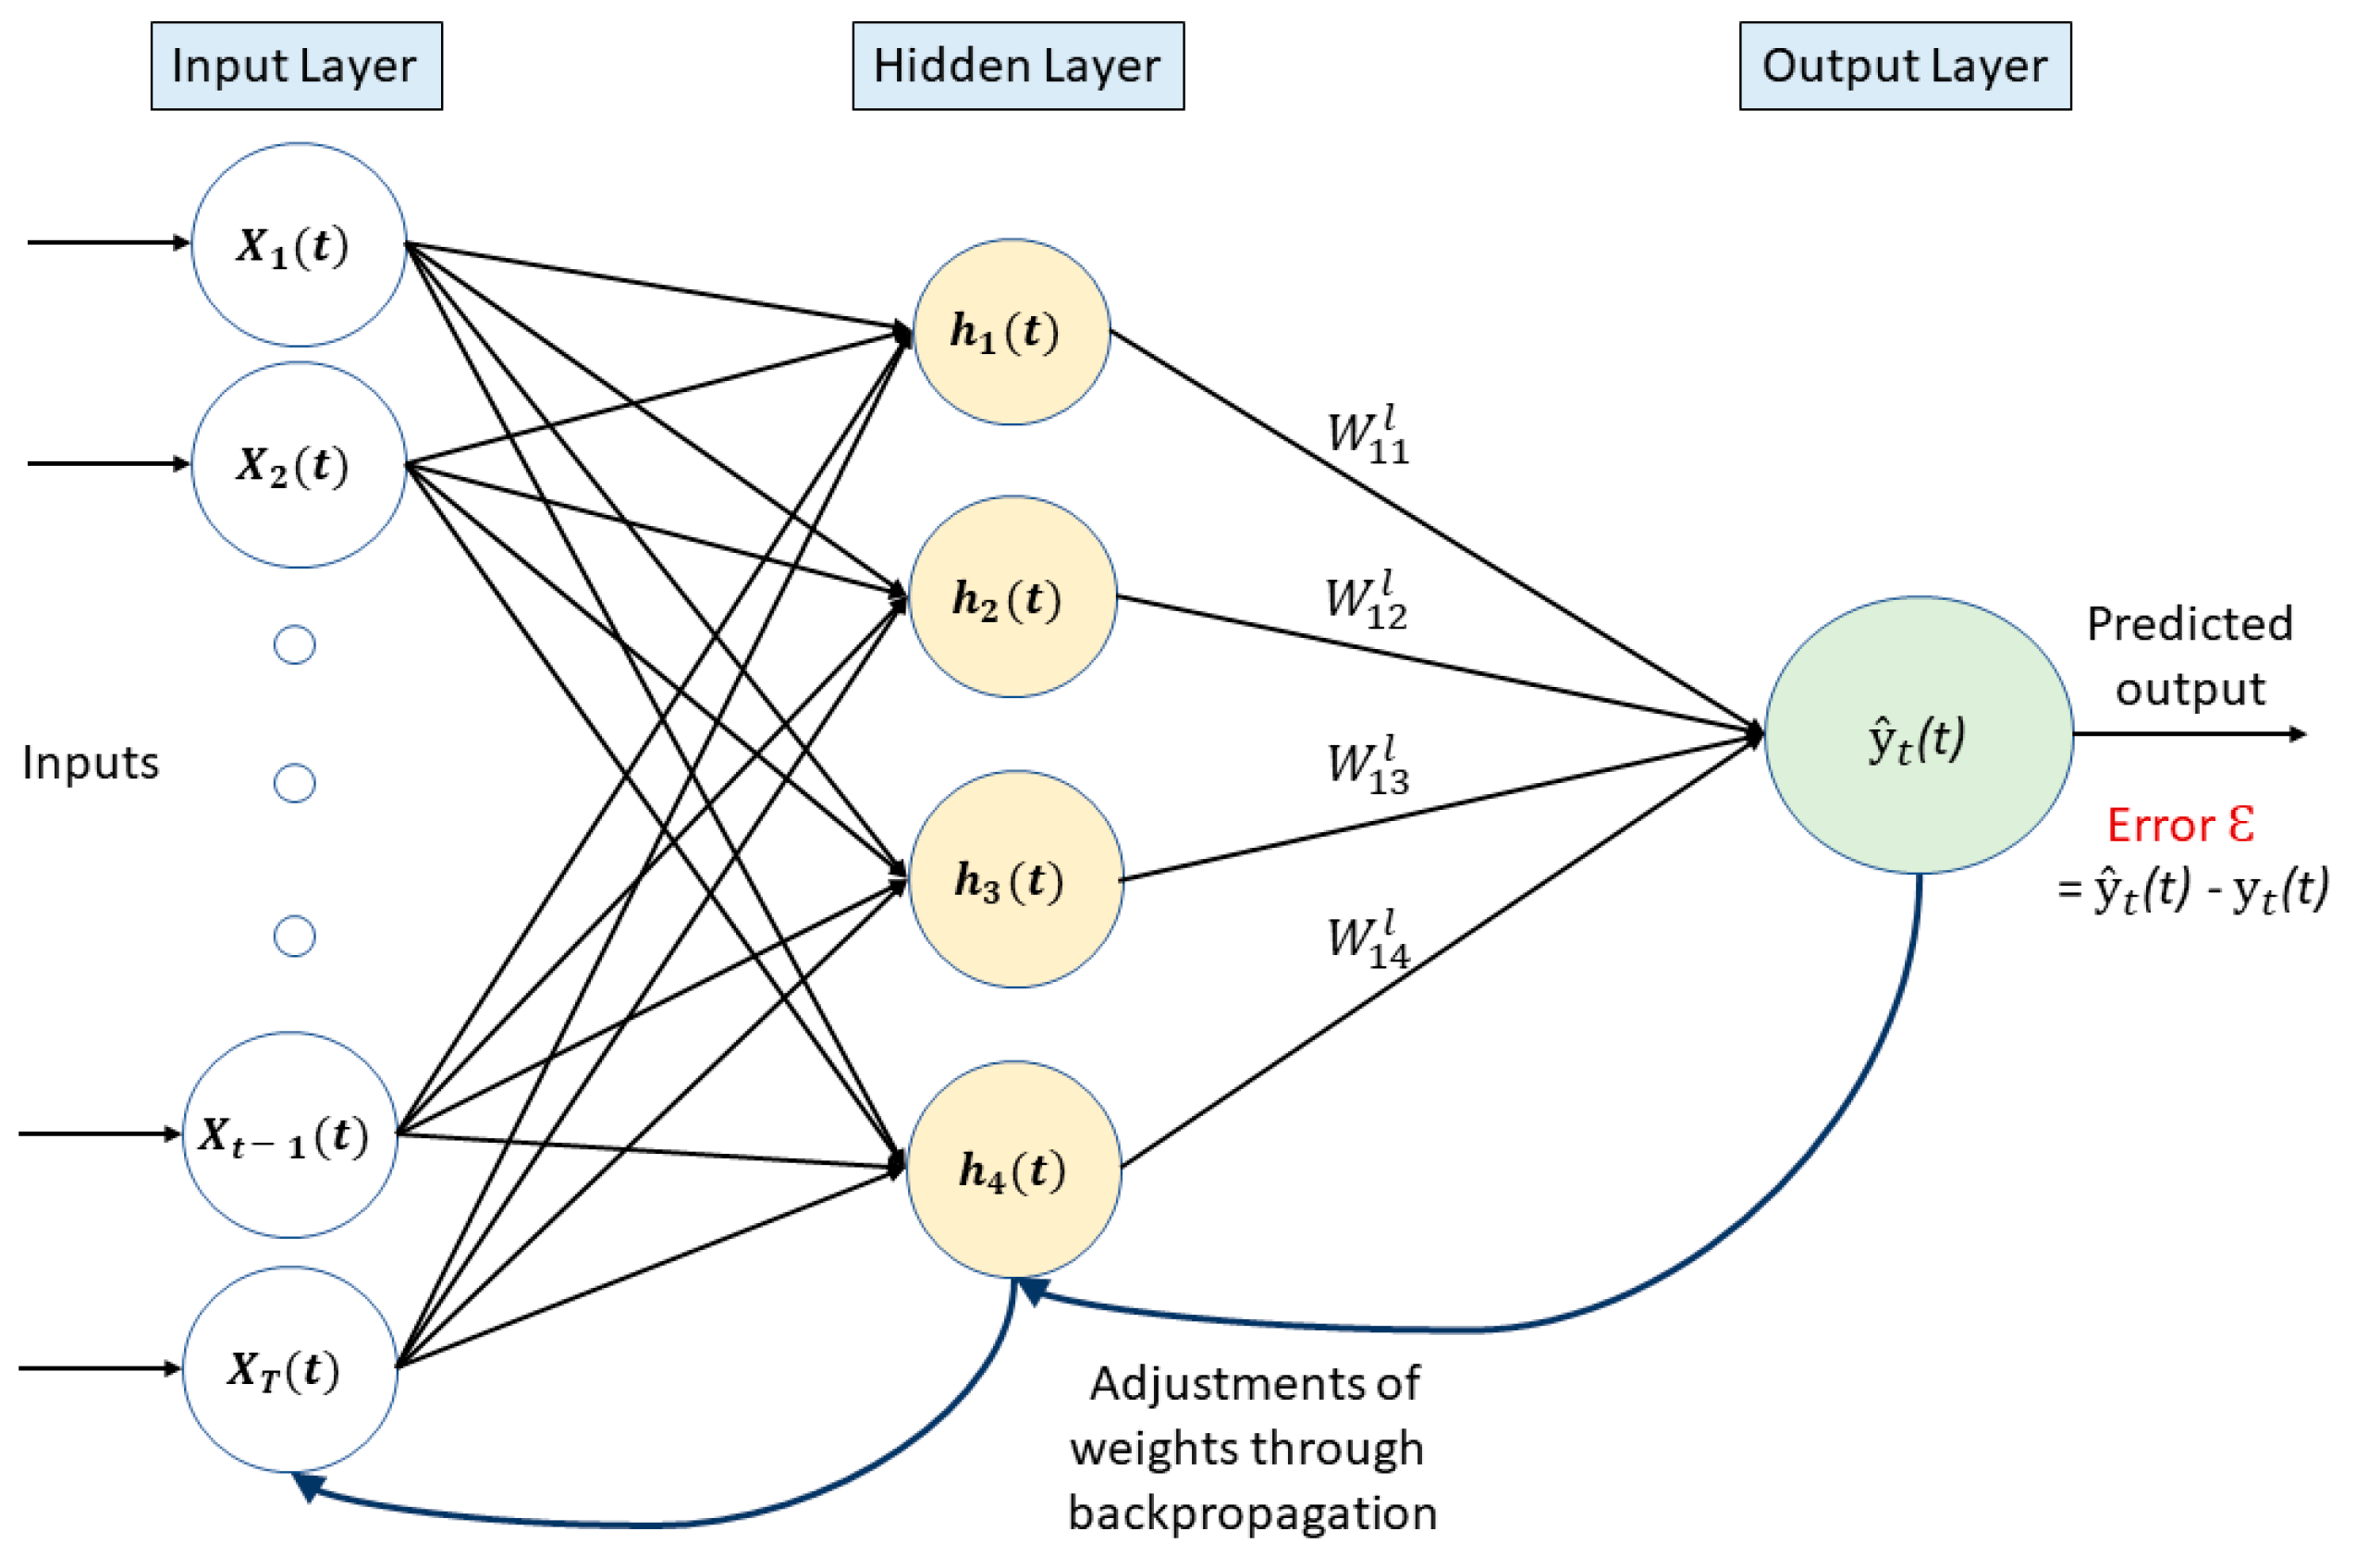
4.2.2. ANN Model Formulation

Figure 3 presents generic backpropagation steps in an ANN model. The backpropagation algorithm comprises two phases: forward pass and backward pass. The input is introduced to the neural network in forward propagation, which subsequently computes the output. In backward propagation, the variation between the predicted output and the actual output is assessed, leading to adjustments in the weights and biases of each neuron to minimize the error.
  • Forward Propagation
The forward pass calculates the predicted output ŷt of the network layer by layer:
  • Input Layer: set of historical datasets with sliding window features X T .
  • Hidden layer: for each neuron in the hidden layer l = 1, 2, …, L − 1.
Step1: Compute the weighted sum of inputs:
z l = W i j l a i l 1 + b j l ,
where
z l : input to the hidden layer l.
a i l 1 : previous layer activation function.
W i j l : weights matrix for layer l.
b j l : bias vector for layer l.
Step2: Apply the activation function (ReLU, Sigmoid etc.):
a i l = ʄ ( z l )
Output layer: The final predicted bandwidth is as follows:
y ^ t = ʄ o u t p u t ( W i j L a i L 1 + b j L )
  • Loss function adjustment with Thresholds
Incorporate dynamic thresholds, the boundaries around the predicted output, into the error calculation ε , which is used to manage over-prediction and under-prediction:
Step1: incorporate upper threshold, the maximum acceptable predicted value:
T h r e s u p p e r = y ^ t + α   σ
Step2: incorporate lower threshold, the minimum acceptable predicted value:
T h r e s l o w e r = y ^ t α   σ ,
where
α : the sensitivity factor determines the level of thresholds.
σ : the rolling standard deviation of recent errors reflects data variability, on N recent time steps, given by the following Equation (9):
σ = 1 N i = t N t 1 ( y i y ^ i ) 2 .
Step3: The adjusted error calculation is as follows:
ε = { 0 y t T h r e s u p p e r , T h r e s l o w e r y t i f   y t   ϵ [ T h r e s l o w e r , T h r e s u p p e r ]   i f   y t > T h r e s u p p e r i f   y t < T h r e s l o w e r
Then, the adjusted loss function L is shown in Equation (10):
L = 1 N i = 1 N ε i ,
where ε i   is ith sample error adjustment.
  • Backpropagation
The backward pass computes the gradient of the loss function L with respect to Wij and bj.
Step1: Compute error at output layer ( δ L ) :
δ L = δ L δ z L = ( y ^ i y i )   f o u t p u t ( z L ) ,
where f o u t p u t ( z L ) determines the activation function of the output layer.
Step2: Error propagation to hidden layer: for each hidden layer l, propagate the error backward, using the following Equation:
δ L = ( W i j l + 1 ) T δ l + 1 f ( z l ) ,
where ( W i j l + 1 ) T is the transpose of the weights from the next layer. Similarly, δ l + 1 is the error from the next layer and f ( z l ) is the derivative of the activation function at layer l.
Step3: Compute the gradient of loss with respect to weight (Wij), as shown in Equation (13), and bias (bj) as shown in Equation (14):
δ L δ W i j l = δ l   ( a i l 1 ) T
δ L δ b j l = δ l
Step4: Update weight (Wij) and bias (bj) using the gradient descent calculated in the above step using Equations (15) and (16), respectively.
W i j l = W i j l η   ( δ L δ W i j l )
b j l = b j l η   ( δ L δ b j l ) ,
where η   is   learning rate.

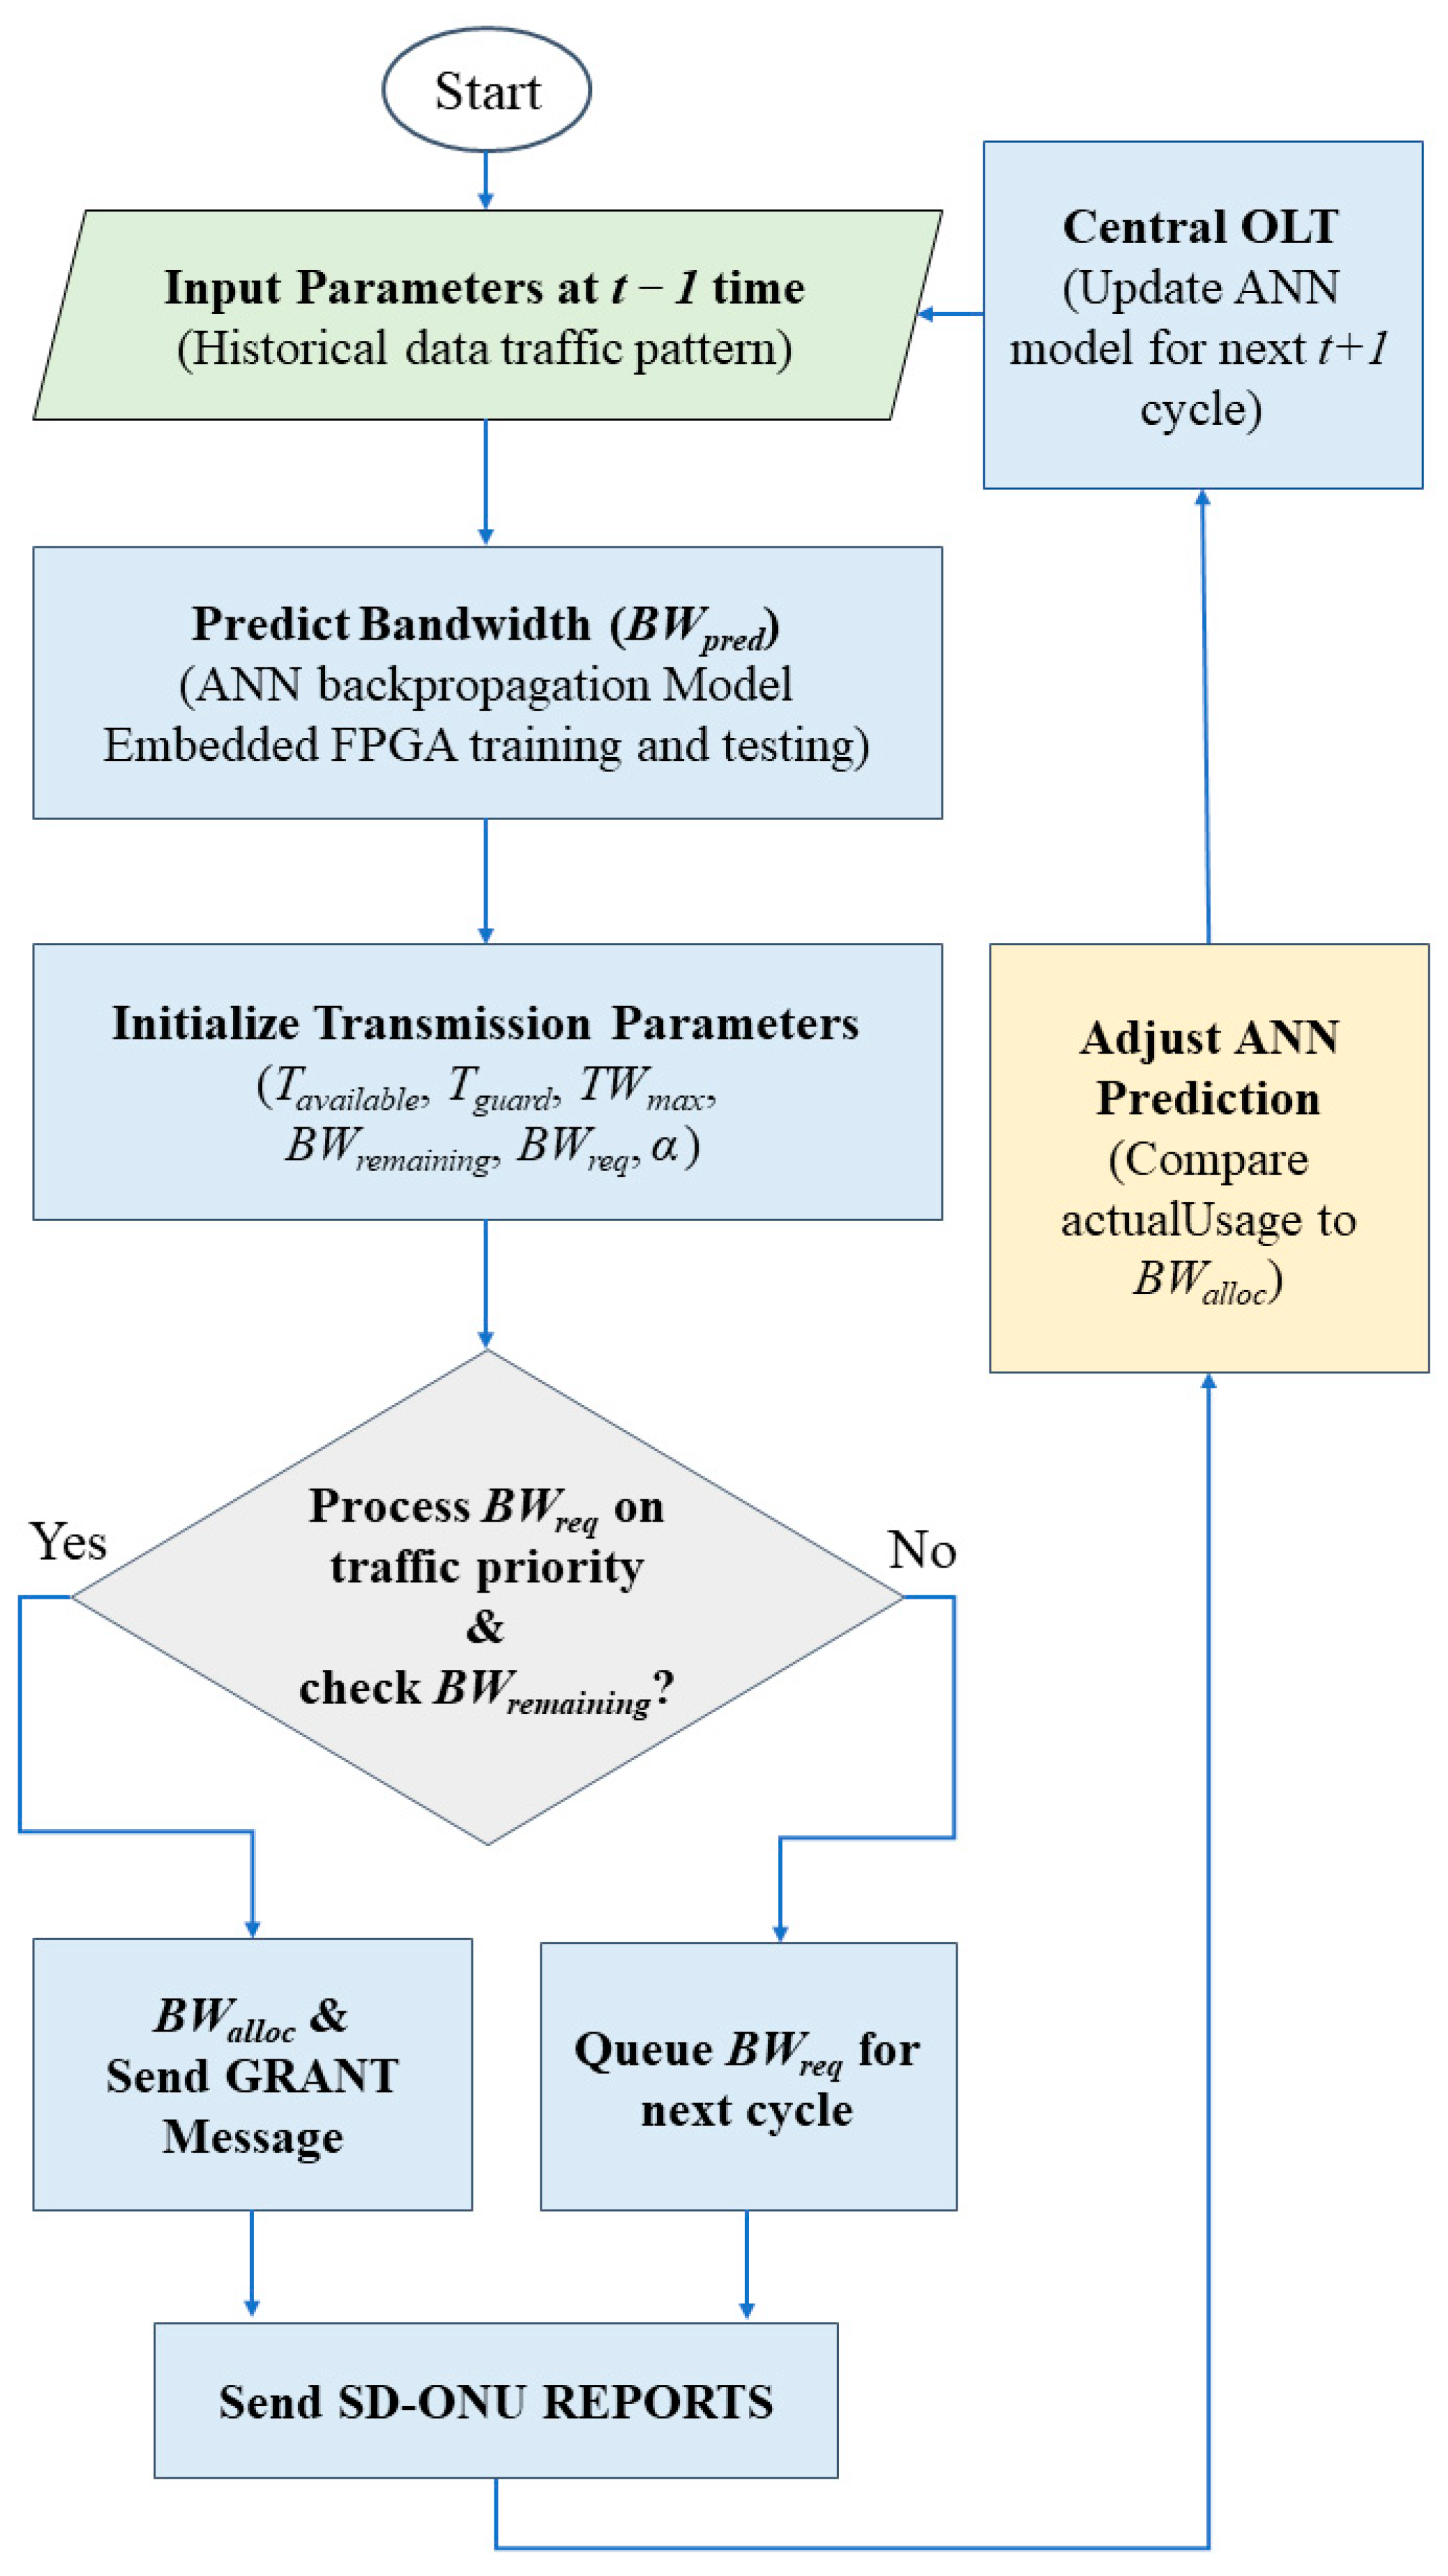
4.2.3. IMS-DBA for Immersive VoD Allocation

This research study presents a predictive dynamic bandwidth allocation method, namely immersive media services (IMS-DBA), for handling bandwidth request (BWreq) REPORTs from SD-ONUs/B5G-BS, which are categorized into three prioritized traffic classes: EF, AF including IVoD, and BE within the NG-EPON and B5G X-haul access network. The bandwidth mechanism fairly adjusts the bandwidth prediction (BWpred) based on the ‘α’ dynamic threshold adjustment mechanism to adapt to actual traffic conditions. IM-DBA initiates by setting key parameters, including the scheduled transmission time (Tavailable), guard time (Tguard), maximum transmission timeslot (TWmax), remaining bandwidth (BWremaining), and a dynamically adjusted predicted bandwidth value (BWpred) based on feedback from prior cycles.
IMS-DBA processes requests for each SD-ONU in descending order of priority. Initially, EF traffic, which is the highest-priority class, receives bandwidth allocation determined by the sum of the requested bandwidth (BWreq) and the predicted bandwidth (BWpred), limited by the minimum of the available bandwidth (BWremaining) and TWmax. The allocated bandwidth (BWalloc) by the central SD-OLT is transmitted to the SD-ONU via an EF_GRANT message, and the remaining bandwidth and scheduled time are subsequently updated. After the complete processing of EF traffic, the algorithm transitions to AF traffic, which includes the IVoD data, employing a comparable allocation method, and subsequently addresses BE traffic, which is processed only if bandwidth remains available.
A dynamic adjustment mechanism refines BWpred following each cycle by utilizing feedback from the SD-ONUs REPORT (actualUsage). BWpred adjusts upward to reflect underestimated demand when actualUsage surpasses the allocated bandwidth (BWalloc). If usage is below allocation (BWalloc), BWpred is decreased to avoid over-allocation in future cycles. This iterative process optimizes bandwidth usage, adjusts to traffic patterns, and prioritizes higher classes while permitting opportunistic servicing of lower-priority traffic.
The IMS-DBA algorithm is presented below Algorithm 1:
Algorithm 1 IMS-DBA
For i = number of SD-ONUs
  Tavailable = upstream transmission scheduled time
  Tguard = guard time interval
  TWmax = maximum transmission timeslot of SD-ONUi
  BWremaining = total bandwidth for ONUi
  BWpred = bandwidth predicted value for all traffic classes through ANN
  α = dynamic threshold adjustment parameter
  For every received BWreq of SD-ONUi,
    BWreq ∈ (EF, AF, BE)  //Bandwidth request REPORT from SD-ONUi
    do {
      startTime = Tavailable + Tguard

      // Process EF traffic (highest priority)
      if BWreq = EF and BWremaining > 0 then {
       BWalloc = min(BWreq + BWpred, TWmax)
      // Ensure BWalloc does not exceed BWremaining
        if BWalloc > BWremaining then {
         BWalloc = BWremaining
        }
        EF_GRANT = (startTime—RTTi, BWalloc)
        Send EF_GRANT message
        // Update remaining bandwidth and time
        BWremaining = BWremainingBWalloc
        TWmax = BWremaining
        Tavailable = startTime + BWalloc
      }

      // Process AF traffic (second priority)
      else if BWreq = AF and BWremaining > 0 then {
       BWalloc = min(BWreq + BWpred, TWmax)
      // Ensure BWalloc does not exceed BWremaining
        if BWalloc > BWremaining then {
         BWalloc = BWremaining
        }
        AF_GRANT = (startTime—RTTi, BWalloc)
        Send AF_GRANT message
        // Update remaining bandwidth and time
        BWremaining = BWremainingBWalloc
        TWmax = BWremaining
        Tavailable = startTime + BWalloc
      }

      // Process BE traffic (lowest priority)
      else if BWreq = BE and BWremaining > 0 then {
       BWalloc = min(BWreq + BWpred, TWmax)
      // Ensure BWalloc does not exceed BWremaining
        if BWalloc > BWremaining then {
         BWalloc = BWremaining
        }
        BE_GRANT = (startTime—RTTi, BWalloc)
        Send BE_GRANT message
        // Update remaining bandwidth and time
        BWremaining = BWremainingBWalloc
        TWmax = BWremaining
        Tavailable = startTime + BWalloc
}

// Dynamic Prediction Adjustment for All Classes
      actualUsage = BWreq // SD-ONU feedback
      if actualUsage > BWalloc then {
        BWpred = BWpred + α * (actualUsage—BWalloc)
      } else if actualUsage < BWalloc then {
        BWpred = max(0, BWpred − α * (BWalloc—actualUsage))
      }

// Update ANN model with feedback (SD-ONU REPORTS)
      ANN.update (Xt, actualUsage)
    }
  }
End

5. Proposed ANN-Based Predicted Bandwidth Allocation Scheme

Figure 4 shows the overall flow of incorporating ANN for dynamic bandwidth allocation in NG-EPON and B5G X-haul networks. This flowchart begins with the input parameters at time t − 1, representing historical data including QoS, past bandwidth, and traffic usage patterns to forecast the bandwidth demand for the subsequent cycle utilizing an ANN backpropagation model integrated within an FPGA, where the model is used for training and testing to predict bandwidth demand (BWpred). Upon completion of the bandwidth prediction, the system initializes various essential transmission parameters, which encompass available transmission time (Tavailable), guard time (Tguard), maximum transmission window (TWmax), and remaining bandwidth (BWremaining). It subsequently processes bandwidth requests (BWreq) according to traffic priority and verifies the availability of sufficient bandwidth. When bandwidth is available, it allocates bandwidth (BWalloc) and transmits a GRANT message. If the remaining bandwidth is inadequate, the system queues the unmet bandwidth requests for the next cycle, ensuring they are processed in a subsequent iteration. The system evaluates actual bandwidth utilization against the allocated bandwidth and modifies the ANN model to enhance subsequent predictions. This feedback is utilized by the central SD-OLT to revise the ANN model for the subsequent t + 1 cycle. Subsequently, SD-ONU produces REPORT messages after every iteration outlining current bandwidth allocation, actualUsage, and other operational parameters. This closed-loop system optimizes bandwidth management through continuous adaptation to traffic demands.

6. System Performance Evaluation & Discussion

This section evaluates the proposed IMS-DBA system’s performance under a transmission cycling time of 1.0 ms. The simulation uses the OPNET simulator, with an SD-OLT interconnected with 32 SD-ONUs. The 25 Gbp/s downstream and 10 Gbp/s upstream are partitioned into multiple channels via TDM. The distance between the SD-OLT and the SD-ONUs is limited to a maximum of 20 km. The AF and BE traffic exhibit self-similarity and long-range dependence (LRD), characterized by a Hurst parameter of 0.8. The packet size is consistent, varying between 64 and 1518 bytes. The EF traffic, characterized by its sensitivity and need for expedited forwarding, is produced with a fixed packet size of 70 bytes, following a Poisson distribution. The simulation parameters are summarized in Table 2.
The traffic distribution depicted in Table 3 compares simulations for three scenarios: case 163 (10% voice, 60% IVoD, 30% data), case 153 (15% voice, 50% IVoD, 35% data), and case 145 (10% voice, 40% IVoD, 50% data). This traffic scenario primarily contrasts low and high immersive video volumes, with case 163 indicating a high immersive video load and case 145 indicating a lower immersive video load. The IMS-DBA is evaluated against LSTM-GARAA [20].
The ANN model is trained with a dataset consisting of 10,000 transmission cycles. This dataset is divided into 70% for training and 30% for testing. The ANN training learning rate is 0.001 alongside a batch size of 64 to balance convergence speed with stability. The network’s parameters are iteratively refined via the Mean Squared Error (MSE) loss function when the number of epochs is 50. The L2 regularization is integrated with a penalty factor of 0.001 to ensure that the ANN generalizes well to new network data. The model leverages a sliding window approach with a window size of 5 to capture essential temporal patterns. All input data are normalized to the [0, 1] range to harmonize the training inputs. A factor (α), adjustable between 0.1 and 0.5, is used to fine-tune the adaptation of threshold limits, which are updated every 20 cycles in response to evolving network conditions. Moreover, a rigorous feedback adjustment mechanism continuously aligns the ANN’s predictions with actual bandwidth usage, sustaining an optimal balance between allocated and consumed bandwidth. Table 4 summarizes the ANN backpropagation parameters used for training and testing the dataset before system performance simulations.
The computational complexity of the ANN backpropagation model integrated within the FPGA is evaluated based on the number of neurons, layers, and input features. For a network with L layers, each having n l neurons, and a sliding window of k input time steps, the forward and backward pass complexity is estimated as follows:
O ( L = 1 L n l .   n l 1 )
Given our implementation with three layers (input, one hidden, output), each with ≤100 neurons, and a sliding window size of 5, the model’s per-inference runtime remains in the sub-millisecond range, suitable for real-time operations on FPGA hardware. This runtime is further optimized by parallelizing matrix operations using dedicated logic blocks on the FPGA. We have also evaluated the total control overhead regarding the network’s number of ONUs (N). The IMS-DBA operates on a cycle-based loop, and its computational cost grows linearly with the number of ONUs; in other words,
O ( N . C )
where C represents the per-ONU prediction and bandwidth grant computation (which remains constant and hardware-accelerated). In our OPNET simulations with 32 active SD-ONUs, the total computational cycle per DBA round is below 1 ms, including ANN prediction, bandwidth grant calculation, and ANN model update. This aligns with the cycle time (1.0 ms) and does not introduce processing bottlenecks.

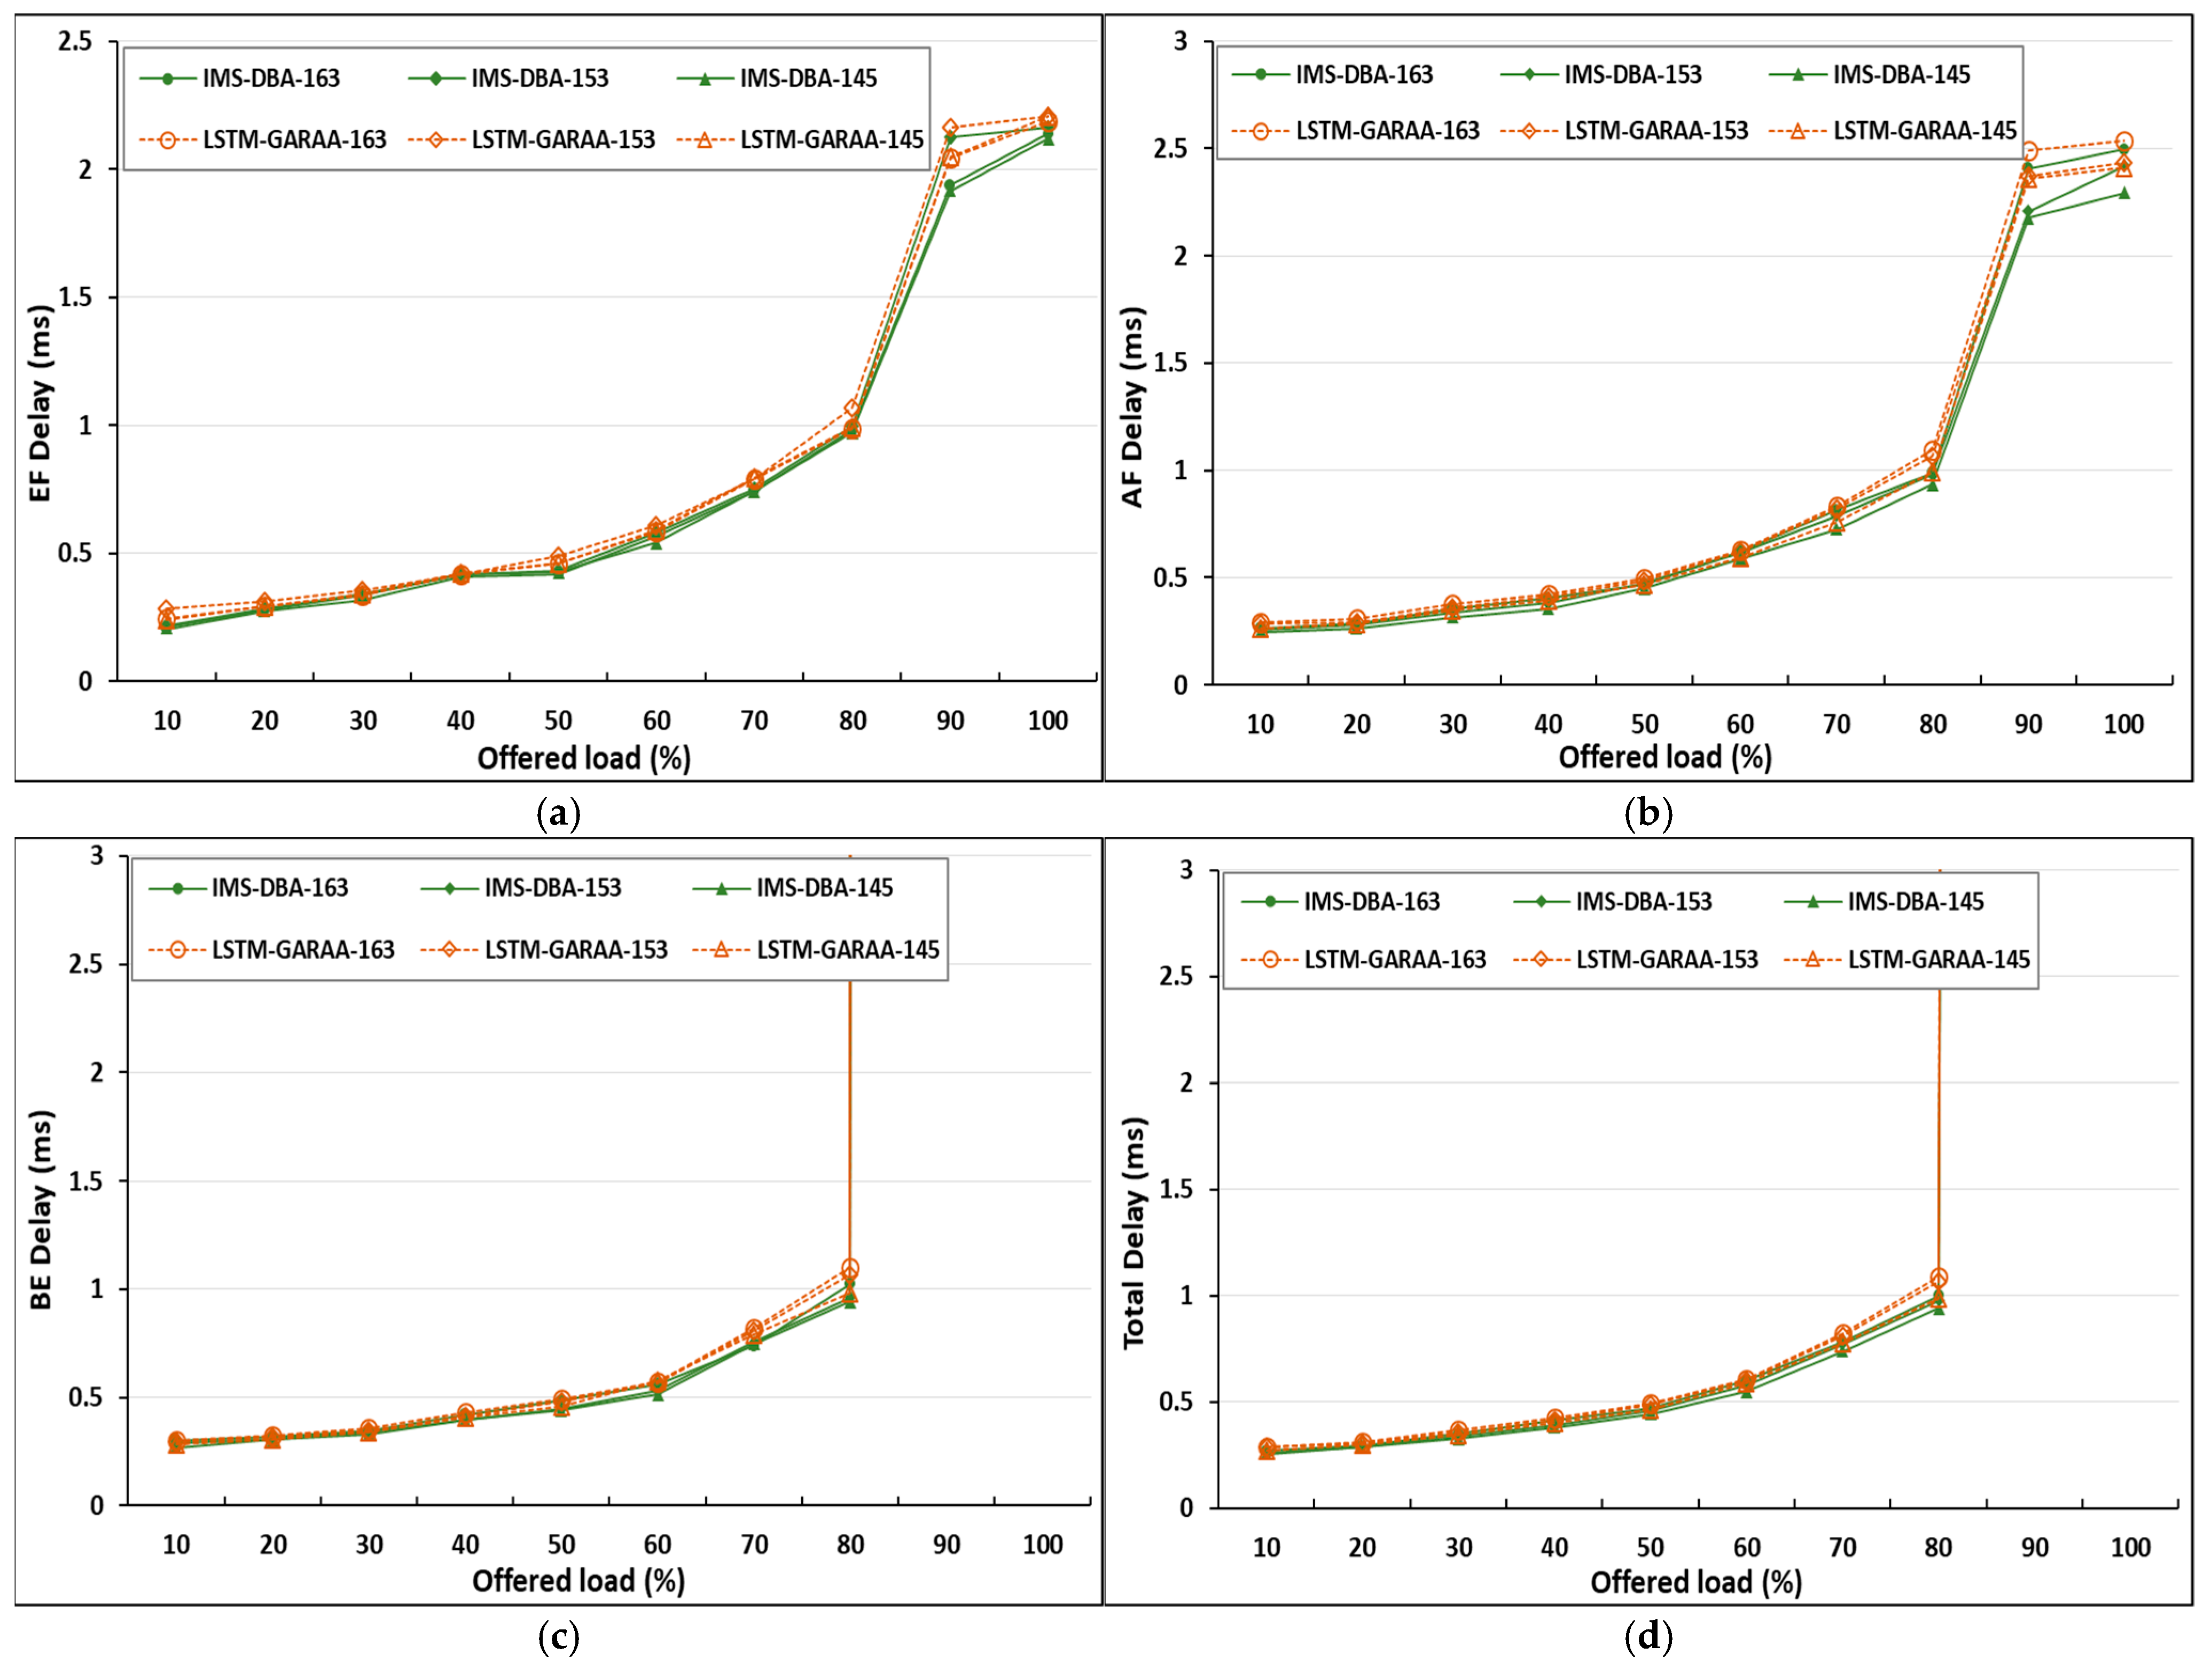
6.1. Mean Packet Delay
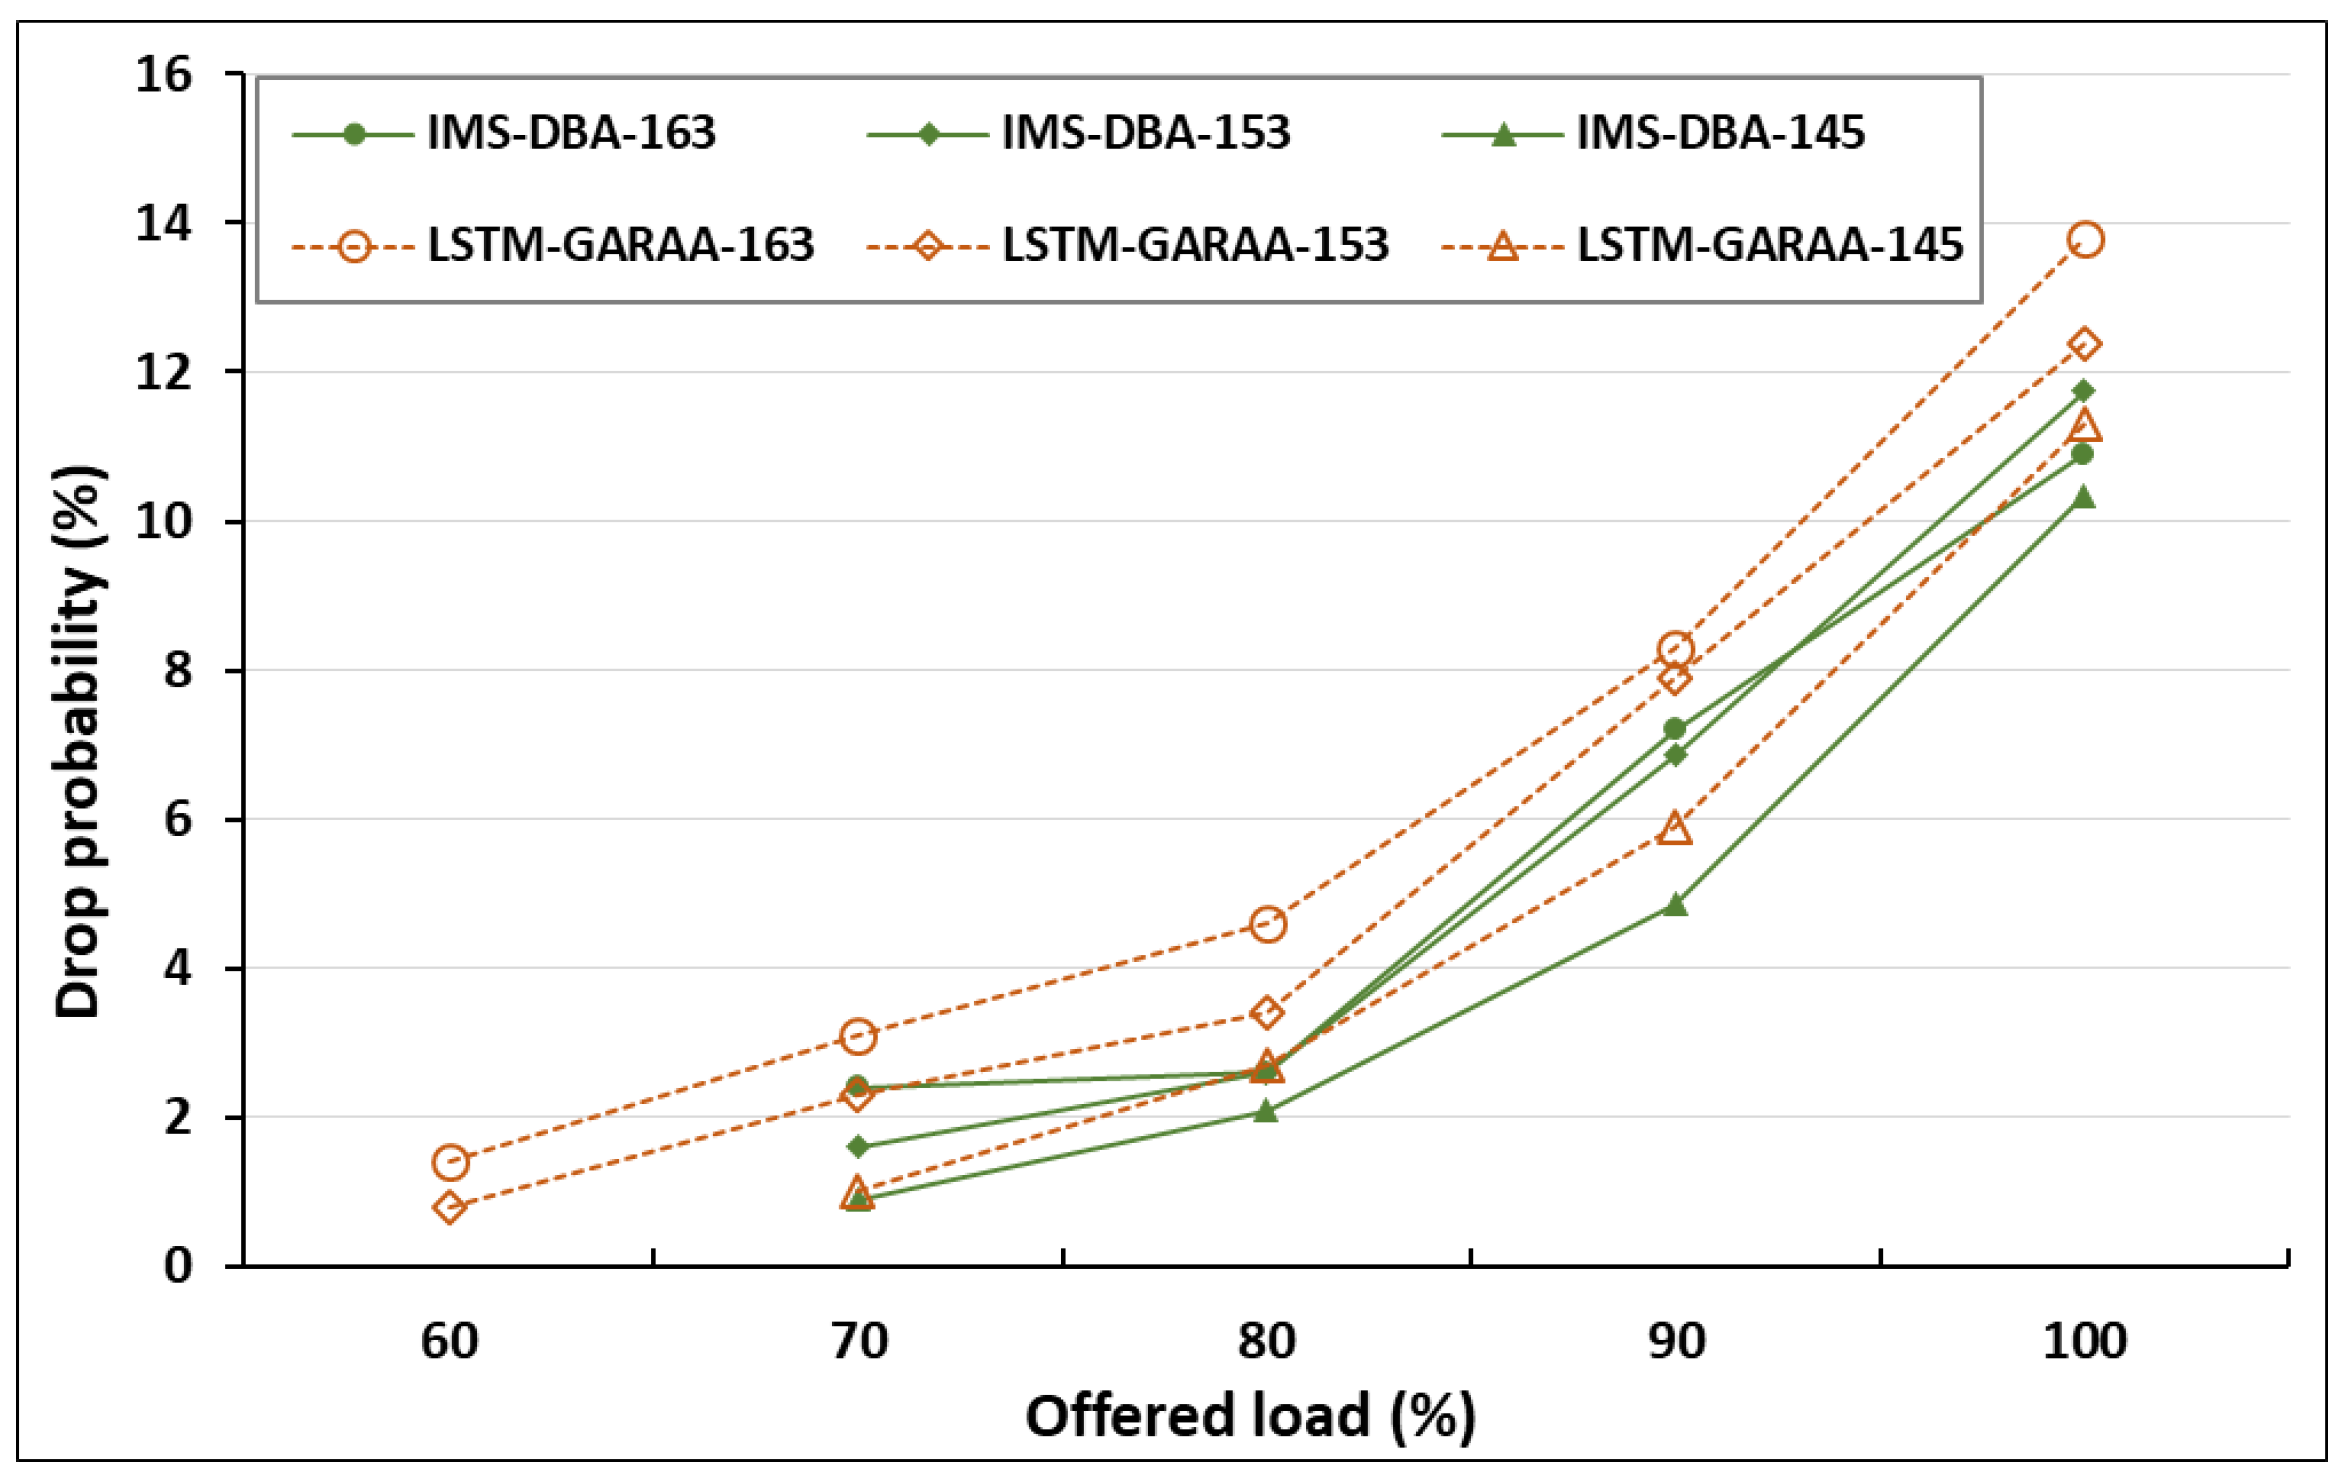
Mean packet delay represents the average duration required for a packet to travel from its origin to its destination within a network. The metric includes various types of delays, such as transmission, propagation, queuing, and processing delays. It is typically calculated as M e a n   P a c k e t   D e l a y = ( D e l a y   f o r   a l l   p a c k e t s ) T o t a l   n u m b e r   o f   p a c k e t s . A high mean packet delay typically indicates network problems such as congestion, insufficient bandwidth, or suboptimal performance. Figure 5 shows the mean packet delay comparison across various load conditions. All cases exhibit a similar lower EF delay across all load conditions due to its higher transmission priority, as shown in Figure 5a. Both IMS-DBA and LSTM-GARAA fairly maintain EF delay below 1.0 ms under light load conditions. However, IMS-DBA consistently delivers slightly lower EF delay at higher traffic loads compared to LSTM-GARAA up to around 80% traffic load, beyond which the delay increases sharply. A similar trend is shown for AF traffic, including immersive video, which is moderately sensitive to delay, as is shown in Figure 5b. IMS-DBA outperforms LSTM-GARAA in all three traffic configurations, especially when the load crosses 80% and the delay increases more noticeably. The BE traffic is given the lowest priority and hence incurs higher delay under traffic load. While both schemes show increasing BE delay with traffic load, IMS-DBA maintains a more stable delay progression, as shown in Figure 5c. Finally, the total end-to-end delay reflects the aggregate EF, AF, and BE delay to reflect overall network responsiveness, as shown in Figure 5d. The delay curve remains relatively smooth until the traffic load reaches 80%, beyond which the network gets congested. However, IMS-DBA avoids sudden spikes in delay while efficiently adjusting grants based on the feedback loop, enabling IVoD and other delay-sensitive traffic to be handled more efficiently.

6.2. Packet Drop

Packet drop denotes the failure of a packet to arrive at its designated destination, which is attributable to multiple factors within the network, such as network congestion, traffic link failure, transmission errors generally caused by noise or interference, or bandwidth availability. A high packet drop generally indicates the network’s inadequacy to handle the traffic volume. Figure 6 shows the BE packet drop for varying traffic load conditions. Across all traffic configurations, IMS-DBA achieves significantly lower BE packet drop comparing LSTM-GARAA. For instance, in LSTM-GARAA-163 and LSTM-GARAA-153, the BE drop occurs at 60% traffic load while the IMS-DBA exhibits drop at 70%, with a drop rate reaching a maximum of 11.5% when compared to almost 14% in LSTM-GARAA. The gap between LSTM-GARAA and IMS-DBA becomes more significant at 90–100% traffic load. This reflects IMS-DBA’s predictive learning and dynamic adjustment through a feedback mechanism.

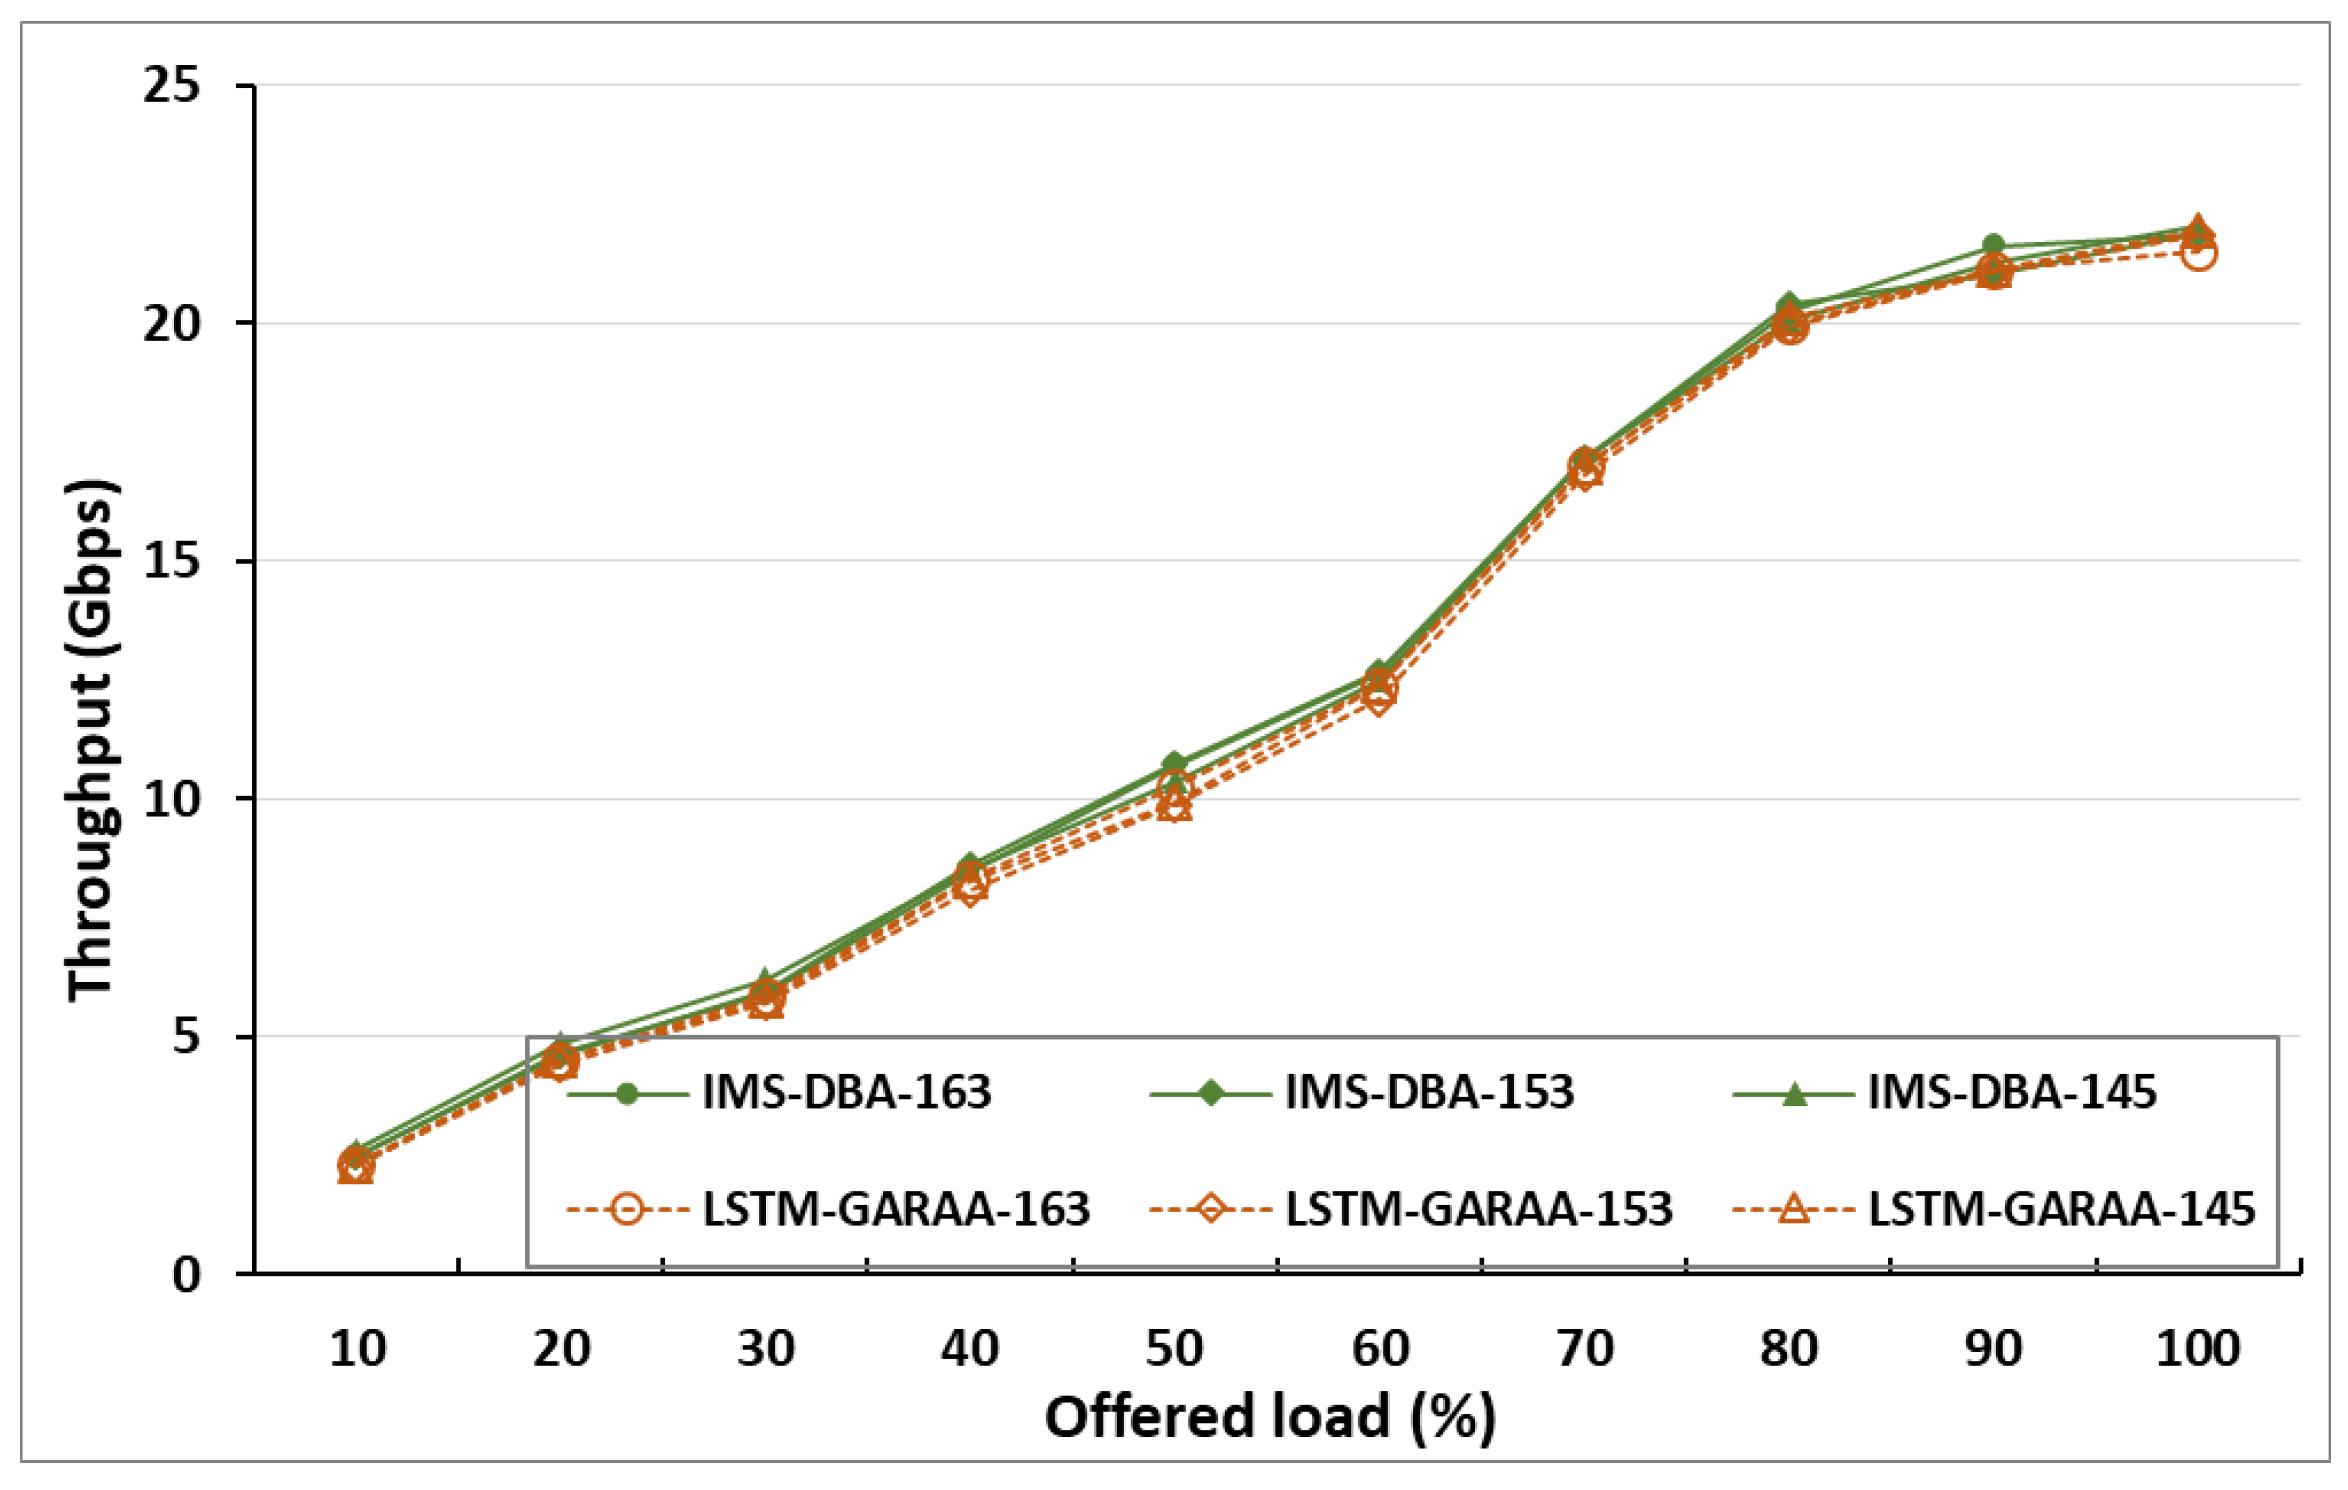
6.3. System Throughput
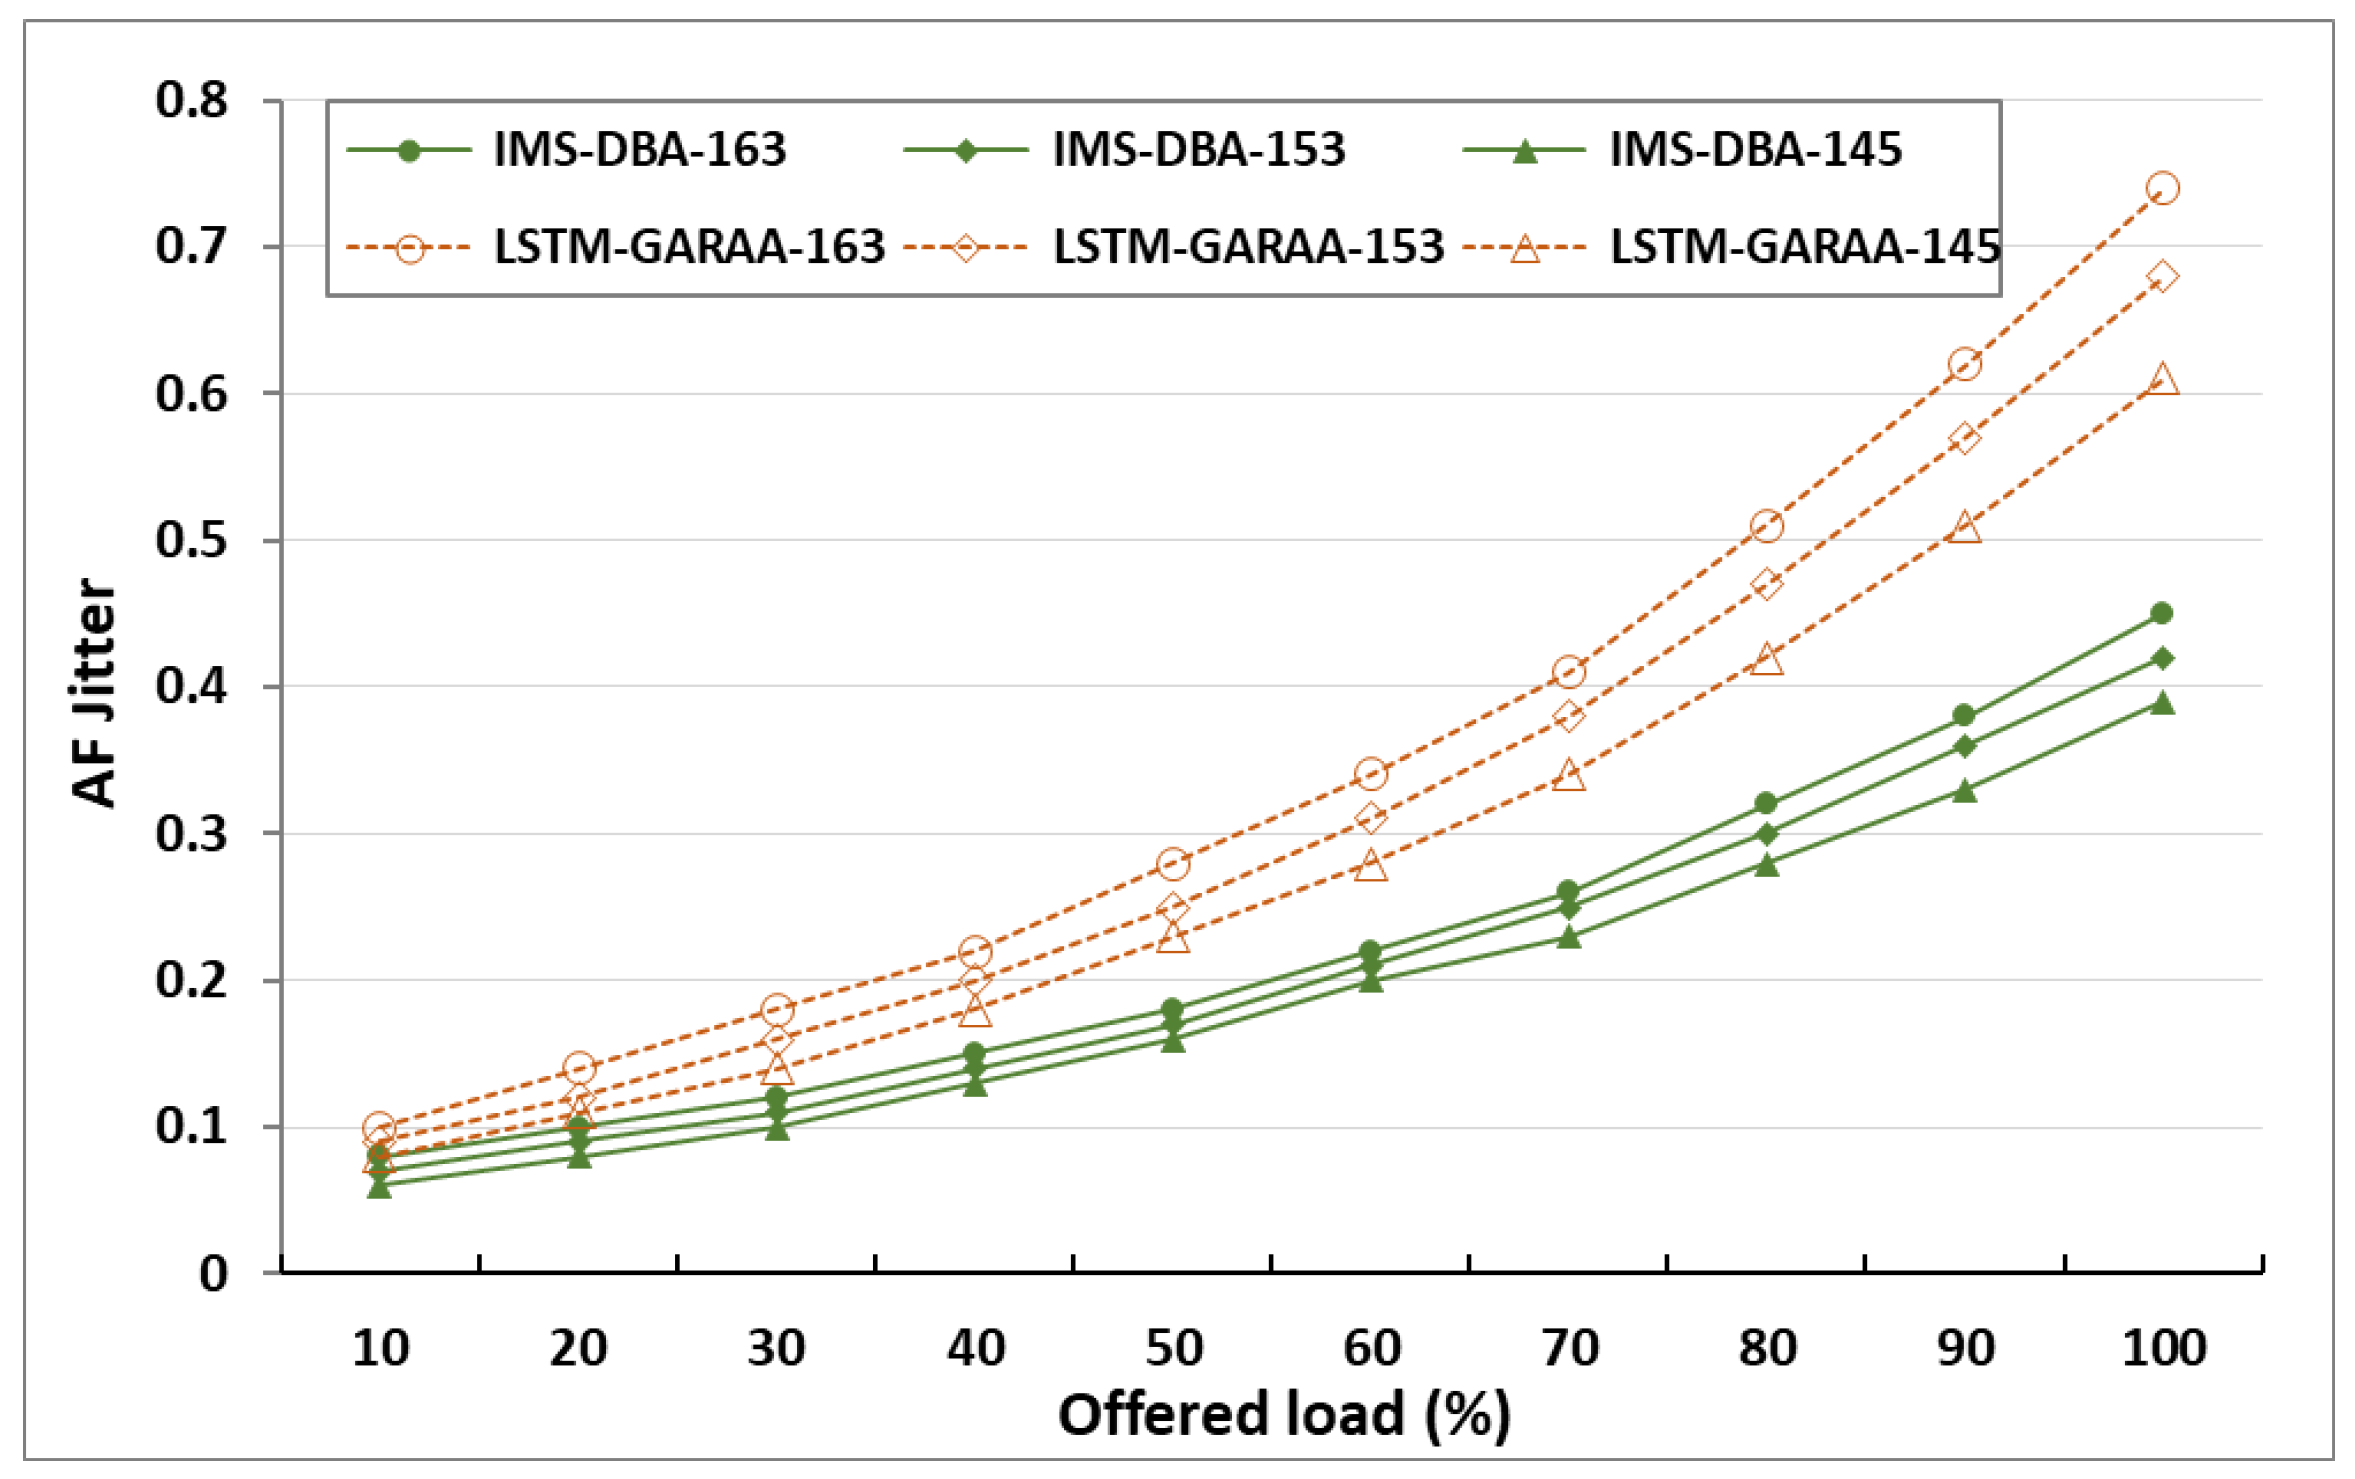
System throughput, or simply throughput, refers to the network’s ability to successfully transmit data within a given time frame. It reflects the actual data rates considering various network factors, including traffic delays, packet loss, and rerouting. High throughput often indicates efficient network management with minimal latency. Figure 7 shows the system throughput for all scenarios. All cases maintain a linear progression, meaning that the network can effectively support increasing load without degradation. Across all load levels, IMS-DBA consistently achieves marginally higher throughput than LSTM-GARAA. At 100% offered load, IMS-DBA peaks at approximately 21.9 Gbps, whereas LSTM-GARAA reaches around 21.3 Gbps. This improvement is noteworthy in access networks where optimizing throughput promptly leads to improved utilization and decreased service latency, particularly for high-bandwidth applications like IVoD. The performance advantage of IMS-DBA can be attributed to its intelligent bandwidth allocation technique based on historical data and real-time adjustments, which leads to overall improved throughput.

6.4. Jitter

The variation in delay between successive packets (i.e., jitter) is a critical performance metric for immersive VoD (IVoD) and real-time multimedia applications. High jitter can result in frame misalignment, buffering, or interruptions in playback, especially for XR-based content where synchronization is paramount. Figure 8 illustrates the AF jitter comparison between IMS-DBA and LSTM-GARAA across the three traffic scenarios (case 163, 153, and 145) and varying offered load conditions. Across all scenarios, IMS-DBA outperforms LSTM-GARAA in minimizing jitter values. Notably, at lower loads (10–50%), both schemes show similar performance, although IMS-DBA maintains slightly less jitter. However, as the traffic load increases, the difference becomes more prominent between the two schemes: with LSTM-GARAA-163, the AF Jitter reaches close to 0.75, while the IMS-DBA fairly maintains jitter below 0.45. Moreover, the smoother slope of the IMS-DBA jitter curve indicates its ability to make real-time adjustments with ANN predictions and dynamic threshold tuning.

7. Conclusions

This research investigates the challenges and solutions associated with intelligent resource allocation for IVoD services over advanced networks, including NG-EPON and B5G X-haul access networks. IVoD, characterized by incorporating XR and spatial technologies, transcends conventional VoD by offering dynamic, interactive, and engaging experiences. These advancements require substantially high bandwidth and ultra-low latency to facilitate seamless delivery. Further, this study presents a resource management framework that utilizes SDN to monitor and optimize optical resources. A predictive technique, ANN with backpropagation, is employed to forecast bandwidth demands based on historical traffic data, internet behavior, and network conditions. The backpropagation techniques constantly adjust thresholds to align actual and estimated usage, thereby decreasing latency and increasing throughput, thus enhancing QoS. The FPGA and IVoD storage components are added to the OLT hardware architecture to effectively handle the training and testing of data utilizing the ANN backpropagation model and server mechanism designed for caching immersive video content, adapted to predicted traffic patterns and bandwidth utilization. A new IMS-DBA algorithm is proposed to handle network traffic efficiently based on the classified priorities. The methodology focuses on dynamic adjustments to bandwidth predictions through a feedback loop derived from network usage reports, thereby minimizing over- and under-predictions. This iterative process enhances resource utilization and prioritizes high-priority traffic while accommodating lower-priority demands as opportunities arise. The IMS-DBA is compared with the LSTM-GARAA to examine the efficiency of the proposed DBA. Simulation results show that the proposed IMS-DBA improves overall QoS metrics regarding mean packet delay, packet drop probability, and system throughput. The proposed IMS-DBA improves the mean packet delay by up to 3% and packet drop probability by up to 4% in different traffic loads and patterns. In conclusion, this research study illustrates that integrating ML models for predictive bandwidth allocation and a closed-loop feedback system enables scalable, efficient, and responsive IVoD delivery that meets user demands. These innovations establish a foundation for tackling future challenges in immersive multimedia services, ensuring sustained high performance and accessibility within increasingly complex network environments. Our future work focuses on implementing resource allocation with dynamic ML model implementation in a real test bed environment.

Author Contributions

Conceptualization, R.K.; methodology, R.K.; software, A.N.; validation, R.K., A.N. and I.-S.H.; formal analysis, R.K. and A.N.; writing—original draft preparation, R.K.; writing—review and editing, R.K., A.N. and I.-S.H.; supervision, I.-S.H.; funding acquisition, I.-S.H. All authors have read and agreed to the published version of the manuscript.

Funding

This work was funded by the National Science Council under grants NSTC 113-2221-E-155-055.

Data Availability Statement

Data are contained within the article.

Conflicts of Interest

The authors declare no conflicts of interest.

Abbreviations

The following abbreviations are used in this manuscript:
AFAssured Forwarding
ANNArtificial Neural Networks
ARAugmented Reality
B5GBeyond 5G
B5G-BSBeyond 5G Base Station
BEBest Effort
DBADynamic Bandwidth Allocation
EFExpedited Forwarding
FPGAField-Programmable Gate Array
FWAFixed Wireless Access
HCIHuman–Computer Interaction
ICTInformation and Communication Technology
IMImmersive Media
IVODImmersive VoD
LLIDLogical Link Identification
MACMedia Access Control
MCRSMulti-Channel Reconciliation Sublayer
MLMachine Learning
MPCPMulti-Point Control Protocol
NG-EPONNext Generation EPON
NNINetwork-To-Network Interface
OAMOperations, Administration, And Maintenance
OANOptical Access Network
ODNOptical Distribution Network
ONUOptical Network Unit
PSCPassive Optical Splitter-Combiners
SDNSoftware-Defined Networking
SD-OLTSoftware-Defined Optical Line Terminal
SD-ONUSoftware-Defined Optical Network Unit
TDMATime Division Multiple Access
TWTransmission Window
UNIUser-To-Network
VODVideo on Demand
VRVirtual Reality
XRExtended Reality

References

  1. Partarakis, N.; Zabulis, X. A review of immersive technologies, knowledge representation, and AI for human-centered digital experiences. Electronics 2024, 13, 269. [Google Scholar] [CrossRef]
  2. Insights, T.B. Spatial Computing Market Forecast 2024 to 2033. In Market Research Report; Online TBI-14188. March 2024. Available online: https://www.thebrainyinsights.com/report/spatial-computing-market-14188#:~:text=As%20per%20The%20Brainy%20Insights,USD%20815.2%20billion%20by%202033 (accessed on 19 August 2024).
  3. Saravanan, M.; Ajayan, J.; Parthasarathy, E.; Ramkumar, V. Architecture and Future Trends on Next Generation Networks. In Resource Management in Advanced Wireless Networks; Scrivener Publishing LLC: Beverly, MA, USA, 2025; pp. 19–43. [Google Scholar]
  4. Chanclou, P.; Simon, G.; Saliou, F.; Wang, M.; Bolloré, A. Optical access solutions in support of 5G and beyond. J. Opt. Commun. Netw. 2023, 15, C48–C53. [Google Scholar] [CrossRef]
  5. Ranaweera, C.; Lim, C.; Tao, Y.; Edirisinghe, S.; Song, T.; Wosinska, L.; Nirmalathas, A. Design and deployment of optical x-haul for 5G, 6G, and beyond: Progress and challenges. J. Opt. Commun. Netw. 2023, 15, D56–D66. [Google Scholar] [CrossRef]
  6. Hwang, I.-S.; Nikoukar, A.; Teng, C.-H.; Lai, K.R. Scalable architecture for VOD service enhancement based on a cache scheme in an Ethernet passive optical network. J. Opt. Commun. Netw. 2013, 5, 271–282. [Google Scholar] [CrossRef]
  7. Wang, J.; Qiao, C.; Li, Y.; Lu, K. On guaranteed VoD services in next generation optical access networks. IEEE J. Sel. Areas Commun. 2010, 28, 875–888. [Google Scholar] [CrossRef]
  8. Chitimalla, D.; Tornatore, M.; Lee, S.-S.; Lee, H.-H.; Park, S.; Chung, H.S.; Mukherjee, B. QoE enhancement schemes for video in converged OFDMA wireless networks and EPONS. J. Opt. Commun. Netw. 2018, 10, 229–239. [Google Scholar] [CrossRef]
  9. Shu, Z.; Deming, L.; Guangsheng, W. Research on Convergence Network of EPON and WiMAX Based on ROF. ZTE Commun. 2020, 8, 56–58. [Google Scholar]
  10. Ruan, L.; Dias, M.P.; Wong, E. Enhancing latency performance through intelligent bandwidth allocation decisions: A survey and comparative study of machine learning techniques. J. Opt. Commun. Netw. 2020, 12, B20–B32. [Google Scholar] [CrossRef]
  11. Garfias, P.; Gutiérrez, L.; Sallent, S. Enhanced DBA to provide QoS to coexistent EPON and 10G-EPON networks. J. Opt. Commun. Netw. 2012, 4, 978–988. [Google Scholar] [CrossRef]
  12. Cao, B.; Zheng, X.; Yuan, K.; Qin, D.; Hong, Y. Dynamic bandwidth allocation based on adaptive predictive for low latency communications in changing passive optical networks environment. Opt. Fiber Technol. 2021, 64, 102556. [Google Scholar] [CrossRef]
  13. Fadlullah, Z.M.; Nishiyama, H.; Kato, N.; Ujikawa, H.; Suzuki, K.-I.; Yoshimoto, N. Smart FiWi networks: Challenges and solutions for QoS and green communications. IEEE Intell. Syst. 2013, 28, 86–91. [Google Scholar] [CrossRef]
  14. Hanaya, N.; Nakayama, Y.; Yoshino, M.; Suzuki, K.-I.; Kubo, R. Remotely controlled XG-PON DBA with linear prediction for flexible access system architecture. In Proceedings of the Optical Fiber Communication Conference, San Diego, CA, USA, 11–15 March 2018; p. Tu3L. 1. [Google Scholar]
  15. Nishimoto, K.; Tadokoro, M.; Fujiwara, T.; Yamada, T.; Tanaka, T.; Takeda, A.; Inoue, T. Predictive dynamic bandwidth allocation based on the correlation of the bi-directional traffic for cloud-based virtual PON-OLT. In Proceedings of the 2017 IEEE International Workshop Technical Committee on Communications Quality and Reliability (CQR), Naples, FL, USA, 16–18 May 2017; pp. 1–6. [Google Scholar]
  16. Hernández, J.A.; Ebrahimzadeh, A.; Maier, M.; Larrabeiti, D. Learning EPON delay models from data: A machine learning approach. J. Opt. Commun. Netw. 2021, 13, 322–330. [Google Scholar] [CrossRef]
  17. Nikoukar, A.; Goudarzi, H.; Rezaei, H.; Hwang, I.-S. A predictive TDM-PON resource allocation using the ANN method based on equilibrium points of discrete dynamical systems. Opt. Fiber Technol. 2023, 81, 103587. [Google Scholar] [CrossRef]
  18. Ruan, L.; Dias, M.P.I.; Wong, E. Machine learning-based bandwidth prediction for low-latency H2M applications. IEEE Internet Things J. 2019, 6, 3743–3752. [Google Scholar] [CrossRef]
  19. IEEE 802.3ca-2020; IEEE Standard for Ethernet Amendment 9: Physical Layer Specifications and Management Parameters for 25 Gb/s and 50 Gb/s Passive Optical Network. IEEE: New York, NY, USA, 2020.
  20. Chien, W.-C.; Lai, C.-F.; Chao, H.-C. Dynamic resource prediction and allocation in C-RAN with edge artificial intelligence. IEEE Trans. Ind. Inform. 2019, 15, 4306–4314. [Google Scholar] [CrossRef]
Figure 1. Centralized SDN-based intelligent resource allocation in NG-EPON and B5G X-haul access network framework.
Photonics 12 00528 g001
Figure 2. (a) SD-OLT with immersive VoD Storage; (b) SD-ONU with traffic classification operations.
Photonics 12 00528 g002
Figure 3. Steps of backward propagation in ANN model.
Photonics 12 00528 g003
Figure 4. Overall flow of ANN integrated for dynamic bandwidth allocation.
Photonics 12 00528 g004
Figure 5. (a) EF Delay; (b) AF Delay; (c) BE Delay; (d) total end-to-end delay.
Photonics 12 00528 g005
Figure 6. BE packet drop.
Photonics 12 00528 g006
Figure 7. System throughput.
Photonics 12 00528 g007
Figure 8. AF jitter.
Photonics 12 00528 g008
Table 1. Estimating bandwidth schemes.
Reference PaperMethod/TechniqueML
[13]Constant bit rateNo
[14]Packet arrival timeNo
[15]Regression modelNo
[16]Supervised learningYes
[17]ANN through a discreet dynamical systemYes
[18]ANN through MLPYes
[Our technique]ANN through backpropagationYes
Table 2. OPNET simulation parameters.
ParametersValue
Number of SD-ONUs32
Number of wavelengths1
Downstream and upstream data rate25 Gbp/s & 10 Gbp/s
Uniform distance from SD-OLT to SD-ONU20 km
Buffer size of ONU10 Mb
Max. transmission cycle time1.0ms
Guard time5 µs
IMS-DBA computation time20 µs
Table 3. Traffic distribution ratio.
ScenarioEF%AF%BE%
IMS-DBA/LSTM-GARAA (case163)106030
IMS-DBA/LSTM-GARAA (case153)155035
IMS-DBA/LSTM-GARAA (case145)104050
Table 4. ANN parameters.
ParameterValue/Description
DatasetA historical record of 10,000 transmission cycles
Dataset Partition70% for training, 30% for testing
Learning Rate0.001
Batch Size64
Epochs50
Loss FunctionMean Squared Error (MSE)
RegularizationL2 regularization with a penalty coefficient of 0.001 is applied
Sliding Window Size5
Normalization[0, 1]
Sensitivity Factor (α)A tunable parameter, varying from 0.1 to 0.5
Threshold UpdatesEvery 20 cycles
Feedback AdjustmentBased on actual Usage and BWalloc
Disclaimer/Publisher’s Note: The statements, opinions and data contained in all publications are solely those of the individual author(s) and contributor(s) and not of MDPI and/or the editor(s). MDPI and/or the editor(s) disclaim responsibility for any injury to people or property resulting from any ideas, methods, instructions or products referred to in the content.

