Article

A Dengue Virus Detection Using Biosensor-Based Two-Dimensional Photonic Crystal Ring Resonator

1
Faculty of Electrical Engineering and Computer Science, University of Mouloud MAMMERI, Tizi Ouzou 15000, Algeria
2
ETA Laboratory, University of Mohamed El Bachir El Ibrahimi, Bordj Bou Arreridj 34030, Algeria
3
Department of Electronics, University of Mohamed El Bachir El Ibrahimi, Bordj Bou Arreridj 34030, Algeria
4
MMN Team of ETA Laboratory, University of Mohamed El Bachir El Ibrahimi, Bordj Bou Arreridj 34030, Algeria
5
Laboratoire des Technologies Avancées en Génie Electrique (LATAGE), University of Mouloud MAMMERI, Tizi Ouzou 15000, Algeria
6
Advanced High Voltage Engineering Centre, School of Engineering, Cardiff University, Queen’s Buildings, The Parade, Cardiff CF24 3AA, UK
*
Author to whom correspondence should be addressed.
Photonics 2025, 12(5), 514; https://doi.org/10.3390/photonics12050514
Submission received: 22 April 2025 / Revised: 12 May 2025 / Accepted: 17 May 2025 / Published: 21 May 2025
(This article belongs to the Section Biophotonics and Biomedical Optics)

Abstract

This study proposes a novel two-dimensional photonic crystal ring resonator for detecting dengue-induced changes in blood components such as platelets, haemoglobin, and plasma. By monitoring shifts in the central wavelength linked to refractive index variations, the structure offers highly sensitive and accurate detection. The Lorentzian peak cavity exhibits a high-quality factor, achieving sensitivity up to 1800 nm/RIU, underscoring its potential as a precise diagnostic tool against dengue.

1. Introduction

Photonic crystals (PhCs) are optical materials that possess a periodic modulation in refractive index at a length scale on the order of light wavelength, forming a so-called photonic bandgap (PBG), in which the propagation of light of certain wavelengths is spatially forbidden. This special attribute makes PhCs very promising in the regulation of light, such as guiding, filtering, reflecting, and bending specific wavelengths. This control originates from the interference of waves in their periodically modulated structure, which allows for shaping light-matter interactions to yield near-zero group velocity around their frequencies and the confinement and manipulation of input light [1,2].
The advantages of photonic crystals in sensor design stem from their high precision in controlling light, tunable optical properties through structural adaptation, and compactness suitable for integration into small devices. PhCs exhibit intense optical responses to external stimuli such as refractive index changes, lattice spacing variations, or molecular binding events, which can be transduced into measurable optical signals like shifts in Bragg diffraction spectra or colour changes visible to the human eye. These features make them highly sensitive label-free sensors for applications including biochemical assays, environmental monitoring, and point-of-care diagnostics. However, challenges remain in the complexity and cost of fabricating three-dimensional PhCs with defect-free periodicity, as well as material losses and imperfections that can degrade sensor performance [3,4,5].
Dengue fever, an infection spread by mosquitoes and caused by the dengue virus (DENV), continues to pose a major threat to health across the globe in warm, humid areas. Each year, it affects between 100 and 400 million people, putting a huge strain on healthcare systems around the world [1]. The illness shows up in many ways, from no symptoms at all or a mild fever to severe dengue. This serious form leads to leaky blood vessels, bleeding, and damage to organs, which can kill if not treated quickly [2]. Despite decades of research, there is no specific antiviral treatment for dengue, making early detection and accurate diagnosis critical to reducing morbidity and mortality [3,4].
Such traditional dengue diagnostic methods, such as enzyme-linked immunosorbent assay (ELISA) [5] and polymerase chain reaction (PCR) [6], have drawbacks regarding expenditure, intricacy, and time-to-outcomes, especially in resource-limited settings [7]. These challenges led to the emergence of new diagnostic technologies that are fast and affordable. Among these, photonic crystal-based sensors have emerged as a promising tool for disease detection due to their ability to measure minute changes in the refractive index of biological samples [8,9].
For the early detection of dengue, this study proposes an innovative diagnostic technology using photonic crystals to analyse biological components such as infected platelets, haemoglobin, and plasma. The proposed model takes advantage of the unique optical properties of photonic crystals, which have a Lorentzian peak cavity known for their symmetric, bell-shaped profile centred around a resonance frequency with a high-quality factor that allows for the precise measurement of changes in the refractive index and central wavelength shifts. These changes indicate dengue-related changes in biological samples, enabling highly sensitive and accurate detection [10]. The system achieves a sensitivity of approximately 1800 nm/RIU, which demonstrates its potential as a transformative tool for dengue diagnosis.
A significant advancement in the field is the integration of photonic crystal-based sensors in dengue diagnostics [11]. This technology has the potential to improve patient outcomes, enhance disease surveillance, and reduce the global burden of dengue by providing rapid and accurate detection of dengue-related changes in blood components. However, challenges such as the need for precise manufacturing, calibration, and validation with clinical samples will need to be addressed to ensure its scalability and practical application in a variety of settings [12].
In this paper, we present the development and evaluation of a photonic crystal-based diagnostic system for dengue detection. It detects dengue-related changes in biological components such as infected platelets, haemoglobin, and plasma, with their refractive indices in the human body. To evaluate the band gap, quality factor, and power efficiency of the biosensor, mainly two important methods are used, the Plane Wave Expansion method and the FDTD method [13,14,15,16,17]. Here, we will detect the transmittance spectra of normal blood components, haemoglobin, platelets, and plasma, with respect to the infected blood components.
The structure of the paper is as follows. In Section 2, the structure and design that support the proposed method are described in detail. After that, in Section 3, an analysis of results is given, including Central wavelength shift according to refractive index, refractive index distribution, and normalized transmission for different wavelengths of platelets, haemoglobin, and plasma. Finally, Section 4 aims to highlight the main conclusions.

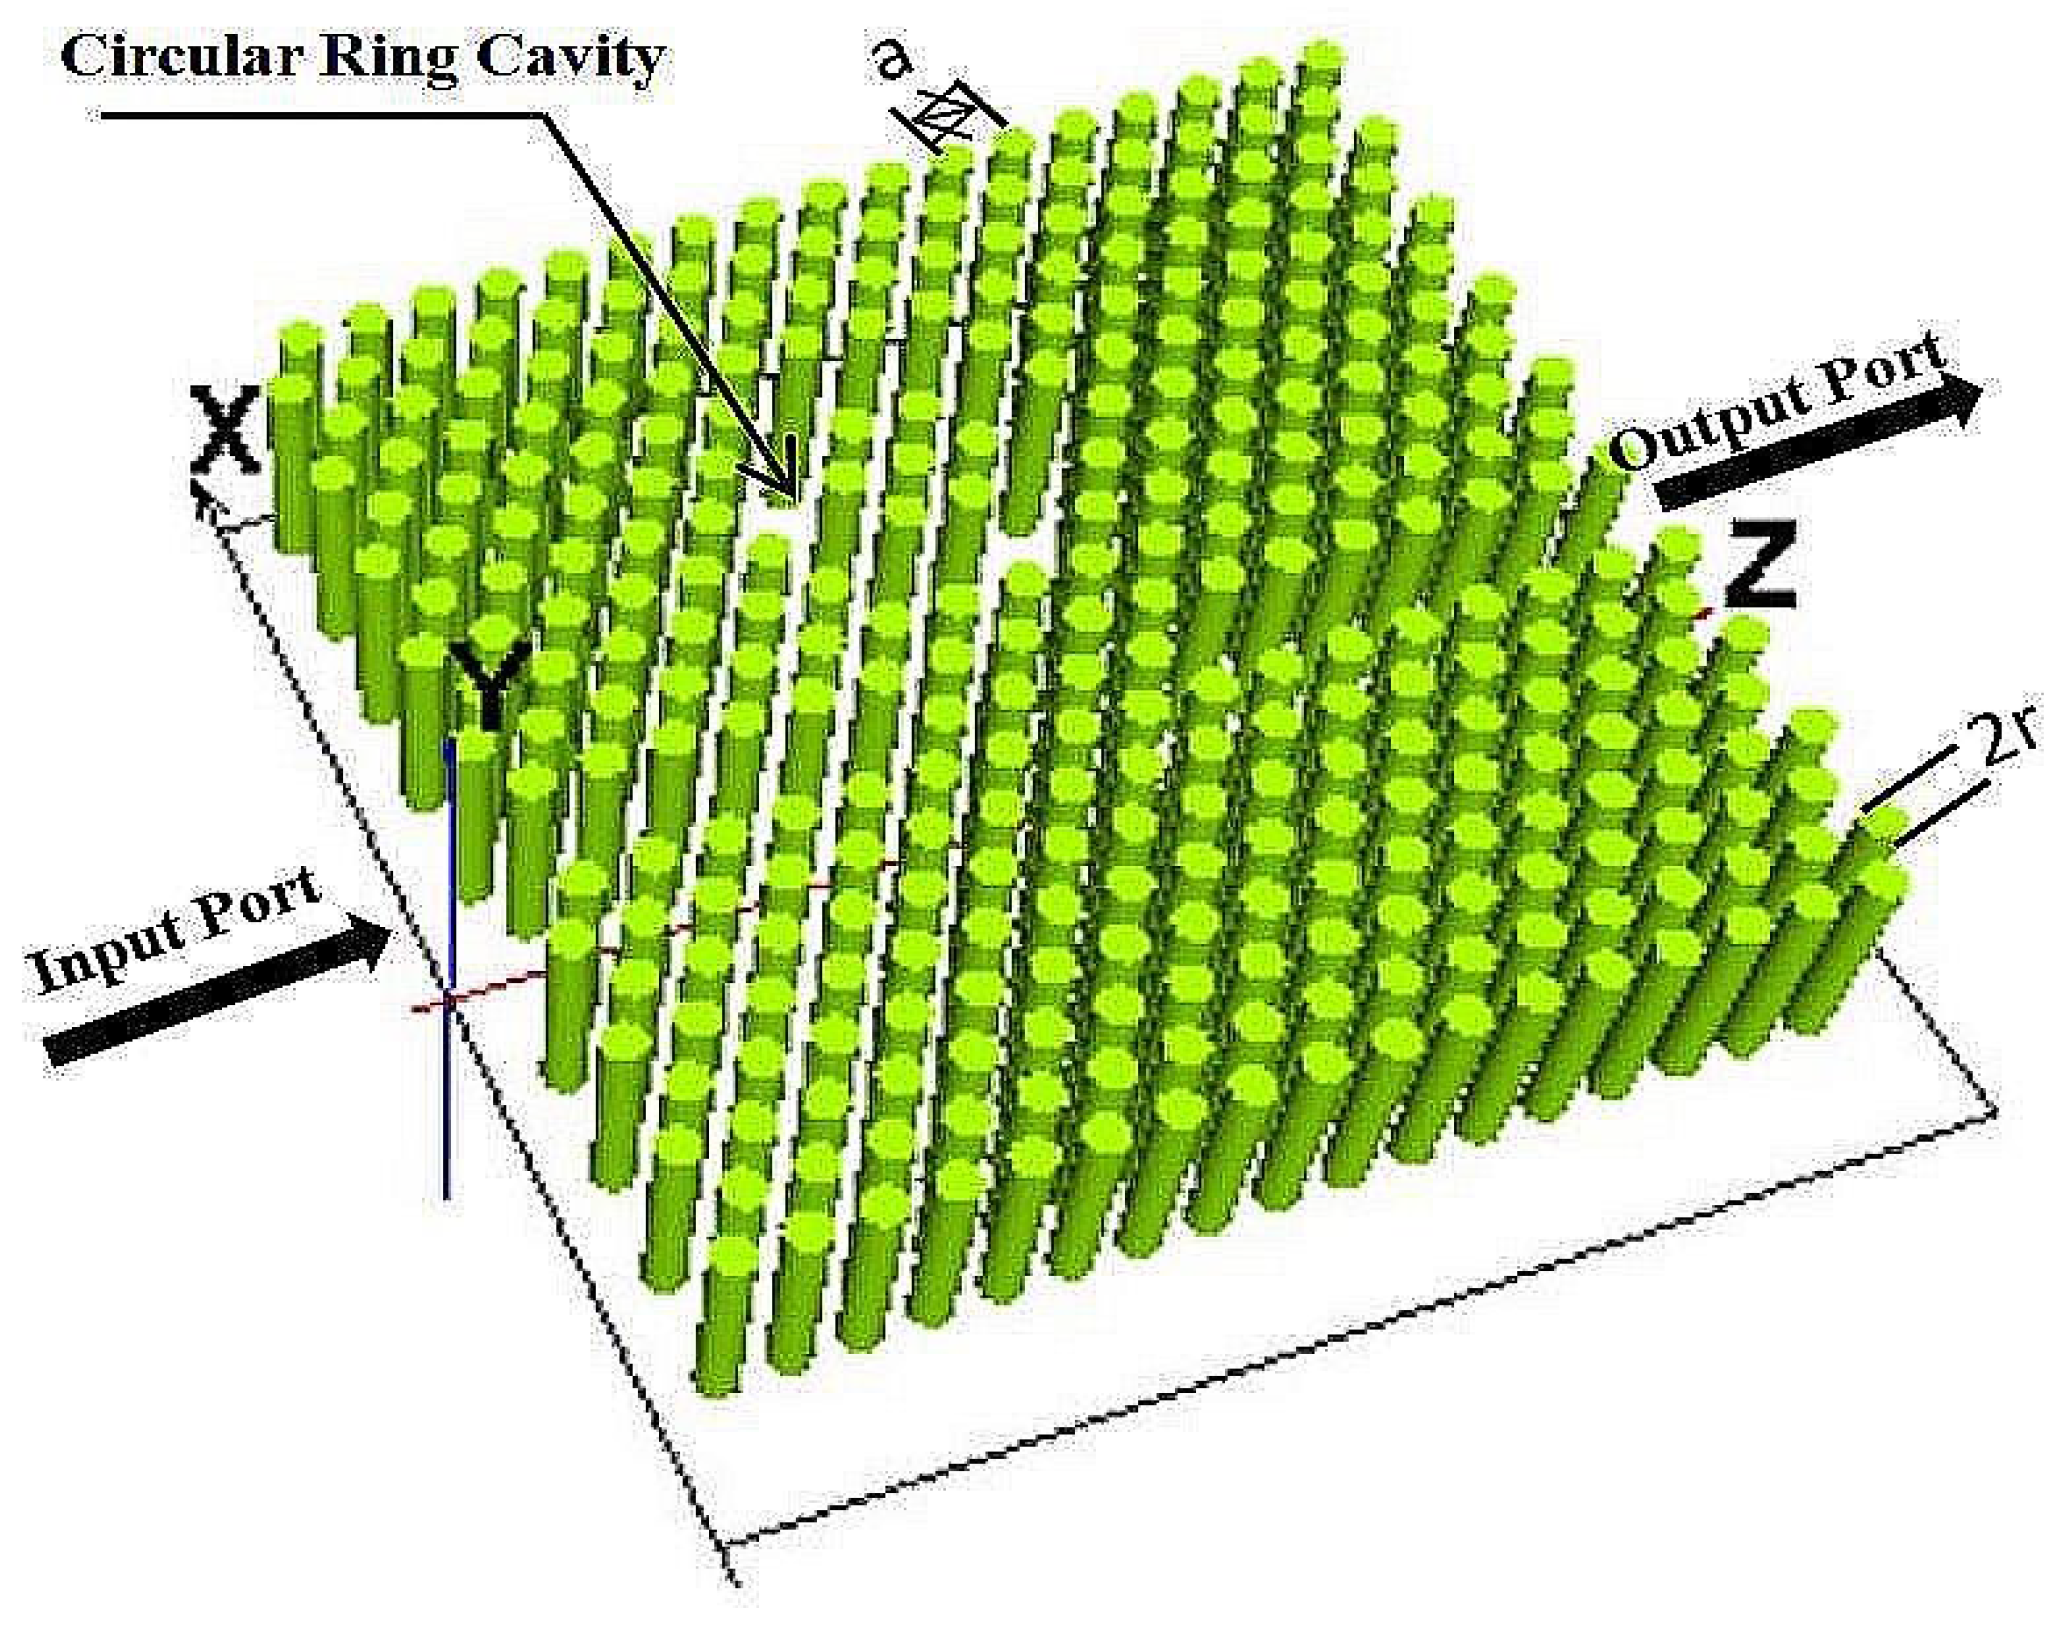
2. Structure and Design

The biosensor is formed by a two-dimensional photonic crystal ring resonator coupled with two waveguides in order to detect the dengue fever virus in blood components. The structure is composed of circular silicon with refractive index rods of 3.46 immersed in an air background. The opto-geometric parameters, such as the radius and lattice constant of the rods, are equal to 170 nm and 540 nm, respectively.
Figure 1 and Figure 2 represent the design structure and the refractive index distribution, respectively.

3. Band Gap Calculation

Both the transmission spectra and field distribution are obtained through the complementary roles of the Plane Wave Expansion (PWE) method and the OptiFDTD simulator from the Optiwave package, which is a finite-difference time-domain (FDTD) software based on the numerical solution of Maxwell’s equations [18,19,20]. The PWE method is primarily used to calculate the band structure, allowing researchers to identify photonic bandgaps—frequency ranges where light cannot propagate by computing ωn(k) which represents how the frequency (ω) of electromagnetic (EM) waves depends on the wave vector (k) along high-symmetry directions in the Brillouin zone. For a 2D triangular lattice photonic crystal, the standard Brillouin zone path is Γ→ M→ K→ Γ.
This path captures the essential physics, including possible photonic band gaps [21].
Afterwards, the FDTD method is used to calculate the power transmission spectrum. The applied PWE method reveals two photonic band gaps; the selected one lies between 1.04 µm and 1.33 µm, as shown in Figure 3.

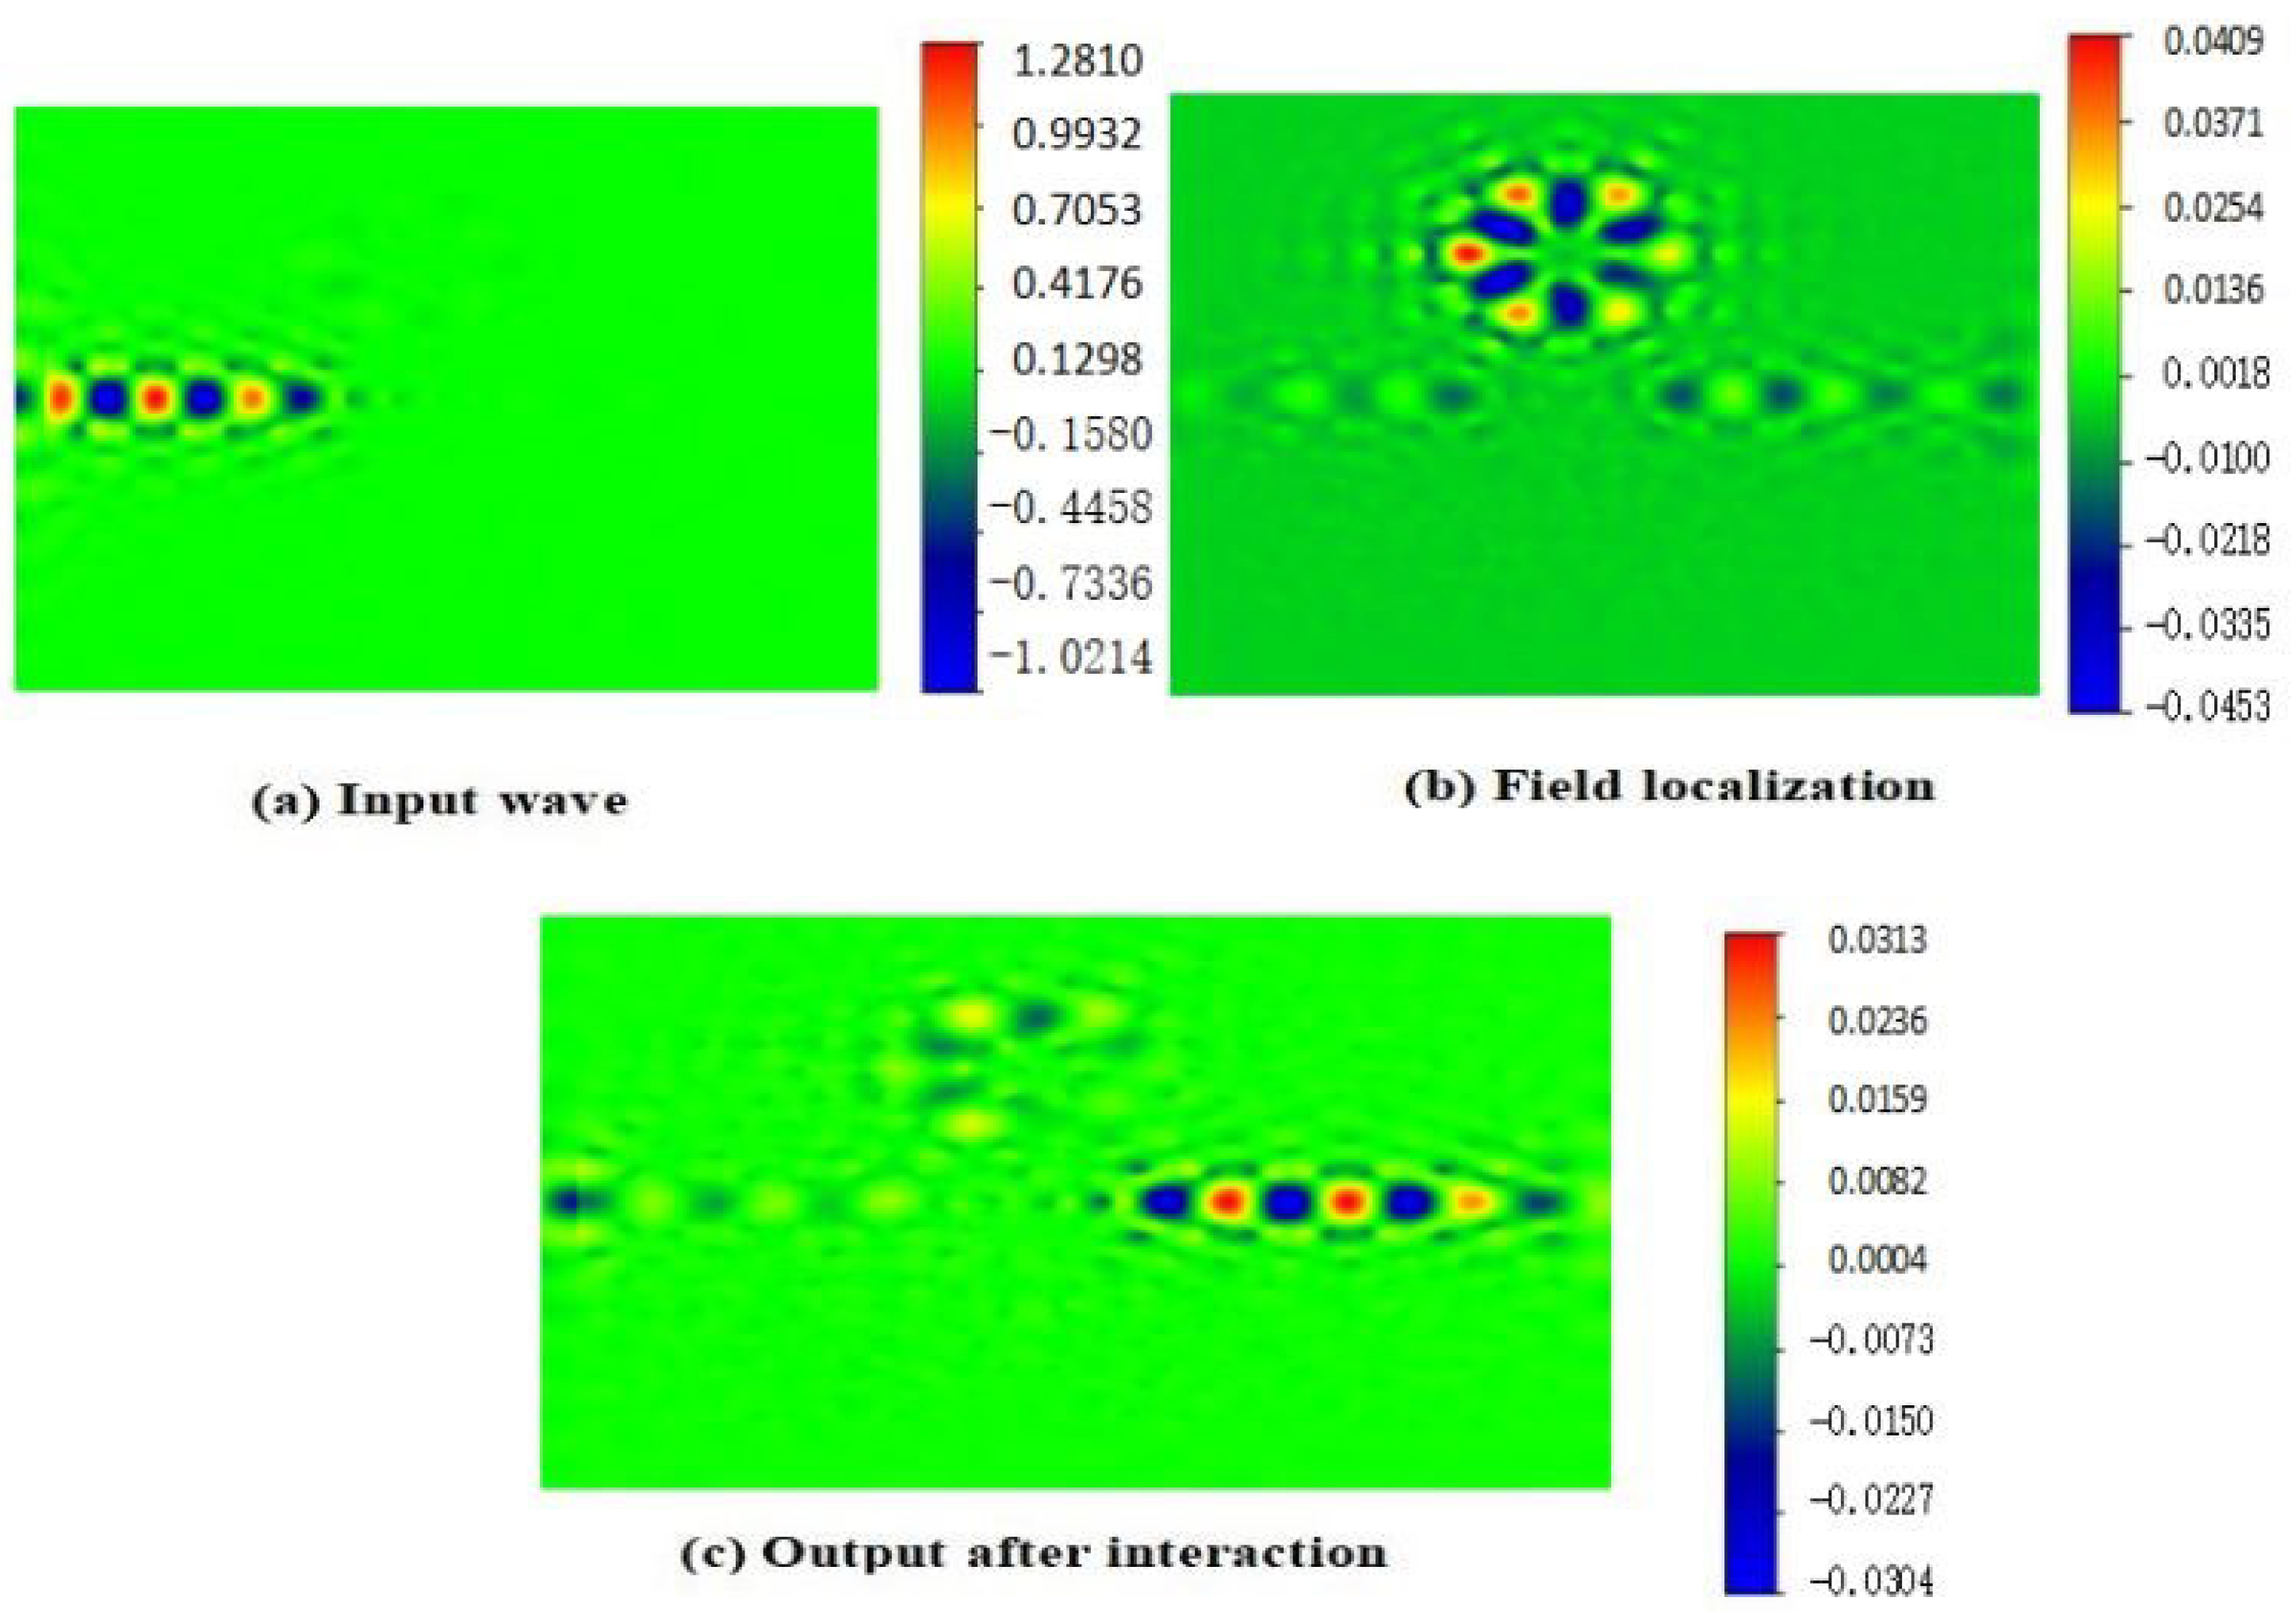
4. Distribution Field

The structure is surrounded by a Perfectly Matched Layer (PML), which serves as an absorbing boundary condition to truncate the computational domain and prevent back reflections from the boundaries [22].
The mesh size is taken as Δx = Δy = 0.05 µm, where the maximum time step Δt is approximately
Δt ≈ 1.67 × 10⁻¹⁶ s. This value responds to the Courant Stability Condition, where
t 1 C 1 x 2 + 1 y 2
c: Speed of light in the medium (for free space c ≈ 3 × 10⁸ m/s).
The structure has been excited with a Gaussian pulse centred at 1.25909 µm with TE polarisation.
Figure 4 represents the distribution field at different simulation times, showing (a) the directional wave propagation before interaction, (b) significant energy localisation within the cavity with high-intensity regions, and (c) a structured interference pattern indicating resonance.
The electric field of the bus waveguide is fully transferred to the circular ring cavity because it has been blocked by the four pillars in the middle of the structure, where it has been coupled with the resonant cavity. Hence, the signal reaches the output port while some of it is reflected to the input, which reduces the output power (95%).

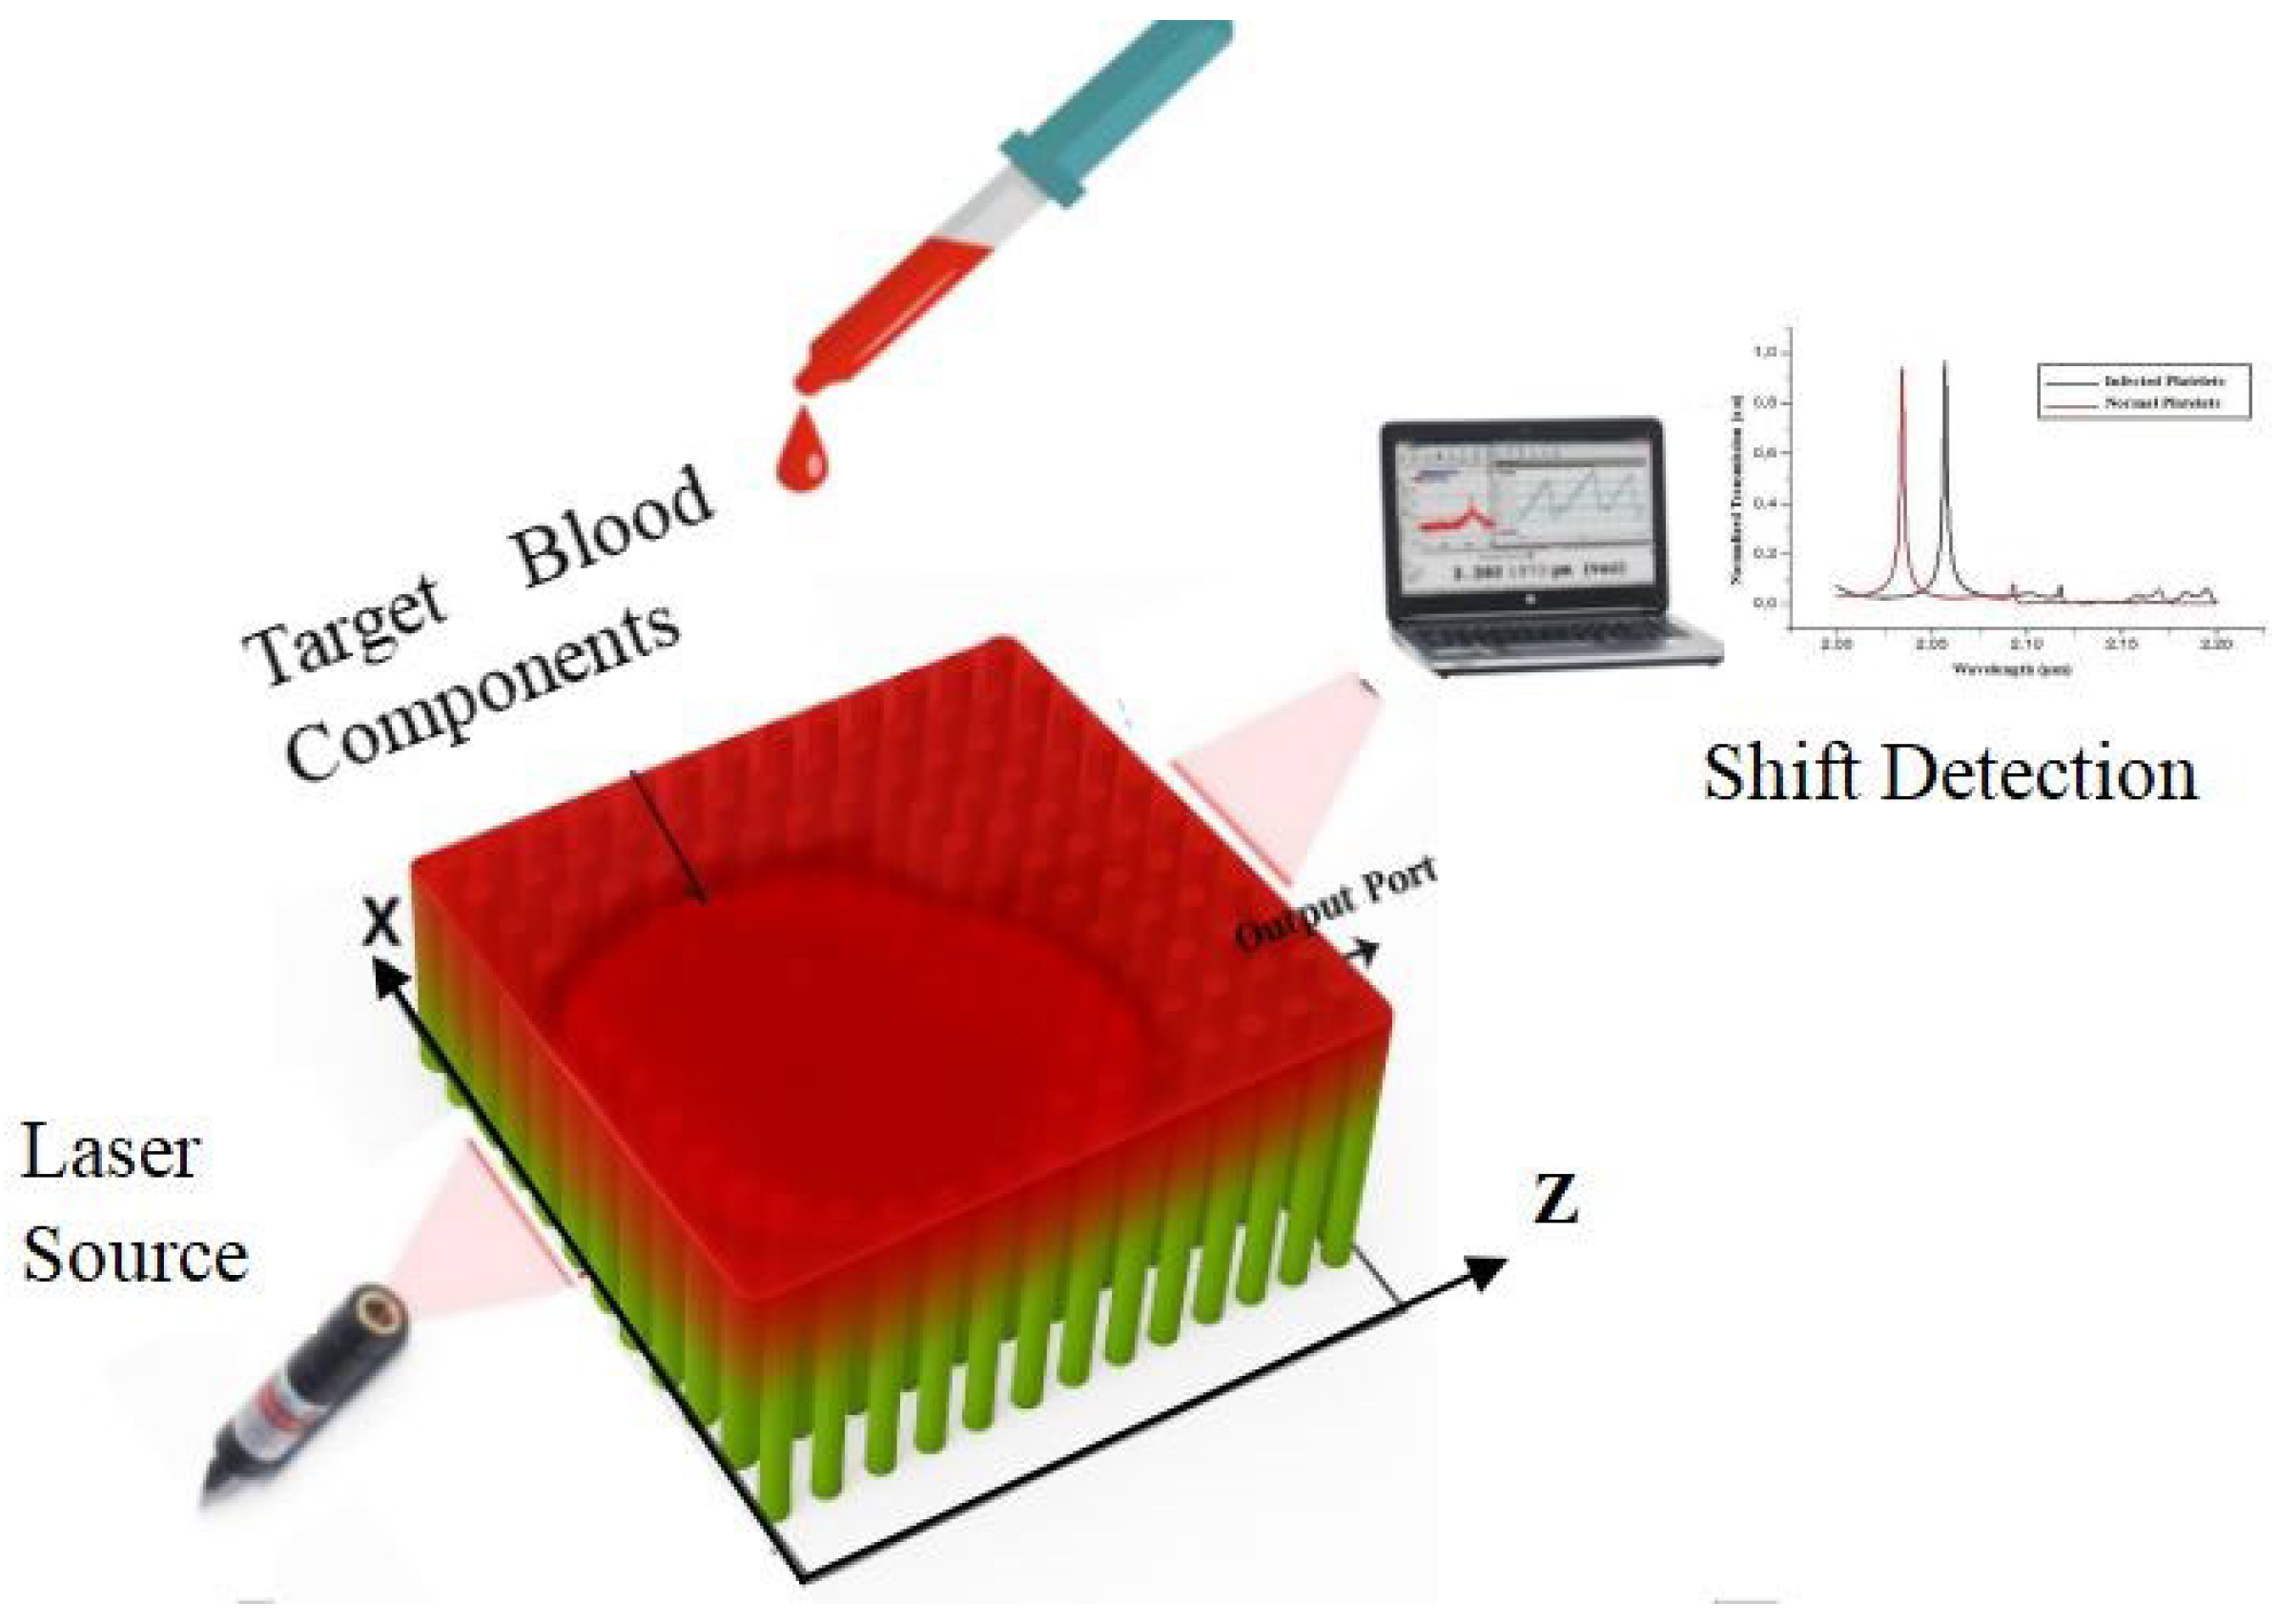
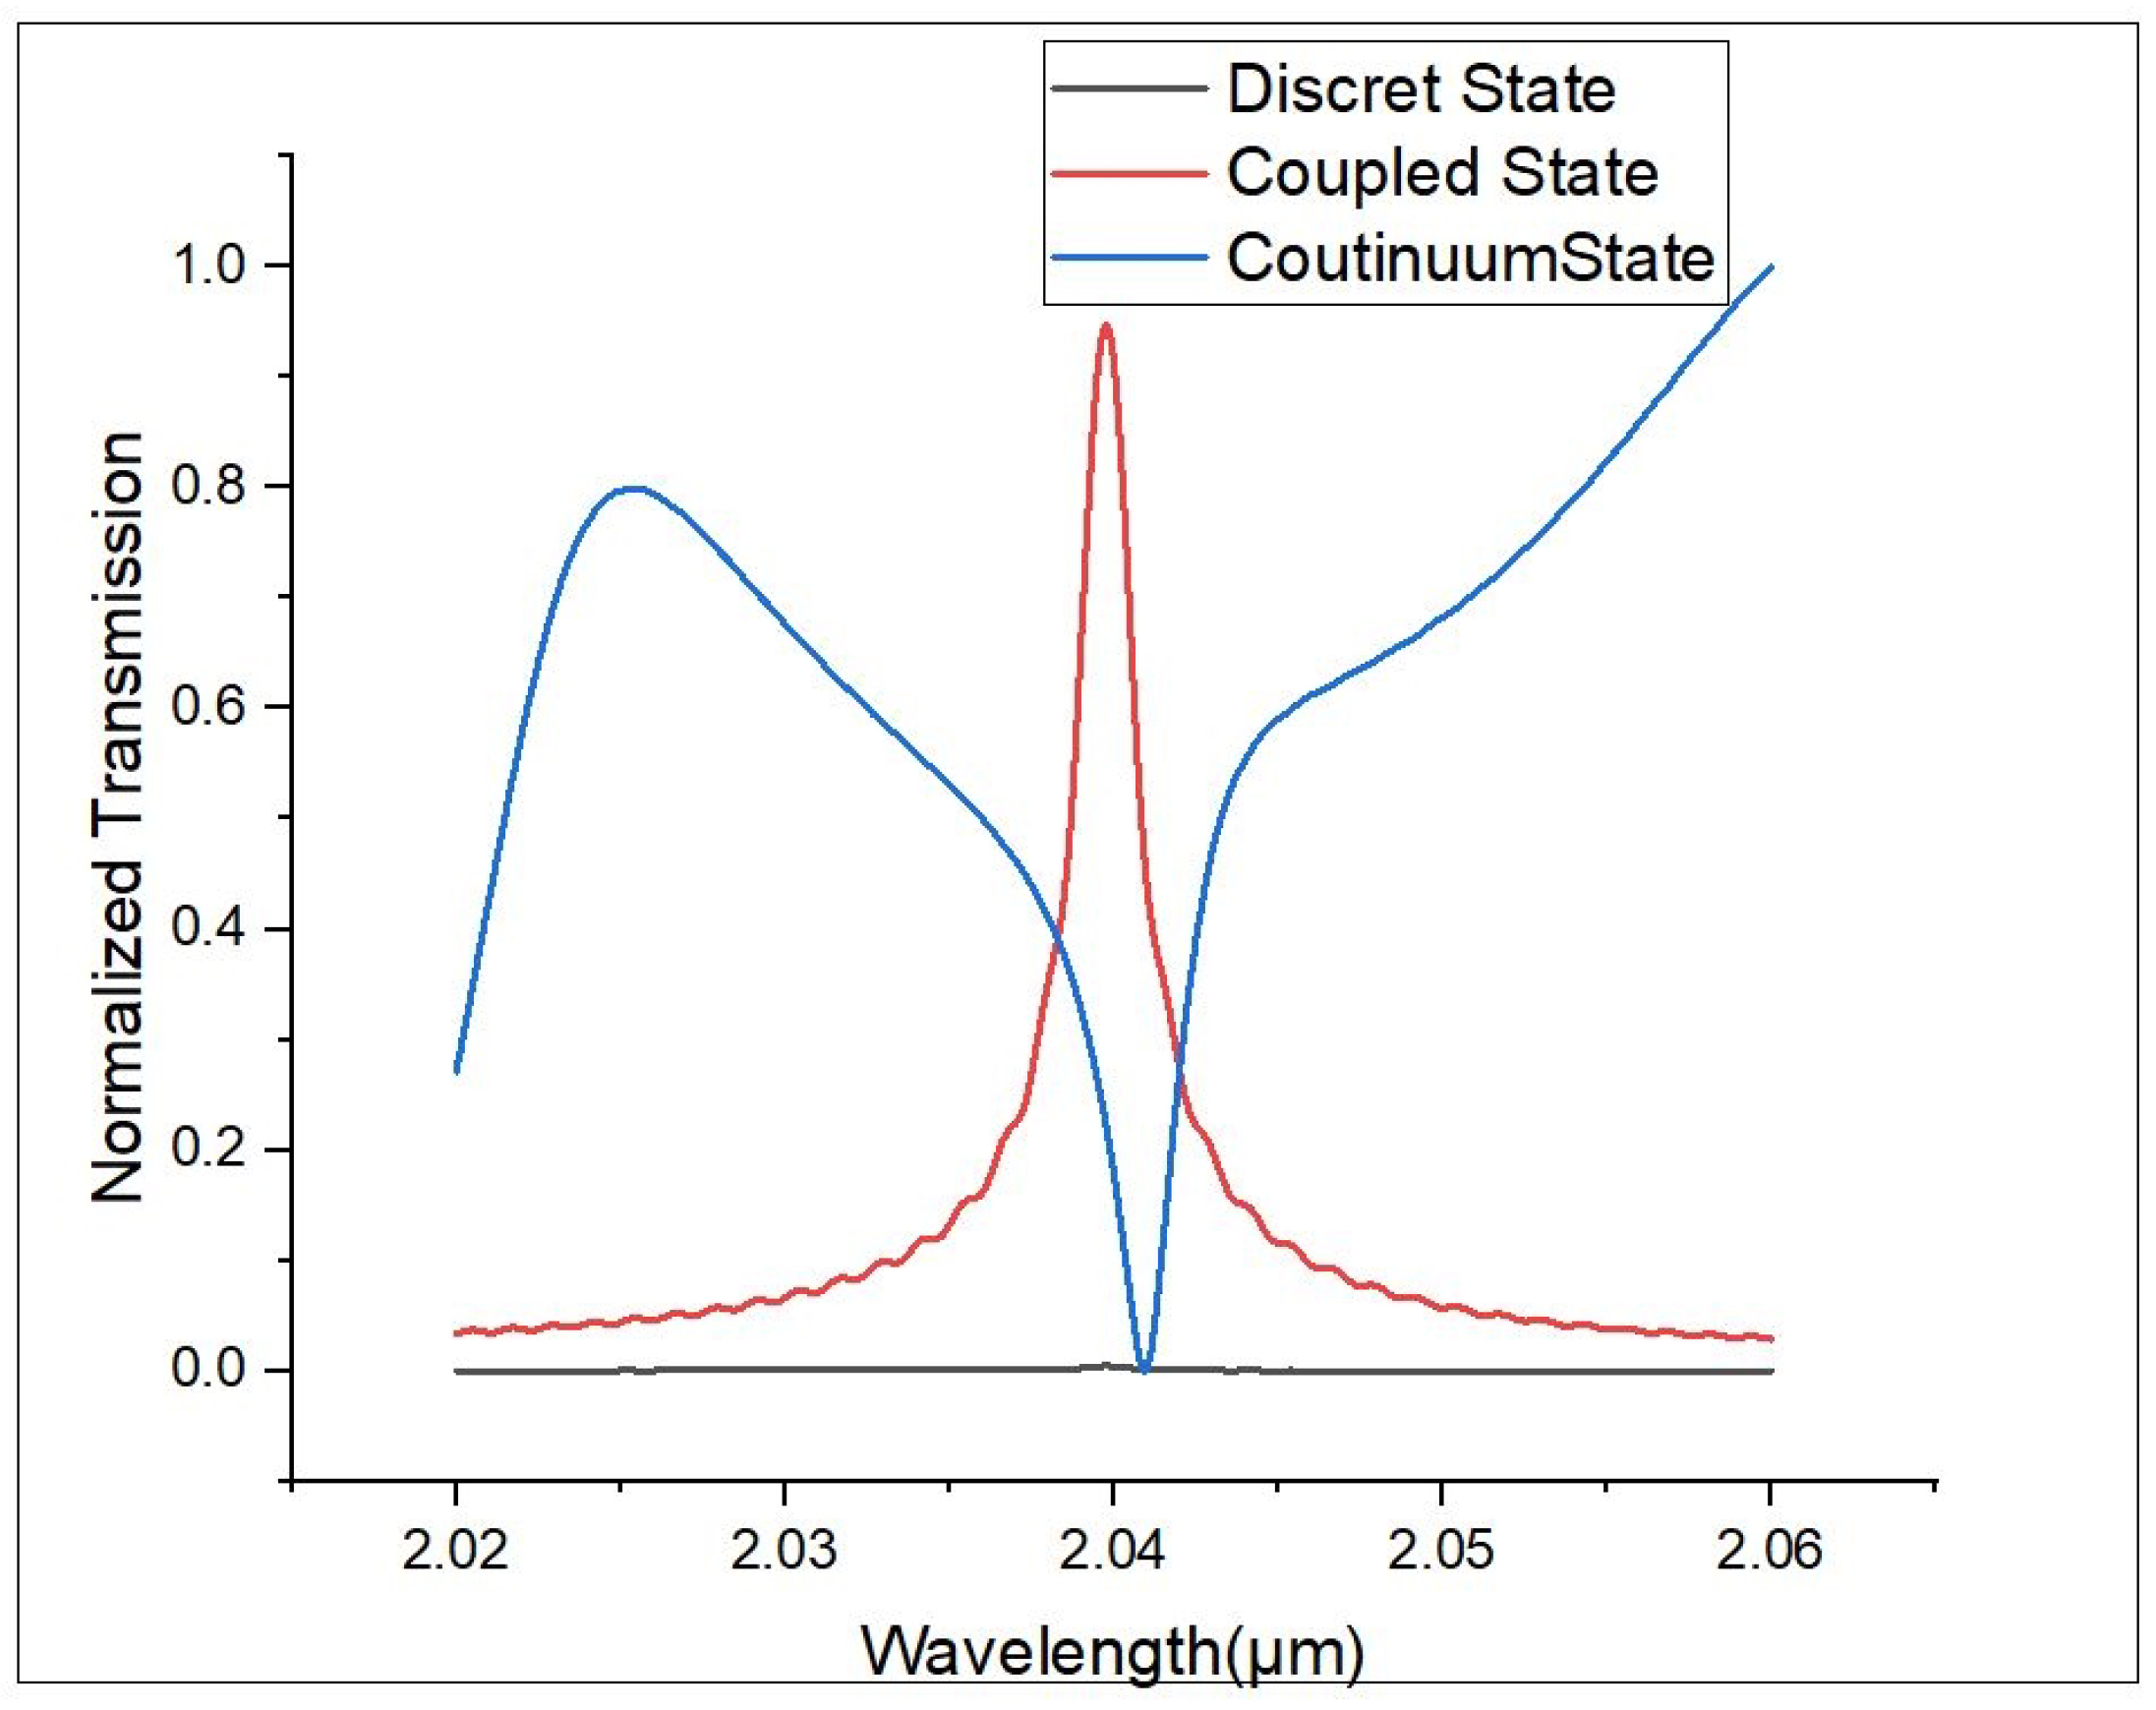
5. Detection Mechanism

In patients infected with dengue fever, the refractive index (RI) of blood components changes due to plasma leakage, haemoconcentration, and thrombocytopenia, which directly affect plasma, haemoglobin, and platelets. The typical refractive indices for healthy individuals and dengue-infected patients are approximately: plasma—1.337 (healthy) to 1.35 (infected), haemoglobin—1.357 to 1.36, and platelets—1.39 to 1.4 [23].
The structure has been excited with a normal incidence angle (0°) of a Gaussian pulse centred at 1.25909 µm with TE polarisation using a laser source where is placed approximately 0.5 µm away from the input facet of the photonic crystal to ensure efficient coupling and infiltrated with healthy and infected human blood components which are (platelets, haemoglobin, and plasma).
After that, using a spectrometer, the transmission spectrum shift between healthy and infected blood components has been detected. Figure 5 explains the detection mechanism.
In this study, we evaluate the intrinsic optical performance of the device under standard ambient conditions, namely, room temperature and atmospheric pressure.

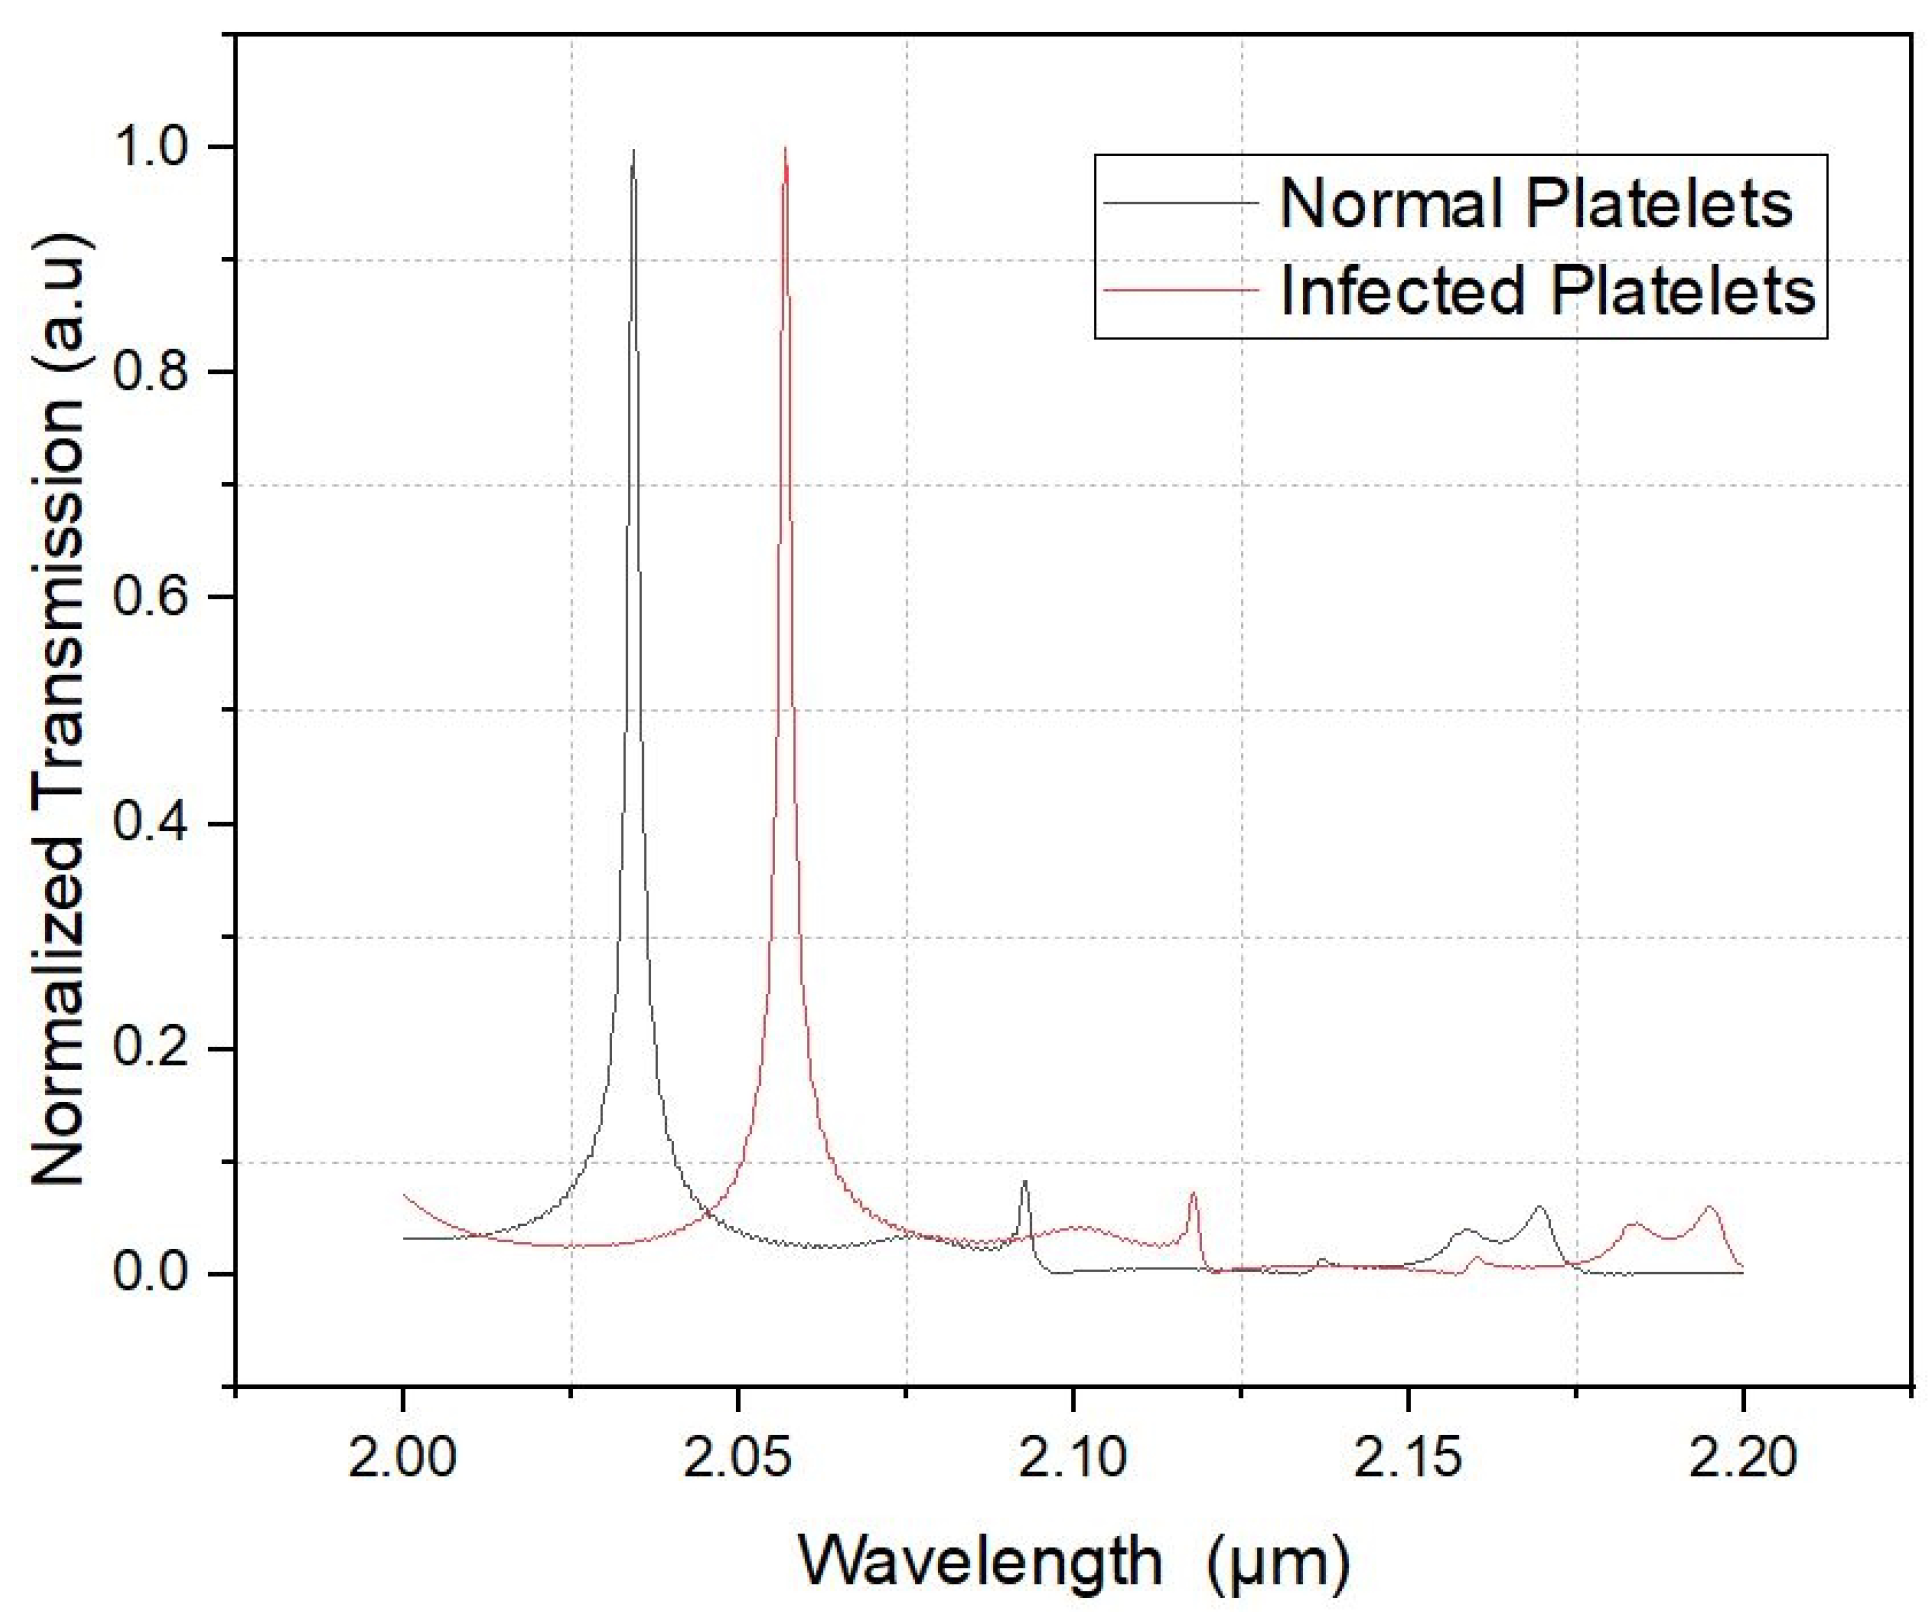
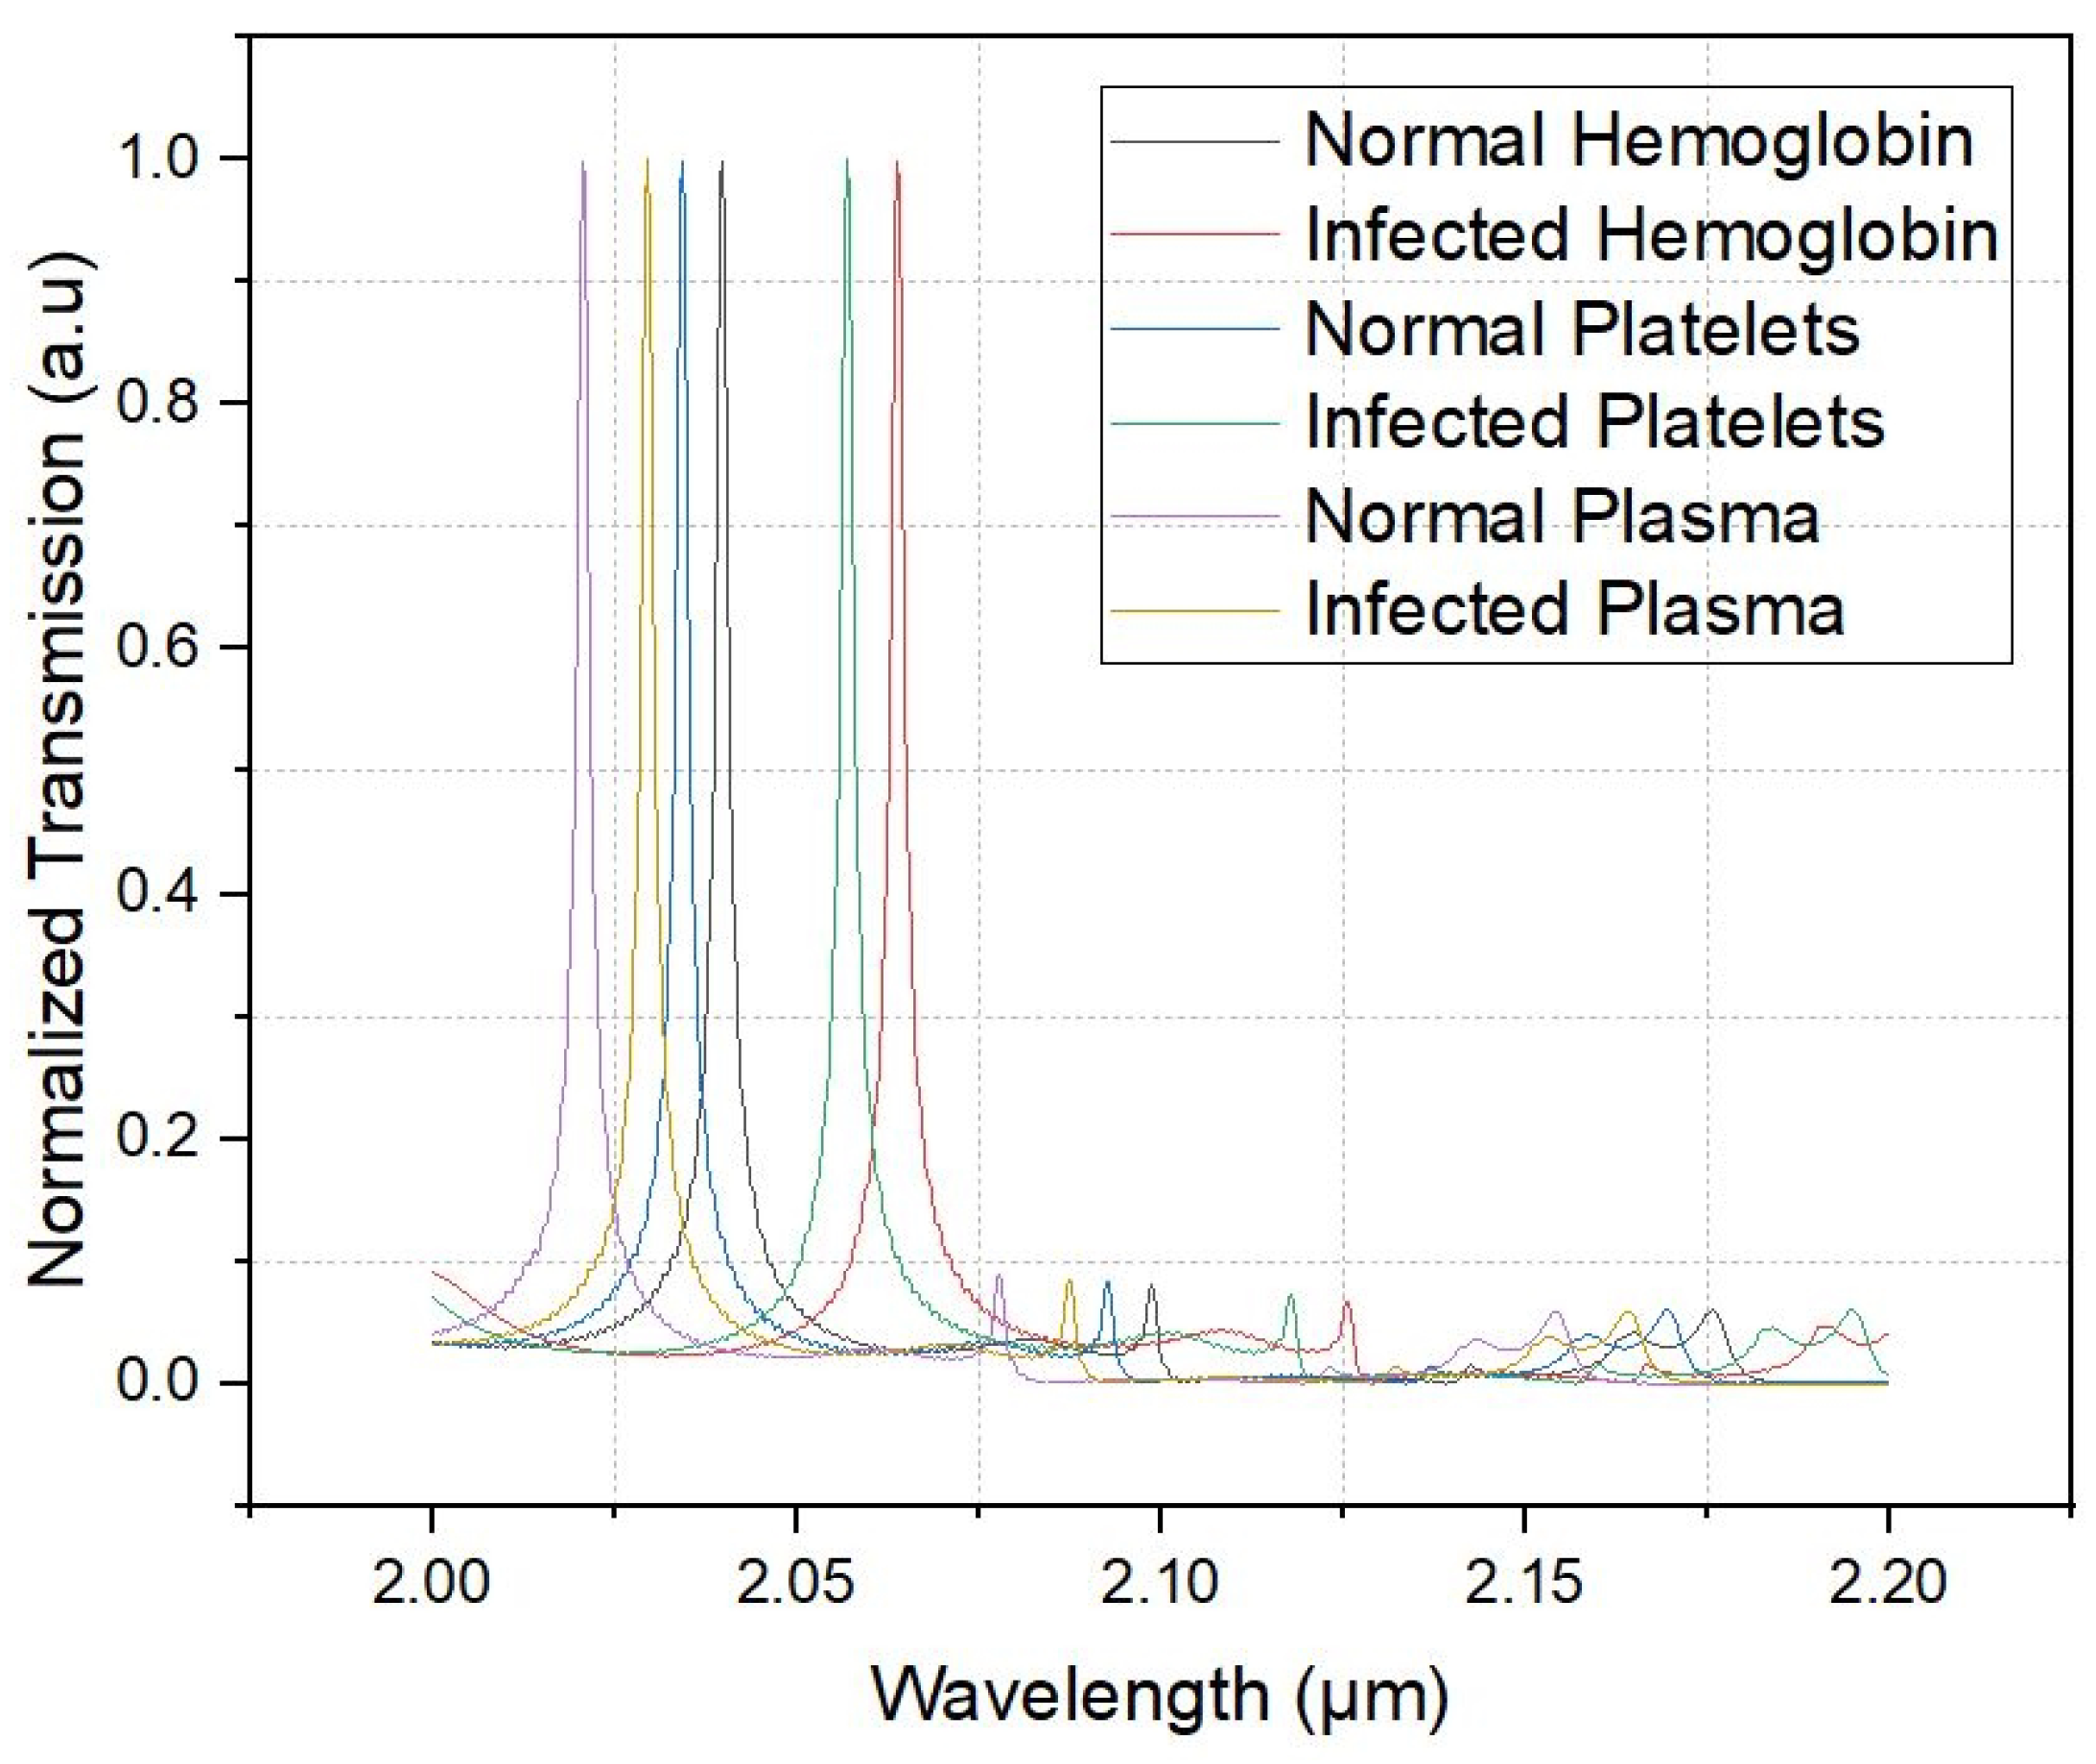
6. Results and Discussion

The transmission spectrum shifts between infected and healthy components detected at the output using a photodetector appears as a symmetrical Lorentzian cavity with a high-quality factor of 943.903. Due to the resonator shapes which allow a strong localisation of light and increase interaction between light and matter, the sensitivity has reached a highest-level of 1800 nm/RIU with haemoglobin detection.
Figure 6 illustrates the transmission spectra of normal Blood platelets Vs. Infected blood platelets at refractive indices 1.337 and 1.35, respectively. A distinct shift in the transmission peak is observed, with normal platelets exhibiting a central wavelength at 2.02083 µm and infected platelets at 2.0297 µm. This spectral shift corresponds to a calculated sensitivity of approximately 682.3 nm/RIU, indicating a strong, though not optimal, sensor response, likely due to partial mode confinement in the resonator. The corresponding efficiency of normal and infected blood platelets was recorded as 95% and 93%, respectively.
Figure 7 illustrates the transmission spectra of normal Blood Haemoglobin Vs. Infected blood Haemoglobin at refractive indices 1.357 and 1.36, respectively. The transmission peaks of normal and infected blood Haemoglobin are centred at wavelengths 2.03437 µm and 2.03998 µm, respectively. This spectral shift corresponds to a calculated sensitivity of approximately 1870 nm/RIU, confirming a resonance amplification effect possibly driven by critical coupling at this refractive index. The output efficiency of normal and infected blood Haemoglobin was recorded as 97% and 95%, respectively.
Figure 8 illustrates the transmission spectra shift of plasma as the refractive index increases from 1.39 to 1.40, resulting in a spectral displacement from 2.05679 µm to 2.06427 µm. This shift (Δλ = 7.48 nm) corresponds to a calculated sensitivity of 748 nm/RIU, which is lower than that observed for haemoglobin. The reduced sensitivity may be attributed to less efficient optical mode confinement or a weaker interaction between the photonic mode and the plasma analyte. The output efficiency of normal and infected RBC was recorded as 95% and 91%, respectively.
Figure 9 illustrates the total normalised transmission of blood components (platelets, haemoglobin, and plasma) in both normal and infected states across the infrared range of 2.00 to 2.20 µm. Distinct transmission peaks are observed between 2.02083 and 2.06427 µm. Infected samples exhibit spectral shifts and variations in intensity, suggesting molecular and structural changes due to infection. Notably, Infected samples exhibit broader and shifted peaks compared to normal ones, with haemoglobin and platelets showing the most pronounced changes. This spectral fingerprinting reinforces the sensor’s ability to discriminate between multiple analytes and supports multi-biomarker diagnosis. The increased absorption observed in infected samples likely reflects protein denaturation and structural aggregation, providing a biophysical basis for the altered interaction with infrared light.
Figure 10 represents the central wavelength shift according to the refractive index value. The curve consists of three straight lines, where their inclination represents the sensitivity. The straight in the coloured area is considered the most inclined one and therefore the most sensitive; and this is confirmed by the highest bar in Figure 10. So, it can be said that this sensor is very sensitive in the refractive index range between 1.357 and 1.36, which corresponds to haemoglobin refractive index detection. This makes it possible to apply this sensor to detect anaemia in the blood.
Figure 11 shows a variable system sensitivity as a function of the refractive index, with a dominant peak at n = 1.36 (exceeding 1800 nm/RIU), indicating strong resonance. Other indices (1.35, 1.39 and 1.40) exhibit lower sensitivities, while a lack of significant response is observed between 1.37 and 1.38. This behaviour suggests system optimization for specific refractive indices, potentially useful in biosensing. However, such variability could pose a challenge for applications requiring a linear response. A deeper analysis of optical interactions would help explain these abrupt variations.
Table 1 presents the sensitivity and quality factor (Q) of blood components in dengue cases for different refractive index values. The analysis highlights a strong variation in sensitivity, with a peak at n = 1.36 reaching 1870 nm/RIU. This value indicates a highly amplified sensor response at this refractive index; other refractive indices, such as n = 1.35 and n = 1.357, exhibit significantly lower sensitivities of 682.307 nm/RIU and 667.142 nm/RIU, respectively. Similarly, indices n = 1.39 and n = 1.4 display lower sensitivities of 560.333 nm/RIU and 748 nm/RIU, suggesting a weaker sensor response for these values. The quality factor (Q), which represents the efficiency and sharpness of resonance, is calculated as λ/∆λ (resonant wavelength/full width half maximum). It reaches its maximum at n = 1.357 with Q = 943.309, indicating a more defined resonance with lower energy losses. However, this does not correspond to the highest sensitivity, suggesting that the optimal balance between quality and sensitivity does not necessarily occur at the refractive index with the highest Q. This suggests the optical sensor is particularly responsive at n = 1.36, which may correspond to a specific signature of blood components affected by dengue.
To explain the sharp rise in sensitivity noted during haemoglobin sensing, Figure 12 illustrates the normalised transmission spectrum of a coupled system consisting of three states: a discrete state, a coupled state, and a continuum state. The coupled state appears as a sharp, amplified peak around 2.04 µm, indicating strong energy localisation, while the continuum state exhibits a more gradual increase in transmission. That leads to the critical coupling resonator, which occurs when all the light from the bus waveguide is coupled into the ring. Intuitively explained, the light incoming from the ring is just right to completely destructively interfere with the light in the input bus waveguide, causing all the light to couple into the resonator. The critical coupling resonator makes this resonance highly sensitive to environmental changes, and this explains the sudden increase in sensitivity observed during haemoglobin detection [24].
Table 2 provides a comprehensive performance comparison between our 2D photonic crystal (PhC) ring resonator sensor and current dengue detection technologies. Our design achieves breakthrough performance with a record 1870 nm/RIU sensitivity, outperforming 1D photonic crystals (1200 nm/RIU) and SPR sensors (680 nm/RIU). The ultra-high-quality factor (Q = 943,309) enables the detection of minute refractive index variations, while the optimized detection range (2.0–2.2 μm) specifically targets dengue biomarkers. Unlike conventional approaches, our sensor leverages critical coupling phenomena to maximize light-matter interaction while minimizing noise. This analysis establishes our platform as a cutting-edge solution for early dengue diagnosis, combining unmatched sensitivity with molecular specificity.

7. Conclusions

In conclusion, this study presents a diagnostic technique using photonic crystal sensors to facilitate the early detection of dengue fever. This approach utilizes infected components such as platelets, haemoglobin, and plasma that incorporate changes in refractive index. Therefore, it achieves an unparalleled sensitivity of about 1800 nm/RIU, making the detection of any changes related to the dengue virus swift and accurate. It has been shown that this sensor has a great sensitivity to haemoglobin compared to other components due to the critical coupling resonator at its refractive index, which opens the door to the possibility of applying it to detect anaemia in the blood.

Author Contributions

Conceptualization, A.H.; Methodology, N.D.; Validation, S.B. All authors have read and agreed to the published version of the manuscript.

Funding

This research received no external funding.

Institutional Review Board Statement

Not applicable.

Informed Consent Statement

Not applicable.

Data Availability Statement

The original contributions presented in this study are included in the article. Further inquiries can be directed to the corresponding author.

Conflicts of Interest

The authors declare no conflict of interest.

References

  1. Tang, G.; He, X.; Shi, F.; Liu, J.; Chen, X.; Dong, J. Topological Photonic Crystals: Physics, Designs, and Applications. Laser Photonics Rev. 2022, 16, 2100300. [Google Scholar] [CrossRef]
  2. Butt, M.; Khonina, S.; Kazanskiy, N. Recent advances in photonic crystal optical devices: A review. Opt. Laser Technol. 2021, 142, 107265. [Google Scholar] [CrossRef]
  3. Maleki, M.J.; Soroosh, M.; Akbarizadeh, G. Photonic Crystal Resonators in Designing Optical Decoders. J. Optoelectron. Nanostructures 2023, 8, 1–24. [Google Scholar] [CrossRef]
  4. Bouaouina, M.S.; Lebbal, M.R. All optical photonic crystal encoder based on nonlinear Kerr effect with ultrahigh contrast ratio and low threshold power. Opt. Quantum Electron. 2023, 55, 867. [Google Scholar] [CrossRef]
  5. Bhatt, S.; Gething, P.W.; Brady, O.J.; Messina, J.P.; Farlow, A.W.; Moyes, C.L.; Drake, J.M.; Brownstein, J.S.; Hoen, A.G.; Sankoh, O.; et al. The global distribution and burden of dengue. Nature 2013, 496, 504–507. [Google Scholar] [CrossRef]
  6. Guzman, M.G.; Harris, E. Dengue. Lancet 2015, 385, 453–465. [Google Scholar] [CrossRef]
  7. Guzman, M.G.; Gubler, D.J.; Izquierdo, A.; Martinez, E.; Halstead, S.B. Dengue infection. Nat. Rev. Dis. Prim. 2016, 2, 16055. [Google Scholar] [CrossRef]
  8. Frazer, J.L.; Norton, R. Dengue: A review of laboratory diagnostics in the vaccine age. J. Med Microbiol. 2024, 73, 001833. [Google Scholar] [CrossRef]
  9. Gan, S.D.; Patel, K.R. Enzyme Immunoassay and Enzyme-Linked Immunosorbent Assay. J. Investig. Dermatol. 2013, 133, 1–3. [Google Scholar] [CrossRef]
  10. Kanagawa, T. Bias and artifacts in multitemplate polymerase chain reactions (PCR). J. Biosci. Bioeng. 2003, 96, 317–323. [Google Scholar] [CrossRef]
  11. Peeling, R.W.; Artsob, H.; Pelegrino, J.L.; Buchy, P.; Cardosa, M.J.; Devi, S.; Enria, D.A.; Farrar, J.; Gubler, D.J.; Guzman, M.G.; et al. Evaluation of diagnostic tests: Dengue. Nat. Rev. Microbiol. 2010, 8, S30–S37. [Google Scholar] [CrossRef] [PubMed]
  12. Soler, M.; Huertas, C.S.; Lechuga, L.M. Label-free plasmonic biosensors for point-of-care diagnostics: A review. Expert Rev. Mol. Diagn. 2018, 19, 71–81. [Google Scholar] [CrossRef]
  13. Bendib, S.; Zegadi, A.; Djeffal, N. Improved sensitivity of 2D annular photonic crystal biosensor working at THz frequency range. Opt. Quantum Electron. 2016, 48, 528. [Google Scholar] [CrossRef]
  14. Hegde, S.S.; Bhat, B.R. Dengue detection: Advances and challenges in diagnostic technology. Biosens. Bioelectron. X 2022, 10, 100100. [Google Scholar] [CrossRef]
  15. Gürel, Ç.S.; Ceylan, N.E. High sensitivity photonic crystal biosensor design for real time detection of viruses in infected blood sample. J. Opt. 2024. [Google Scholar] [CrossRef]
  16. Ghezal, M.A.; Lidjici, H.; Zoukel, A.; Benchiheb, A.; Hocini, A. High Sensitivity Biosensor Photonic Crystal Focused on Detecting the Concentration of the Biological Analytes. Prog. Electromagn. Res. C 2024, 146, 111–117. [Google Scholar] [CrossRef]
  17. Meade, R.D.; Rappe, A.M.; Brommer, K.D.; Joannopoulos, J.D.; Alherhand, O.L. Erratum: Accurate theoretical analysis of photonic band-gap materials [Phys. Rev. B 48, 8434 (1993)]. Phys. Rev. B 1997, 55, 15942. [Google Scholar] [CrossRef]
  18. Chutinan, A.; Noda, S. Waveguides and waveguide bends in two-dimensional photonic crystal slabs. Phys. Rev. B 2000, 62, 4488–4492. [Google Scholar] [CrossRef]
  19. LShen, F.; He, S.-L.; Wu, L. The application of effective-medium theory in the plane-wave expansion method for analyzing photonic crystals. Acta Phys. Sin. 2002, 51, 1137–1138. [Google Scholar]
  20. Xie, Z.; Sun, S.; Wang, W.; Qin, L.; Yan, Y.; Hou, R.; Qin, G. Simulation study on improving efficiencies of perovskite solar cell: Introducing nano textures on it. Opt. Commun. 2018, 410, 117–122. [Google Scholar] [CrossRef]
  21. Lipson, R.H.; Lu, C. Photonic crystals: A unique partnership between light and matter. Eur. J. Phys. 2009, 30, S33–S48. [Google Scholar] [CrossRef]
  22. Robinson, S.; Nakkeer, R. Photonic Crystal Ring Resonator Based Optical Filters. In Advances in Photonic Crystals; InTech: Rijeka, Croatia, 2013; Volume 13. [Google Scholar] [CrossRef]
  23. Sharma, S.; Kumar, A. Design of a Biosensor for the Detection of Dengue Virus Using 1D Photonic Crystals. Plasmonics 2022, 17, 675–680. [Google Scholar] [CrossRef]
  24. Yariv, A. Critical coupling and its control in optical waveguide-ring resonator systems. IEEE Photonics Technol. Lett. 2002, 14, 483–485. [Google Scholar] [CrossRef]
  25. Mohapatra, B.; Khan, A.S.; Dash, D.; Ansari, R.; Indu. Design of Biosensor using 1D Photonic Crystal for Dengue Virus Detection. In Proceedings of the 2022 4th International Conference on Advances in Computing, Communication Control and Networking (ICAC3N), Greater Noida, India, 16–17 December 2022; pp. 1667–1670. [Google Scholar]
  26. Basak, C.; Hosain, K.; Islam, S.; Kouzani, A.Z. Design and modeling of an angular interrogation based surface plasmon resonance biosensor for dengue virus detection. Opt. Quantum Electron. 2023, 55, 438. [Google Scholar] [CrossRef]
Figure 1. Design structure.
Photonics 12 00514 g001
Figure 2. Refractive index distribution.
Photonics 12 00514 g002
Figure 3. Band gap range of the structure.
Photonics 12 00514 g003
Figure 4. Distribution field.
Photonics 12 00514 g004
Figure 5. The detection mechanism.
Photonics 12 00514 g005
Figure 6. Normalized transmission of infected and normal platelets.
Photonics 12 00514 g006
Figure 7. Normalised transmission of infected and normal Haemoglobin.
Photonics 12 00514 g007
Figure 8. Normalised transmission of infected and normal Plasma.
Photonics 12 00514 g008
Figure 9. Normalized transmission of infected and normal blood components.
Photonics 12 00514 g009
Figure 10. Central wavelengths shift according to the refractive index.
Photonics 12 00514 g010
Figure 11. Refractive index vs. Sensitivity.
Photonics 12 00514 g011
Figure 12. Transmission spectrum of a coupled system.
Photonics 12 00514 g012
Table 1. Sensitivity and Quality Factor according to the central wavelength and the blood components’ refractive index are cited.
Refractive Index Central WavelengthQSensitivity
µ nm/RIU
1.3372.02083902.004
1.352.0297905.229682.307
1.3572.03437943.309667.142
1.362.03998938.2261870
1.392.05679863.469560.333
1.42.06427866.369748
Table 2. Performance comparison with existing biosensors.
Reference Number/YearProposed BiosensorCoupling ResonanceDetection Range (µm)Quality FactorSensitivity (nm/RIU)
Sharma et al. (2022) [23]Dengue virus detection1D photonic crystals1.5–1.810,0001200
Mohapatra et al. (2022) [25]Dengue virus detection1D photonic crystals1.55–1.758500950
Basak et al. (2023) [26]Dengue virus detectionsurface plasmon resonanceVisible-NIR2500680
The proposed workDengue virus detection2D PhC Ring Resonator2.0–2.2943,3091870
Disclaimer/Publisher’s Note: The statements, opinions and data contained in all publications are solely those of the individual author(s) and contributor(s) and not of MDPI and/or the editor(s). MDPI and/or the editor(s) disclaim responsibility for any injury to people or property resulting from any ideas, methods, instructions or products referred to in the content.

