Communication

Efficient Testing Light Path for Aspherical Surfaces Based on Secondary Imaging

1
Anhui Institute of Optics and Fine Mechanics, Hefei Institutes of Physical Science, Chinese Academy of Sciences, Hefei 230031, China
2
Science Island Branch, Graduate School of USTC, Hefei 230026, China
3
Key Laboratory of Optical Calibration and Characterization, Chinese Academy of Sciences, Hefei 230031, China
*
Authors to whom correspondence should be addressed.
Photonics 2025, 12(5), 485; https://doi.org/10.3390/photonics12050485
Submission received: 14 April 2025 / Revised: 5 May 2025 / Accepted: 9 May 2025 / Published: 14 May 2025

Abstract

At present, off-axis three-mirror optical systems mostly adopt aspherical mirrors with small apertures and small F/# to meet the development requirements of remote sensing payloads towards high precision, small volume, and lightweight design. However, current references rarely provide the derivation, design, and detection of the testing light path for aspherical mirrors with small apertures and small F/#. Aiming at the existing gap, this paper proposes a method of decomposing the compensation optical path into two imaging light paths and derives the initial structure of the compensation optical path. Furthermore, specific solutions are proposed from two aspects: the design of the null compensator and the establishment of the testing light path. Finally, the compensation optical path design and detection are carried out for the primary mirror and the tertiary mirror of the self-calibrating real entrance pupil imaging spectrometer, guiding the completion of the system processing, assembly, and adjustment. The detection results show that the RMS of the surface shapes of the primary mirror and the tertiary mirror is 1/40λ (λ = 633 nm). This derivation method and the design method of the initial optical path have the characteristics of simple calculation, rapid optimization, and universal applicability, and are applicable to the detection of all quadratic concave surfaces.

1. Introduction

The off-axis three-mirror anastigmatism (TMA) optical system has the characteristics of being achromatic, small in size, and compact in structure. Moreover, through the aspheric design of the mirrors, it can achieve features such as a large field of view, high resolution, and excellent image quality. Therefore, it is widely applied in the design of remote sensing payloads and lithography machine systems [1,2,3,4,5,6,7]. Examples include China’s Gaofen-7 [2], Ziyuan-3 [3], the United States’ EO-1 [4], WorldView-3 [5], the European Space Agency’s High-Resolution Imaging Spectrometer (HRIS) [6], and France’s Pleiades-HR [7], all of which employ off-axis TMA optical systems. Currently, off-axis TMA systems predominantly utilize small-aperture, small-F/# aspheric mirrors to meet the development demands of remote sensing payloads for high precision, compact size, and lightweight design. However, the testing accuracy of high-precision aspheric mirrors directly determines manufacturing precision, which in turn affects the imaging quality of the entire system [8]. Therefore, research on testing light paths for small-F/# and small-aperture aspheric surfaces is of significant importance for future aerial remote sensing payloads.
Current aspheric surface measurement techniques can be primarily categorized into scanning measurement methods and optical interferometry methods [9,10,11,12,13,14,15,16,17]. Scanning measurement methods are further divided into contact and non-contact measurements [9,10]. Contact measurement requires a probe to physically touch the mirror surface, which can cause scratches and is thus limited to the initial mirror grinding stage [9]. Non-contact probe profilometry can measure both concave and convex aspheric surfaces, with measurement accuracy at the sub-micron level. However, its detection accuracy is limited, and its efficiency is relatively low [10]. Optical interferometry methods include null and non-null testing. For aspheric surface testing, commonly used null interferometry methods include the aplanatic point method, null compensation, and computer-generated holography (CGH) [11,12,13,14,15,16,17]. The aplanatic point method uses spherical or planar mirrors combined with an interferometer for autocollimation testing. However, this method cannot detect the central region of the mirror under test [11,12]. The null compensation method requires the design of a null compensator to construct a testing light path. The null compensator generally employs small-aperture spherical lenses. Due to the mature processing technology and high precision of spherical lenses, this method is widely used in aspheric surface shape detection [13,14]. The CGH method can achieve the measurement of deeply aspheric surfaces. The manufacturing cost of the CGH element is relatively high, and both the processing precision and the positioning precision have a certain impact on the measurement accuracy. The development of this method in aspheric surface shape detection is restricted [15]. Non-null testing methods use a single compensator to measure aspheric surfaces with varying parameters, allowing for retrace errors between the modulated test wavefront and the aspheric surface. However, non-null methods inherently suffer from unavoidable errors, and different retrace error handling approaches can yield inconsistent results [16,17]. Considering current optical fabrication and assembly capabilities, null compensation stands out for its low manufacturing difficulty, cost-effectiveness, and ability to achieve high-precision aspheric surface measurements.
The fundamental design principle of null testing involves creating a null compensator to counteract the aspheric deviation, ensuring the test wavefront perfectly matches the theoretical surface profile of the aspheric mirror under test. The detection wavefront modulated by the compensator reaches the surface to be measured and is reflected. The detection light beam, after reflection from the surface to be measured, carries the surface shape information of the surface to be measured and interferes with the reference light beam when they meet, so that the surface error data of the surface to be measured can be obtained. The accuracy of the null compensator directly determines the processing accuracy of the mirror surface to be measured. Therefore, designing the null compensator and constructing the testing light path are the key to testing the surface shape of the aspheric surface [13,14,18].
Most of the current references are comprehensive introductions to aspheric surface detection technologies [13,14]. There are a few derivations and designs of the initial optical paths of null compensators. According to the investigation, the current method for deriving the initial light path of a null compensator is based on the traditional third-order aberration theory. To solve the initial structure of the compensation system, it is necessary to calculate the initial parameters according to the asphericity, normal angle, and normal aberration of the aspheric surface to be measured. Moreover, most of the initial parameters are obtained based on empirical values, and the entire calculation process is rather cumbersome and complex, with mutual nesting. Finally, when optimizing with the optical design software, it is still necessary to try values by continuously changing the radii of curvature and the central distances of the compensating lens and the field lens on the basis of the initial structure, and the process is relatively cumbersome [19]. The secondary imaging method only requires knowing the parameters of the measured mirror and does not require empirical values, and the derivation process is relatively simple. The parameters that need to be known for deriving the initial optical paths of the two methods are shown in Table 1. As can be seen from Table 1, the three-order aberration method requires more known parameters than the secondary imaging method, and the derivation process is more cumbersome.
To address the current limitations in the optical design of compensators for null testing optical paths, this study proposes specific solutions for achieving high-precision testing and deterministic manufacturing of small-F/#, small-aperture secondary aspheric surfaces. The approach focuses on two key aspects: the design of the null compensator and the testing optical path. The compensation optical path is decomposed into two imaging optical paths, and the initial structure of the testing system is derived using Newtonian and Gaussian optical formulas. This method is applied to design and test the compensation optical path for the off-axis aspheric surfaces of the primary and tertiary mirrors in a self-calibrating real entrance pupil imaging spectrometer (SCREPIS), guiding the system’s manufacturing and alignment [20]. The new method offers simplicity in calculation, rapid optimization, and universal applicability, making it suitable for testing all secondary concave surfaces.

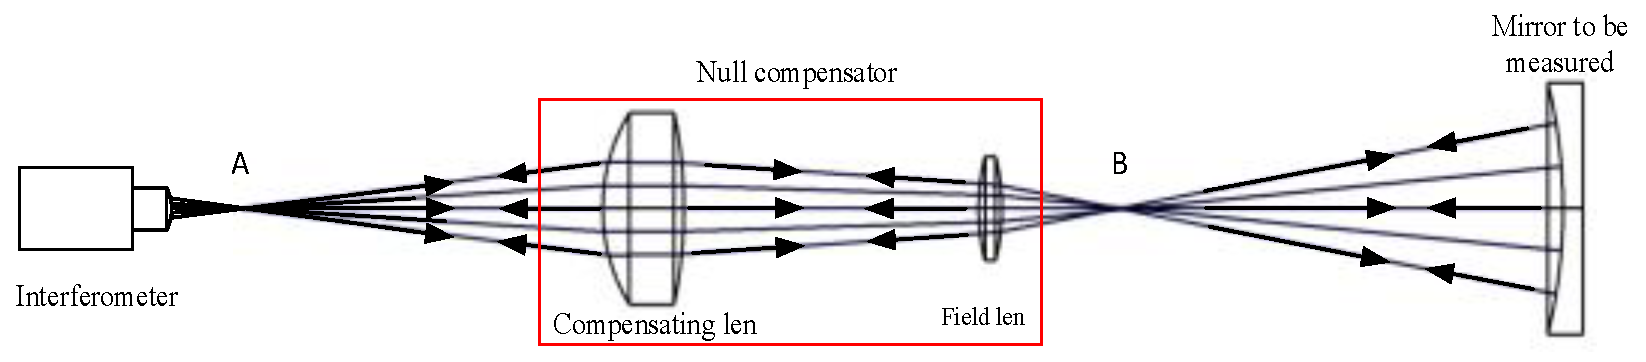
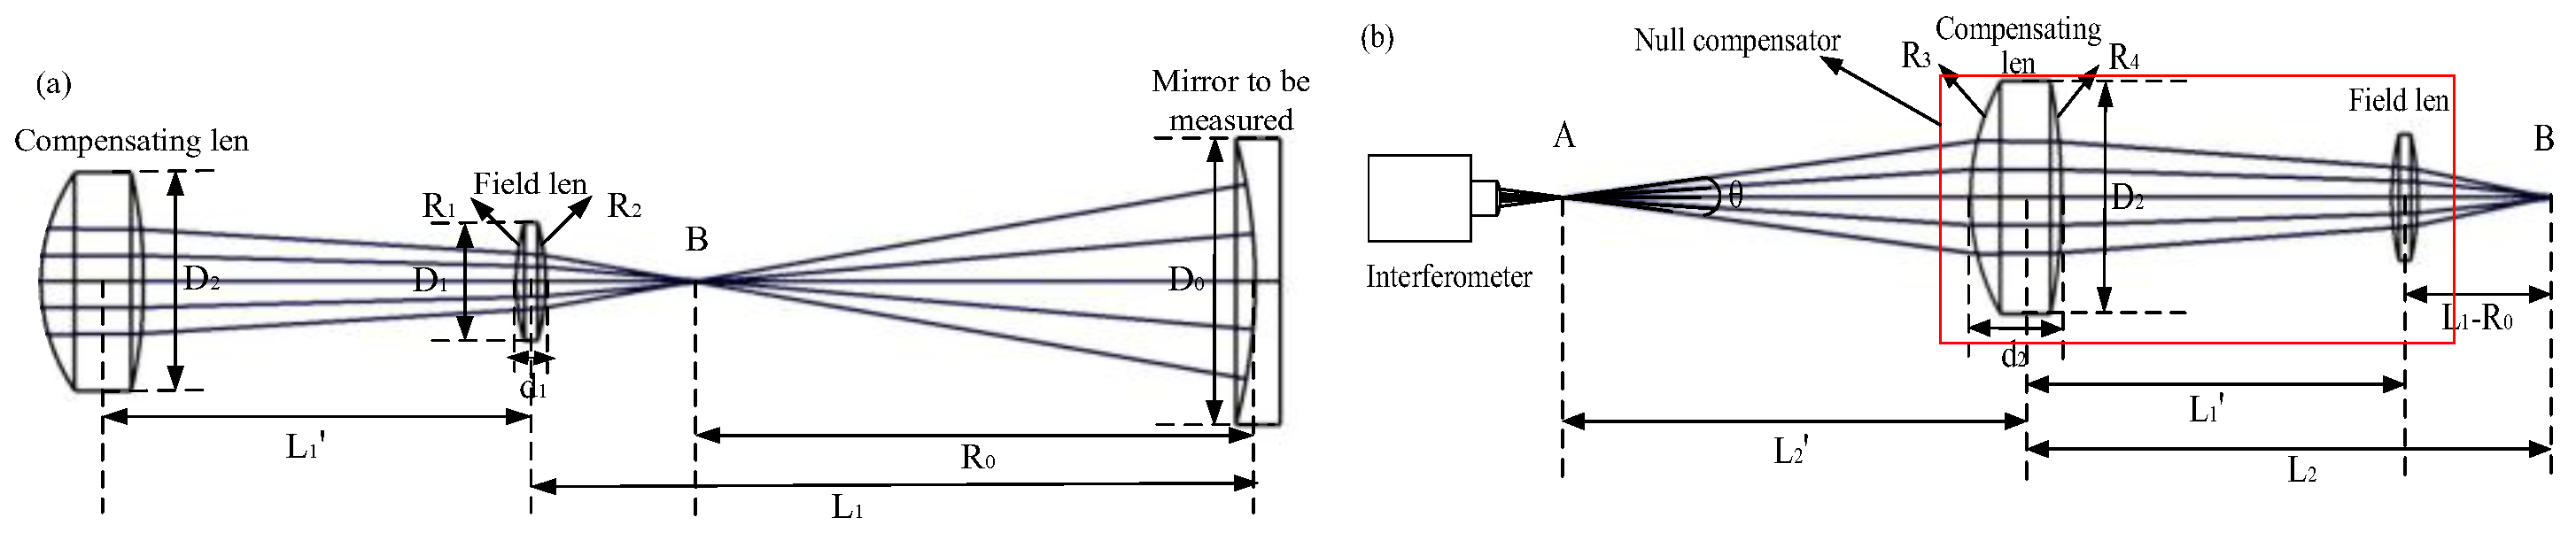
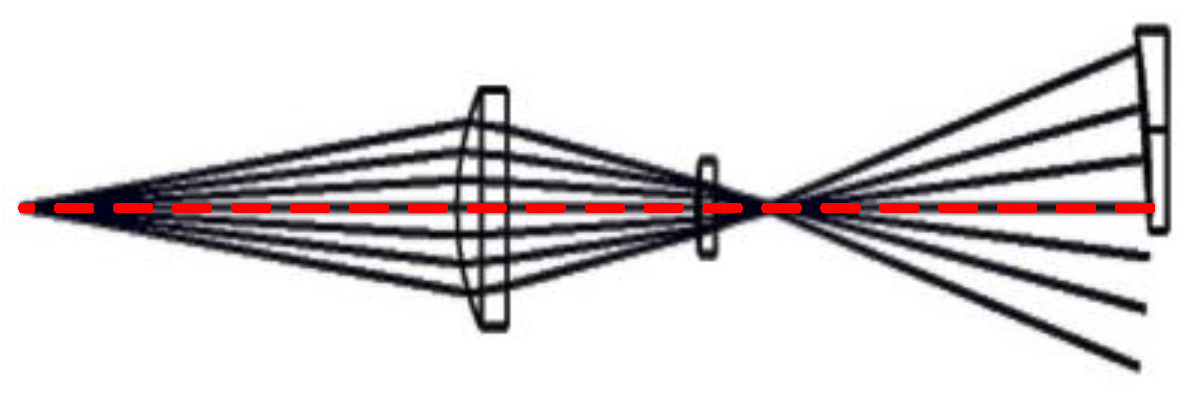
2. Design Principle of the Testing Light Path

Within the range of primary aberrations, compared with a spherical surface whose curvature is the vertex curvature of the aspheric surface, the angles of intersection and the positions of the intersection points between the normals of each zone on the aspheric surface and the optical axis are different. That is, normal aberrations are generated, which is equivalent to a beam of light with spherical aberration existing on the optical axis. The null compensator makes this beam of light with spherical aberration become a perfectly convergent beam, which eliminates the spherical aberration [13,14]. The key to the null compensation method lies in making the interferometer, the null compensator, and the mirrors to be tested form a compensating self-return optical path, so as to complete the inspection of the mirror to be tested. Therefore, an important principle should be followed in the design process of the null compensator: the normal at any point on the curved surface of the mirror to be measured is perpendicular to the tangent plane at that point [13]. If a ray of light is incident on the mirror to be measured along the normal, the ray will return along the original path. The schematic diagram of the design principle of the testing light path is shown in Figure 1.
When designing the null compensation optical path, the entire testing light path is decomposed into two imaging optical paths. In the first imaging optical path, the mirror to be measured is imaged on the compensating lens through the field lens, as shown in Figure 2a. In the second imaging optical path, the center of curvature B of the mirror to be measured is imaged at the focal point A of the interferometer through the combined system consisting of the field lens and the compensating lens, as shown in Figure 2b. By combining the object–image relationship with the Gaussian formula and the Newton formula [21,22], the initial structure of the detection system can be solved.
First, the D2 is determined based on the D0, as shown in Formula (1). Since the field lens is typically positioned near point B, the L1 can be determined, which is given by (2). Finally, based on the first imaging optical path, the L1′ can be obtained, as shown in Formula (3). According to Formulas (1) to (3), the f1 can be obtained, as shown in Formula (4).
D 2 = m 1 D 1
L 1 = 1 + m 2 R 0
L 1 = D 2 × L 1 D 0 = m 1 R 0 1 + m 3
1 m 1 R 0 1 + m 3 + 1 R 0 1 + m 3 = 1 f 1 f 1 = m 1 R 0 1 + m 3 1 + m 1
where m1 and m2 are proportionality coefficients, which are selected according to the reflector under test. D0 is the aperture of the mirror under test. D2 is the aperture of the compensating lens. R0 is the radius of curvature of the mirror under test. L1 is the distance between the field lens and the test mirror. L1′ is the distance between the compensation lens and the field lens. β1 is the transverse magnification of the field lens. f1 is the object-side focal length of the field lens.
The field lens is a single lens composed of two spherical surfaces [17]. According to the imaging properties of a single lens, as shown in Formula (5), one side of the field lens is designed to be a plane, so R2 is taken as infinity. The R1 can be obtained, given by (6).
1 f 1 = n 1 1 1 R 1 1 R 2 + n 1 1 2 d 1 n 1 R 1 R 2
R 1 = 1 n 1 f 1
where n1 represents the refractive index of the field lens, R1 is the radius of the left refractive spherical surface of the field lens, and R2 is the radius of the right refractive spherical surface of the field lens. d1 is the center thickness of the field lens.
In the second imaging optical path, the beam divergence angle θ typically ranges from 5° to about 16°, and the L2′ is given by Formula (7). The f2 can be derived using the Gaussian formula for imaging position relationships, as shown in Formula (8). An ideal optical system can be formed by combining the compensating mirror and the field lens. Using the ideal optical combination system formula, the f3 can be calculated, as shown in Formula (9). The compensating lens is a single lens. According to Formula (5), the expression (10) of the spherical radius R3 can be obtained.
L 2 = D 2 m 3
m 2 m 1 D 0 + 1 m 1 + m 1 m 3 + m 3 R 0 = 1 f 2 f 2 = m 1 D 0 m 1 + m 1 m 3 + m 3 R 0 m 2 m 1 + m 1 m 3 + m 3 R 0 + m 1 D 0
f 2 = f 1 f 3 Δ f 3 = m 1 D 0 m 1 + m 1 m 3 + m 3 R 0 1 + m 1 m 2 m 1 + m 1 m 3 + m 3 R 0 + m 1 D 0
1 f 3 = n 2 1 1 R 3 1 R 4 + n 2 1 2 d 2 n 2 R 3 R 4 R 3 = n 2 1 f 3
where m3 are proportionality coefficients, which are selected according to the θ. L2′ is the distance from the compensating lens to A. f2 is the object-space focal length of the null compensator composed of the compensating lens and the field lens. f3 is the object-space focal length of the compensating lens. In the second imaging optical path, ∆ is approximately equal to the distance L1′. n2 represents the refractive index of the compensating lens. R3 is the radius of the left refractive spherical surface of the compensating lens, and R4 is the radius of the right refractive spherical surface of the compensating lens. d2 is the center thickness of the compensating lens.

3. Design of the Testing Light Path

3.1. Compensator Design

Design and detection of the compensation optical paths for the off-axis aspheric surfaces of the primary mirror and the tertiary mirror of the self-calibrating real entrance pupil imaging spectrometer (SCREPIS) was conducted. The parameters of the off-axis aspheric surfaces of the primary mirror and the tertiary mirror are shown in Table 2 [20].
Generally, the same lens material is selected for the field lens and the compensating lens, so the refractive index n1 of the lens is equal to n2. The above-mentioned principles and processes of initial light path derivation are programmed into software, and the interface is shown in Figure 3. By inputting the diameters and radii of curvature of the primary mirror and the tertiary mirror, as well as the refractive indices of the materials of the field lens and the compensating lens used, the initial compensating light path for detecting the surface shape of the primary mirror can be obtained.
Optimization is carried out based on the initial light path obtained above. Taking the primary mirror as an example, the programming operands for the entire light path are set as shown in Table 3. In the optimization process, the wavefront is selected as the optimization function. Smaller ring and arm parameters are set for hammer-shaped optimization. When the wavefront parameters of the system remain unchanged, larger ring and arm parameters are set to continue the optimization. The aim is to eliminate the residual aberrations at different positions on the mirror surface to be measured.

3.2. Design Results and Tolerance Analysis

According to the light path design and optimization method in Section 3.1, the null compensating testing light paths for the primary mirror and the tertiary mirror are shown in Figure 4a,b, and the parameters of the testing light paths are shown in Table 4. After the aberration compensation and correction by the compensating lens and the field lens in the testing light path of the primary mirror, the wavefront RMS of the entire optical path system reaches 0.0007λ (λ = 633 nm), as shown in the wavefront diagram of the testing light path system in Figure 4c. After the aberration compensation and correction by the compensating lens and the field lens in the testing light path of the tertiary mirror, the wavefront RMS of the entire optical path system reaches 0.0006λ (λ = 633 nm), as shown in the wavefront diagram of the testing light path system in Figure 4d. The design results show that the null compensator designed by this method can correct the aberration of the mirror to be measured effectively.
Considering the machining and alignment errors of the mirrors in the detection system, a tolerance analysis is carried out on the detection optical path. According to the current machining and alignment levels, the tolerance parameters are set for each mirror [23,24,25].
A total of 200 Monte Carlo analyses are carried out for the primary mirror and the tertiary mirror to simulate the situation of the system’s testing light path caused by the machining and alignment errors of the compensating lens and the field lens. The worst deviations introduced by the machining and alignment of the compensating lens and the field lens in this testing light path are shown in Table 5. The analysis is conducted with the Modulation Transfer Function (MTF) as the standard, and the results are shown in Table 6.
Based on the tolerance analysis results, for the testing light paths of the primary mirror and the tertiary mirror, the sensitive tolerances are mainly reflected in the eccentricity tolerance of the side with a radius of curvature of the compensating lens and the field lens, as well as the refractive index tolerance of the compensating lens. In addition, the detection optical path of the tertiary mirror is also quite sensitive to the tolerance introduced by the radius of curvature of the compensating lens. Since the relative position accuracy between the compensating lens and the field lens in the alignment instrument’s alignment is relatively high, the tolerance analysis reveals that the system is not sensitive to the eccentricity and tilt of the compensating lens and the field lens. After 200 Monte Carlo calculations and analyses, the maximum deviations of the MTF of the primary mirror and the tertiary mirror caused by machining and alignment errors are 4.81% and 6.13%, respectively. The impact on the entire testing light path can be neglected, and it does not affect the detection results of the primary mirror and the tertiary mirror. The machined compensating lens and field lens are placed into a mechanical device, aligned, and assembled to form a null compensator, as shown in Figure 5.

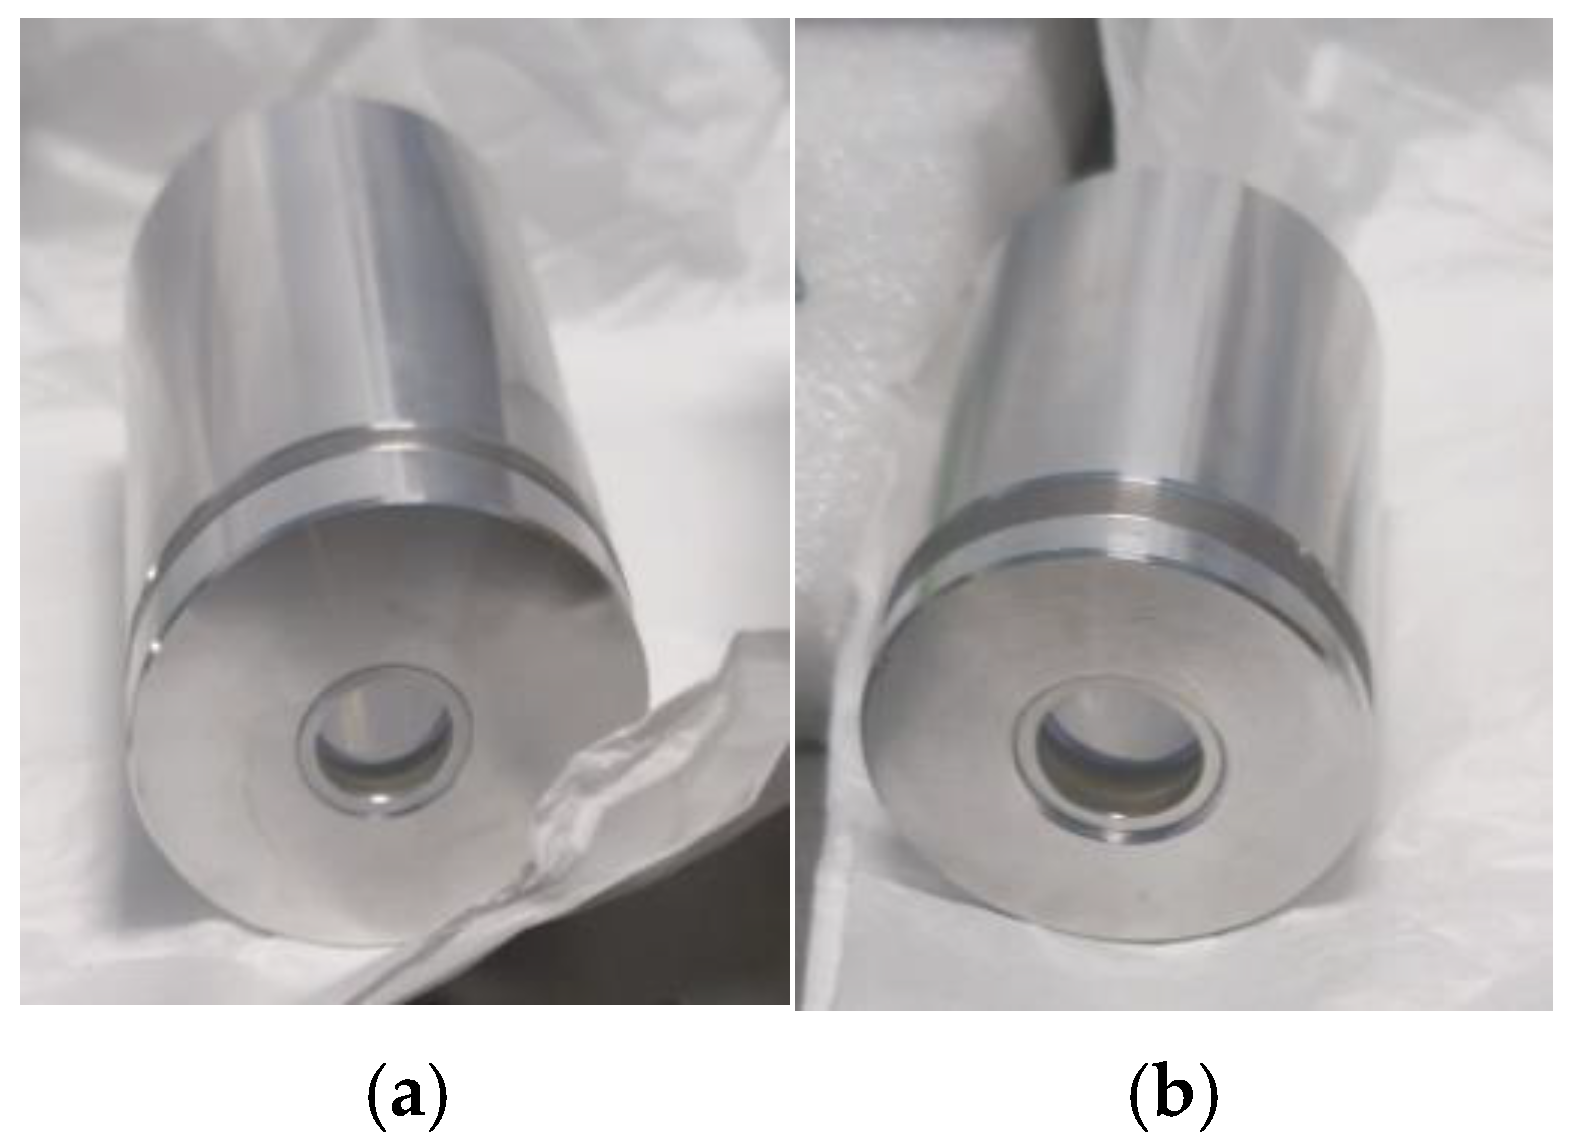
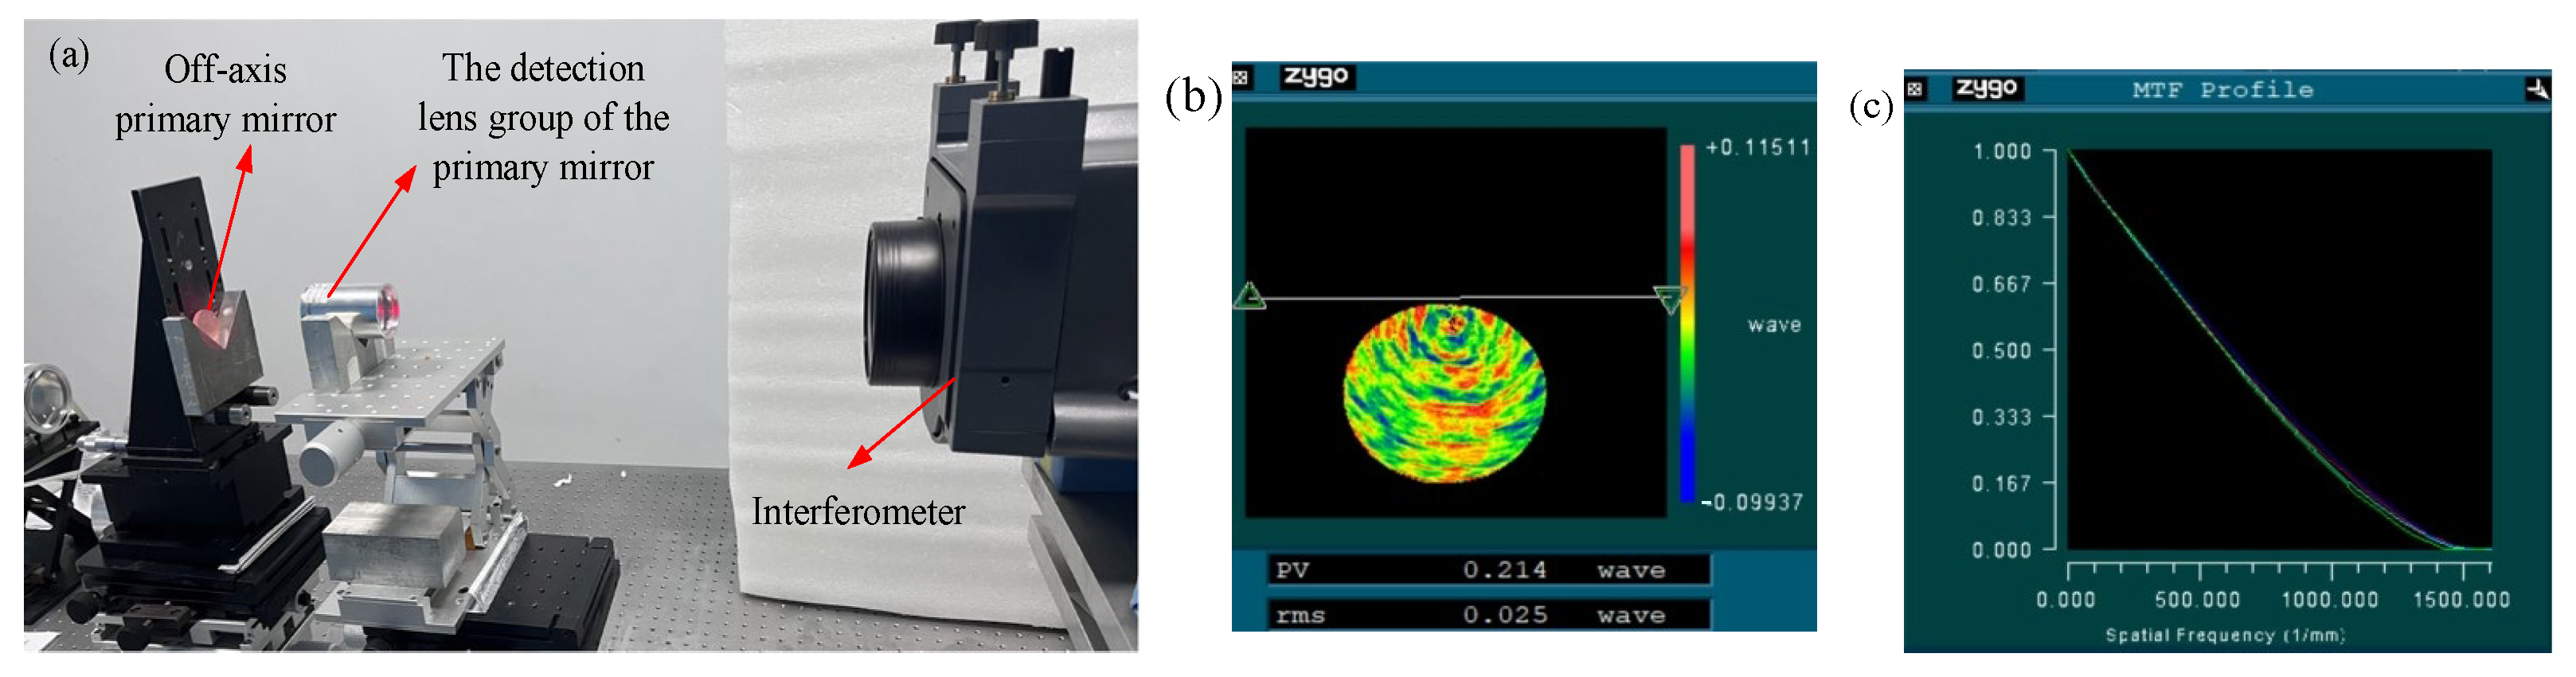
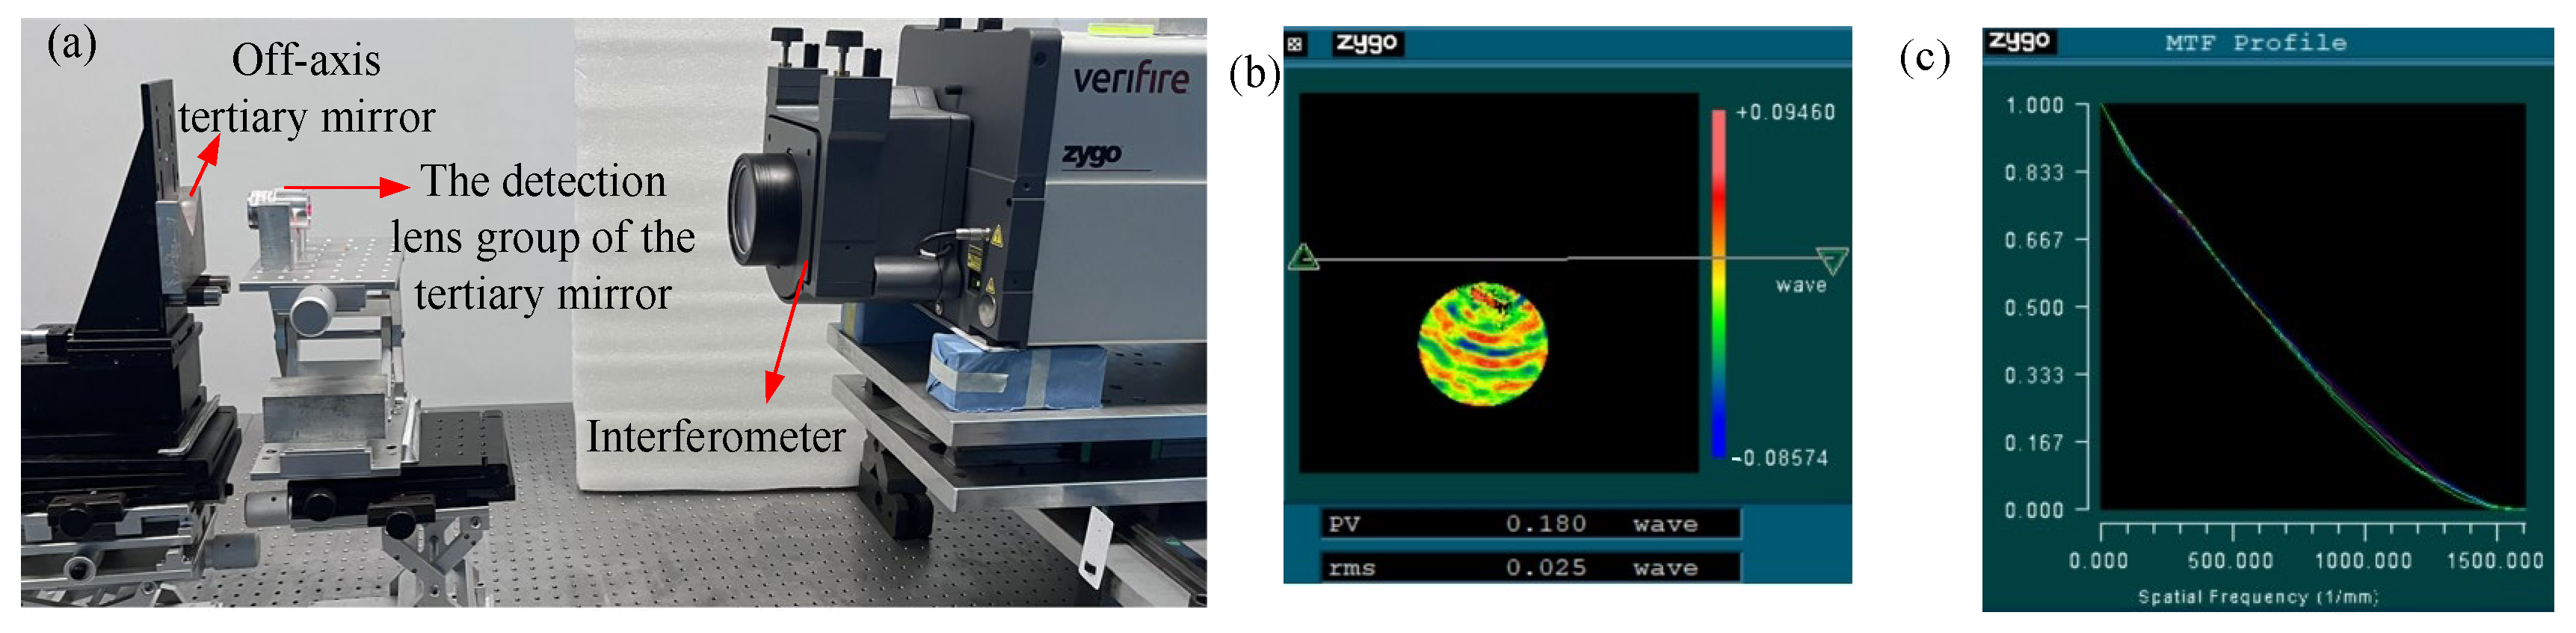
4. Light Path Construction and Detection

As can be seen from Table 1, the structural parameters of the primary and tertiary mirrors indicate that the object to be detected is an off-axis aspherical mirror, which means only a part of the entire surface to be measured is taken. The design principles of the null compensator for off-axis aspherical mirrors parallel those of a non-off-axis mirror. The key difference lies in the testing light path setup: during the construction of the testing light path, it is crucial to align the center of the off-axis mirror blank, rather than the geometric center of the off-axis mirror itself, with the central axis of the optical path, as illustrated in Figure 6.
The machined compensating lens and field lens are combined into a null compensator through a mechanical device. The testing light path is constructed using the null compensator, the off-axis mirror to be measured, and the interferometer to conduct surface profile detection on the primary and tertiary mirrors of the self-calibrated real entrance pupil imaging spectrometer. The testing light paths for the surface profiles of the primary and the tertiary mirrors are shown in Figure 7a and Figure 8a, respectively. The wavefront diagrams of the mirrors to be measured, Figure 7b and Figure 8b, show that the RMS of the surface profiles of the primary and the tertiary mirrors are 1/40λ (λ = 633 nm). The system MTF (Nyquist frequency) diagrams, Figure 7c and Figure 8c, show that the testing light path systems of primary and tertiary mirrors reach the diffraction limit. The system wavefront diagram and the system MTF indicate that the surface profiles of the mirrors to be measured are of good quality and meet the usage requirements of the entire system [20].

5. Conclusions

In view of the current deficiencies in the design of the testing light path for small-F/# and small-aperture aspherical mirrors, this paper proposes a new initial light path design method. The null compensation optical path is decomposed into two imaging optical paths, based on which the initial structure of the detection system is derived. This method is used to design the testing light path for the off-axis aspheres in the SCREPIS, guiding the completion of system processing and alignment. The results show that the RMS of the surface profiles of the primary and the tertiary mirrors are better than 1/40λ (λ = 633 nm). This derivation method and the design method of the initial light path have the characteristics of simple calculation, rapid optimization, and universal applicability, and are applicable to the detection of all quadratic concave surfaces.

Author Contributions

Conceptualization, X.L.; methodology, X.L. and X.W.; software, X.W.; validation, Q.Z. and E.L.; formal analysis, X.L.; investigation, X.W. and W.W.; resources, X.L. and E.L.; data curation, Q.Z.; writing—original draft preparation, X.W.; writing—review and editing, X.L. and Q.Z.; visualization, X.W.; supervision, W.W. and E.L.; project administration, X.L.; funding acquisition, Q.Z. All authors have read and agreed to the published version of the manuscript.

Funding

The HFIPS Director’s Fund, Grant No.YZJJ202309-TS. National Natural Science Foundation of China (No. 42105139).

Institutional Review Board Statement

Not applicable for studies not involving humans or animals.

Informed Consent Statement

Not applicable for studies not involving humans.

Data Availability Statement

Since this project is a research project, it involves the privacy of the research group, and it is not convenient to upload the data. However, if you have colleagues who are interested in the data or have the same research direction, please feel free to communicate through the author’s email.

Conflicts of Interest

The authors declare that they have no conflicts of interest.

References

  1. Yuan, L.; He, Z.; Lv, G.; Wang, Y.; Li, C.; Xie, J.N.; Wang, J. Optical design, laboratory test, and calibration of airborne long wave infrared imaging spectrometer. Opt. Express 2017, 25, 22440–22454. [Google Scholar] [CrossRef] [PubMed]
  2. Tang, H.; Xie, J.; Tang, X.; Chen, W.; Li, Q. On-orbit radiometric performance of GF-7 satellite multispectral imagery. Remote Sens. 2022, 14, 886. [Google Scholar] [CrossRef]
  3. Tang, X.M.; Zhou, P.; Zhang, G.; Wang, X.; Jiang, Y.H.; Guo, L.; Liu, S.H. Verification of ZY-3 satellite imagery geometric accuracy without ground control points. IEEE Geosci. Remote Sens. Lett. 2015, 12, 2100–2104. [Google Scholar] [CrossRef]
  4. Ungar, S.; Pearlman, J.S.; Mendenhall, J.A.; Reuter, D. Overview of the Earth Observing One (EO-1) mission. IEEE Trans. Geosci. Remote Sens. 2003, 41, 1149–1159. [Google Scholar] [CrossRef]
  5. Collin, A.; Lambert, N.; Etienne, S. Satellite-based salt marsh elevation, vegetation height, and species composition mapping using the superspectral WorldView-3 imagery. Int. J. Remote Sens. 2018, 39, 5619–5637. [Google Scholar] [CrossRef]
  6. Blechinger, F.; Charlton, D.E.; Davancens, R.; Harnisch, B.; Kunkel, B.P.; Meynart, R.; Novi, A.; O’Mongain, E.; Schwarzer, H.H.; Slater, P.N. High-resolution imaging spectrometer (HRIS): Optics, focal plane, and calibration. In Proceedings of the Optical Engineering and Photonics in Aerospace Sensing, Orlando, FL, USA, 11–16 April 1993. [Google Scholar] [CrossRef]
  7. Giremus, A.; Grussenmeyer, P. Design of the high resolution optical instrument for the Pleiades HR Earth observation satellites. Int. J. Remote Sens. 2012, 33, 1234–1256. [Google Scholar] [CrossRef]
  8. Zhang, X.J. Progress on space optics manufacturing: From aspheres to freeforms. Acta Opt. Sin. 2023, 43, 0822009. [Google Scholar]
  9. Wang, T.; Huang, L.; Vescovi, M.; Kuhne, D.; Tayabaly, K.; Bouet, N.; Idir, M. Study on an effective one-dimensional ion-beam figuring method. Opt. Express 2019, 27, 15368–15381. [Google Scholar] [CrossRef] [PubMed]
  10. Sidpara, M.A. Magnetorheological finishing: A perfect solution to nanofinishing requirements. Opt. Eng. 2014, 53, 092002. [Google Scholar] [CrossRef]
  11. Ghozeil, I. Hartmann and other screen tests. In Optical Shop Testing; Malacara, D., Ed.; Wiley: New York, NY, USA, 1992. [Google Scholar]
  12. Zhao, W.C.; Fan, B.; Wu, F. Experimental analysis of reflector test based on phase measuring deflectometry. Acta Opt. Sin. 2013, 33, 98–101. (In Chinese) [Google Scholar]
  13. Zhao, C.; Hu, M.; Zhang, S.; Li, X.; Li, Z. Research on Compensation Detection Method for Large Aperture High-order Aspheric Surfaces. Laser Optoelectron. Prog. 2020, 57, 270–276. [Google Scholar]
  14. Zhang, L.; Hu, W.; Zheng, L.; Hao, P. Catadioptric null compensating test. Acta Photonica Sin. 2016, 45, 0722002. [Google Scholar]
  15. Zhou, P.; Burge, J.H. Fabrication error analysis and experimental demonstration for computer generated holograms. Appl. Opt. 2006, 46, 657–663. [Google Scholar] [CrossRef] [PubMed]
  16. Zhang, L.; Li, C.; Huang, X.; Zhang, Y.; Zhou, S.; Li, J.; Yu, B. Compact adaptive interferometer for unknown freeform surfaces with large departure. Opt. Express 2020, 82, 1897–1913. [Google Scholar] [CrossRef] [PubMed]
  17. Gappinger, R.O.; Greivenkamp, J.E. Iterative reverseoptimization procedure for calibration of aspheric wave-front measurements on a nonnull interferometer. Appl. Opt. 2004, 43, 5152–5161. [Google Scholar] [CrossRef] [PubMed]
  18. Offner, A. A null corrector for paraboloidal mirrors. Appl. Opt. 1963, 2, 153–155. [Google Scholar] [CrossRef]
  19. Pan, J. Optical Aspheric Design, Processing and Testing; Suzhou University Press: Suzhou, China, 2004. [Google Scholar]
  20. Wang, X.; Li, X.; Zhang, Q.; Shi, Y.; Wei, W.; Liu, E. Optical System Design of a Self-Calibrating Real Entrance Pupil Imaging Spectrometer. Photonics 2024, 11, 1072. [Google Scholar] [CrossRef]
  21. Yu, D.Y.; Tan, H.Y. Engineering Optics, 4th ed.; China Machine Press: Beijing, China, 2016. [Google Scholar]
  22. Cui, H.B.; Li, Y.P.; Kang, X.L. Optics, 2nd ed.; Science Press: Beijing, China, 2015; pp. 33–34. [Google Scholar]
  23. MIL-0-13830 A/B; Standard for Surface Imperfections of Optical Components. United States Department of Defense Standardization Bureau: Washington, DC, USA, 1994.
  24. GB 1185-1989; China Machinery Industry Federation. Surface Imperfections of Optical Components; China Standards Press: Beijing, China, 1989.
  25. GB/T 1185-2006; Standardization Administration of the People’s Republic of China. Surface Imperfections of Optical Components; China Standards Press: Beijing, China, 2007.
Figure 1. Schematic diagram of the testing light path design principle.
Photonics 12 00485 g001
Figure 2. (a) First imaging optical path schematic diagram. (b) Second imaging optical path schematic diagram.
Photonics 12 00485 g002
Figure 3. Software interface for detecting system initial optical path parameters.
Photonics 12 00485 g003
Figure 4. (a) Testing light path of primary mirror. (b) Testing light path of tertiary mirror. (c) The system wavefront data of primary mirror. (d) The system wavefront data of tertiary mirror.
Photonics 12 00485 g004
Figure 5. (a) Null compensation of primary. (b) Null compensation of tertiary mirror.
Photonics 12 00485 g005
Figure 6. Testing light path diagram of off-axis mirror.
Photonics 12 00485 g006
Figure 7. (a) Experimental setup for testing light path of off-axis primary mirror. (b) Primary mirror wavefront results. (c) Primary mirror MTF results.
Photonics 12 00485 g007
Figure 8. (a) Experimental setup for testing light path of off-axis tertiary mirror. (b) Tertiary mirror wavefront results. (c) Tertiary mirror MTF results.
Photonics 12 00485 g008
Table 1. Comparison of the initial parameters of the two methods.
D0
The Aperture of the Test Mirror
R0
The Radius of Test Mirror
n
Compensator Lens Refractive Index
e02
Conic Coefficients of Test Mirror
Obscuration Ratio MagnificationAberration Sharing Factor
α1
Compensating Lens
α2
Field Lens
β1
Compensating Lens
β2
Field Lens
t1
Compensating Lens
t2
Field Lens
Third-order aberration
Secondary imaging ×××××××
Table 2. Structure parameters of primary and tertiary mirrors.
TitleRadius of Curvature/mmDiameter/mmOff-Axis Amount/mmThe Aperture of the Off-Axis Mirror/mmConic
Primary mirror−106.736581332−2.394
Tertiary mirror−69.43242630−1.294
Table 3. Programming operands for optimizing the testing light path.
Op#TypeSurf1Surf2TargetWeightValue
Control the length of the optical path1TTHIACompensating lens OPGT351129.445
OPLT2001
2TTHICompensating lensField lensOPGT20156.349
OPLT1001
3TTHIField lensPrimary mirrorOPGT501129.296
OPLT1351
Control the system aberration4 FieldFreqTargetWeightValue
5GMTS140110.851
6GMTT140110.851
7 TermFieldTargetWeightValue
8ZERNAstigmatism X1017.27 × 10−18
9ZERNAstigmatism Y101−1.59 × 10⁻¹⁹
10ZERNComa X1016.23 × 10−19
11ZERNComa Y1015.85 × 10−18
12ZERNPrimary Spherical101−2.23 × 10⁻⁷
13ZERNTrefoil X101−1.80 × 10⁻¹⁹
14ZERNTrefoil Y101−9.25 × 10⁻¹⁸
Table 4. Parameters of primary and tertiary testing light paths.
D1/mmD2/mmL1/mmL1′/mmL2/mmL2′/mmR1/mmR2/mmR3/mmR4/mmd1/mmd2/mmMirror Material
Primary mirror1640129.29656.34978.909129.44528.15231.6035.62314.705H-K9L
Tertiary mirror203078.19337.85846.619177.19219.48224.8577.7949.813H-K9L
Table 5. The worst deviation of primary and tertiary mirrors testing light paths.
TypeSufValueCriterionChange
Primary mirrorTEDXR3 of compensating lens±5 × 10−30.8709−0.0169
TEDY
TEDXR1 of field lens±5 × 10−30.8748−0.0129
TEDY
TINDCompensating lens5 × 10−30.8736−0.0141
−5 × 10−30.8739−0.0138
Tertiary mirrorTEDXR3 of compensating lens±5 × 10−30.7810−0.0247
TEDY
TEDXR1 of field lens±5 × 10−30.7887−0.0171
TEDY
TINDCompensating lens5 × 10−30.7912−0.0146
TRADR3 of compensating lens−5 × 10−30.7929−0.0129
Table 6. Tolerance analysis results of primary and tertiary mirrors testing light path.
Primary MirrorTertiary Mirror
Nominal MTF0.8878
(40 lp/mm)
0.8058
(40 lp/mm)
Simulation result10% > 0.883310% > 0.7991
50% > 0.871450% > 0.7870
90% > 0.845190% > 0.7564
Disclaimer/Publisher’s Note: The statements, opinions and data contained in all publications are solely those of the individual author(s) and contributor(s) and not of MDPI and/or the editor(s). MDPI and/or the editor(s) disclaim responsibility for any injury to people or property resulting from any ideas, methods, instructions or products referred to in the content.

