Article

Image Reconstruction Through Multimode Polymer Optical Fiber for Potential Optical Recording of Neural Activity

1
Department of Physics, Faculty of Arts and Sciences, Beijing Normal University, Zhuhai 519087, China
2
Department of Psychology, Faculty of Arts and Sciences, Beijing Normal University, Zhuhai 519087, China
3
Beijing Key Laboratory of Applied Experimental Psychology, National Demonstration Center for Experimental Psychology Education, Faculty of Psychology, Beijing Normal University, Beijing 100875, China
4
Graduate Program in Electrical Engineering, Federal University of Espírito Santo, Fernando Ferrari Avenue, Vitoria 29075-910, Brazil
5
Department of Cybernetics and Biomedical Engineering, VSB—Technical University of Ostrava, 708 00 Ostrava, Czech Republic
*
Author to whom correspondence should be addressed.
Photonics 2025, 12(5), 434; https://doi.org/10.3390/photonics12050434
Submission received: 25 March 2025 / Revised: 24 April 2025 / Accepted: 29 April 2025 / Published: 30 April 2025

Abstract

:
Despite the growing demand for high-resolution imaging techniques in neuroscience, traditional methods are limited in terms of flexibility and spatial resolution. We explored an approach using multimode polymer optical fiber (POF) and employing a neural network for image reconstruction and studied the ability of multimode POF to effectively capture and reconstruct high-quality images. Here, a conventional U-Net model within the framework of convolutional neural networks (CNNs) is applied to the reconstruction of speckle images obtained via POF. The model was trained on an experimental dataset consisting of MNIST graphs and successfully reconstructed high-quality images that closely resemble the original undistorted scene. This study not only highlights the potential of POF in biomedical imaging but also paves the way for more sophisticated optical recording techniques.

1. Introduction

As the most advanced and complex vital organ of the human body, the brain plays a pivotal role in coordination and regulation, dominating all life activities of the organism and regulating the balance between the body and the surrounding environment [1]. Brain science is the key to understanding human cognition, emotion, and behavior, which serves as an important cornerstone for promoting the future development of artificial intelligence, neurorehabilitation, precision medicine, and other high-tech fields [2]. As the core object of brain science research, the nervous system is a highly intricate and sophisticated system responsible for transmitting, processing, and storing information from various parts of the body to achieve fine regulation of various functions of the organism.
Understanding various neural activity patterns is of great significance to frontier fields such as the diagnosis and treatment of neurological diseases and human–computer interaction, so it is crucial to develop and explore neural interface technology that can interact with the dynamic nervous system [3]. Multimodal neural interfaces mainly include the use of optical, electrical, magnetic, acoustic, and chemical drug delivery methods to record and modulate neural activity [4]. Among them, optical neural interfaces mainly include optical recording and optical stimulation of neural activity. With the development of material science and advanced manufacturing technology, modern neural recording and modulation tools have made significant progress in sensitivity, precision, and spatial resolution [5].
Optical technology can precisely regulate and record neural activity on the time scale of milliseconds, while having high spatial resolution and being able to locate specific neurons or neural circuits [6]. Compared with electrophysiological methods, optical methods cause less damage to tissues and do not cause thermal or mechanical damage that may be associated with electrical stimulation. A number of technical approaches have been developed to image the brain tissue and neural activity. In recent years, optical imaging has become a commonly used tool in neuroimaging technology due to its safety, high temporal resolution, and simple equipment [7]. At present, with the combination of large-scale single photon or multi-photon imaging, it is possible to read the activity of neural circuits that are awake and associated with animal behaviors [8].
Notably, optical fiber imaging technology has demonstrated immense potential in neuronal recording [9,10]. The technology uses optical fibers as a medium of information transmission to record and analyze optical signals from nerve tissue to external devices. Optical fiber imaging technology has the advantages of high temporal and spatial resolution, low invasiveness, and excellent biocompatibility. By utilizing optical fiber imaging, the response of neurons when stimulated, the release of neurotransmitters, and the connections between neurons can be observed, which are important for understanding the functions and mechanisms of the nervous system. The multimode optical fibers (MMFs) present several advantages over single-mode optical fibers, including higher mode density, which enables the transmission of more information, thereby enhancing resolution and imaging performance [11,12].
Due to the modal dispersion in MMFs, the image propagated through the MMFs appear with severe spatial distortion, resulting in a random speckle pattern at the far end [13]. The challenge lies in recovering the speckle from the output to reconstruct the original input image. Traditional research has employed methods such as the phase conjugation [14], wavefront shaping [15,16], and transmission matrix (TM) [17,18] methods. The wavefront shaping method uses a spatial light modulator (SLM) to precisely control the optical wavefront to achieve imaging. Li et al. explored how to reduce the number of probe measurements required to characterize the TM [19]. Variations in optical paths, fiber shape, and environmental factors can alter the TM, which limits its wide application [20]. Deep learning approaches provide a novel path for speckle reconstruction, allowing for the computation of the TM for MMFs without requiring prior knowledge of the optical fiber [21]. CNNs have been developed to improve the utilization of speckle information and the accuracy of image reconstruction [22]. U-Net, one of the classic CNN algorithms, is also widely employed in speckle image reconstruction through MMF. Zhang et al. proposes a method based on transfer learning and U-Net, which can effectively reconstruct speckle images with reduced training data demand [23]. Xu et al., in 2025, designed u-architecture networks with fully connected layers that are robust to the deformed MMF, providing a feasible solution for the application of MMFs in endoscopes [24]. Zhao et al. used U-Net to achieve high-fidelity imaging through a bent MMF, maintaining good imaging quality even when the fibers were curled to a 5 cm diameter [25].
In prior studies, significant advancements have been made in the recovery of speckle pattern within MMFs, primarily focusing on silica-based MMFs. Nevertheless, silica-based MMFs exhibit increased fragility and the possibility of signal loss, which affects the quality of imaging [26]. POFs have emerged as a promising alternative to silica-based optical fibers. POFs are known for their robustness, flexibility, and resistance to bending, which are critical for optical fiber imaging. Moreover, the antimagnetic properties of POFs ensure the stability of imaging in medical environments filled with electronic devices [27].
Here, the conventional U-Net architecture within the framework of CNNs was applied to the reconstruction of speckle images acquired through POFs. The U-Net model, which trained on an experimentally obtained dataset comprising 12,000 speckle patterns, was capable of reconstructing high-fidelity images that closely match the original undistorted scenes.

2. Principle

From the theoretical studies related to MMF, the phase changes when the light propagates along the axial direction in the optical fiber core [28]. The electric field inside the optical fiber core can be expressed as:
E x , y , z = ε x , y exp i β z
where β is the propagation constant, and ε is the transverse electric field. According to Maxwell’s system of equations, the transverse electric field can be obtained to satisfy the system of equations in a column coordinate system with boundary conditions (R is the radius of the MMF core):
ε θ 0 = ε θ 2 π , ε r r = 0 , r = 0 , R
The expression for the transverse electric field can be solved as:
ε r , θ = n   m   J n β m n r exp i n θ exp i β n m z
where n, m is the polarization mode count of the MMF, and its upper limit is determined by the MMF; J n is the n-order Bessel function; and m n is the propagation constant corresponding to the mode m n. Decomposition of Equation (3) into the form of summation of multiple modes yields [29]:
E v u r , θ , z = ε v u r , θ exp j β v u z
where β v u is the propagation constant for the different modes; ε v u ( x , y ) is a horizontally distributed electric field; v, u represents the modal order in the direction of r, θ; and the different modes are independent of each other.
Light can propagate through different modes as it passes through the MMF, and the intensity through the different modes varies, as reflected in the different coupling coefficients for each mode of the input and output optical fields. The input optical field can be expressed as the sum of the product of the coupling coefficients of all guided-mode optical fields and each mode. See the following approach:
U 1 r , θ , 0 = v = 0 v   u = 0 u   A v u ε v u r , θ
where Avu denotes the coupling coefficient, the strength of the individual activated modes. The output light field is related to the effect of the phase shift of the individual modes, and it can therefore be expressed as:
U 2 r , θ , L = v = 0 v   u = 0 u   A v u ε v u r , θ exp j β v u L
When light propagates through the MMF, each mode of light is solved independently and does not interfere with the others, as can be seen in Equations (5) and (6). Furthermore, due to the condition of mode dispersion, the full distortion of the image passing through the MMF, with different propagation constants β v u , arrives at the output end with different phase delays for each mode [30]. The speckle image MMF output is the distortion produced by the light field at the input according to different weight distributions, n ( r ,   θ ) is used to denote the weight coefficients, and the light field at the output can be represented as:
E o u t r , θ = r   θ n r , θ E i n r , θ
Equation (7) shows that the output light field E o u t r , θ is a weighted sum of the input light field E i n r , θ , where the weighting coefficients n r , θ represent the mode dispersion effects in a multimode optical fiber. These weighting coefficients n r , θ determine how much each mode of the input optical field contributes to the output speckle pattern and are directly related to the image reconstruction techniques that will be discussed in the subsequent sections. The goal is to reverse this process and recover the original input image from the distorted speckle image at the output end in the image reconstruction process.

3. Methods

3.1. Experimental Setup
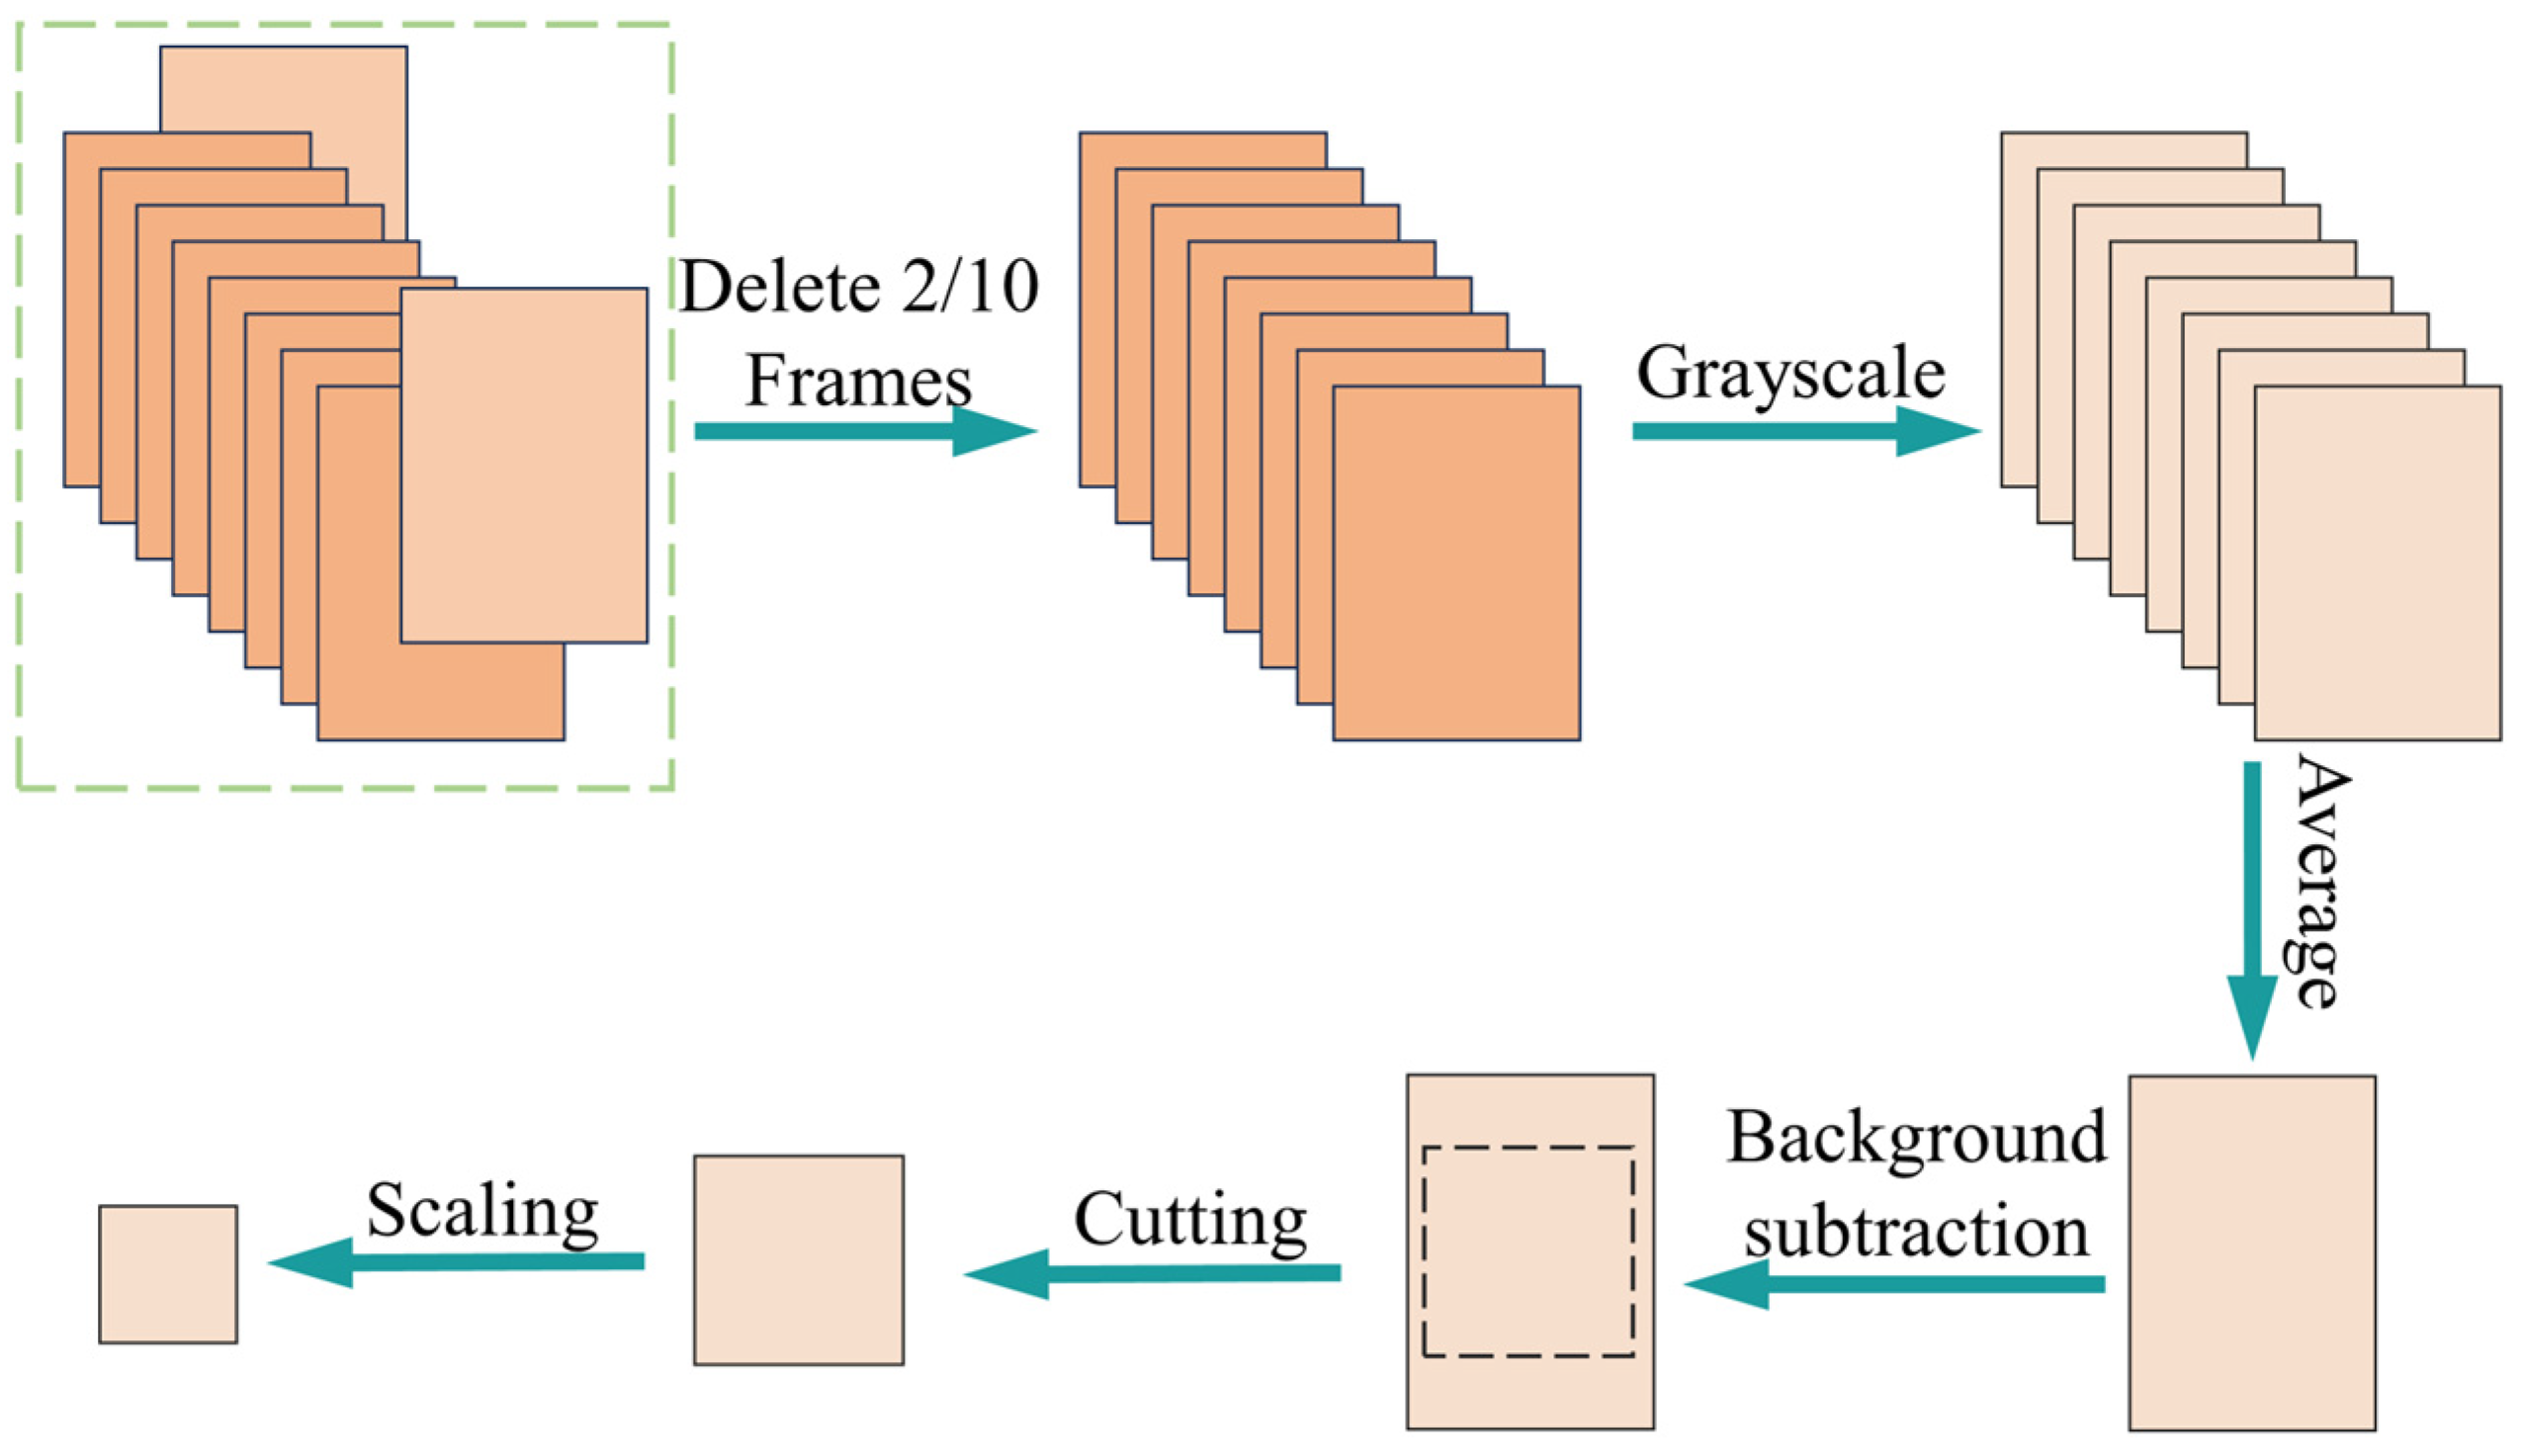
Figure 1 depicts the experimental setup used to recreate the output speckle. All experiments are performed in stable environmental conditions, kept at a temperature of 26 °C with air conditioning and maintaining sufficient mechanical stability with a precision optical platform. The laser beam of 660 nm wavelength is generated by the laser (Thorlabs, S1FC660, Newton, NJ, USA). The convex lens 1 (Edmund, #89-004, Barrington, NJ, USA) is used to transmit the laser light, and the resulting parallel light is modulated by the digital micromirror device (DMD, CAS Microstar, DMD-1K045-02-8) with pixels of 1280 × 800. The DMD builds an array of thousands of tiny mirrors by using microelectromechanical systems (MEMS) technology. The independent rotation of each micromirror around an axis makes it possible to precisely control and modulate the incident beam. Due to the DMD’s differential reflection behavior, only the light rays that make up the target’s digit image can be incident on the convex lens 2 (Edmund, #89-004). Light reflected from the DMD enters a 20.0 cm multimode POF (1.0 mm core diameter, QY40-2.2E, Mitsubishi, Chiyoda City, Japan) at the focal point of L2, ensuring that all light converges precisely on the input face of the POF. The speckle pattern output from the POF was amplified by the convex L3 (Edmund, #65-494) and recorded by a 1280 × 1024-pixel CCD (Hikvision, MV-CA013-A0UM, Hangzhou, China) at a fixed frame rate of 30 fps as video for storage. The video was subsequently transferred to frame-by-frame output as images for speckle reconstruction.
During the data collection phase, the modulated images on the DMD were taken from the MNIST dataset [31]. The MNIST dataset consists of 28 × 28 grayscale handwritten numbers. The MNIST handwritten-digit database has a training set of 60,000 examples and a test set of 10,000 examples. Videos created with digit photos from the MNIST dataset can collect many images for training. Each digit image displays a sequence of 10 frames within the video, that has a frame rate of 30 fps.

3.2. Image Process

Following the steps depicted in Figure 2, the videos captured by the CCD are preprocessed into a suitable training set comprising speckle images. The CCD-captured videos and the MNIST digit image videos are 30 fps, and each digit in the MNIST digit videos is displayed for 10 frames. The captured videos are outputted frame by frame, and to ensure that the speckle image and the digit image keep corresponding to each other, the first and the last frames are deleted when the numbers are changed, as shown in Figure 2. Then, the remaining eight RGB images are converted into grayscale images. Those images only represent information about intensity levels, which can reduce the number of variables in the training model. After that, the eight frames are averaged to minimize the effect of light source variation.
The videos captured by the CCD record background light, which may introduce noise and degrade the performance of the U-Net. To minimize the influence of the environment, the background light information is recorded when the laser is turned off, and then the recorded background light information is subtracted from the speckle images. Subsequently, the speckle images are cropped to 128 × 128 pixels, as the dimension of the images captured by the CCD, which are 1024 × 1280 pixels, contains substantial information in the non-reconstructed area.

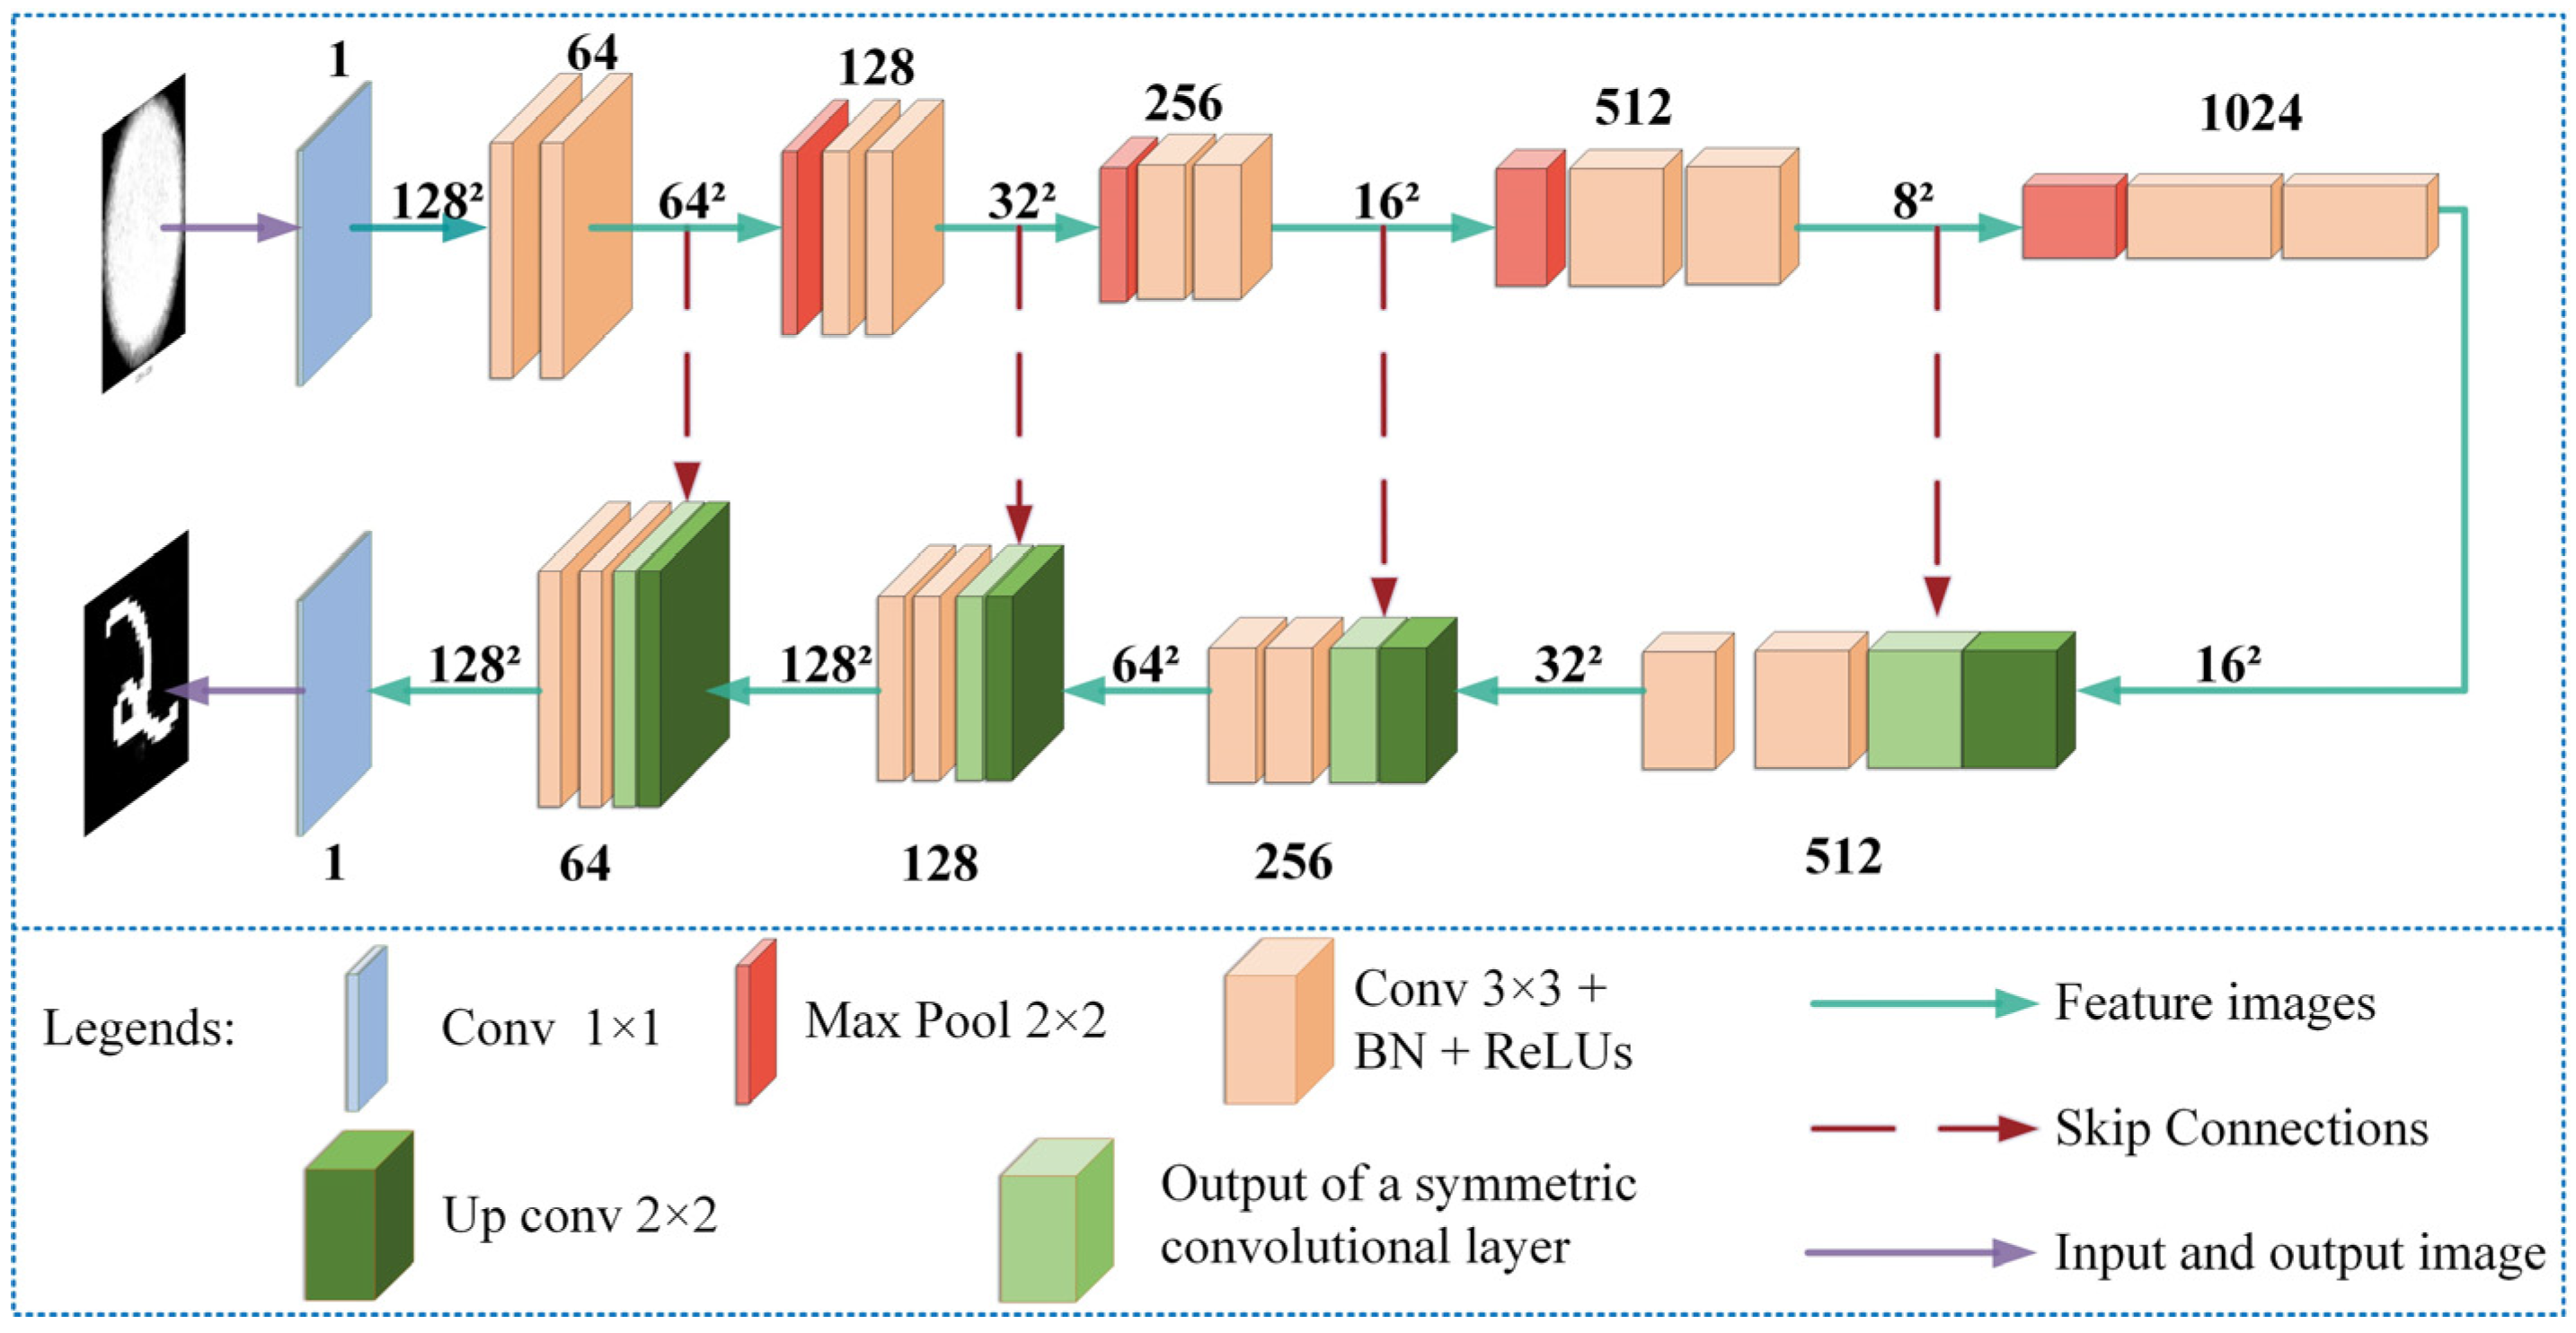
3.3. Network Structure

According to the theory of the transmission matrix, the output light field matrix E ( x , y ) and the original input matrix O ( ξ , η ) satisfy the following equation [19]:
E = T O = T 11 T 12 T 13 T 21 T 22 T 23 T 31 T 32 T 33           O 11 O 12 O 13 O 21 O 22 O 23 O 31 O 32 O 33                   = E 11 E 12 E 13 E 21 E 22 E 23 E 31 E 32 E 33            
It can be abbreviated as:
E x , y = ξ , η   T x , y ; ξ , η O ξ , η
T, the transmission matrix, is fundamental to optical fiber image reconstruction. Traditionally, the computation of T through inverse solution methods has been theoretically feasible but limited by its significant computational demands.
In this study, we utilize CNNs to intelligently estimate the inverse of the transmission matrix. CNNs are network models for deep learning commonly used in image processing, which focus on the extraction of image features by convolutional layer, nonlinear transformation by activation function, and dimensionality reduction by pooling layer. The U-Net, a specialized CNN, is distinguished by its symmetric U-shaped architecture. It is characterized by its symmetric encoder-decoder structure, where the image is gradually reduced in size by the encoder through the downsampling layer, while the decoder symmetrically upscales the feature map through the upsampling layer. Concurrently, skip connections between encoder and decoder feature maps are employed to preserve their spatial information and enhance the localization accuracy. These features enable the U-Net to extract global information from local features in the speckle map efficiently and perform image reconstruction efficiently and accurately when dealing with multimode optical fiber speckle reconstruction tasks.
The structure of the U-Net network is depicted in Figure 3. At the input layer, the network first processes two sets of 128 × 128 grayscale images, one being the preprocessed speckle images and the other being the corresponding MNIST handwritten digit images. The encoder part consists of four downsampling units, each of which contains one maximum pooling layer and two consecutive convolutional modules. In each module, the 3 × 3 convolutional layer, batch normalization (BN), and rectified linear unit (ReLU) activation functions are sequentially applied. The maximum pooling layer diminishes the spatial dimension of the feature map while doubling the number of channels, resulting in a bottleneck layer with a maximum of 1024 channels. The decoder part is similar in structure to the encoder but functions inversely. It consists of four upsampling units, each integrating a transposed convolutional layer and two 3 × 3 convolutional layers. Consistent with the encoder, each 3 × 3 convolutional layer is followed by BN and ReLU activations. The transposed convolutional layers are 2 × 2, increasing the spatial dimension of the feature map and effectively reconstructing the resolution lost during downsampling. The upsampling and downsampling layers are skip-connected, which is a feature of the U-Net architecture, bridging the high-resolution feature map from the encoder to the decoder’s feature map. This facilitates a superior reconstruction process and improvement of the prediction accuracy and robustness of the model. The final output layer is a 1 × 1 convolutional layer designed to generate a single channel output suitable for the segmentation task. The model was trained using the Adam optimizer, with a learning rate of 0.001, processing 32 images per iteration for up to 100 rounds. The learning rate is configured dynamically to adjust in response to the training loss. It can speed up convergence and prevent overfitting by closely monitoring the training loss.

4. Results and Analysis

4.1. Qualitative Analysis
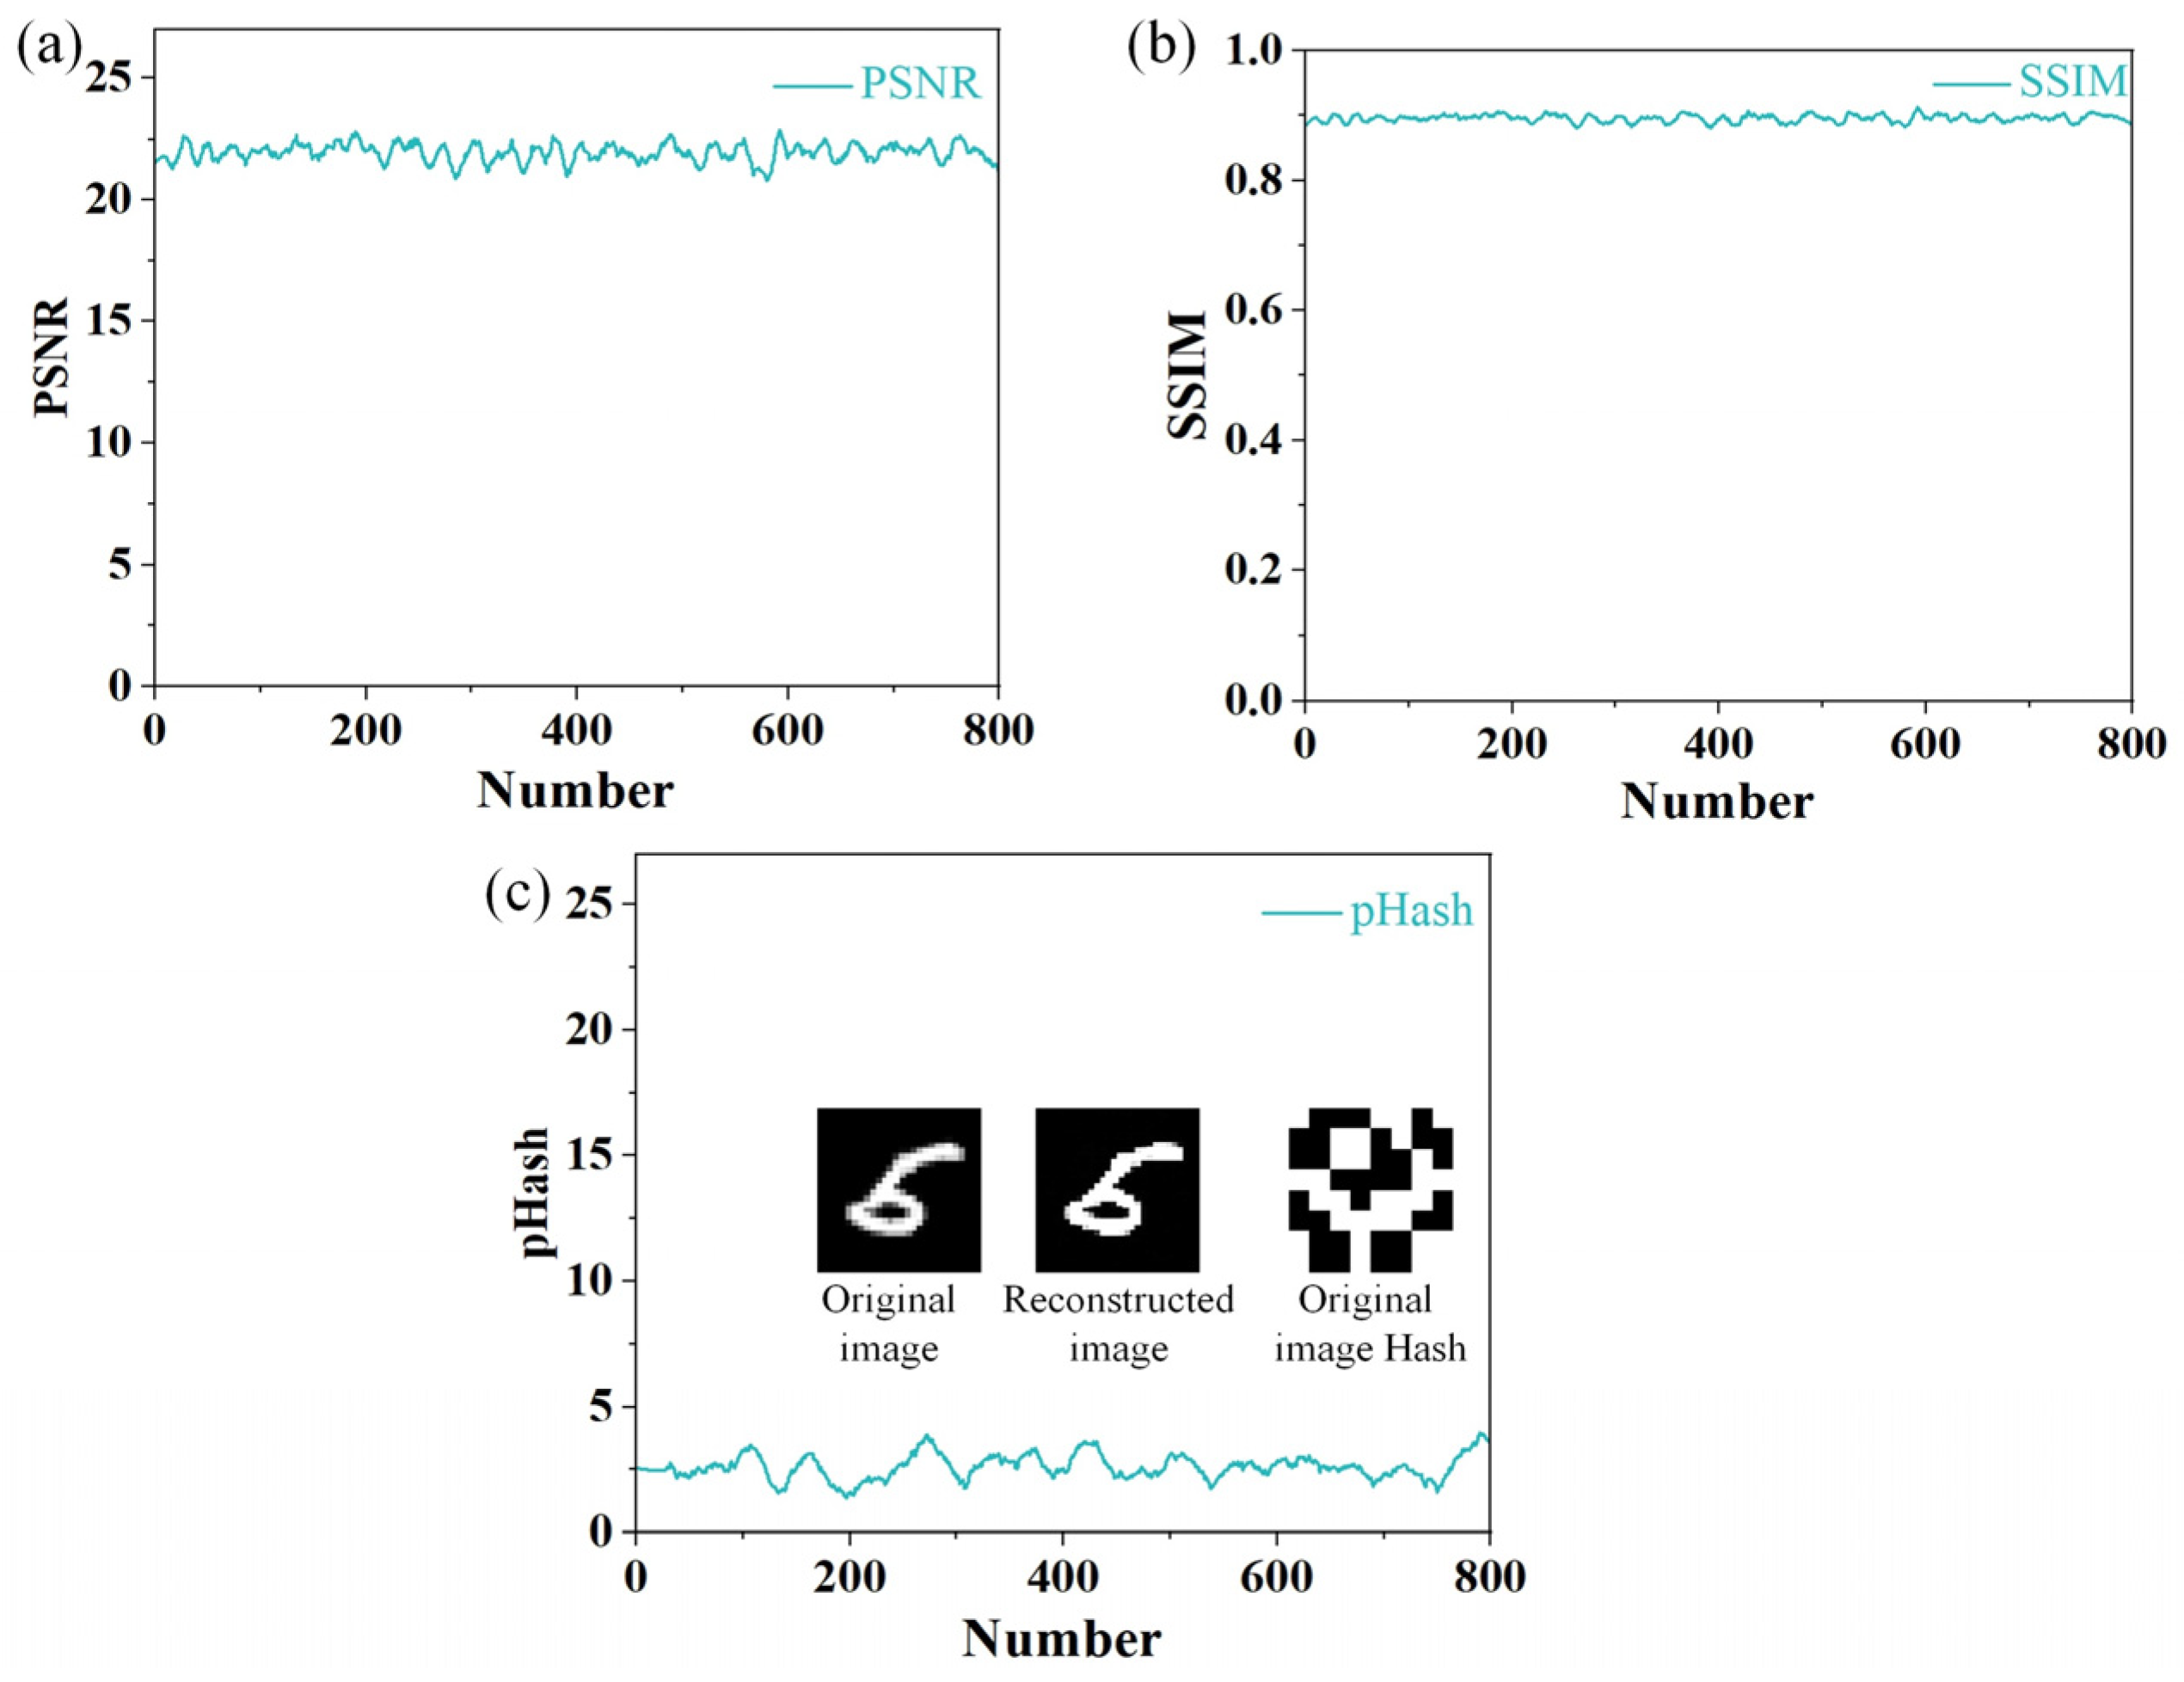
After preprocessing, 16,000 images are obtained in this experiment. Among them, 12,000 speckle images and the paired MNIST handwritten digit image dataset are used to train the U-Net, and the remaining 4000 speckle images are reserved as the test set. The trained U-Net is employed to reconstruct the 800 randomly selected speckle images in the test set to evaluate its recovery performance. Figure 4a shows the original set of handwritten digit images, which have not been modulated by the POF and thus represent the original state of the dataset images. The modulated and preprocessed speckle images are shown in Figure 4b. The trained U-Net reconstructs these speckle images, and the results are presented in Figure 4c, achieving an average accuracy of 98.48%. Figure 4d lists the enlarged edge details of the reconstructed image shown in Figure 4c. The enlarged section highlights a good part of the edge, demonstrating the effectiveness of U-Net in recovering edge features in speckle images. The result demonstrates the effectiveness of the U-Net architecture in reconstructing the speckle images. When analyzing potential influences on reconstruction accuracy, mechanical conditions and thermal fluctuations might have an influence on the reconstruction results. Fan et al. showed that an appropriately trained deep CNN can successfully recover distorted images through an MMF subject to continuous shape variations [32]. Hu et al. demonstrated that U-Net can accurately restore MNIST handwritten digitized images over a temperature range of 32 °C to 40 °C, and the average SSIM value of the reconstructed images fluctuates around 0.85 and not more than 0.3 at different temperatures [33].

4.2. PSNR Analysis

The peak signal-to-noise ratio (PSNR), a commonly used evaluation matric for assessing fidelity in image reconstruction, is adopted in this experiment. Although PSNR has limitations in handling subtle variations in color and texture, it is well suited for this experiment given that the training and testing images are grayscale images and the MNIST handwritten digit dataset has no texture. The PSNR is calculated based on the mean squared error (MSE) between the original and reconstructed images.
M S E = 1 M N i = 1 M j = 1 N ( I i j K i j ) 2
The formula for PSNR is as follows [34]:
P S N R = 10 log 10 M A X 2 M S E
MAX is the maximum pixel value of the image; here, it is 128. I is the original image, K is the reconstructed image, and M and N are the number of rows and columns of the image, respectively.
Figure 5a presents the PSNR calculation outcomes for the test set, which comprises 800 randomly selected images and U-Net-reconstructed counterparts. The average PSNR of these images is 21.9440, indicating low distortion in the image reconstruction.

4.3. SSIM Analysis

The structural similarity index (SSIM) used in this work is intended to quantitatively assess the similarity between two images by comparing the structural information between them. The value of SSIM ranges from −1 to 1, and the similarity between images is positively correlated with the value of SSIM. The formula for SSIM is as follows [35]:
S S I M x , y = 2 μ x μ y + c 1 2 σ x y + c 2 μ x 2 + μ y 2 + c 1 σ x 2 + σ y 2 + c 2
where μ x and μ y represent the mean luminance of the two images, σ x and σ x represent their standard deviation, and σ x y is their covariance. The constants c 1 and c 2 are small constants to avoid a zero denominator.
Figure 5b depicts the distribution of SSIM values, with the average SSIM value of 0.8950 for the 800 images. In the conventional image reconstruction experiments using silica multimode optical fiber carried out by Chen et al. [36], the average SSIM values for numerical and alphabetic image reconstruction are 0.6996 and 0.6293, respectively. They used a lightweight network aimed at reducing the model parameters; however, it also sacrificed part of the detail and quality of the image restoration. This suggests that POFs can be a viable solution for image reconstruction tasks, providing comparable or even better results than silica optical fibers.
In this study, autoencoder and ResNet were used to reconstruct the speckle as comparison algorithms. Table 1 shows a comparison of the results and parameters of the three algorithms. Parameters reflect the computational complexity of algorithms. The values of SSIM and PSNR are averaged over the reconstructed images, and they can show the effectiveness of the algorithms in reconstructing the Speckle image through POF. It can be found that U-Net, with a parameter count of 31.0 M, has a smaller number of parameters compared to autoencoder (61.3 M) and ResNet (43.0 M). This means that U-Net has a smaller computational complexity. Meanwhile, the U-Net-reconstructed speckle images have higher SSIM and PSNR. The comparative results justify the superiority of the U-Net algorithm in this study.

4.4. Comparison of pHash Algorithm

The pHash algorithm is used to assess the similarity of images, and it can process large-scale image collections promptly and accurately. This algorithm includes a series of computation steps: re-sizing the image to a standard size, converting it to grayscale, applying Gaussian blurring, performing DCT, quantifying the low-frequency features, and finally generating a 64-bit pHash value. Its effectiveness can be significantly improved by setting an appropriate threshold and combining it with other image analysis techniques [37]. In this experiment, the pHash values of a randomly selected set of 800 images are calculated, and the final results are depicted in Figure 5c. The inset of Figure 5c also shows how pHash values can be obtained from a specific recovery image. The average pHash value in our work is 2.649. Chen et al. reconstructed the MNIST digital images using U-Net and the improved Swin U-Net with an average pHash value of 11.212 and 8.002, respectively [38]. With the same U-Net, the training dataset in this experiment is significantly increased (12,000 sets of samples vs. 4000 sets of samples), allowing the neural network to be able to learn more features and enhance robustness. Since lower pHash values represent better reconstruction performance, our work achieves relatively better results in recovering POF output speckle images using the U-Net network.

5. Conclusions

This study explores the potential of multimode POFs for high-quality image reconstruction through speckle restoration using a CNN, specifically the conventional U-Net model. Our experimental results, based on an extensive dataset comprising MNIST handwritten digit images, reveal that the U-Net model can effectively reconstruct high-fidelity images from speckle patterns obtained via POFs, achieving an average accuracy of 98.48%. Our findings not only underscore the capability of POFs in biomedical imaging applications but also suggest their superiority compared to traditional silica-based multimode fibers in terms of image reconstruction performance, as evidenced by higher SSIM values. These results pave the way for further advancements in optical imaging technologies using POFs.

Author Contributions

Visualization, F.C., S.C. and C.Z.; validation, F.C., S.C. and C.Z.; data curation, S.C. and C.Z.; writing—original draft preparation, F.C., Y.Z., K.X., Z.W., A.L.-J. and R.M.; project administration, R.M.; funding acquisition, R.M. All authors have read and agreed to the published version of the manuscript.

Funding

This research was funded by the National Key R&D Program of China (2022YFE0140400) and the National Natural Science Foundation of China (62405027, 62111530238, 62003046). The work of R. Min was supported by the Tang Scholar of Beijing Normal University.

Institutional Review Board Statement

Not applicable.

Informed Consent Statement

Not applicable.

Data Availability Statement

Data will be made available on request.

Acknowledgments

The authors are grateful for continuing support from their respective departments.

Conflicts of Interest

The authors declare that they have no known competing financial interests or personal relationships that could have appeared to influence the work reported in this paper.

References

  1. Yang, J.; Sui, S.F.; Liu, Z. Brain structure and structural basis of neurodegenerative diseases. Biophys. Rep. 2022, 8, 170–181. [Google Scholar] [CrossRef] [PubMed]
  2. Fan, J.; Fang, L.; Wu, J.; Guo, Y.; Dai, Q. From Brain Science to Artificial Intelligence. Engineering 2020, 6, 248–252. [Google Scholar] [CrossRef]
  3. Vázquez-Guardado, A.; Yang, Y.; Bandodkar, A.J.; Rogers, J.A. Recent advances in neurotechnologies with broad potential for neuroscience research. Nat. Neurosci. 2020, 23, 1522–1536. [Google Scholar] [CrossRef] [PubMed]
  4. Rivnay, J.; Wang, H.; Fenno, L.; Deisseroth, K.; Malliaras, G.G. Next-generation probes, particles, and proteins for neural interfacing. Sci. Adv. 2017, 3, e1601649. [Google Scholar] [CrossRef]
  5. Kwon, Y.W.; Jun, Y.S.; Park, Y.-G.; Jang, J.; Park, J.-U. Recent advances in electronic devices for monitoring and modulation of brain. Nano Res. 2021, 14, 3070–3095. [Google Scholar] [CrossRef]
  6. Akemann, W.; Wolf, S.; Villette, V.; Mathieu, B.; Tangara, A.; Fodor, J.; Ventalon, C.; Léger, J.-F.; Dieudonné, S.; Bourdieu, L. Fast optical recording of neuronal activity by three-dimensional custom-access serial holography. Nat. Methods 2022, 19, 100–110. [Google Scholar] [CrossRef]
  7. Ji, N.; Freeman, J.; Smith, S.L. Technologies for imaging neural activity in large volumes. Nat. Neurosci. 2016, 19, 1154–1164. [Google Scholar] [CrossRef]
  8. Barson, D.; Hamodi, A.S.; Shen, X.; Lur, G.; Constable, R.T.; Cardin, J.A.; Crair, M.C.; Higley, M.J. Simultaneous mesoscopic and two-photon imaging of neuronal activity in cortical circuits. Nat. Methods 2020, 17, 107–113. [Google Scholar] [CrossRef]
  9. Saito, A.; Takahashi, M.; Jimbo, Y.; Nakasono, S. Non-conductive and miniature fiber-optic imaging system for real-time detection of neuronal activity in time-varying electromagnetic fields. Biosens. Bioelectron. 2017, 87, 786–793. [Google Scholar] [CrossRef]
  10. Chen, S.; Wang, Z.; Xiao, K.; He, B.; Zhao, J.; Yang, X.; Liu, Q.; Sharma, A.K.; Leal Junior, A.; Min, R. A comprehensive review of optical fiber technologies in optogenetics and their prospective developments in future clinical therapies. Opt. Laser Technol. 2024, 179, 111332. [Google Scholar] [CrossRef]
  11. Kuang, R.; Wang, Z.; Ma, L.; Wang, H.; Chen, Q.; Junior, A.L.; Kumar, S.; Li, X.; Marques, C.; Min, R. Smart photonic wristband for pulse wave monitoring. Opto-Electron. Sci. 2024, 3, 240009. [Google Scholar] [CrossRef]
  12. Abdulaziz, A.; Mekhail, S.P.; Altmann, Y.; Padgett, M.J.; McLaughlin, S. Robust real-time imaging through flexible multimode fibers. Sci. Rep. 2023, 13, 11371. [Google Scholar] [CrossRef]
  13. Gao, Z.; Jiang, T.; Zhang, M.; Wu, H.; Tang, M. Optical semantic communication through multimode fiber: From symbol transmission to sentiment analysis. Light Sci. Appl. 2025, 14, 60. [Google Scholar] [CrossRef] [PubMed]
  14. He, G. Optical phase conjugation: Principles, techniques, and applications. Prog. Quantum Electron. 2002, 26, 131–191. [Google Scholar] [CrossRef]
  15. Vellekoop, I.M.; Mosk, A.P. Focusing coherent light through opaque strongly scattering media. Opt. Lett. 2007, 32, 2309. [Google Scholar] [CrossRef]
  16. Mosk, A.P.; Lagendijk, A.; Lerosey, G.; Fink, M. Controlling waves in space and time for imaging and focusing in complex media. Nat. Photonics 2012, 6, 283–292. [Google Scholar] [CrossRef]
  17. Popoff, S.M.; Lerosey, G.; Carminati, R.; Fink, M.; Boccara, A.C.; Gigan, S. Measuring the Transmission Matrix in Optics: An Approach to the Study and Control of Light Propagation in Disordered Media. Phys. Rev. Lett. 2010, 104, 100601. [Google Scholar] [CrossRef]
  18. Kim, M.; Choi, W.; Choi, Y.; Yoon, C.; Choi, W. Transmission matrix of a scattering medium and its applications in biophotonics. Opt. Express 2015, 23, 12648. [Google Scholar] [CrossRef]
  19. Li, S.; Saunders, C.; Lum, D.J.; Murray-Bruce, J.; Goyal, V.K.; Čižmár, T.; Phillips, D.B. Compressively sampling the optical transmission matrix of a multimode fibre. Light Sci. Appl. 2021, 10, 88. [Google Scholar] [CrossRef]
  20. Sun, Y.; Shi, J.; Sun, L.; Fan, J.; Zeng, G. Image reconstruction through dynamic scattering media based on deep learning. Opt. Express 2019, 27, 16032. [Google Scholar] [CrossRef]
  21. Li, Z.; Zhou, W.; Zhou, Z.; Zhang, S.; Shi, J.; Shen, C.; Zhang, J.; Chi, N.; Dai, Q. Self-supervised dynamic learning for long-term high-fidelity image transmission through unstabilized diffusive media. Nat. Commun. 2024, 15, 1498. [Google Scholar] [CrossRef]
  22. Resisi, S.; Popoff, S.M.; Bromberg, Y. Image Transmission Through a Dynamically Perturbed Multimode Fiber by Deep Learning. Laser Photonics Rev. 2021, 15, 2000553. [Google Scholar] [CrossRef]
  23. Zhang, Y.; Gong, Z.; Wei, Y.; Wang, Z.; Hao, J.; Zhang, J. Image transmission through a multimode fiber based on transfer learning. Opt. Fiber Technol. 2023, 79, 103362. [Google Scholar] [CrossRef]
  24. Xu, R.; Zhang, L.; Liu, K.; Zhang, H.; Zhang, D. High-fidelity imaging through a perturbed multimode fiber using a u-architecture network with fully connected layers. Appl. Opt. 2025, 64, 543. [Google Scholar] [CrossRef]
  25. Zhao, J.; Ji, X.; Zhang, M.; Wang, X.; Chen, Z.; Zhang, Y.; Pu, J. High-fidelity imaging through multimode fibers via deep learning. J. Phys. Photonics 2021, 3, 015003. [Google Scholar] [CrossRef]
  26. Caravaca-Aguirre, A.M.; Niv, E.; Conkey, D.B.; Piestun, R. Real-time resilient focusing through a bending multimode fiber. Opt. Express 2013, 21, 12881. [Google Scholar] [CrossRef]
  27. Leal-Junior, A.; Díaz, C.; Frizera, A.; Lee, H.; Nakamura, K.; Mizuno, Y.; Marques, C. Highly Sensitive Fiber-Optic Intrinsic Electromagnetic Field Sensing. Adv. Photonics Res. 2021, 2, 2000078. [Google Scholar] [CrossRef]
  28. Hu, G.; Qin, Y.; Tsang, H.K. Multimode Fiber Speckle Imaging Using Integrated Optical Phased Array and Wavelength Scanning. J. Light Technol. 2024, 42, 3385–3392. [Google Scholar] [CrossRef]
  29. Spillman, W.B.; Kline, B.R.; Maurice, L.B.; Fuhr, P.L. Statistical-mode sensor for fiber optic vibration sensing uses. Appl. Opt. 1989, 28, 3166. [Google Scholar] [CrossRef]
  30. Lee, S.-Y.; Parot, V.J.; Bouma, B.E.; Villiger, M. Efficient dispersion modeling in optical multimode fiber. Light Sci. Appl. 2023, 12, 31. [Google Scholar] [CrossRef] [PubMed]
  31. Deng, L. The MNIST Database of Handwritten Digit Images for Machine Learning Research [Best of the Web]. IEEE Signal Process. Mag. 2012, 29, 141–142. [Google Scholar] [CrossRef]
  32. Fan, P.; Zhao, T.; Su, L. Deep learning the high variability and randomness inside multimode fibers. Opt. Express 2019, 27, 20241. [Google Scholar] [CrossRef]
  33. Hu, S.; Liu, F.; Song, B.; Zhang, H.; Lin, W.; Liu, B.; Duan, S.; Yao, Y. Multimode fiber image reconstruction based on parallel neural network with small training set under wide temperature variations. Opt. Laser Technol. 2024, 175, 110815. [Google Scholar] [CrossRef]
  34. Li, S.; Horsley, S.A.R.; Tyc, T.; Čižmár, T.; Phillips, D.B. Memory effect assisted imaging through multimode optical fibres. Nat. Commun. 2021, 12, 3751. [Google Scholar] [CrossRef]
  35. Liu, D.; Zhong, L.; Wu, H.; Li, S.; Li, Y. Remote sensing image Super-resolution reconstruction by fusing multi-scale receptive fields and hybrid transformer. Sci. Rep. 2025, 15, 2140. [Google Scholar] [CrossRef]
  36. Chen, H.; He, Z.; Zhang, Z.; Geng, Y.; Yu, W. Binary amplitude-only image reconstruction through a MMF based on an AE-SNN combined deep learning model. Opt. Express 2020, 28, 30048. [Google Scholar] [CrossRef]
  37. Samanta, P.; Jain, S. Analysis of Perceptual Hashing Algorithms in Image Manipulation Detection. Procedia Comput. Sci. 2021, 185, 203–212. [Google Scholar] [CrossRef]
  38. Chen, Y.; Song, B.; Wu, J.; Lin, W.; Huang, W. Deep learning for efficiently imaging through the localized speckle field of a multimode fiber. Appl. Opt. 2023, 62, 266. [Google Scholar] [CrossRef]
Figure 1. Schematic of speckle pattern experiment with POF. The laser beam L1 generated by the 660 nm laser instrument was converted to parallel light modulated by a DMD (CAS Microstar, Xi’an, China, DMD-1K045-02-8). The modulated light passes through L2 into a POF of 20 cm. The speckle image output from the POF is amplified by L3 and captured by the CCD. The captured speckle patterns are analyzed frame by frame, derived from the MNIST dataset of 28 × 28-pixel grayscale images, providing a rich dataset for training and analysis.
Photonics 12 00434 g001
Figure 2. CCD image processing steps.
Photonics 12 00434 g002
Figure 3. U-Net-based network architecture.
Photonics 12 00434 g003
Figure 4. (a) Original handwritten digit images; (b) synthetic speckle images CCD capture; (c) reconstructed images via U-Net architecture; (d) details and edge of reconstructed image.
Photonics 12 00434 g004
Figure 5. (a) The PSNR of reconstructed and original images; (b) the SSIM of reconstructed and original images; (c) the pHash value of reconstructed and original image. The inset highlights examples of original and reconstructed images and hashed image.
Photonics 12 00434 g005
Table 1. Comparison of reconstruction results in different networks.
SSIMPSNRParameters
U-net0.89521.944031.0M
Autoenconder0.86219.742361.3M
ResNet0.85819.599743.0M
Disclaimer/Publisher’s Note: The statements, opinions and data contained in all publications are solely those of the individual author(s) and contributor(s) and not of MDPI and/or the editor(s). MDPI and/or the editor(s) disclaim responsibility for any injury to people or property resulting from any ideas, methods, instructions or products referred to in the content.

