Article

Feasibility of Photoplethysmography in Detecting Arterial Stiffness in Hypertension

by
Parmis Karimpour
*,
James M. May
and
Panicos A. Kyriacou
Research Centre for Biomedical Engineering, City St George’s, University of London, London EC1V 0HB, UK
*
Author to whom correspondence should be addressed.
Photonics 2025, 12(5), 430; https://doi.org/10.3390/photonics12050430
Submission received: 24 March 2025 / Revised: 24 April 2025 / Accepted: 28 April 2025 / Published: 29 April 2025

Abstract

:
Asymptomatic peripheral artery disease (PAD) poses a silent risk, potentially leading to severe conditions if undetected. Integrating new screening tools into routine general practitioner (GP) visits could enable early detection. This study investigates the feasibility of photoplethysmography (PPG) monitoring for assessing vascular health across different blood pressure (BP) conditions. Custom femoral artery phantoms representing healthy (0.82 MPa), intermediate (1.48 MPa), and atherosclerotic (2.06 MPa) vessels were tested under hypertensive, normotensive, and hypotensive conditions to evaluate PPG’s ability to distinguish between vascular states. Extracted features from the PPG signal, including amplitude, area under the curve (AUC), median upslope–downslope ratio, and median end datum difference, were analysed. Kruskal–Wallis tests revealed significant differences between healthy and unhealthy vessels across BP states, supporting PPG as a screening tool. The fiducial points from the second derivative of the photoplethysmography signal (SDPPG) were analysed. The b a ratio was most pronounced between healthy and unhealthy phantoms under hypertensive conditions (ranging from –2.13 to –2.06), suggesting a change in vascular wall distensibility. Under normotensive conditions, the difference in b a ratios between healthy and unhealthy phantoms was smaller (0.01), and no meaningful difference was observed under hypotensive conditions, suggesting the reduced sensitivity of this metric at lower perfusion pressures. Intermediate states were challenging to detect, particularly under hypotension, suggesting a need for further research. Nonetheless, this study highlights the promise of PPG monitoring in identifying vascular stiffness.

1. Introduction

Cardiovascular diseases (CVDs), which include conditions affecting the heart and blood vessels, were responsible for approximately one-third of all global deaths in 2021, resulting in 20.5 million fatalities [1]. Inevitably, vessels age and undergo changes that can lead to degeneration and elevate the risk of CVDs [2]. One notable change, which occurs during vascular ageing, is increased arterial stiffness, leading to volumetric, mechanical, and haemodynamic alterations to the vascular network. Arterial stiffness can restrict vessel expansion, potentially disrupting blood flow. Diseases arising from vascular ageing, such as peripheral arterial disease (PAD), can affect both upper and lower blood vessels. PAD patients often exhibit no visible symptoms, making early detection challenging. Identifying PAD early can help prevent cardiovascular death, which results from insufficient blood flow to organs and tissues due to narrowed or blocked arteries. This early detection is particularly vital for asymptomatic patients [2,3].
High blood pressure (BP), known as hypertension, stands out as a prevalent risk factor for CVD [4]. Hypertension can be influenced by various environmental factors, including smoking and alcohol consumption, as well as by age and genetic predisposition [5]. Roughly 47% of global coronary heart diseases are linked to high BP [6], emphasising the significance of exploring the relationship between hypertension and CVD. Previously, the creation of custom silicone vessels and the capability of photoplethysmography (PPG), an optical sensing technique, to distinguish between vessels with different elasticities has been explored [7].
The study presented here builds on previous methods developed by The Research Centre for Biomedical Engineering, City St. George’s, University of London (RCBE) [7], aiming to simulate varying BP (high, normal, and low) in a controlled in vitro study to examine vascular ageing. Three types of vessels—healthy, intermediate, and unhealthy—are introduced, with properties closely matching those of human vessels. Each vessel is subjected to different BP conditions to unravel the link between PPG signal morphology and BP fluctuations during vascular ageing, with the hypothesis that stiffness related to CVDs, such as PAD, may be detectable under higher BP states. While previous studies have used PPG to assess vascular health, many rely on in vivo data [8,9,10], which introduces biological variability and limits reproducibility. In contrast, this study offers a reproducible in vitro framework that allows for the independent variation of vessel properties and BP levels. The novelty of this work lies in its integration of physiologically realistic artificial vessels within a controlled in vitro system, allowing for the precise manipulation of BP conditions.

2. Methods

Femoral arteries with properties closely matching those of human femoral arteries were fabricated. These were integrated into an in vitro setup, where varying BP stages (high, normal, and low) were introduced to observe PPG signals corresponding to each health status, with the heart maintained at 66 bpm. The signals were then observed and analysed for statistical significance.

2.1. Fabrication of Femoral Arteries

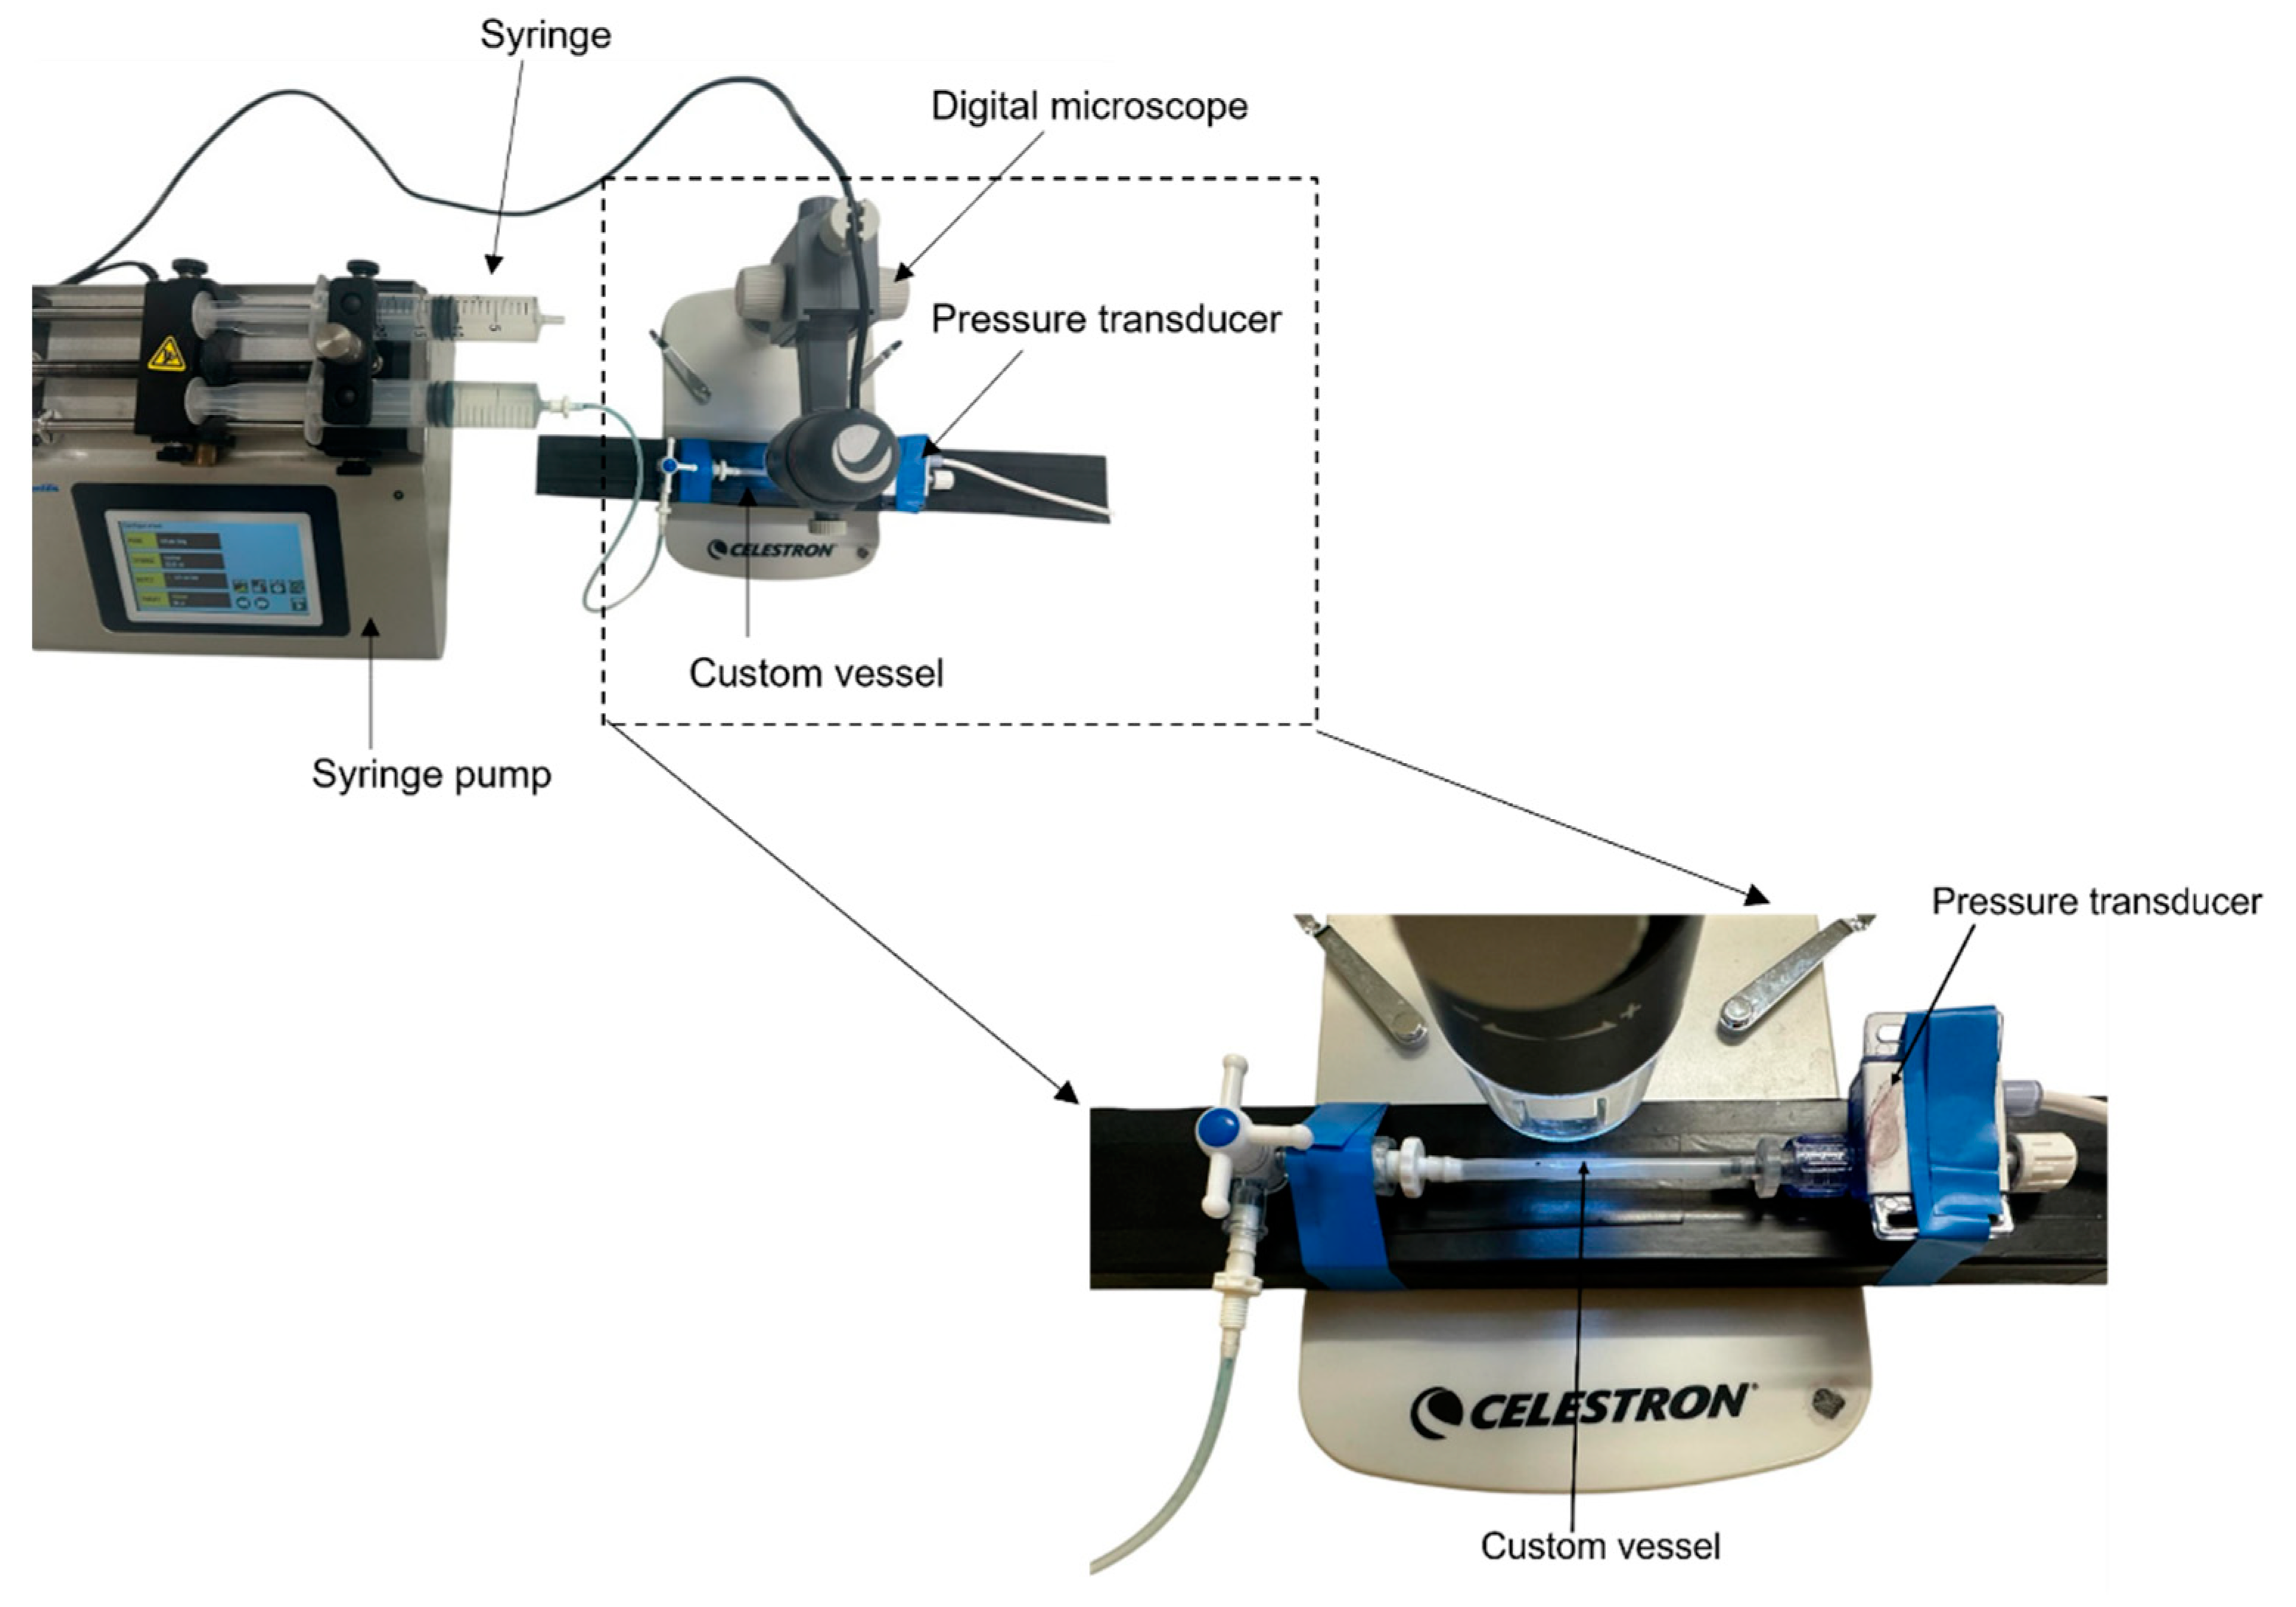
The fabrication followed and built upon the previous research conducted by our research lab. In that study, the vessels were mechanically characterised to determine their mechanical properties, which were then adjusted to match those of human femoral arteries [7,11]. One represented a healthy femoral artery with a Young’s Modulus of 0.82 MPa, another represented an atherosclerotic femoral artery with a Young’s Modulus of 2.06 MPa, and the third was an intermediate vessel between the former two with a Young’s Modulus of 1.48 MPa. The elasticity was measured using a Universal Testing System (Instron 5944, Norwood, MA, USA) in a tensile test configuration, with the procedure set in accordance with the ASTM D412-16 [12] standard as previously described [7,13]. The inner and outer diameters of the vessels embedded in the phantom were measured at 2.95 mm and 3.96 mm, respectively, in the previous study. These measurements fall within the reported literature range for the femoral artery’s outer diameter, which spans from 3.9 mm to 8.9 mm [7,14]. To determine the compliance, vessels were cut into lengths ranging from 5 to 10.5 cm and connected to a syringe pump (kdScientific, Holliston, MA, USA) in a closed system (Figure 1). It was assumed that the vessel elasticity was uniform and homogeneous along the length. Water increments of 20 µL were pumped in to induce inflation, and the internal pressure (mmHg) was measured using a pressure transducer. The water increments were introduced progressively, increasing the pressure in the range of 0 to 160 mmHg to represent hypotensive to hypertensive conditions. During this process, images were captured using a digital microscope (Celestron, Torrance, CA, USA), as illustrated in Figure 1. Changes in diameter were measured using MATLAB (Version R2023a, 9.14, MathWorks, Natick, MA, USA), and the cross-sectional area was subsequently calculated. The compliance was determined by calculating the ratio of the change in cross-sectional area to the change in pressure (δs/δp) [15,16]. A precision ruler was used as a calibration tool to ensure accurate measurements. Tissue was then created to surround these vessels, following a similar procedure as outlined previously [7], to make vessel-tissue phantoms that mimicked surrounding blood vessel tissue.

2.2. In Vitro Cardiovascular System Configuration

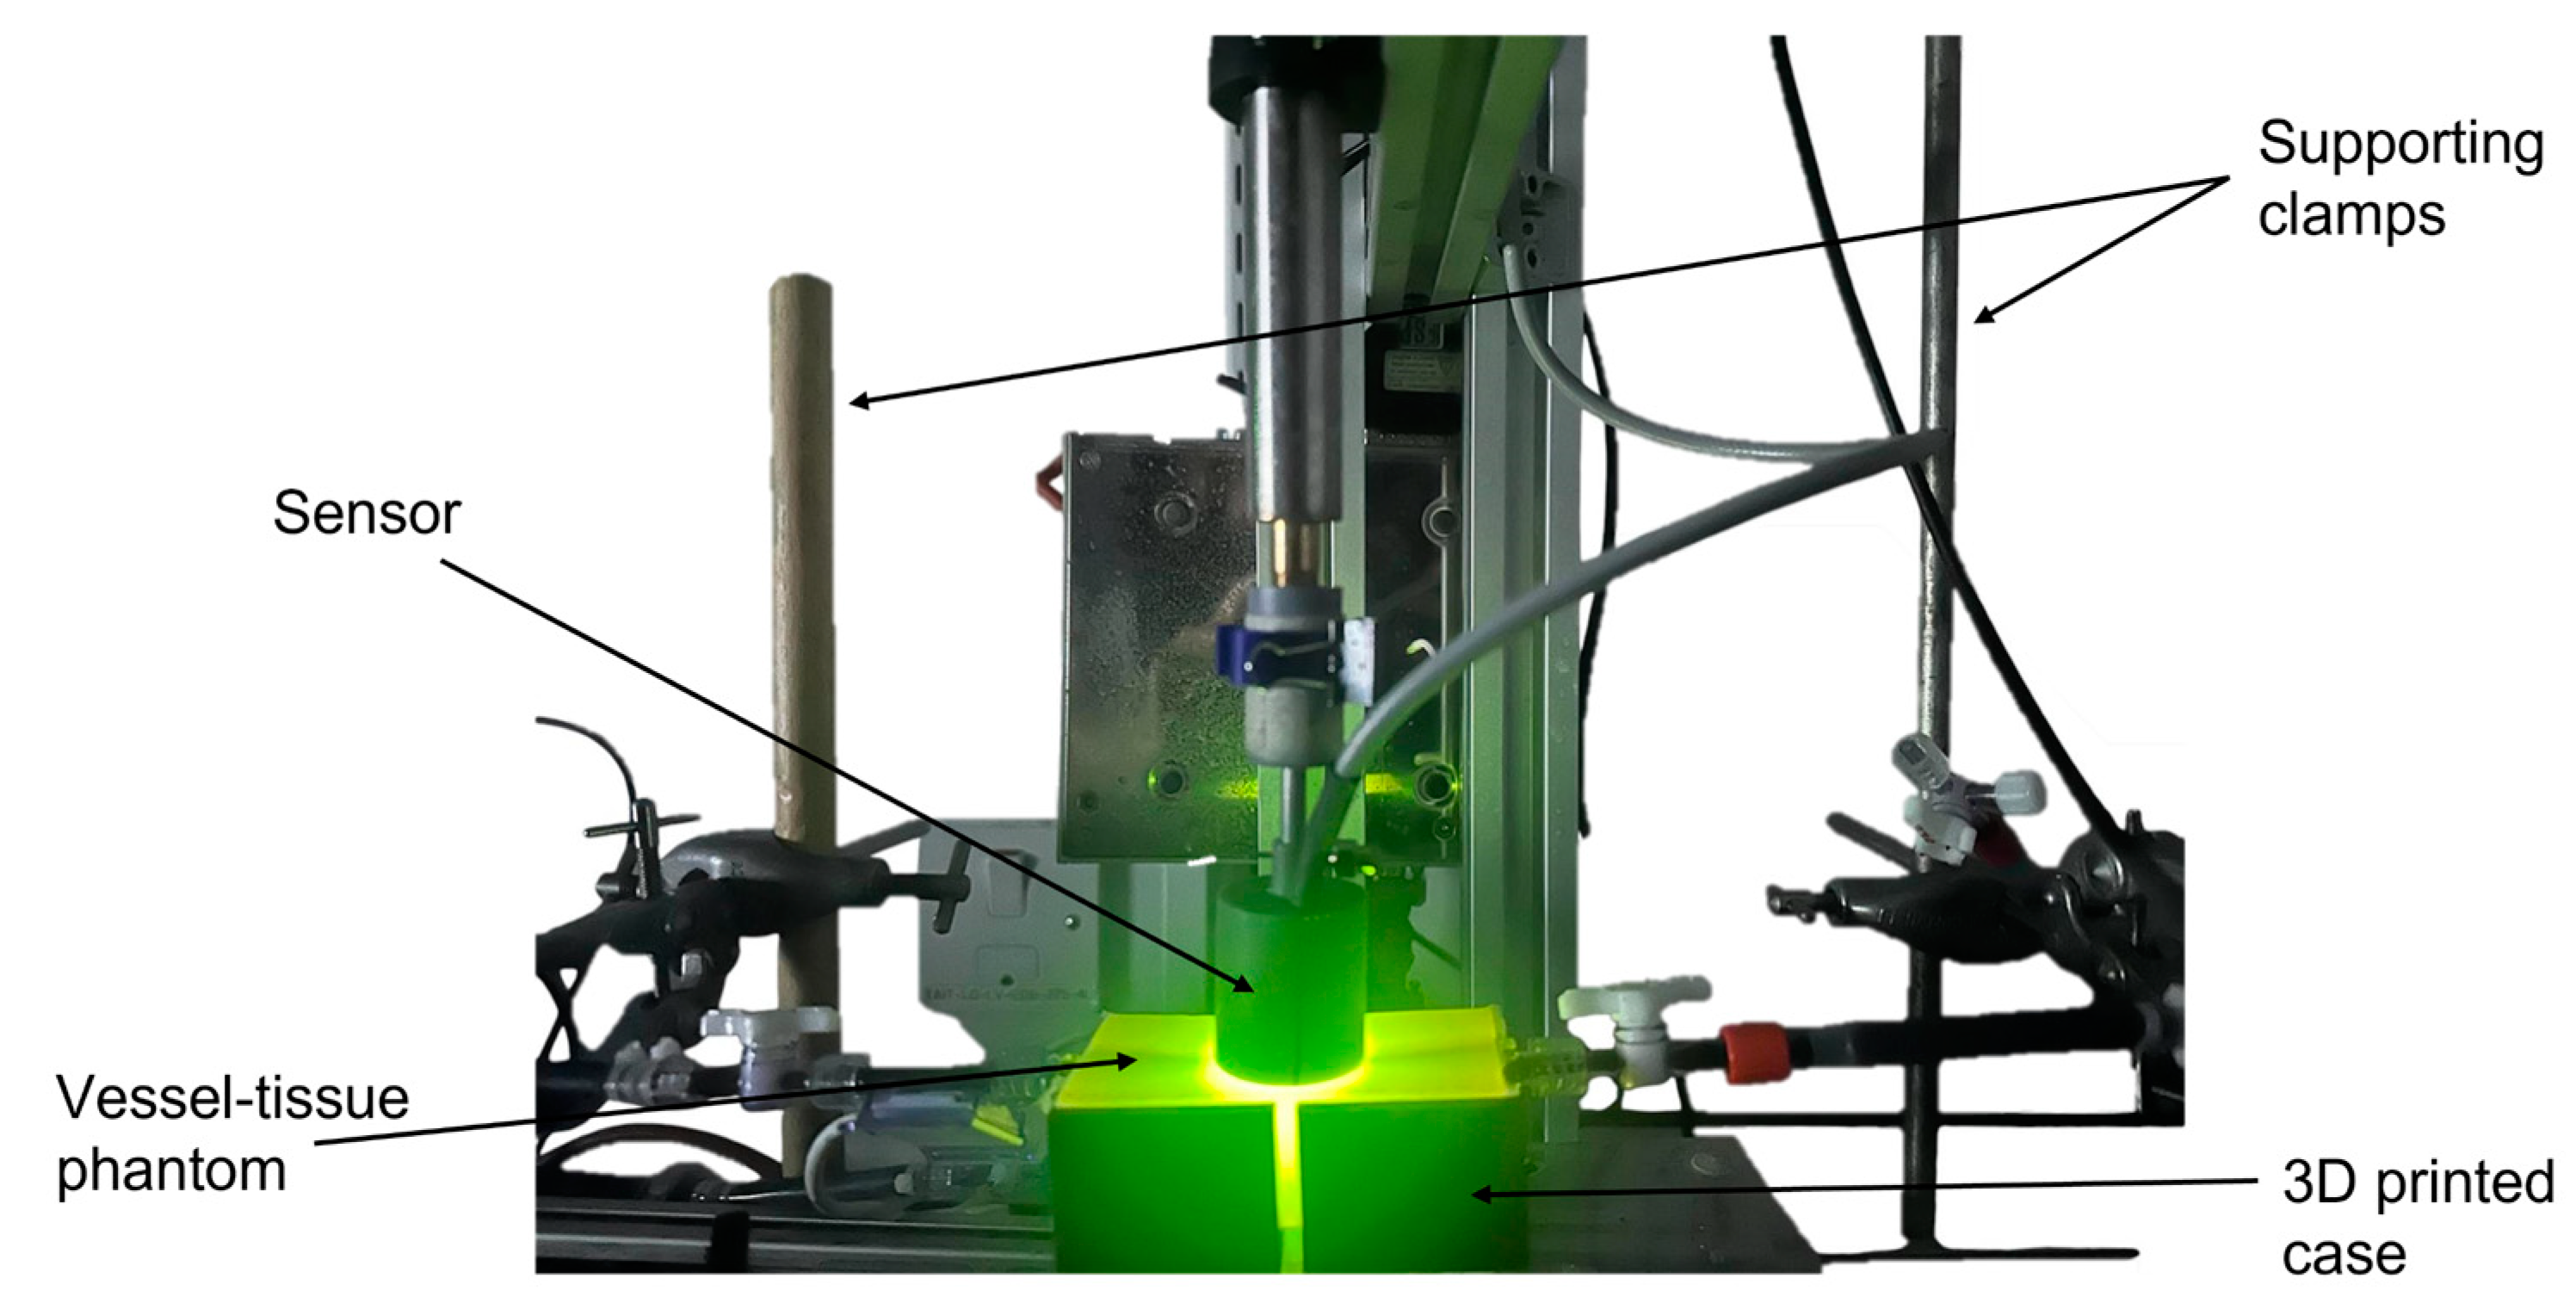
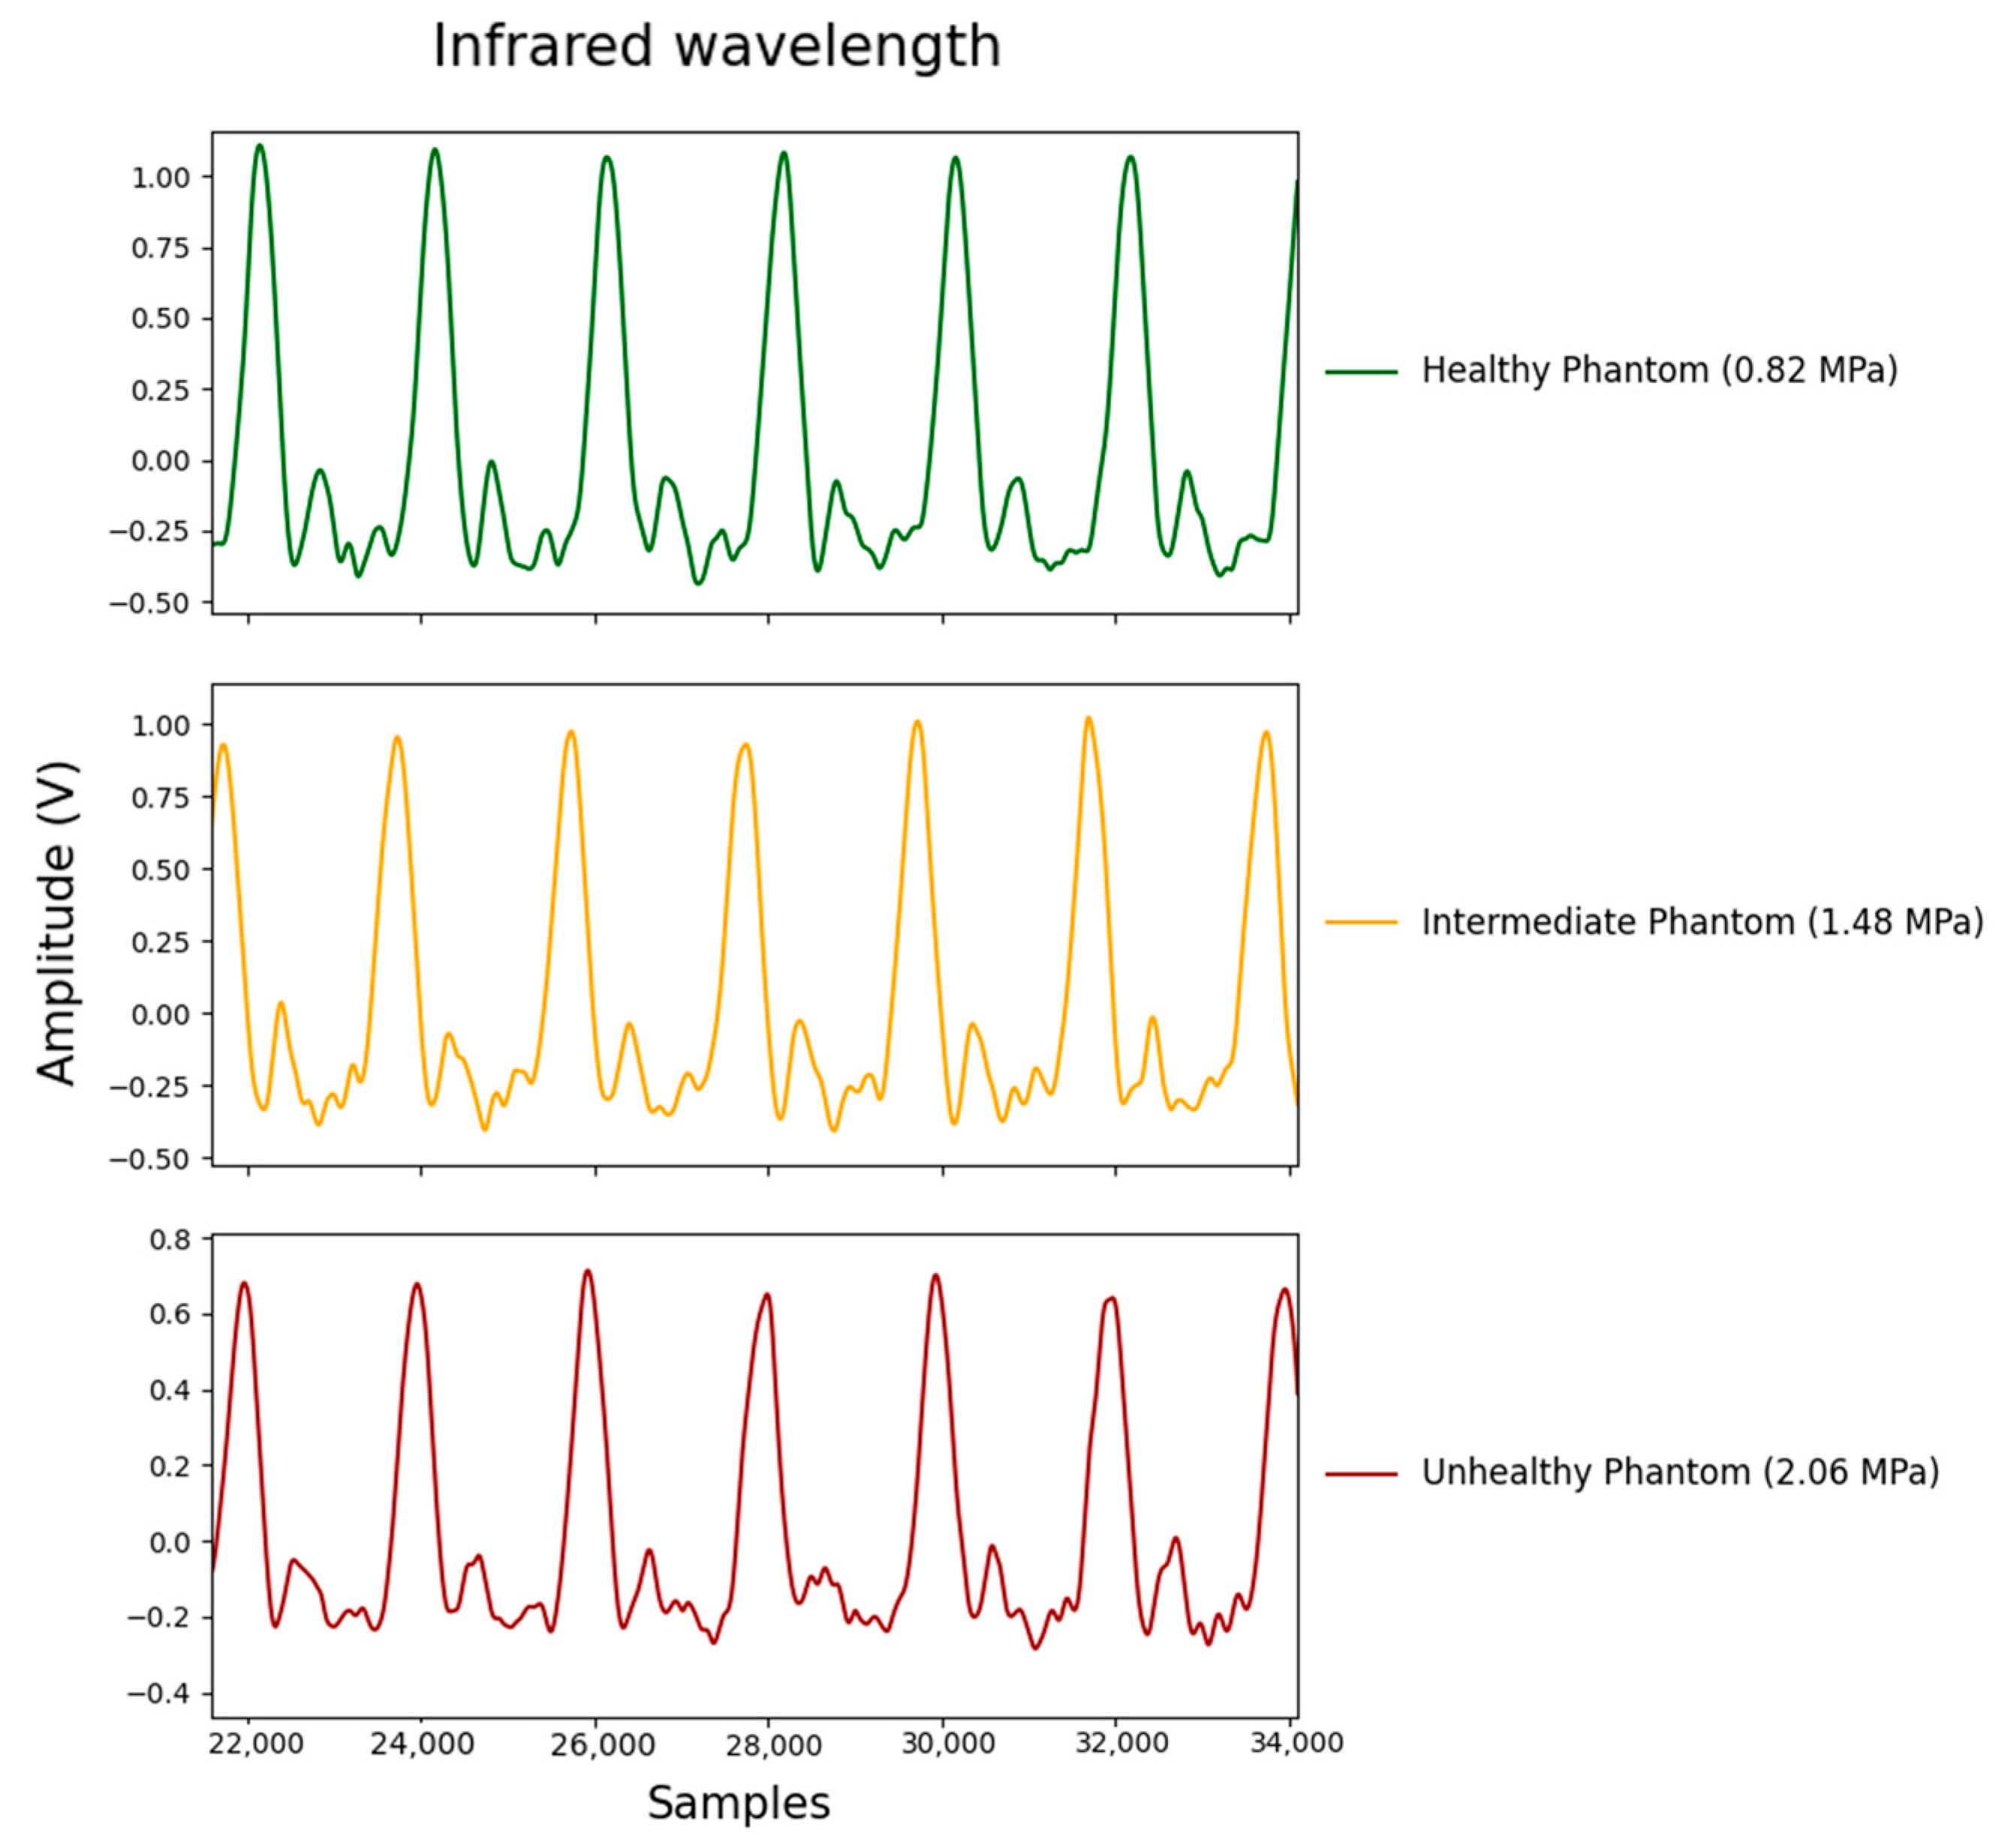
The fabricated phantoms were then integrated into a previously described in vitro vascular system [17]. This vascular system mimicked the lower body, starting from the aorta and branching into the femoral and tibial regions. To simulate blood flow, a fluid composed of deionised water, Indian ink (Jackson’s Art Supplies, London, UK), Wright stain (Thermo Fisher Scientific Inc, Waltham, MA, USA), and Congo red powder (BDH Chemicals LTD, Poole, UK) was circulated throughout the system using a pulsatile pump (PD-1100, BDC Laboratories, Wheat Ridge, CO, USA) operating at 66 bpm. A PPG sensor in reflectance mode, equipped with three wavelengths (green at 530 nm, red at 655 nm, and infrared at 940 nm), was positioned above the phantom to capture the signals, as shown in Figure 2, and recorded as illustrated in the example in Figure 3. This sensor was interfaced with a PPG acquisition system, operating at a sampling frequency of 2000 Hz, developed by RCBE [18]. The light intensity of the sensor was determined by the current of three light-emitting diodes (LEDs) integrated into the PPG sensor, which were set to 40 mA.

2.3. Determining Blood Pressure Values

To stabilise the BP values, categorised as high, low, and normal, a pressure sensor (PendoTECH, Princeton, NJ, USA) was connected at the beginning of the return flow branch. Variations in BP were induced by the pulsatile pump, generating pressure waves. A clamp was placed on the return branch to modulate system pressure, allowing precise control to reach the target BP levels. The pump itself featured an adjustable resistance clamp, which was fine-tuned to maintain the desired pressure. Additionally, a second pressure sensor was positioned within the setup, before the phantom, to record pressure levels prior to the phantom. Blood pressure values ( S y s t o l i c D i a s t o l i c m m H g ) were pre-set at the beginning of each run of the protocol. The hypertensive state was defined as 148/113 mmHg, the normotensive state as 121/87 mmHg, and the hypotensive state as 85/59 mmHg. These values were carefully adjusted to closely replicate BP ranges reported in the literature [19,20].

2.4. Feature Extraction

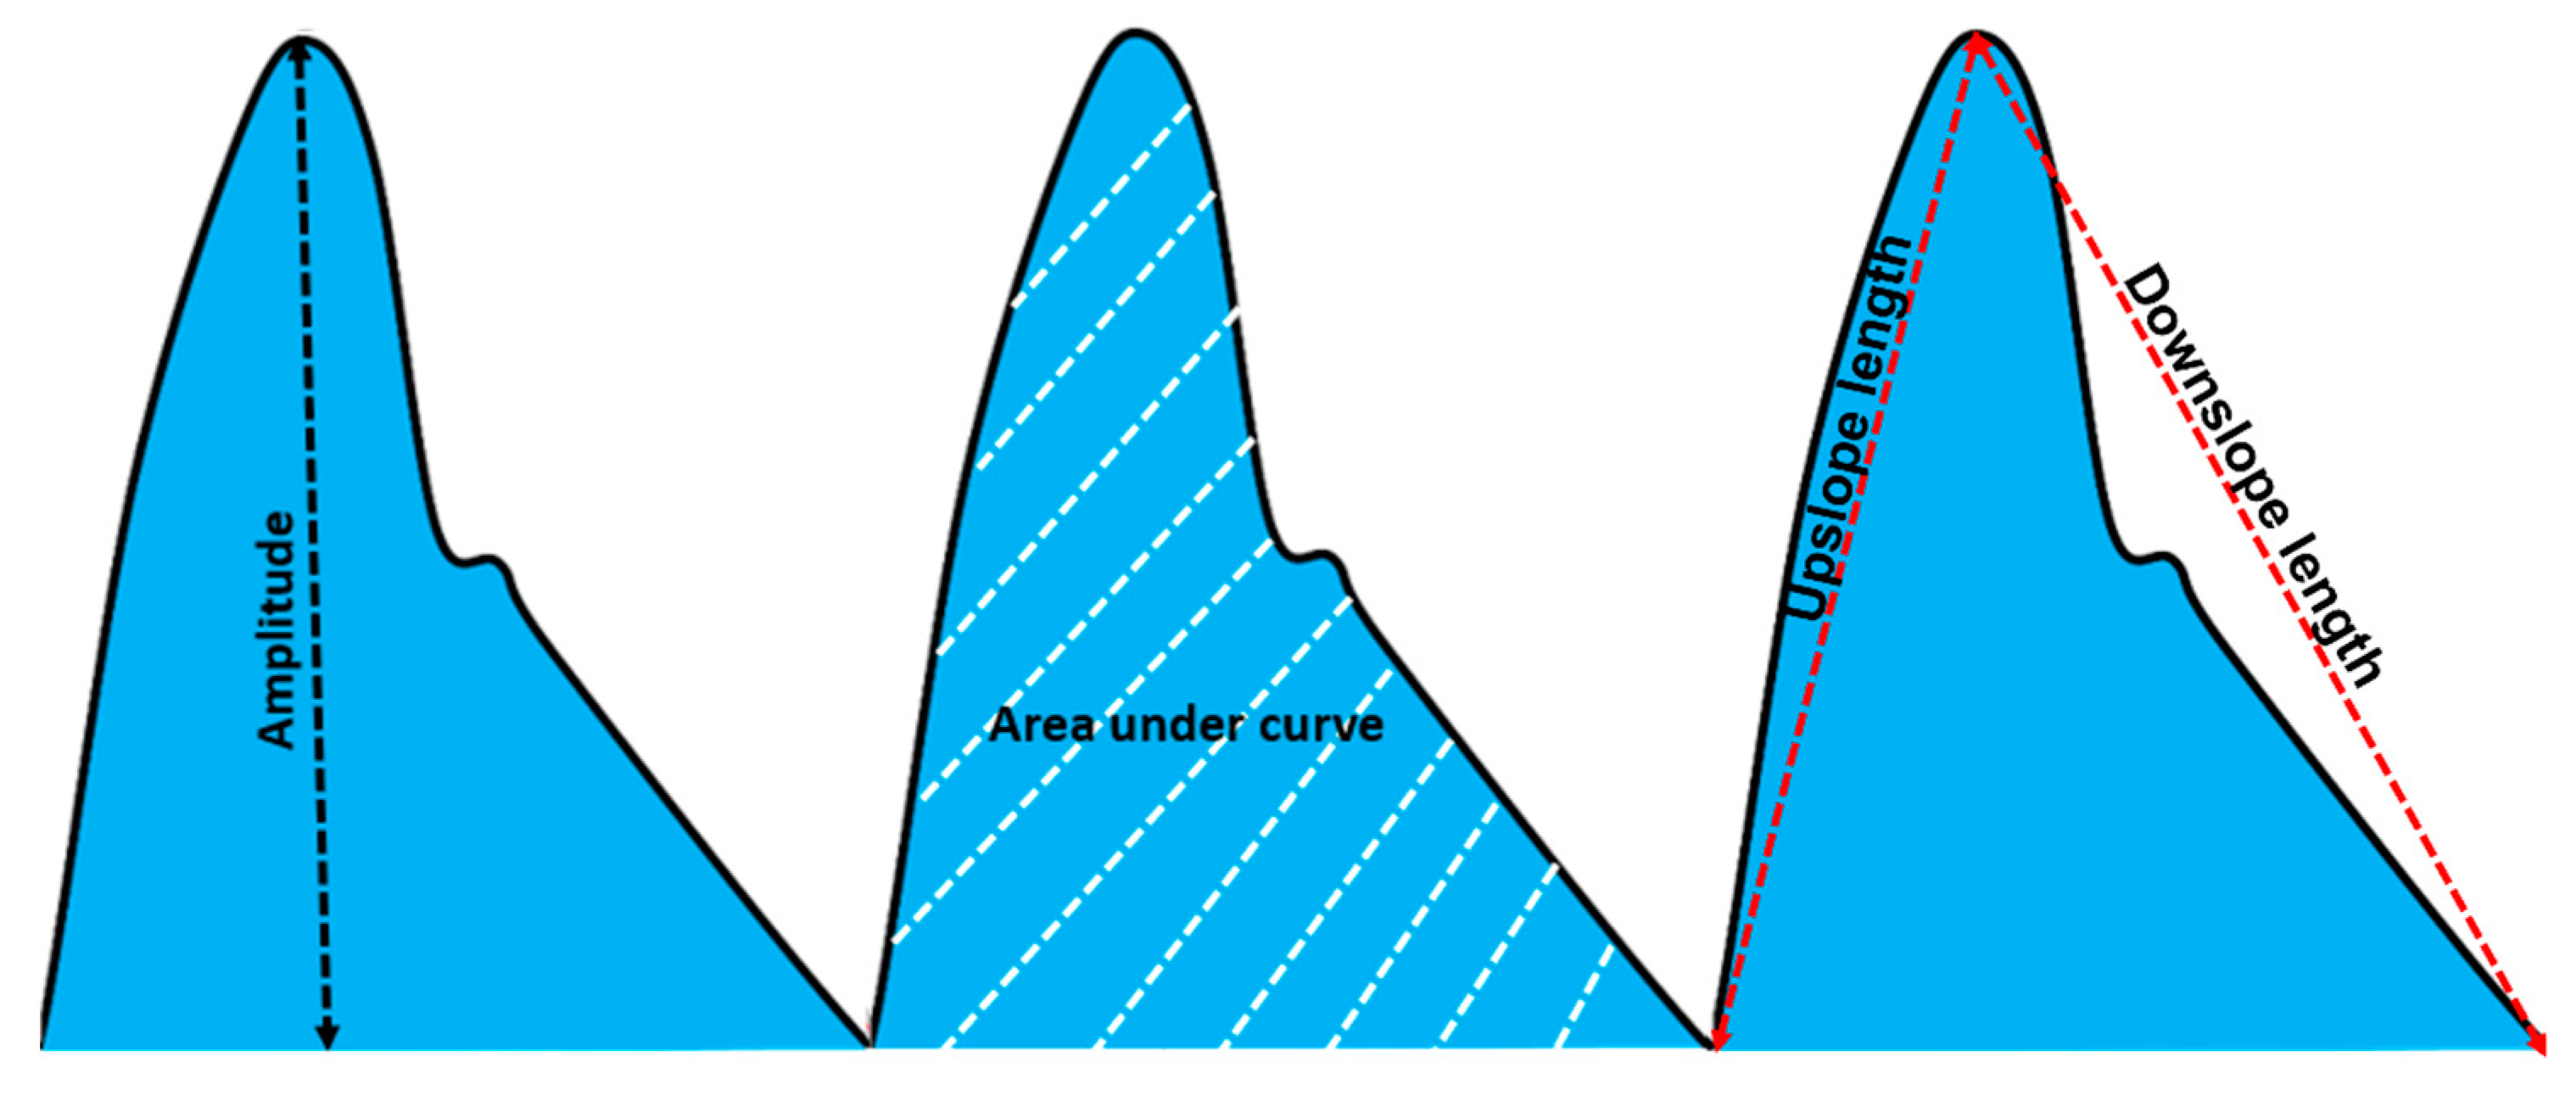
For each BP status, four main PPG features were extracted. Firstly, the amplitude, defined as the maximum peak value of the normalised signal, was chosen (see Figure 4). With increased vessel stiffness, it is expected that the vessels will expand less, resulting in a lower volume of blood in that area. In unhealthy, stiff vessels, it is expected that more photons will be detected by the photodetector, indicating that fewer photons are absorbed. Therefore, a lower amplitude should be observed with increasing stiffness. Another key feature examined was the AUC, as shown in Figure 4. With increased vessel stiffness, a lower amplitude is anticipated, leading to a corresponding reduction in the AUC value. The third feature, the median upslope-to-downslope ratio, can be used as an indicator of vascular ageing. Figure 4 illustrates how the upslope-to-downslope ratio is calculated from the upslope and downslope lengths. A decrease in the median upslope-to-downslope ratio may suggest vascular stiffness and reduced elasticity. The more negative this ratio is, the less steep the upslope (or rising phase) becomes compared to the downslope (the falling phase). This suggests impaired elasticity and increased stiffness, as vascular ageing leads to the vessel becoming less able to expand.
The fourth feature, the median end datum difference, examines the median length between the PPG signal and the trough–peak tangent [17]. When this value is negative, it indicates that the signal decreased from the start to the end. An increase in this feature may suggest vascular stiffness, as it can imply that the signal has become sharper.

2.5. Statistical Analysis

Statistical analysis of the recorded signals was performed using the Kruskal–Wallis test, a nonparametric one-way analysis of variance designed to evaluate differences between three or more independent groups [21]. This test serves as an extension of the Mann–Whitney U test, allowing for the comparison of multiple independent samples [22,23]. In this study, features extracted from vessels with varying elastic moduli (0.82 MPa, 1.48 MPa, and 2.06 MPa) were analysed to determine whether statistically significant differences existed among them, with significance defined as p < 0.05 [24]. The analysis aimed to determine whether the extracted features could differentiate between healthy and unhealthy vessels, and to assess the degree to which the intermediate elasticity condition aligned with either group or presented distinct features of its own.

2.6. Second Derivative of Photoplethysmography

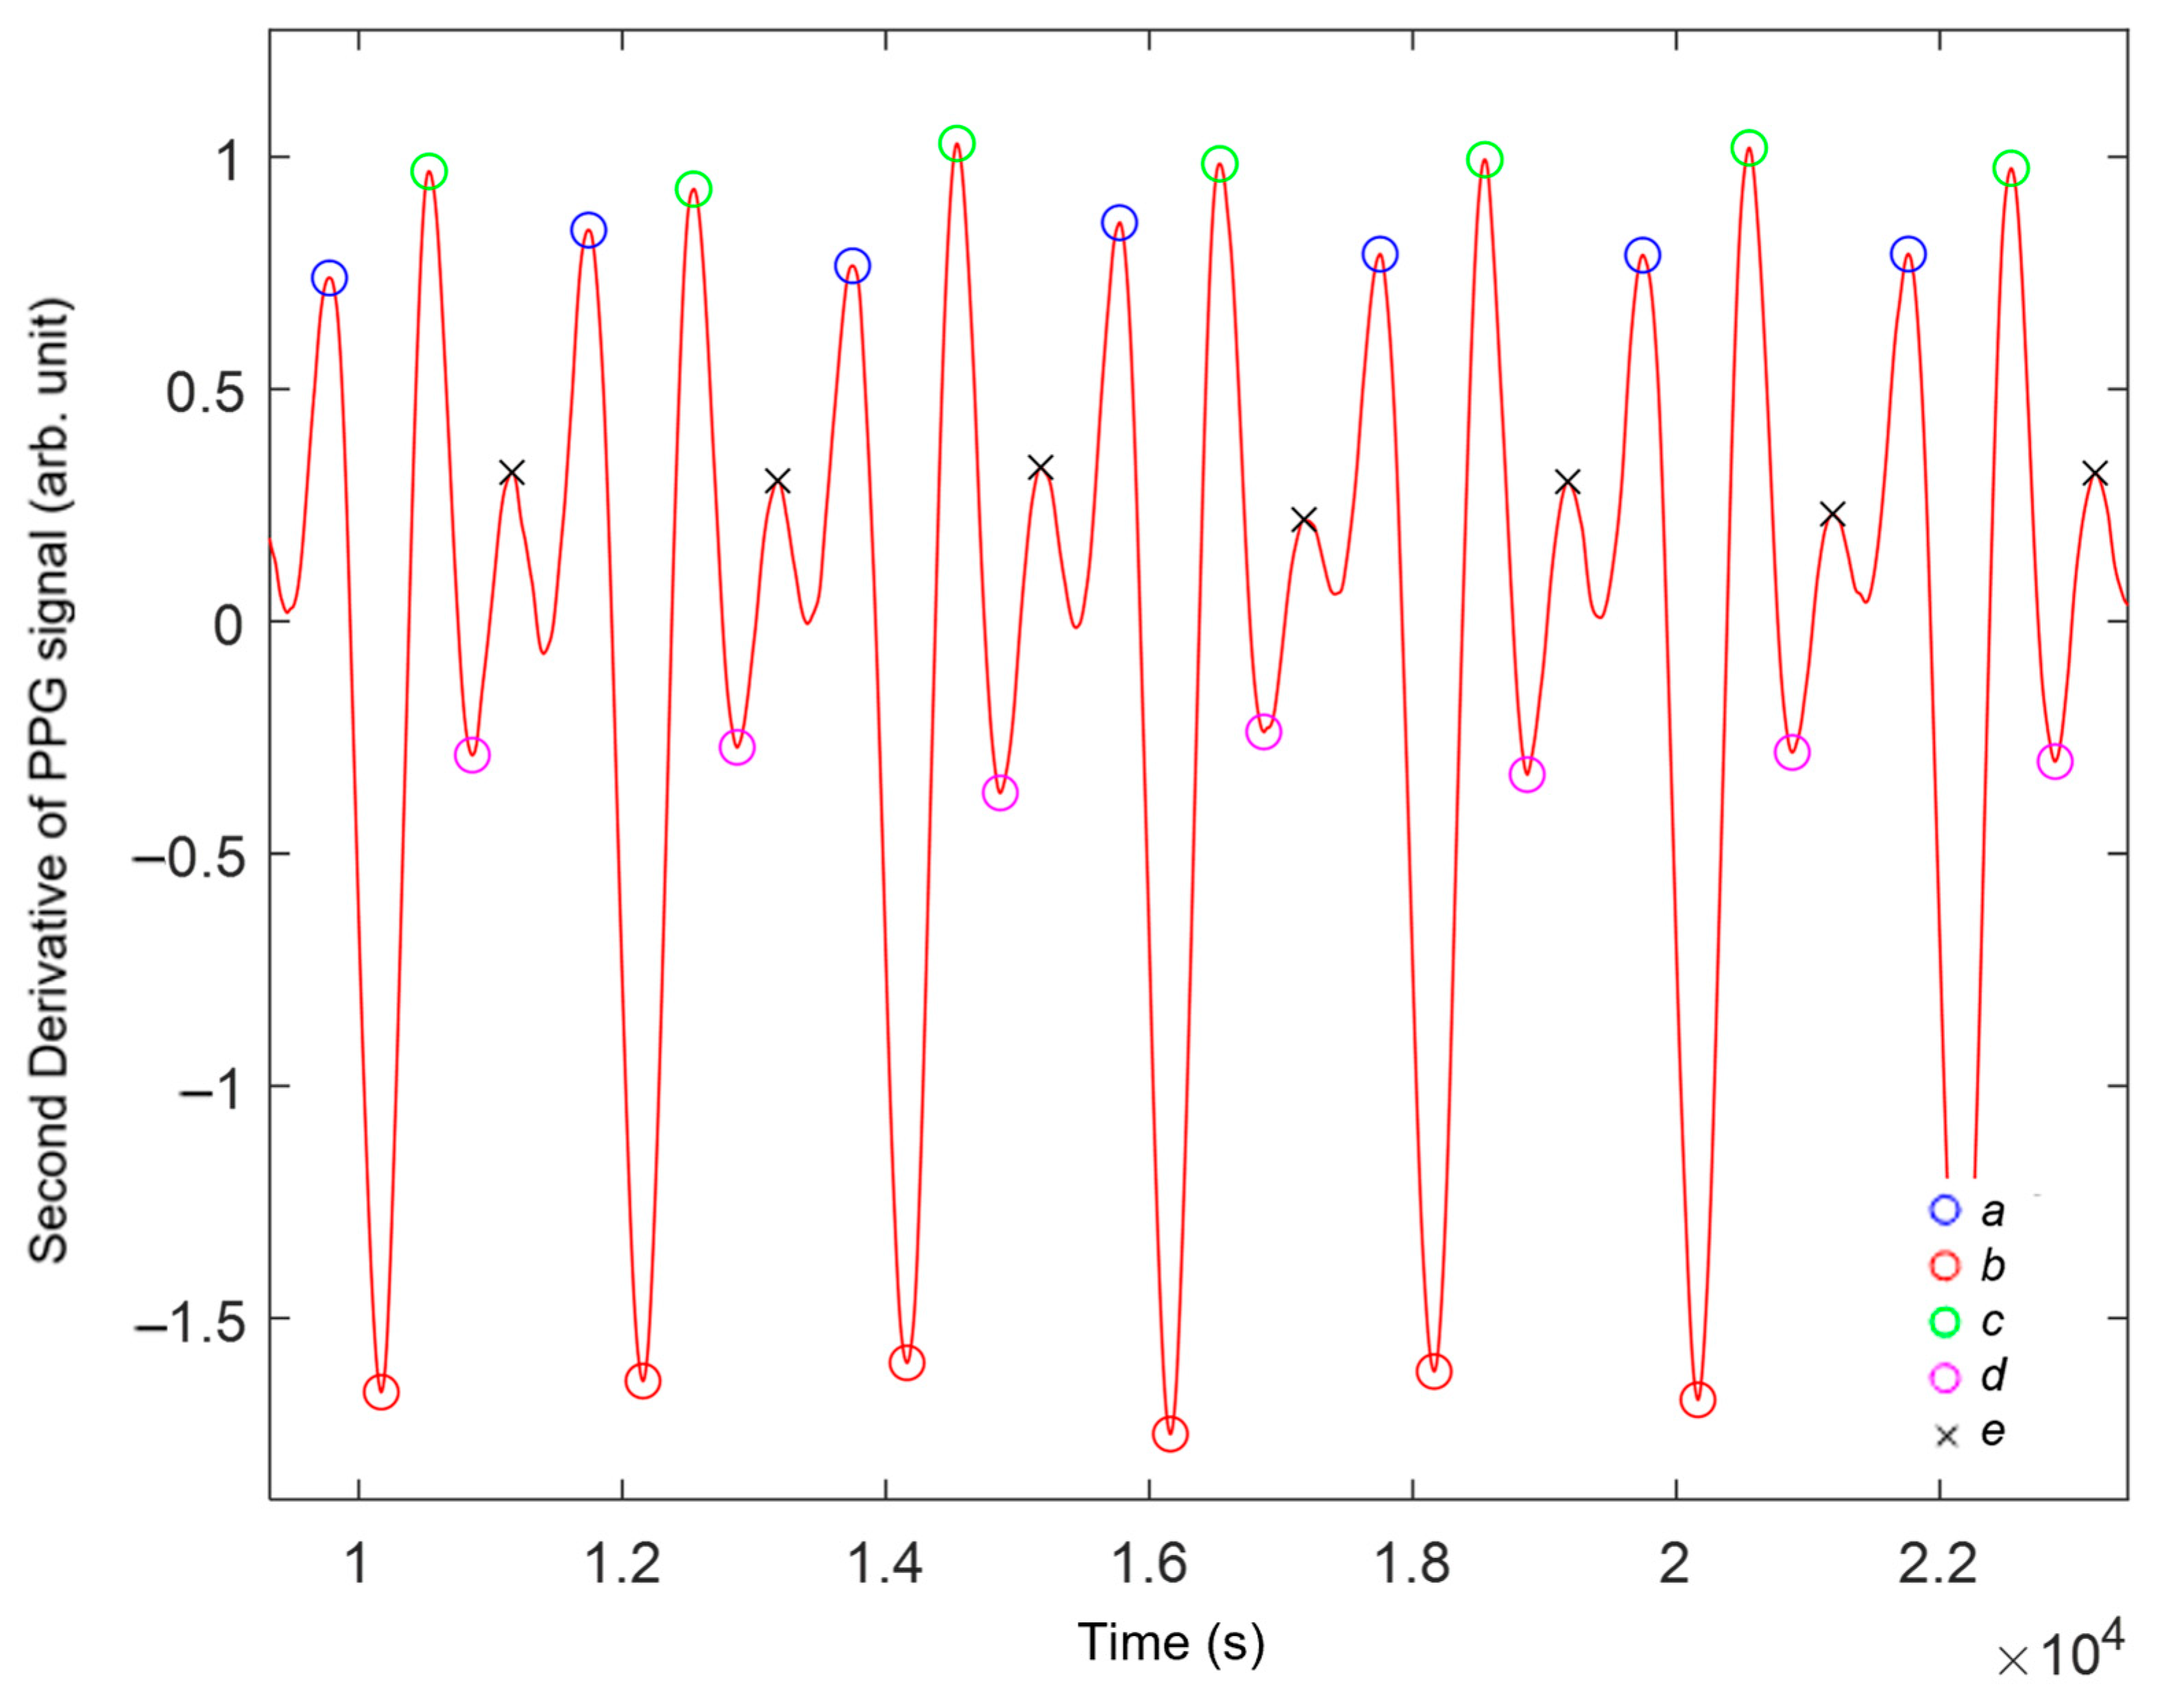
Numerous studies have examined the second derivative of the photoplethysmography signal (SDPPG), illustrated in Figure 5, as a potential tool for monitoring arterial health conditions [25,26]. Fiducial points are distinct features on the waveform that facilitate analysis. Specifically, the fiducial point a corresponds to the maximum peak during the systolic phase of the SDPPG. The point b represents the subsequent minimum peak following the a-peak, while c is identified as the next positive peak after b. The point d is characterised as the first negative peak occurring after the c-peak, and e marks the onset of the diastolic component of the waveform.

3. Results and Discussion

Prior to acquiring PPG signals from the phantoms, the individual vessels were mechanically characterised. Signals were subsequently acquired from each phantom, the healthy, intermediate, and unhealthy, across three different health categories: hypertensive, normotensive, and hypotensive. A total of nine data sets were recorded for the study. Using a custom Python script (version 3.12.3) developed by RCBE [27], key features were selected based on physiological relevance [28] and extracted from the recorded signals. These features included amplitude, area under the curve (AUC), median upslope-to-downslope ratio, and median end datum difference. Each of these features were carefully chosen for their potential to reflect underlying haemodynamic changes in the various phantom health conditions [17]. Once extracted, these features were analysed for statistical significance using the Kruskal–Wallis one-way analysis of variance. Additionally, the SDPPG was explored to investigate its relationship to vascular ageing.

3.1. Mechanical Characterisation

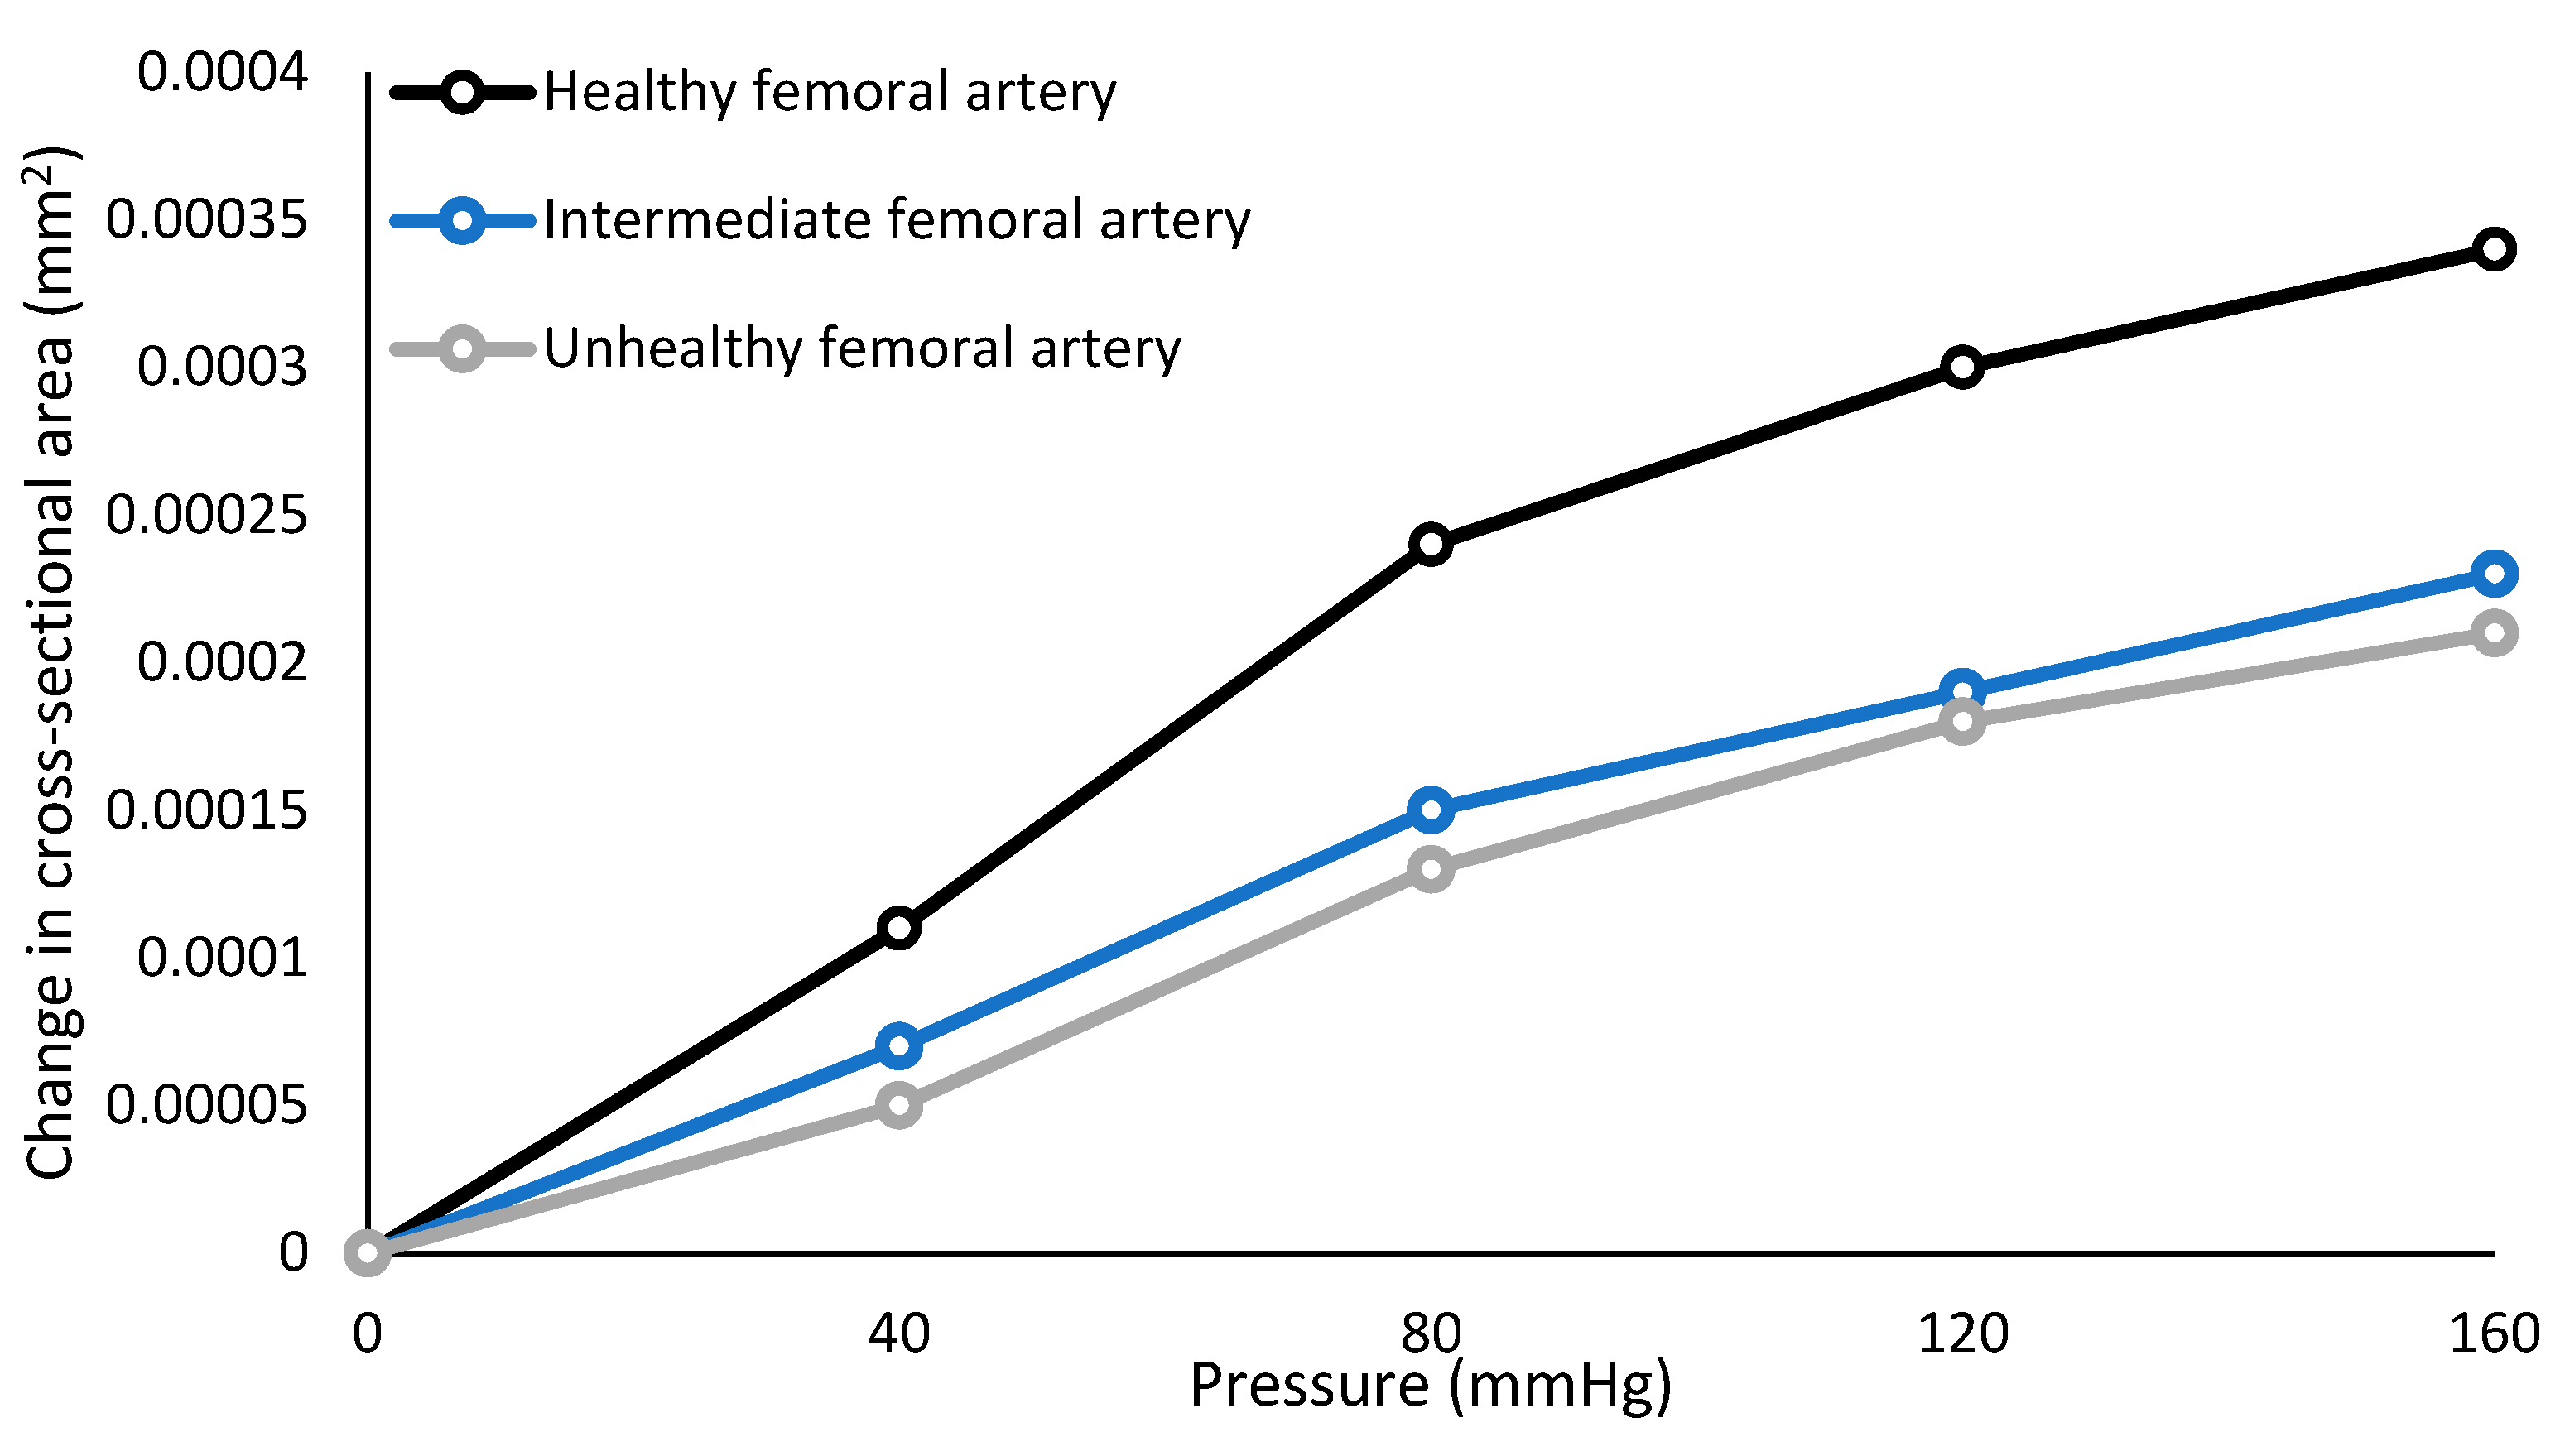
Blood vessels are believed to expand more prominently in the circumferential direction than in the longitudinal direction. While it has been reported that circumferential stretch in the superficial femoral artery changes insignificantly with age [29], accurately replicating physiological conditions in the human body remains crucial. Therefore, in this study, compliance was assessed for the healthy, intermediate, and unhealthy vessels, with the results presented in Figure 6. As vessel stiffness increased, from healthy to intermediate to unhealthy, the change in cross-sectional area progressively decreased. This indicates that stiffer vessels exhibit reduced expansion and, consequently, lower elasticity.
In cardiovascular physiology, peripheral resistance and vascular compliance are related parameters, with vessel dilation affecting peripheral resistance. Although these variables can be independently and qualitatively altered, they were held constant throughout this study. Therefore, any observed changes in resistance during the experiments were most likely attributable to changes in the phantom under investigation, where resistance would change locally.

3.2. Analysis of Extracted Features

The features for the three vessel phantoms (healthy, intermediate, and unhealthy) were extracted and presented in a box plot for the normotensive state, as illustrated in Figure 7. The four features followed expected trends, showing a progressive decrease from healthy to unhealthy vessels, with the exception of the median end datum difference, which increased as anticipated. However, the red PPG signal for the intermediate vessel exhibited an unexpectedly higher median amplitude compared to that of the healthy vessel. This deviation from the anticipated pattern, where healthier vessels typically display stronger signal responses, raises concerns about the extent to which PPG monitoring can effectively differentiate between healthy, intermediate, and unhealthy vessels. It is conceivable that PPG may be effective in distinguishing between healthy and unhealthy vessels but may be less reliable in detecting intermediate states. The infrared and green PPG channels, by contrast, followed the expected trend, with healthy vessels demonstrating higher median signal values. Across all channels (red, infrared, and green), unhealthy vessels showed lower signal readings, except for the median end datum difference. This pattern aligns with the expected decline in vessel elasticity, which affects both the structure and performance of the vessels [30].
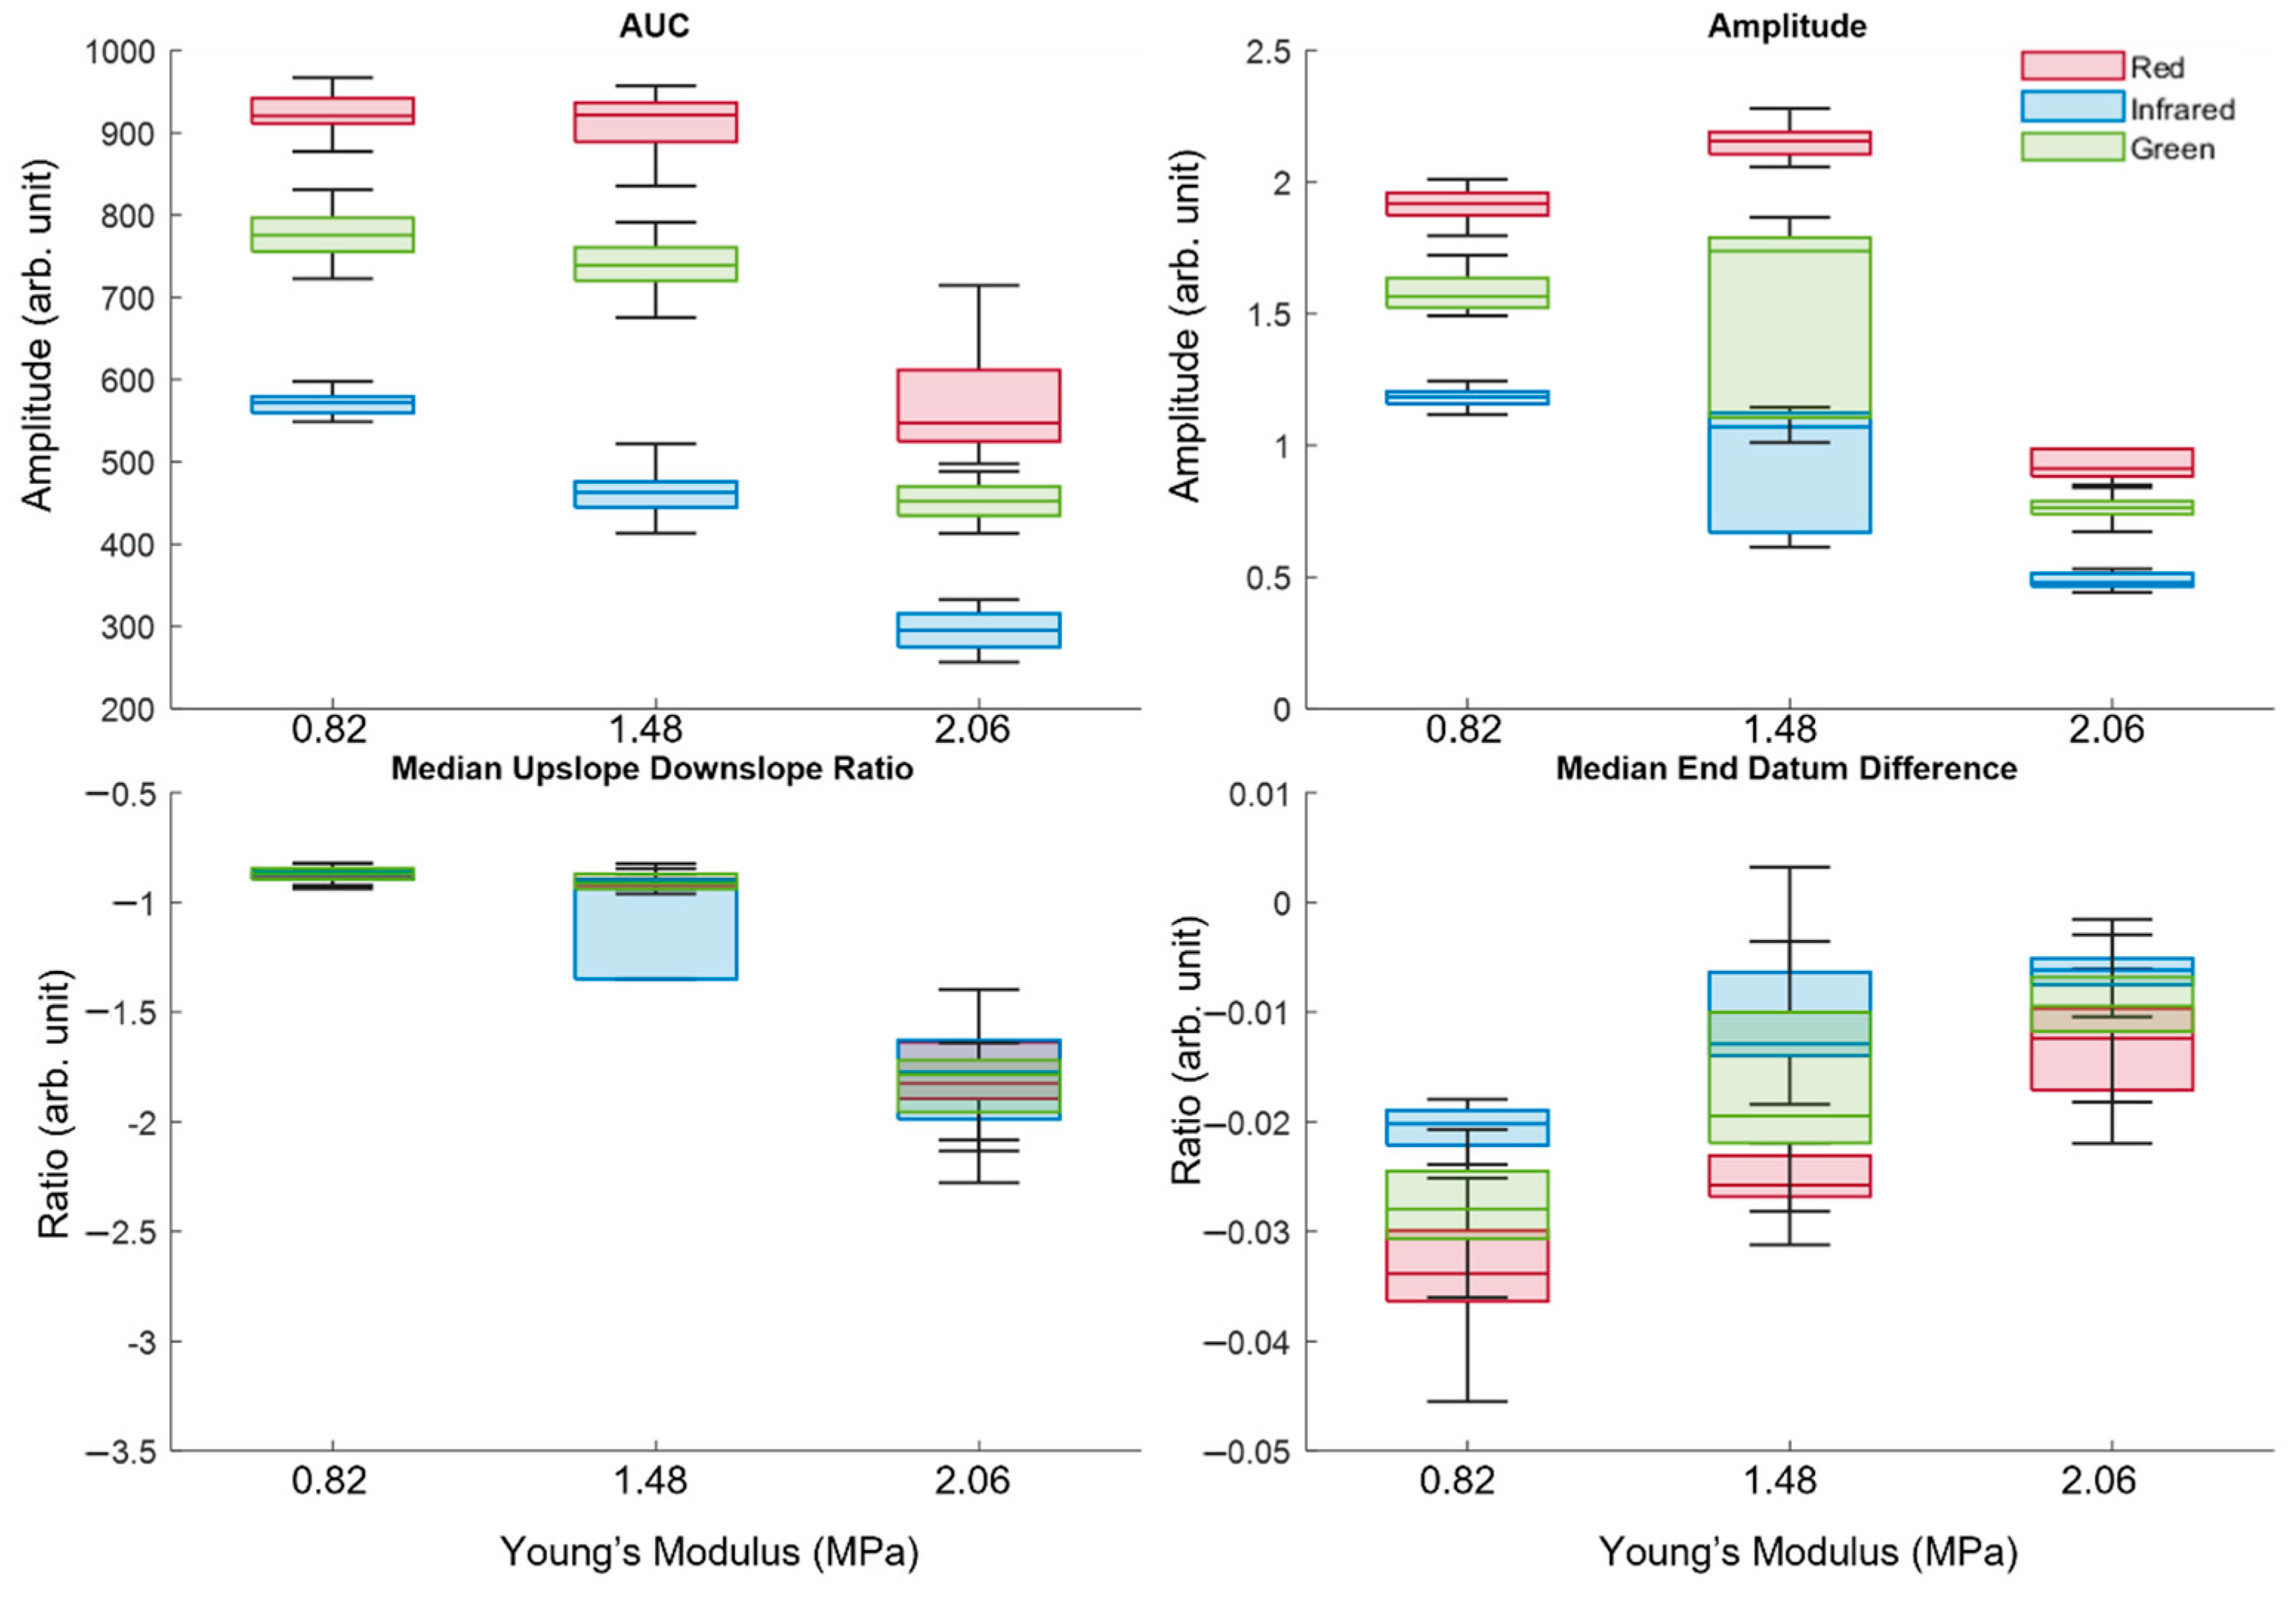
The vessel phantoms were then placed in the hypertensive state and features were extracted, as illustrated in the box plot in Figure 8. With an increase in BP, a greater volume of blood will be present within the vessel in a given area, which can be seen with the increased AUC and amplitude. In more elastic vessels, this increase in blood volume is expected to result in greater expansion compared to stiffer, less healthy vessels. Consequently, as vessels transition from healthy to intermediate to unhealthy, the degree of expansion is anticipated to decrease. This progression is reflected in the features extracted from the PPG signal. This reduced expansion in less healthy vessels results in a lower volume of blood, meaning more photons are detected by the photodetector as fewer are absorbed.
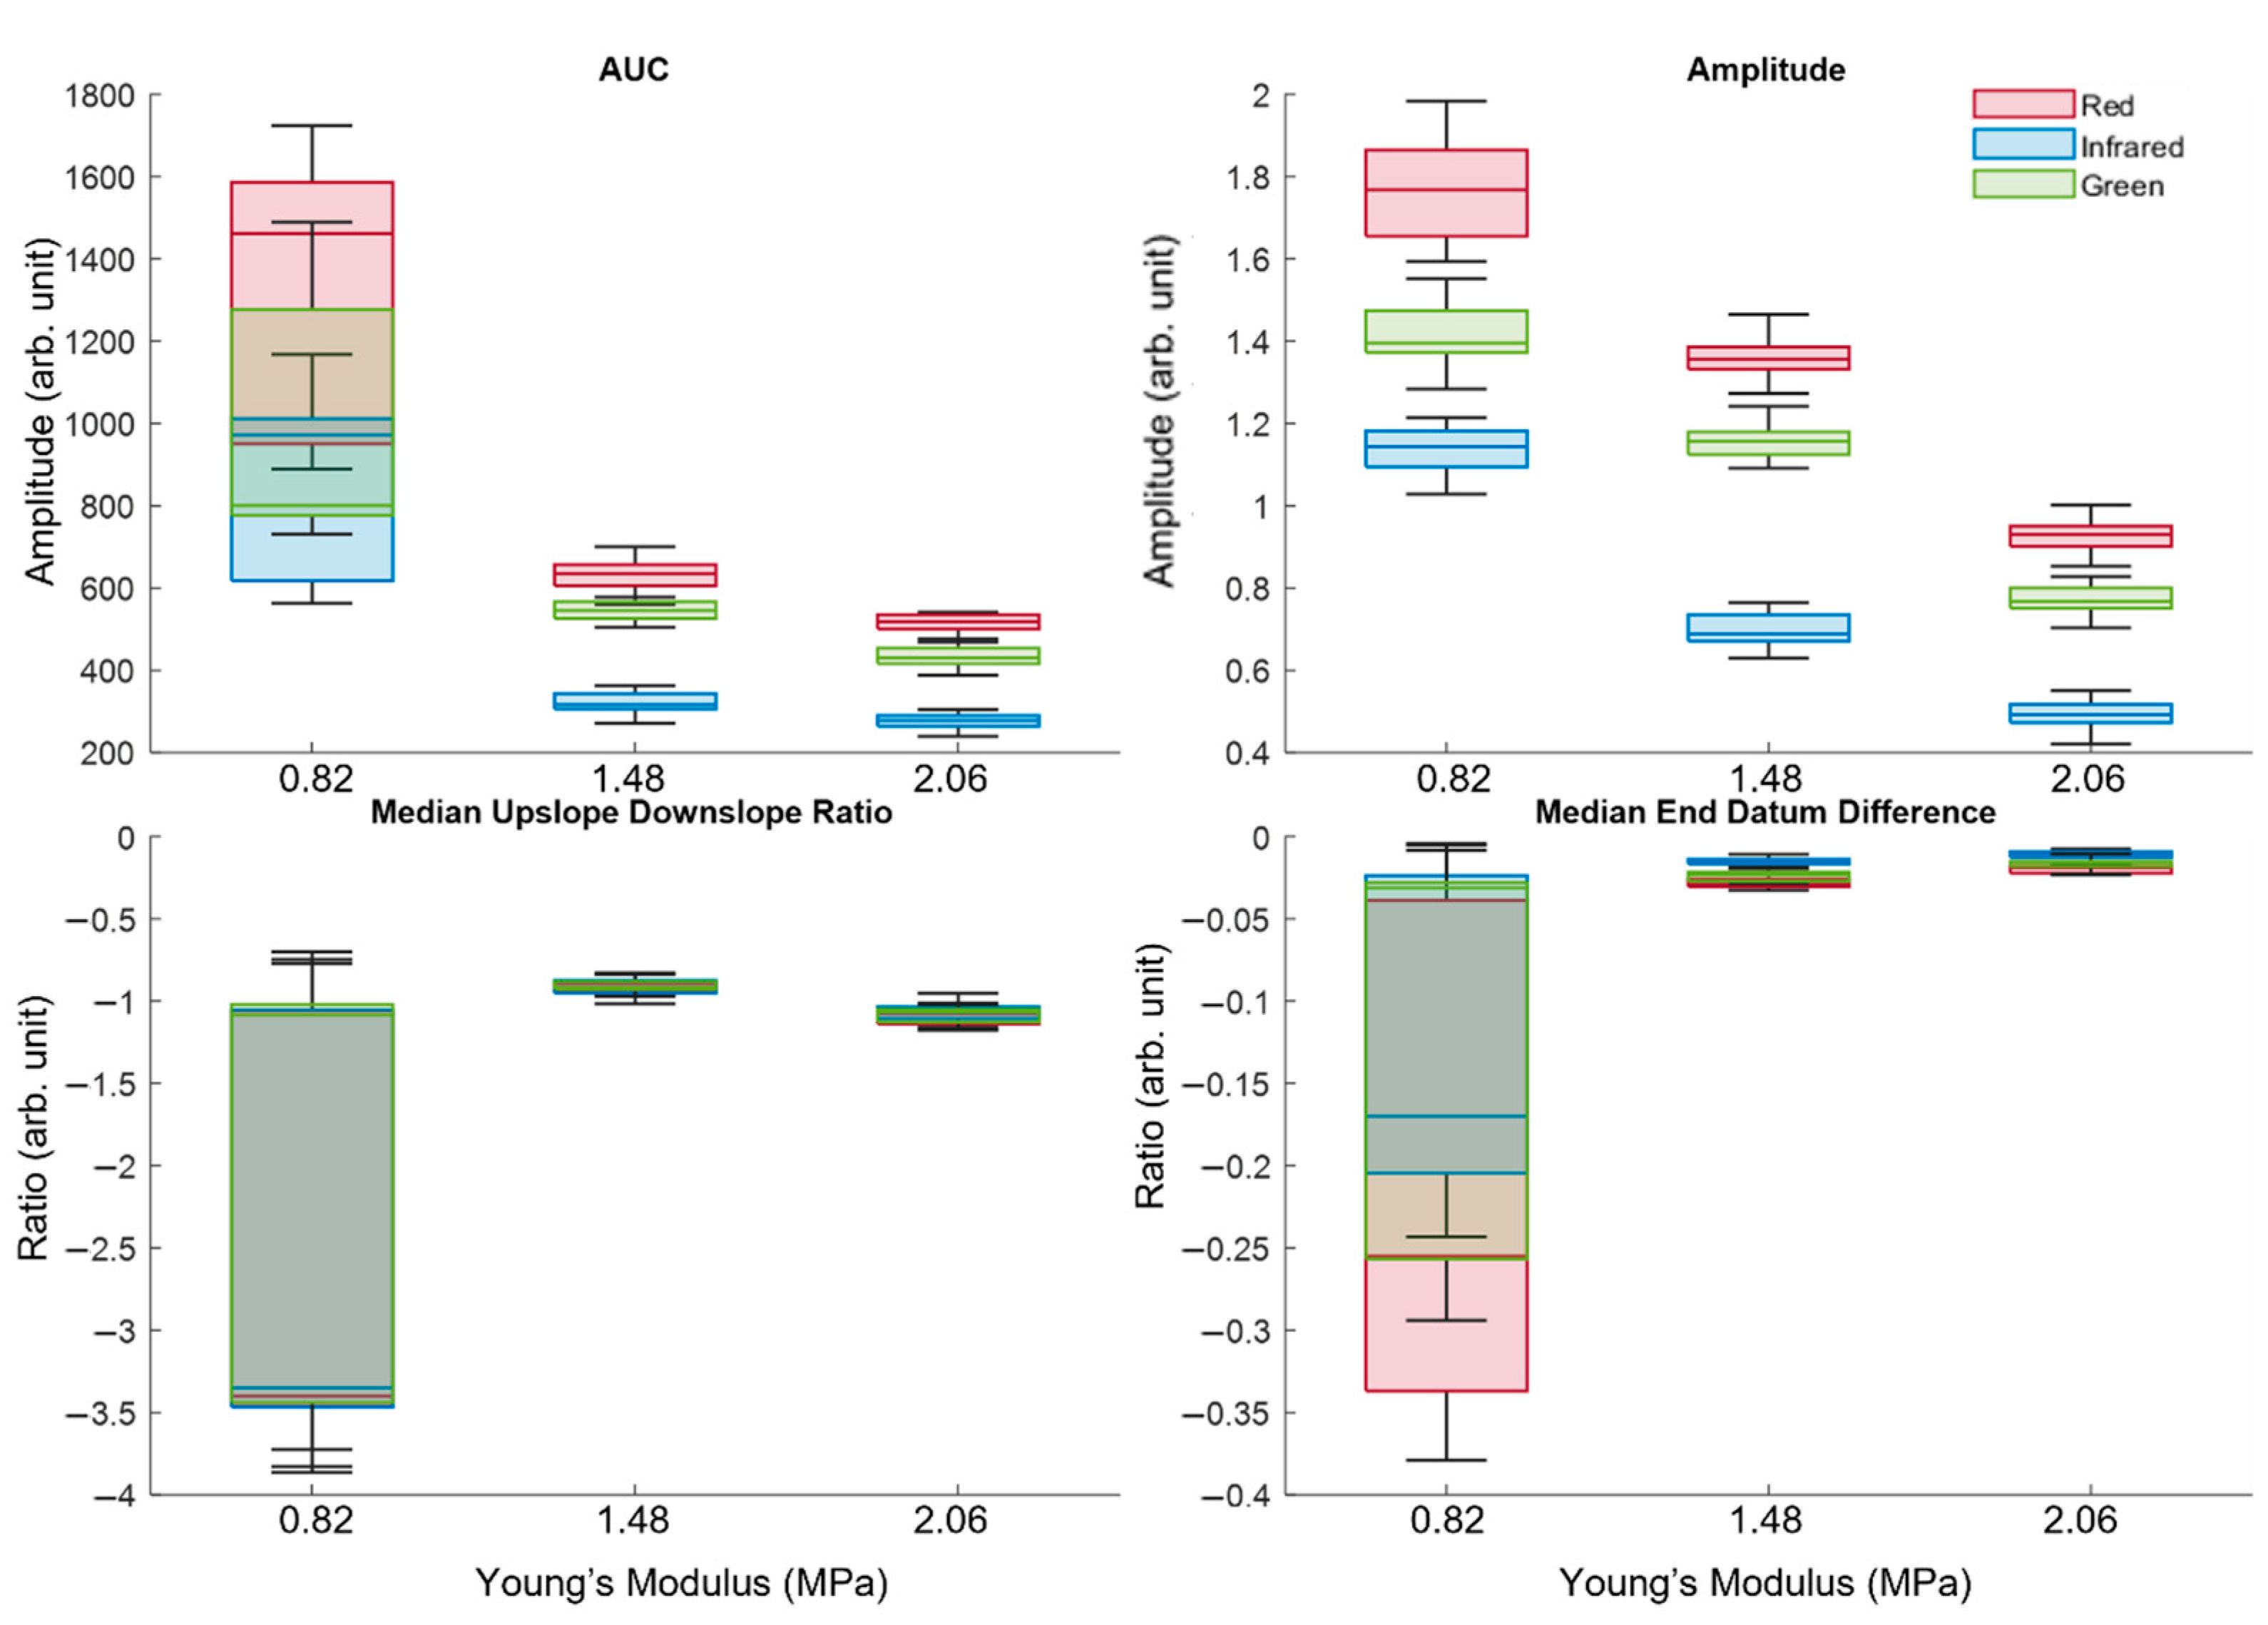
Unlike the features collected for high and normal BP, the characteristics associated with low BP exhibit greater variability. The box plot in Figure 9 illustrates this increased dispersion in the data set, in contrast to the more compact distributions observed in Figure 7 and Figure 8, particularly the healthy vessel. The dispersion in the elastic vessel is logical; as the vessel is more elastic, it becomes increasingly susceptible to fluctuations in expansion and contraction, which can amplify data variability. Nonetheless, an overall trend is still discernible: both the AUC and amplitude decrease with diminishing vessel elasticity. However, the extracted features raise important questions regarding the utility of PPG monitoring in patients experiencing hypotension. The variations observed in the data for healthy vessels may lead to confusion, as they overlap with data from individuals in intermediate and unhealthy states, particularly concerning the median upslope-to-downslope ratio and the median end datum difference. Consequently, employing PPG monitoring to assess vascular ageing in hypotensive patients may prove challenging. Alternative features should be extracted and explored to evaluate the feasibility of PPG monitoring in hypotensive patients. Nevertheless, the observed variability itself may hold diagnostic significance and could potentially serve as an indicator of vascular health. However, further research in signal processing is necessary to determine whether this variability can be reliably extracted and leveraged, particularly in combination with range measures, for clinical applications.

3.3. Statistical Analysis Using Kruskal–Wallis One-Way Analysis of Variance

A Kruskal–Wallis analysis was conducted to examine whether there was a statistically significant difference between the healthy and unhealthy vessels, with elasticities of 0.82 MPa and 2.06 MPa, respectively. Additionally, the analysis aimed to determine whether this statistical difference extended to the intermediate state, represented by the vessel with an elasticity of 1.48 MPa. Statistical significance was defined by p-values less than 0.05 [21]. The null hypothesis (H0) for the Kruskal–Wallis test proposed that arterial stiffness has no effect on PPG morphology across different BP states. The alternative hypothesis (Ha) asserted that PPG morphology is affected by varying BP conditions depending on the level or arterial disease.
The majority of features analysed displayed statistically significant differences between healthy and unhealthy vascular states, as shown in Table 1, Table 2 and Table 3, highlighting the potential of PPG in detecting vascular ageing. Notably, however, the median upslope-downslope ratio was the exception, with a p-value of 9.86 × 10⁻², as shown in Table 2, indicating no statistical difference between the health states in the hypertensive condition. This result raises questions about the consistency and sensitivity of PPG monitoring for detecting vascular differences; however, given that this feature did exhibit statistical differences under normal and low BP, it may suggest that this finding was an anomaly. For a potential general practitioner (GP)-level screening device, further investigation is required to determine whether the median upslope–downslope ratio should be included to enhance diagnostic accuracy. Moreover, in all BP settings (normal, high, and low), statistical differences were consistently observed between intermediate and unhealthy states, strengthening the case for PPG’s utility in identifying patients in transition from intermediate to unhealthy vascular states. However, distinguishing between healthy and intermediate states proved more challenging, as amplitude and AUC did not show statistical differences in normal BP, and AUC was also not statistically different at high BP. Therefore, while PPG shows potential, further research is necessary to determine whether it can reliably differentiate intermediate states or if its primary utility lies in distinguishing between distinctly healthy and unhealthy states, where feature differences are more pronounced.

3.4. Analysis of the Second Derivative of Photoplethysmography

The SDPPG is increasingly recognised in research as a valuable indicator for assessing vascular ageing [31,32,33,34]. From the SDPPGs derived in this study, fiducial points were identified, and the ratios between these points were calculated. This analysis was conducted across different BP settings for each health status, as shown in Table 4. Studies have shown that the b a ratio increases with arterial stiffness, while the c a , d a , and e a ratios decrease as stiffness worsens [35,36,37]. In the hypertensive state, as the vessels become less healthy, the b a ratio rises from −2.13 to −2.06. This ratio reflects the distensibility of the vascular wall, with increased stiffness indicating diminished elasticity. In the hypertensive state, the c a , d a , and e a ratios decrease, as supported by the existing literature [37]. It was observed that the differences between these ratios across BP settings are most pronounced in the hypertensive state. In contrast, the normotensive and hypotensive states show smaller differences in these ratios between healthy and unhealthy statuses. Specifically, in the normotensive state, the b a ratio exhibited a slight increase of 0.01, while in the hypotensive state, no differences were observed in the b a ratio between healthy and unhealthy vessels. The most significant variations in the b a ratio was found in the hypertensive state. Similarly, the c a , d a , and e a ratios decreased in the normotensive state as expected. In the hypotensive state, however, the e a ratio remained unchanged between healthy and unhealthy vessels, while the c a and d a   ratios showed the expected decrease. These qualitative findings suggest that the SDPPG holds potential for identifying vascular ageing, particularly in the hypertensive state. It is important to note that previous studies have reported that SDPPG indices exhibit variations between men and women within the same age group, highlighting the importance of analysing these indices separately based on sex [31,37,38]. In this study, the influence of sex was not considered in the evaluation of SDPPG ratios for vascular ageing, as the experiments were conducted in vitro, and sex could not be accounted for. Despite this limitation, these preliminary findings provide valuable insight into the potential utility of SDPPGs as a tool for assessing vascular health and ageing. Further research should be conducted to refine these observations and explore the role of sex in SDPPG-based assessments.

4. Conclusions

This study highlights the potential of PPG monitoring for distinguishing between healthy and unhealthy vascular states, particularly in normotensive and hypertensive patients, offering a non-invasive means of detecting vascular ageing and atherosclerosis. Significant differences in PPG features, particularly amplitude, AUC, and median end datum difference, were observed between healthy and unhealthy vessels, validating the feasibility of PPG for vascular health assessment. However, detecting intermediate states proved more challenging, as did differentiating between vessels in hypotensive conditions, where data variability led to overlap between healthy, intermediate, and unhealthy states. The median upslope–downslope ratio did not show a statistically significant difference between healthy and unhealthy vessels in the hypertensive condition, suggesting that alternative features may need to be considered. Ratios derived from fiducial points of the SDPPG were most pronounced in the hypertensive state. Future research should focus on optimising PPG feature extraction for intermediate states and evaluating PPG’s performance in low BP scenarios. The SDPPG for an intermediate state phantom requires further investigation to determine whether it can effectively detect intermediate states, or if it is limited to distinguishing between healthy and unhealthy states. Given the study design, the in vitro setup had limited ability to capture systemic vascular ageing, as only segmental stiffness was introduced. Despite these challenges, this study provides a foundation for the use of PPG for the early detection of vascular health.

Author Contributions

Conceptualization, P.K., J.M.M. and P.A.K.; Methodology, P.K.; Software, P.K.; Formal analysis, P.K.; Data curation, P.K.; Writing—original draft, P.K.; Writing—review & editing, P.K., J.M.M. and P.A.K.; Supervision, J.M.M. and P.A.K. All authors have read and agreed to the published version of the manuscript.

Funding

This research received no external funding.

Institutional Review Board Statement

Not applicable.

Informed Consent Statement

Not applicable.

Data Availability Statement

Data are contained within the article.

Conflicts of Interest

The authors declare no conflict of interest.

References

  1. Murray, C.J.L. The Global Burden of Disease Study at 30 years. Nat. Med. 2022, 28, 2019–2026. [Google Scholar] [CrossRef] [PubMed]
  2. Karimpour, P.; May, J.M.; Kyriacou, P.A. Photoplethysmography for the Assessment of Arterial Stiffness. Sensors 2023, 23, 9882. [Google Scholar] [CrossRef] [PubMed]
  3. Zanelli, S.; Agnoletti, D.; Alastruey, J.; Allen, J.; Bianchini, E.; Bikia, V.; Boutouyrie, P.; Bruno, R.M.; Climie, R.; Djeldjli, D.; et al. Developing technologies to assess vascular ageing: A roadmap from VascAgeNet. Physiol. Meas. 2024, 45, 121001. [Google Scholar] [CrossRef] [PubMed]
  4. Fuchs, F.D.; Whelton, P.K. High Blood Pressure and Cardiovascular Disease. Hypertension 2020, 75, 285–292. [Google Scholar] [CrossRef]
  5. Carey, R.M.; Muntner, P.; Bosworth, H.B.; Whelton, P.K. Prevention and Control of Hypertension: JACC Health Pro-motion Series. J. Am. Coll. Cardiol. 2018, 72, 1278–1293. [Google Scholar] [CrossRef]
  6. Lawes, C.M.; Hoorn, S.V.; Rodgers, A.; International Society of Hypertension. Global burden of blood-pressure-related disease, 2001. Lancet 2008, 371, 1513–1518. [Google Scholar] [CrossRef]
  7. Karimpour, P.; Ferizoli, R.; May, J.M.; Kyriacou, P.A. Customisable Silicone Vessels and Tissue Phantoms for In Vitro Photoplethysmography Investigations into Cardiovascular Disease. Sensors 2024, 24, 1681. [Google Scholar] [CrossRef]
  8. Zekavat, S.M.; Aragam, K.; Emdin, C.; Khera, A.V.; Klarin, D.; Zhao, H.; Natarajan, P. Genetic Association of Finger Photoplethysmography-Derived Arterial Stiffness Index With Blood Pressure and Coronary Artery Disease. Arter. Thromb. Vasc. Biol. 2019, 39, 1253–1261. [Google Scholar] [CrossRef]
  9. Bortolotto, L.A.; Blacher, J.; Kondo, T.; Takazawa, K.; Safar, M.E. Assessment of vascular aging and atherosclerosis in hypertensive subjects: Second derivative of photoplethysmogram versus pulse wave velocity. Am. J. Hypertens. 2000, 13, 165–171. [Google Scholar] [CrossRef]
  10. Korneeva, O.; Drapkina, O. PP.33.08: Arterial stiffness parameters in obese hypertensive patients using different statin-based regimens and fixed antihypertensive combination. J. Hypertens. 2015, 33, e431. [Google Scholar] [CrossRef]
  11. Brum, J.; Balay, G.; Bia, D.; Benech, N.; Ramos, A.; Armentano, R.; Negreira, C. Improvement of Young modulus estimation by ultrasound using static pressure steps. Phys. Procedia 2010, 3, 1087–1094. [Google Scholar] [CrossRef]
  12. ASTM D412-16; Test Methods for Vulcanized Rubber and Thermoplastic Elastomers-Tension. ASTM International: West Conshohocken, PA, USA, 2021. [CrossRef]
  13. The Definitive Guide to ASTM D412 Tensile Testing of Elastomers’. Available online: https://www.instron.com/en/testing-solutions/astm-standards/astm-d412 (accessed on 20 February 2024).
  14. Spector, K.S.; Lawson, W.E. Optimizing safe femoral access during cardiac catheterization. Catheter. Cardiovasc. Interv. 2001, 53, 209–212. [Google Scholar] [CrossRef] [PubMed]
  15. Bhusal, A.; Farahmand, M.; Hasan, S.; Vasudevan, S.; Vogt, W.C.; Ibarra, B.; Weininger, S.; Scully, C.G.; Zhang, X.F.; Chen, Y.; et al. Development and characterization of silicone-based tissue phantoms for pulse oximeter performance testing. J. Biomed. Opt. 2024, 29, S33314. [Google Scholar] [CrossRef] [PubMed]
  16. Matsumoto, T.; Baker, D.J.; D’uscio, L.V.; Mozammel, G.; Katusic, Z.S.; van Deursen, J.M. Aging-Associated Vascular Phenotype in Mutant Mice with Low Levels of BubR1. Stroke 2007, 38, 1050–1056. [Google Scholar] [CrossRef]
  17. Ferizoli, R.; Karimpour, P.; May, J.M.; Kyriacou, P.A. Arterial stiffness assessment using PPG feature extraction and significance testing in an in vitro cardiovascular system. Sci. Rep. 2024, 14, 1–10. [Google Scholar] [CrossRef]
  18. May, J.M. Investigation of Fontanelle Photoplethysmographs and Oxygen Saturations in Intensive Care Neonates and Infants Utilising Miniature Photometric Sensors. Ph.D. Thesis, City University London, London, UK, 2013. [Google Scholar]
  19. Shahoud, J.S.; Sanvictores, T.; Aeddula, N.R. Physiology, Arterial Pressure Regulation. In StatPearls; StatPearls Publishing: Treasure Island, FL, USA, 2023. Available online: https://www.ncbi.nlm.nih.gov/books/NBK538509/ (accessed on 16 October 2024).
  20. Camasão, D.; Mantovani, D. The mechanical characterization of blood vessels and their substitutes in the continuous quest for physiological-relevant performances. A critical review. Mater. Today Biol. 2021, 10, 100106. [Google Scholar] [CrossRef]
  21. Theodorsson-Norheim, E. Kruskal-Wallis test: BASIC computer program to perform nonparametric one-way analysis of variance and multiple comparisons on ranks of several independent samples. Comput. Methods Programs Biomed. 1986, 23, 57–62. [Google Scholar] [CrossRef]
  22. Whitley, E.; Ball, J. Statistics review 6: Nonparametric methods. Crit. Care 2002, 6, 509–513. [Google Scholar] [CrossRef]
  23. Bewick, V.; Cheek, L.; Ball, J. Statistics review 10: Further nonparametric methods. Crit. Care 2004, 8, 196–199. [Google Scholar] [CrossRef] [PubMed]
  24. Concato, J.; Hartigan, J.A. p-Values: From Suggestion to Superstition. J. Investig. Med. 2016, 64, 1166–1171. [Google Scholar] [CrossRef]
  25. Castaneda, D.; Esparza, A.; Ghamari, M.; Soltanpur, C.; Nazeran, H. A review on wearable photoplethysmography sensors and their potential future applications in health care. Int. J. Biosens. Bioelectron. 2018, 4, 195–202. [Google Scholar] [CrossRef]
  26. Elgendi, M. On the Analysis of Fingertip Photoplethysmogram Signals. Curr. Cardiol. Rev. 2012, 8, 14–25. [Google Scholar] [CrossRef] [PubMed]
  27. Bradley, G. Enantiodromis/PPGExtract (16 August 2023). Python. Available online: https://github.com/Enantiodromis/PPGExtract (accessed on 24 August 2023).
  28. Mejía-Mejía, E.; Allen, J.; Budidha, K.; El-Hajj, C.; Kyriacou, P.A.; Charlton, P.H. 4—Photoplethysmography signal processing and synthesis. In Photoplethysmography; Allen, J., Kyriacou, P., Eds.; Academic Press: Cambridge, MA, USA, 2022; pp. 69–146. [Google Scholar] [CrossRef]
  29. Jadidi, M.; Razian, S.A.; Habibnezhad, M.; Anttila, E.; Kamenskiy, A. Mechanical, structural, and physiologic differences in human elastic and muscular arteries of different ages: Comparison of the descending thoracic aorta to the superficial femoral artery. Acta Biomater. 2021, 119, 268–283. [Google Scholar] [CrossRef] [PubMed]
  30. Almarshad, M.A.; Islam, S.; Al-Ahmadi, S.; BaHammam, A.S. Diagnostic Features and Potential Applications of PPG Signal in Healthcare: A Systematic Review. Healthcare 2022, 10, 547. [Google Scholar] [CrossRef] [PubMed]
  31. Takazawa, K.; Tanaka, N.; Fujita, M.; Matsuoka, O.; Saiki, T.; Aikawa, M.; Tamura, S.; Ibukiyama, C. Assessment of Vasoactive Agents and Vascular Aging by the Second Derivative of Photoplethysmogram Waveform. Hypertension 1998, 32, 365–370. [Google Scholar] [CrossRef]
  32. Baek, H.J.; Kim, J.S.; Kim, Y.S.; Lee, H.B.; Park, K.S. Second Derivative of Photoplethysmography for Estimating Vascular Aging. In Proceedings of the 2007 6th International Special Topic Conference on Information Technology Applications in Biomedicine, Tokyo, Japan, 8–11 November 2007; pp. 70–72. [Google Scholar]
  33. Rozi, R.M.; Usman, S.; Ali, M.M.; Reaz, M. Second derivatives of photoplethysmography (PPG) for estimating vascular aging of atherosclerotic patients. In Proceedings of the 2012 IEEE EMBS Conference on Biomedical Engineering and Sciences (IECBES 2012), Langkawi, Malaysia, 17–19 December 2012; pp. 256–259. [Google Scholar]
  34. Yousef, K.Q.; Rubins, U.; Mafawez, A. Photoplethysmogram second derivative review: Analysis and applications. Sci. Res. Essays 2015, 10, 633–639. [Google Scholar] [CrossRef]
  35. Gayapersad, N.; Rocke, S.; Ramsaroop, Z.; Singh, A.; Ramlal, C. Beyond Blood Pressure and Heart Rate Monitoring: Towards a Device for Continuous Sensing and Automatic Feature Extraction of Cardiovascular Data. In Proceedings of the 2016 8th International Conference on Computational Intelligence and Communication Networks (CICN), Tehri, India, 23–25 December 2016; pp. 261–265. [Google Scholar]
  36. Suboh, M.Z.; Jaafar, R.; Nayan, N.A.; Harun, N.H.; Mohamad, M.S.F. Analysis on Four Derivative Waveforms of Photoplethysmogram (PPG) for Fiducial Point Detection. Front. Public Health 2022, 10, 920946. [Google Scholar] [CrossRef]
  37. Choi, J.; Park, M.-G. Variations in the Second Derivative of a Photoplethysmogram with Age in Healthy Korean Adults. Int. J. Environ. Res. Public Health 2022, 20, 236. [Google Scholar] [CrossRef]
  38. Iketani, Y.; Iketani, T.; Takazawa, K.; Murata, M. Second Derivative of Photoplethysmogram in Children and Young People. Jpn. Circ. J. 2000, 64, 110–116. [Google Scholar] [CrossRef]
Figure 1. Setup for compliance testing. The vessel was securely positioned under the digital microscope, and a syringe pump delivered 20 µL of fluid to inflate the vessel. Internal pressure was monitored using a pressure transducer. Changes in diameter were observed and measured with MATLAB. A close-up view of the vessel connection under the digital microscope has been illustrated.
Photonics 12 00430 g001
Figure 2. Reflectance sensor setup. The sensor was placed above the phantom during the experimental procedure. The vessel-tissue phantom was held securely in place using a 3D-printed case. Supporting clamps were arranged to maintain stability during the experiment.
Photonics 12 00430 g002
Figure 3. Recorded photoplethysmography (PPG) signals from phantoms with varying Young’s Moduli: 0.82 MPa, 1.48 MPa, and 2.06 MPa. Recordings were obtained under normotensive conditions using the infrared wavelength.
Photonics 12 00430 g003
Figure 4. A PPG waveform illustrating key signal characteristics. The amplitude, represented by a dotted black line, is defined as the distance from the baseline to the maximum peak of the signal. The area under the curve (AUC) is depicted using dotted white lines. Additionally, the upslope and downslope lengths, indicated by red dotted lines, define the ascent and descent of the waveform, allowing for the calculation of the upslope-to-downslope ratio.
Photonics 12 00430 g004
Figure 5. An example of the second derivative of the PPG signal (SDPPG) is shown, with the filtered signal depicted as a solid red line. The fiducial points (a, b, c, and d) are marked with blue, red, green, and magenta circles, respectively. The fiducial point e is represented by a black cross.
Photonics 12 00430 g005
Figure 6. Mechanical properties of the femoral artery. The healthy femoral artery is represented by a solid black line with white dots, the intermediate femoral artery by a solid blue line with white dots, and the unhealthy femoral artery by a solid grey line with white dots.
Photonics 12 00430 g006
Figure 7. Box plot of the features extracted when the system was in a normotensive state, illustrating the changes in red, infrared, and green signals from the phantoms, arranged in order of decreasing elasticity: from healthy (0.82 MPa), to intermediate (1.48 MPa), to unhealthy (2.06 MPa).
Photonics 12 00430 g007
Figure 8. Box plot of the features extracted when the system was in a hypertensive state, illustrating the changes in red, infrared, and green signals from the phantoms, arranged in order of decreasing elasticity: from healthy (0.82 MPa), to intermediate (1.48 MPa), to unhealthy (2.06 MPa).
Photonics 12 00430 g008
Figure 9. Box plot of the features extracted when the system was in a hypotensive state, illustrating the changes in red, infrared, and green signals from the phantoms, arranged in order of decreasing elasticity: from healthy (0.82 MPa), to intermediate (1.48 MPa), to unhealthy (2.06 MPa).
Photonics 12 00430 g009
Table 1. Kruskal–Wallis p-value obtained for features extracted in normotensive state. A p-value of less than 0.05 represents a statistically significant difference. For features with a p-value above 0.05, the actual p-value is included in the table.
Healthy–IntermediateIntermediate–UnhealthyHealthy–Unhealthy
Area Under Curve0.0662p < 0.05p < 0.05
Amplitude0.6690p < 0.05p < 0.05
Median Upslope–Downslope-Ratiop < 0.05p < 0.05p < 0.05
Median End Datum Differencep < 0.05p < 0.05p < 0.05
Table 2. Kruskal–Wallis p-value obtained for features extracted in hypertensive state. A p-value of less than 0.05 represents a statistically significant difference. For features with a p-value above 0.05, the actual p-value is included in the table.
Healthy–IntermediateIntermediate–UnhealthyHealthy–Unhealthy
Area Under Curve0.1540p < 0.05p < 0.05
Amplitudep < 0.05p < 0.05p < 0.05
Median Upslope–Downslope-Ratiop < 0.05p < 0.050.0986
Median End Datum Differencep < 0.05p < 0.05p < 0.05
Table 3. Kruskal–Wallis p-value obtained for features extracted in hypotensive state. A p-value of less than 0.05 represents a statistically significant difference. For features with a p-value above 0.05, the actual p-value is included in the table.
Healthy–IntermediateIntermediate–UnhealthyHealthy–Unhealthy
Area Under Curvep < 0.05p < 0.05p < 0.05
Amplitudep < 0.05p < 0.05p < 0.05
Median Upslope–Downslope-Ratiop < 0.05p < 0.05p < 0.05
Median End Datum Differencep < 0.05p < 0.05p < 0.05
Table 4. Ratios derived from the fiducial points of the red PPG signal for each health status and BP setting.
HypertensiveNormotensiveHypotensive
b a c a d a e a b a c a d a e a b a c a d a e a
Red signalHealthy−2.131.29−0.430.37−2.181.34−0.410.38−1.981.05−0.210.28
Unhealthy−2.061.01−0.440.36−2.171.33−0.430.37−1.981.02−0.220.28
Disclaimer/Publisher’s Note: The statements, opinions and data contained in all publications are solely those of the individual author(s) and contributor(s) and not of MDPI and/or the editor(s). MDPI and/or the editor(s) disclaim responsibility for any injury to people or property resulting from any ideas, methods, instructions or products referred to in the content.