A Flexible Photonic Method for Angle-of-Arrival and Frequency Measurements


 ,
, 
Abstract
1. Introduction
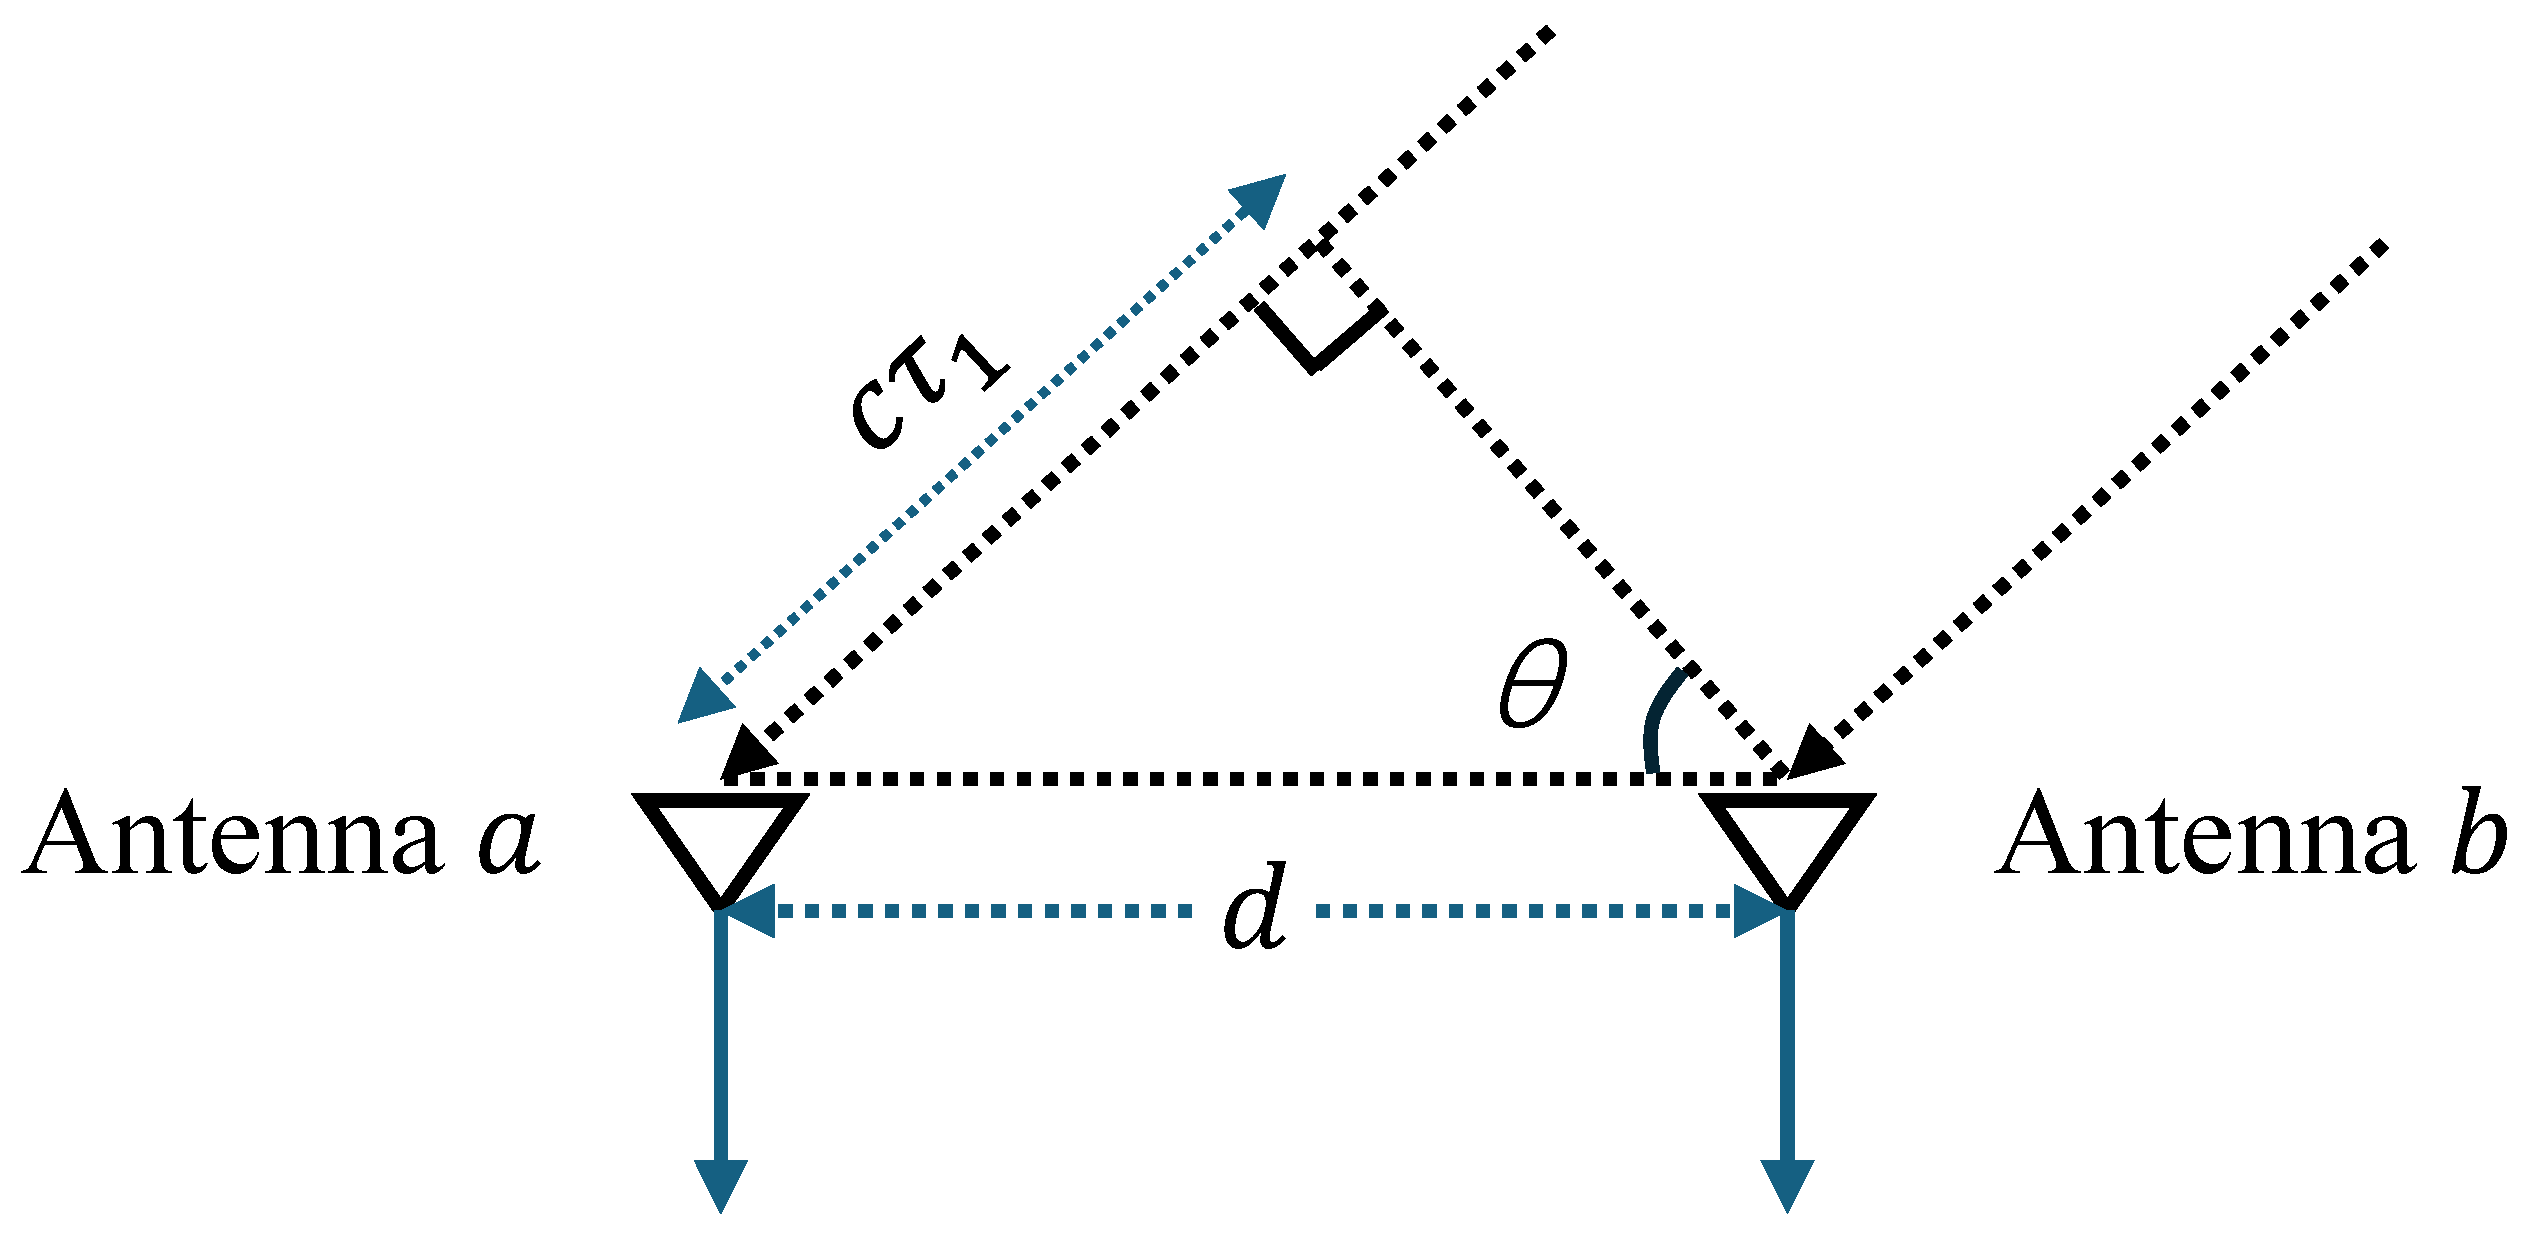
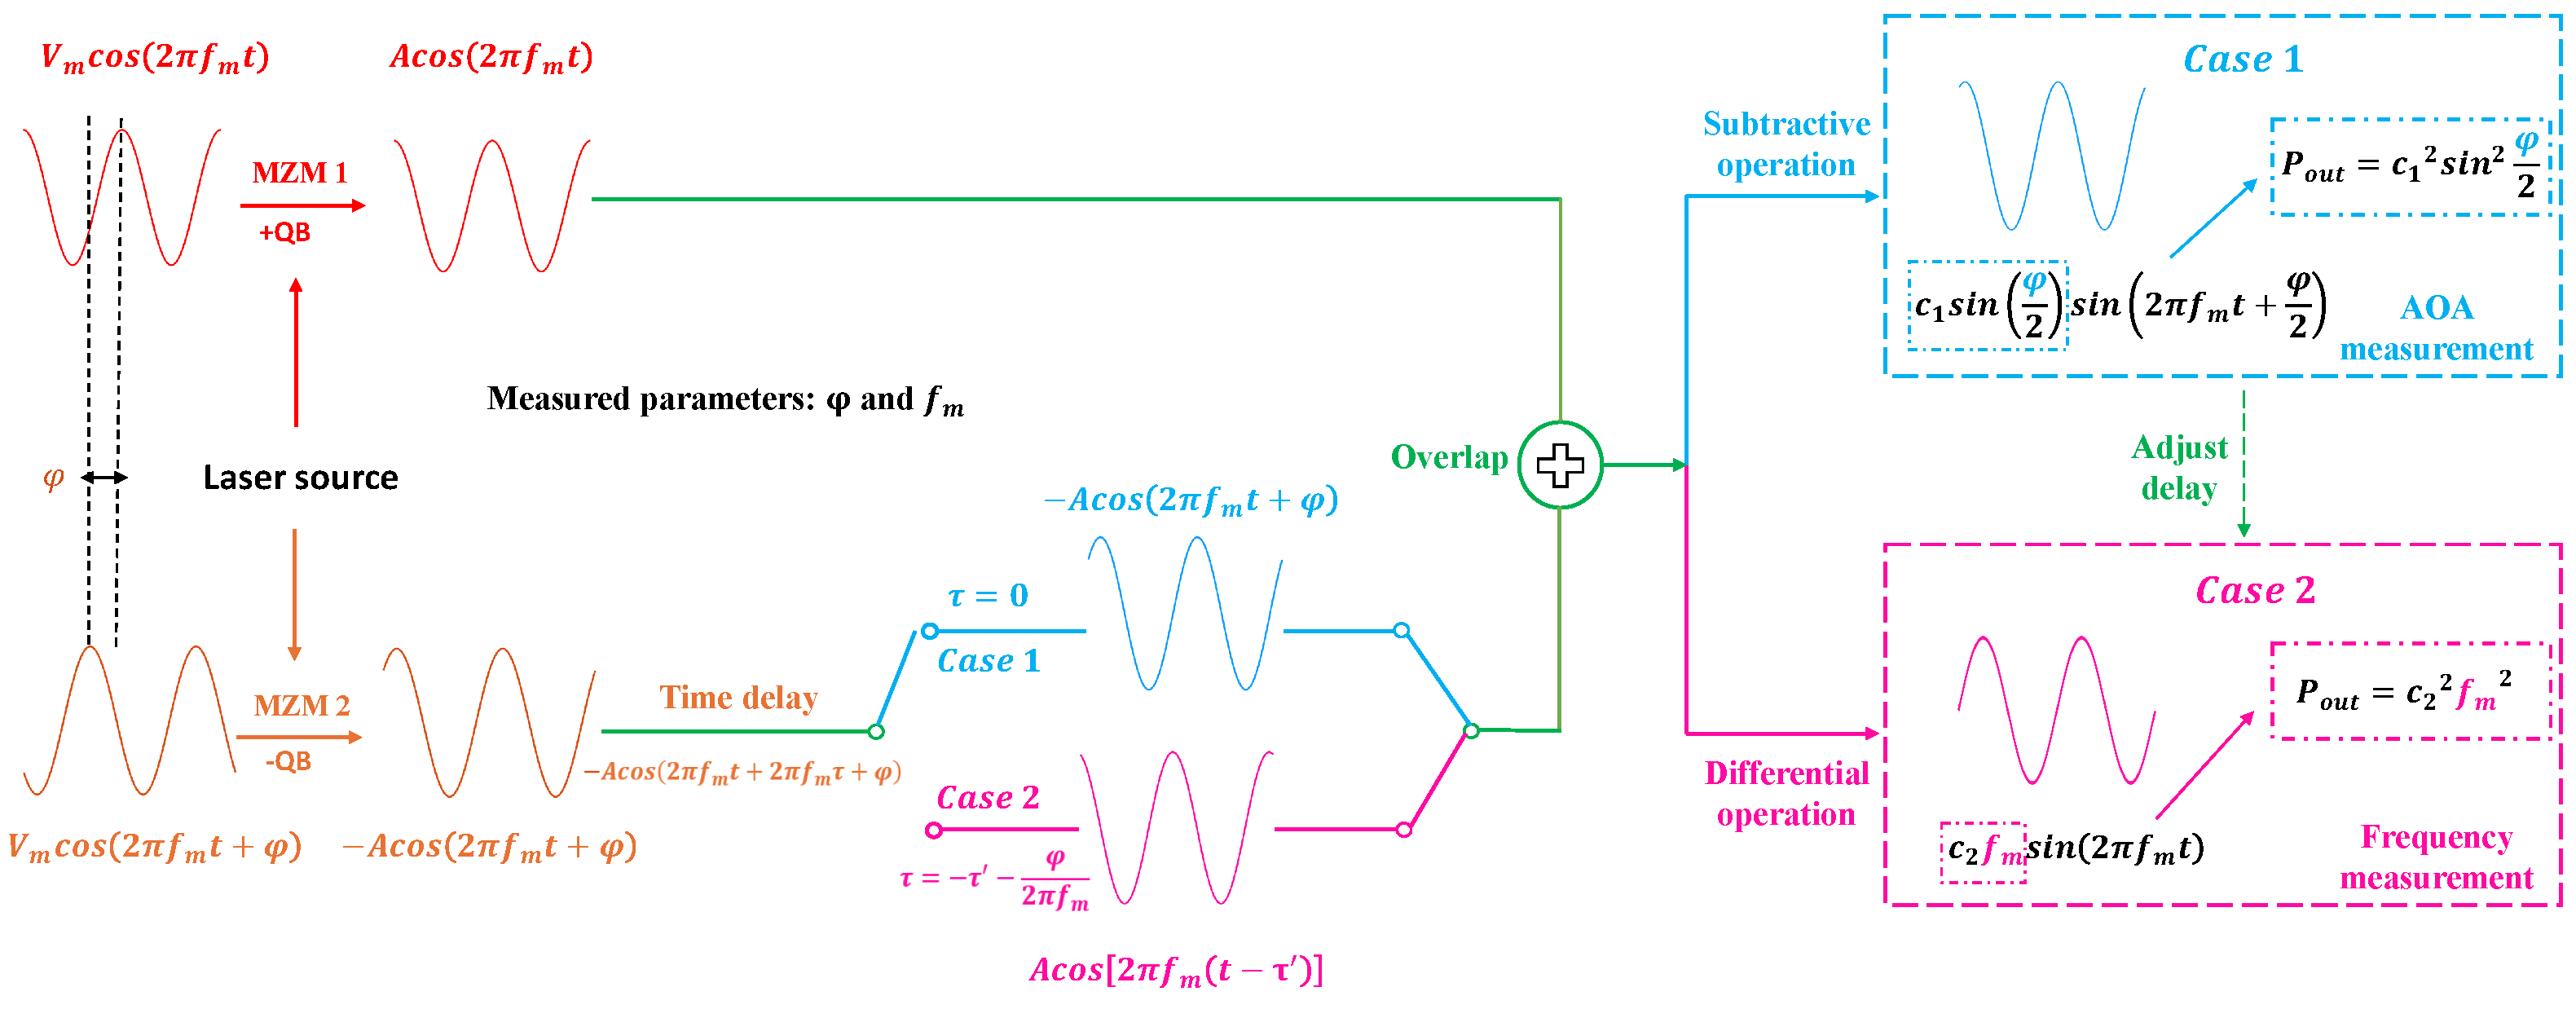
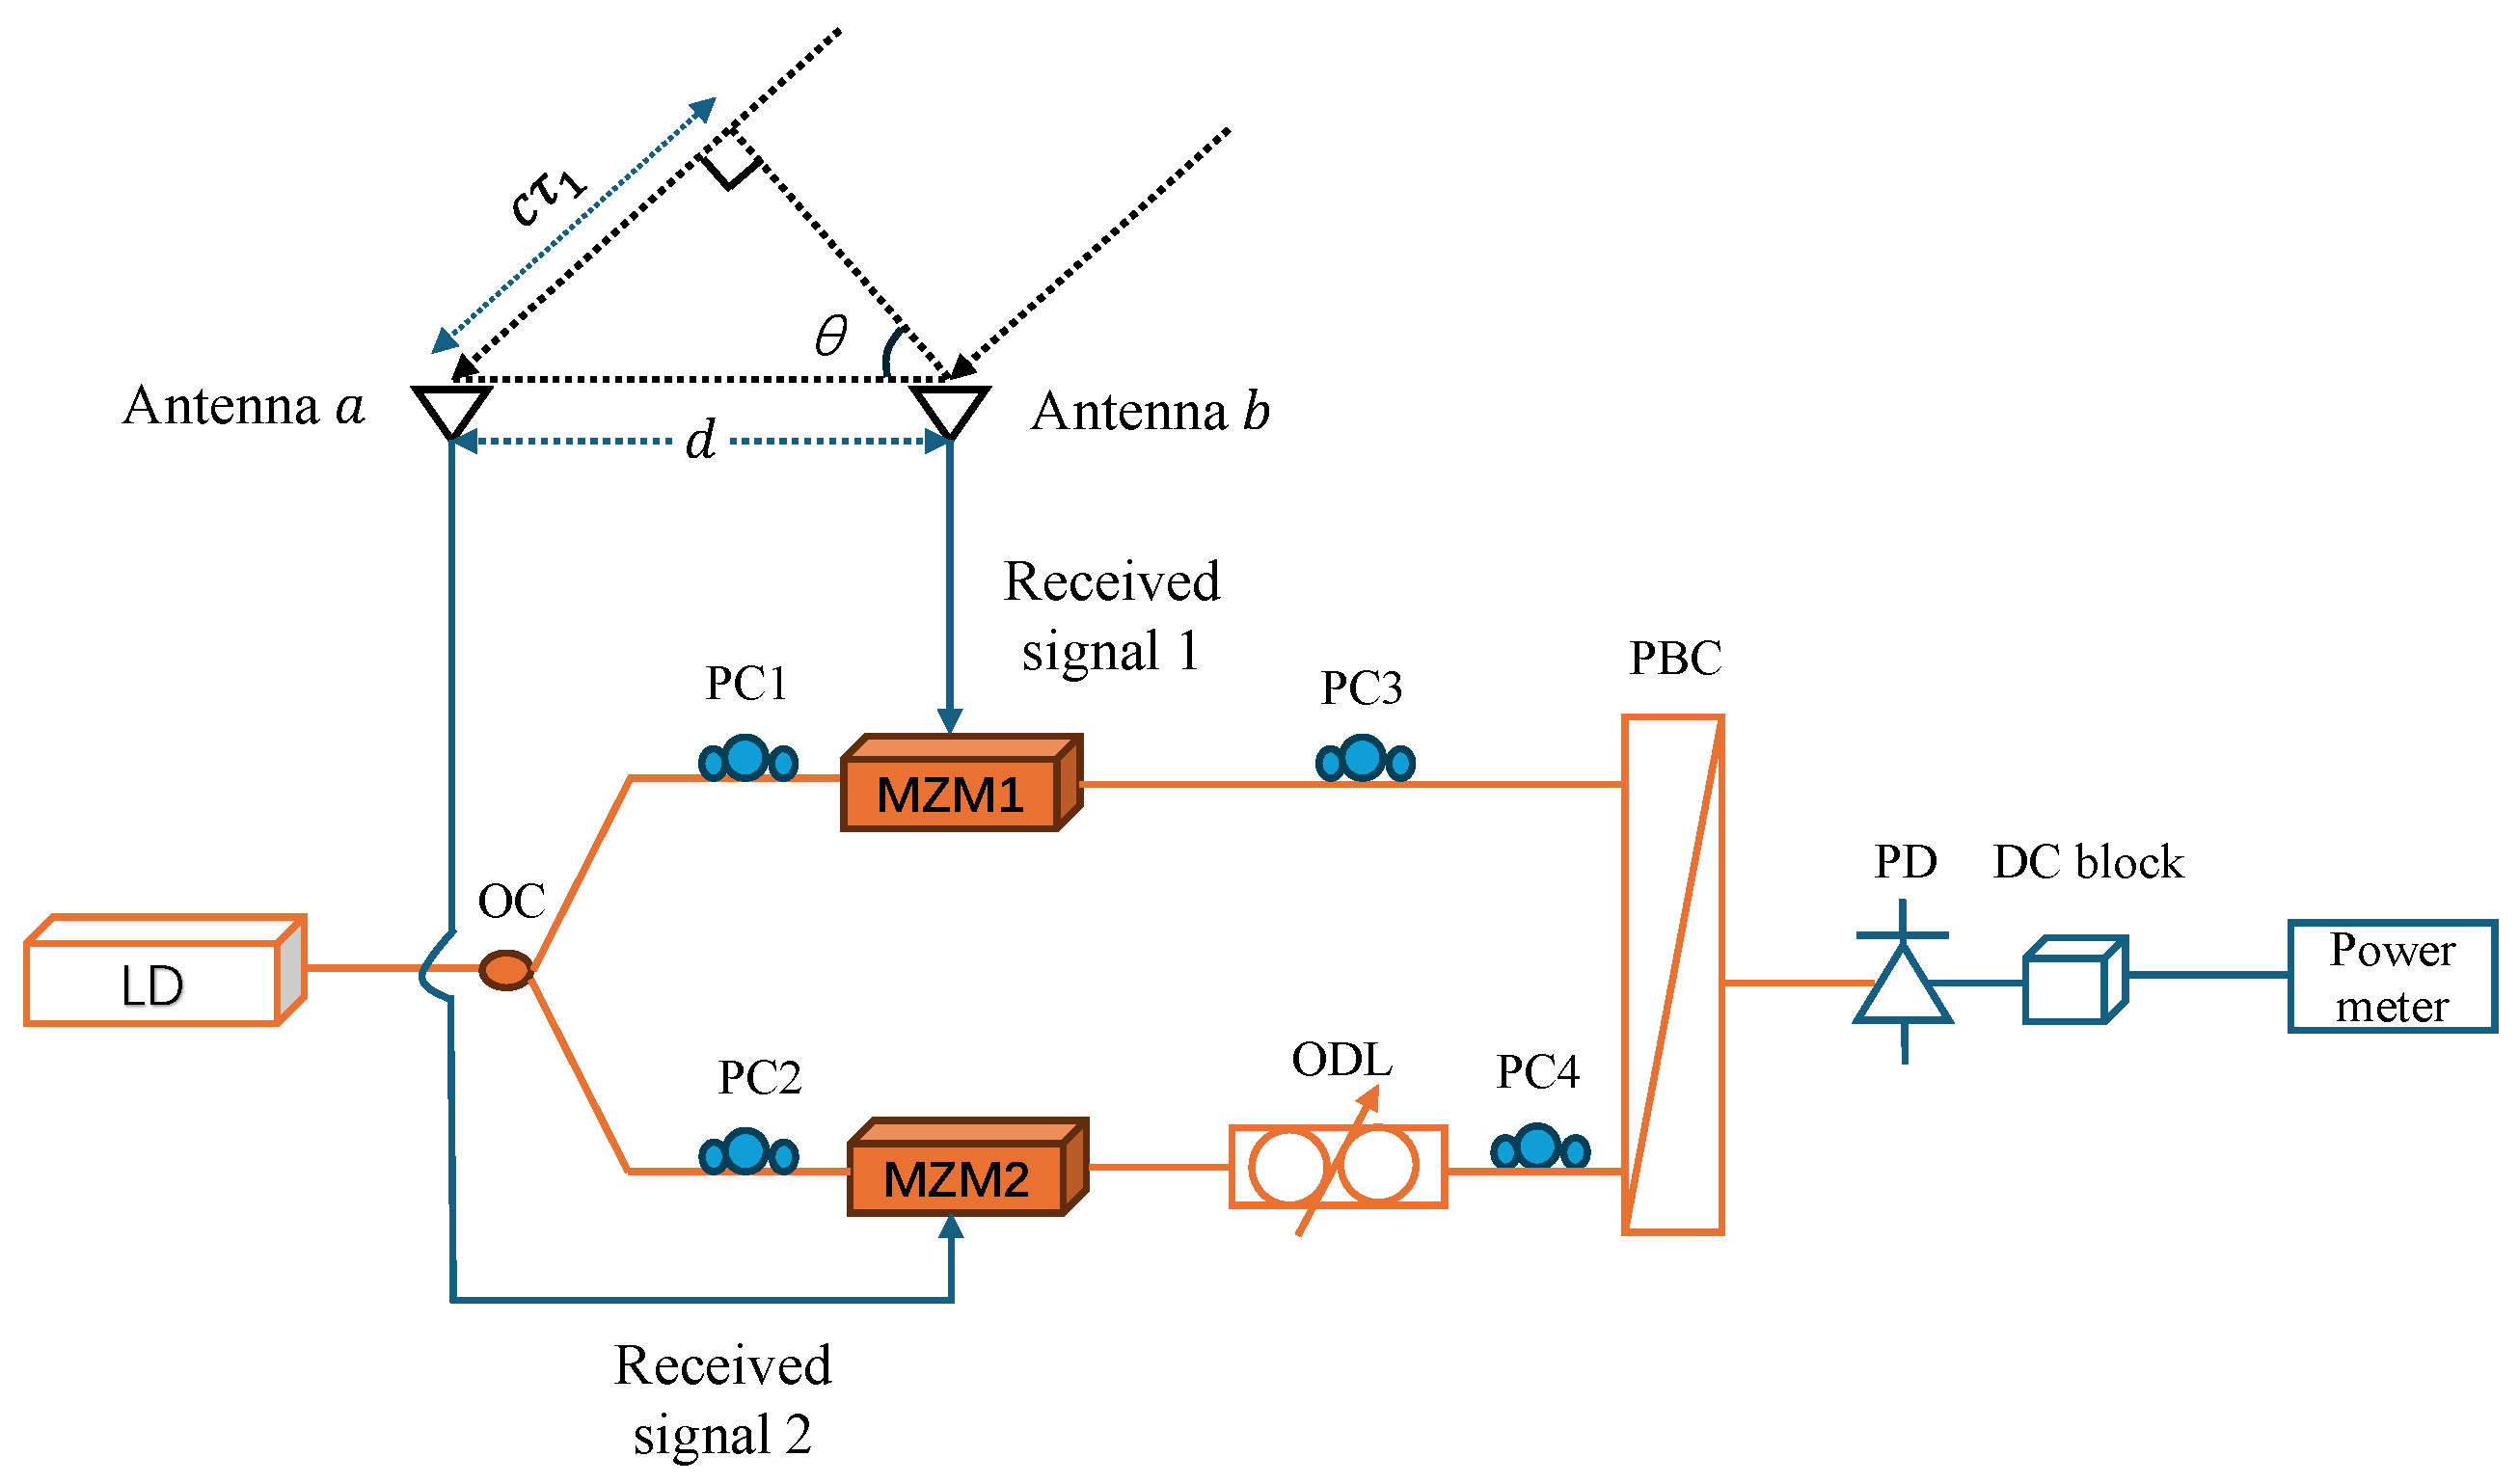
2. Principle
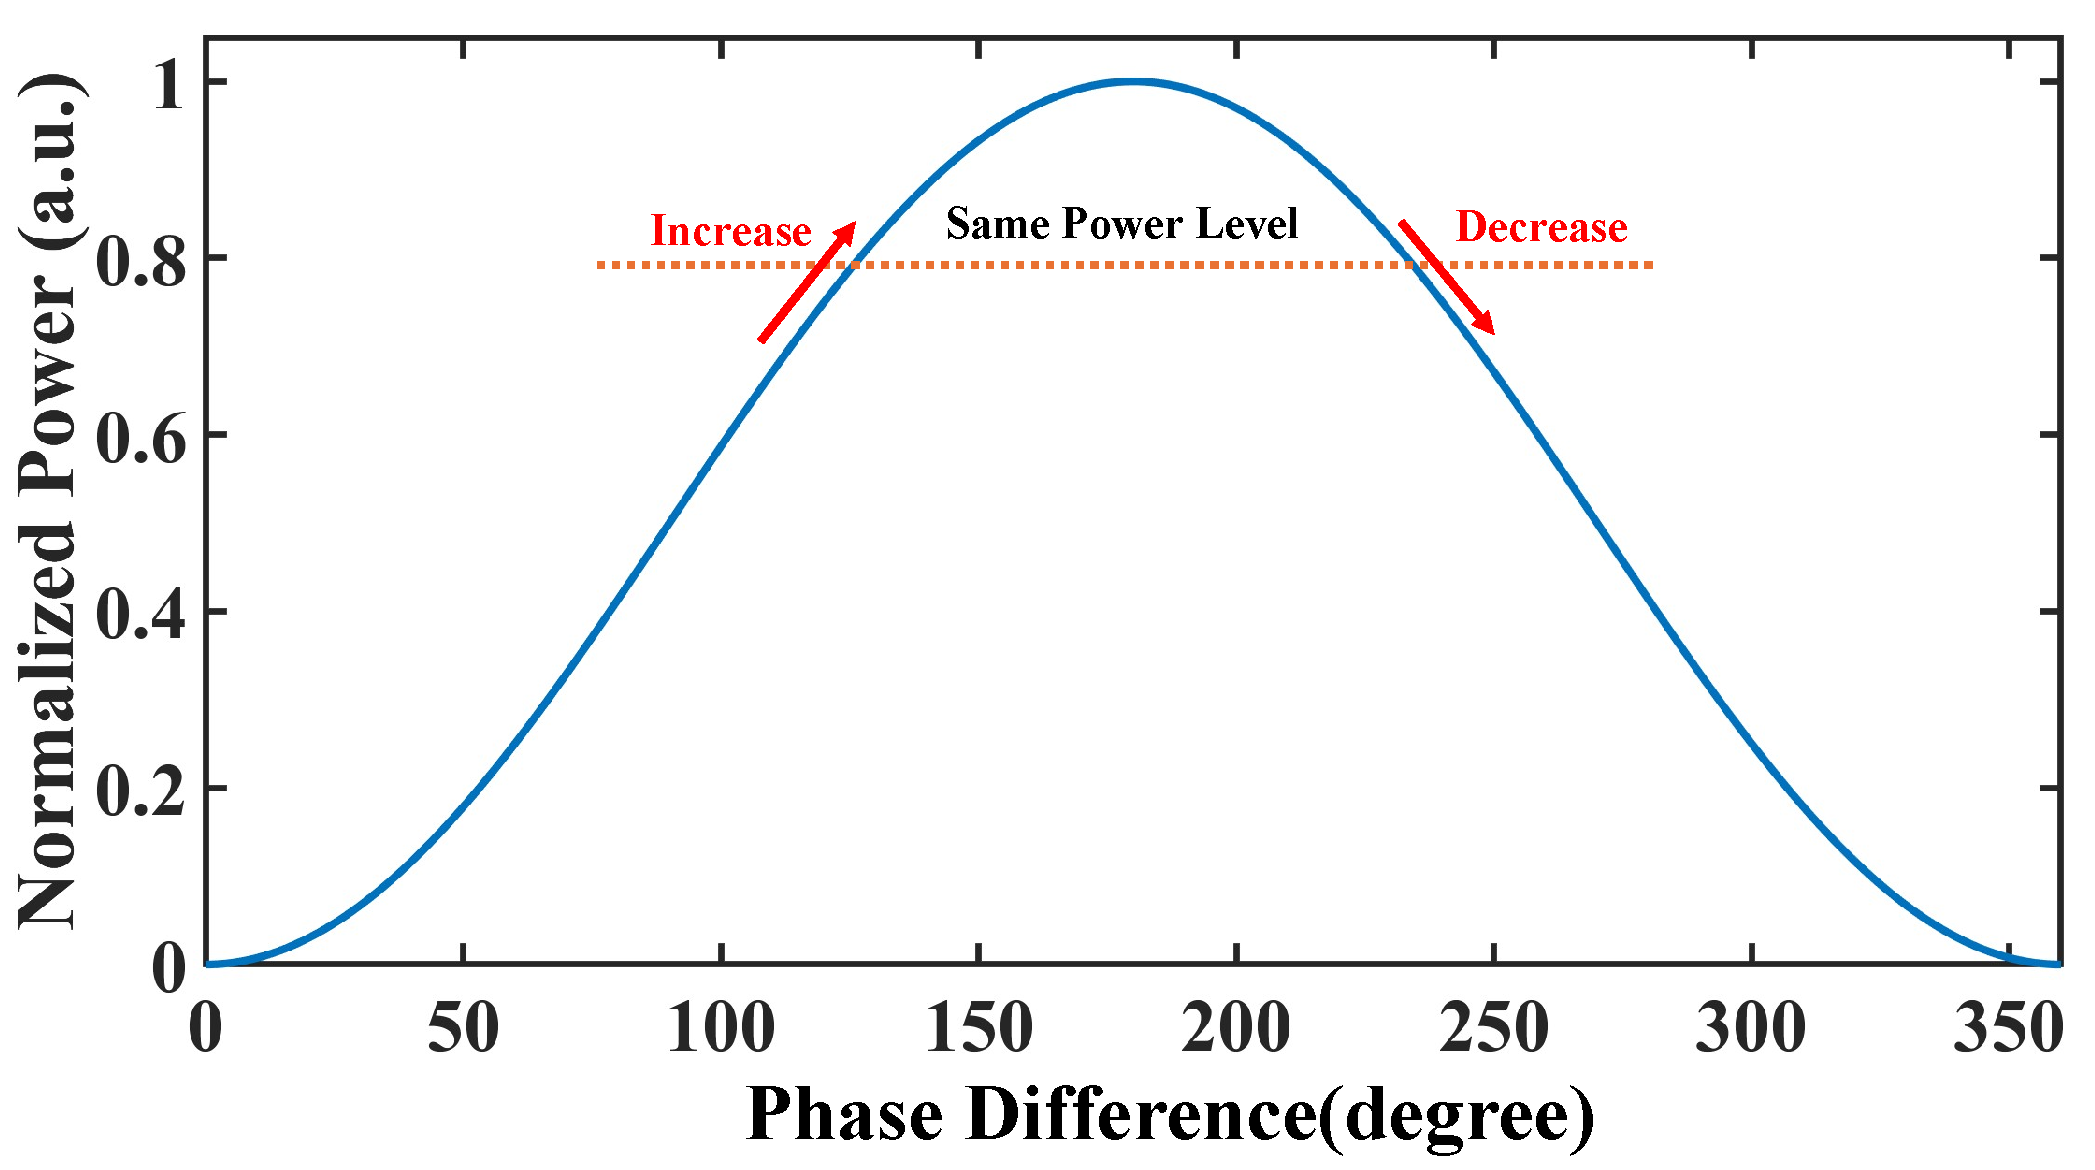
2.1. AOA Measurement
2.2. Frequency Measurement
3. Experimental Results and Discussion
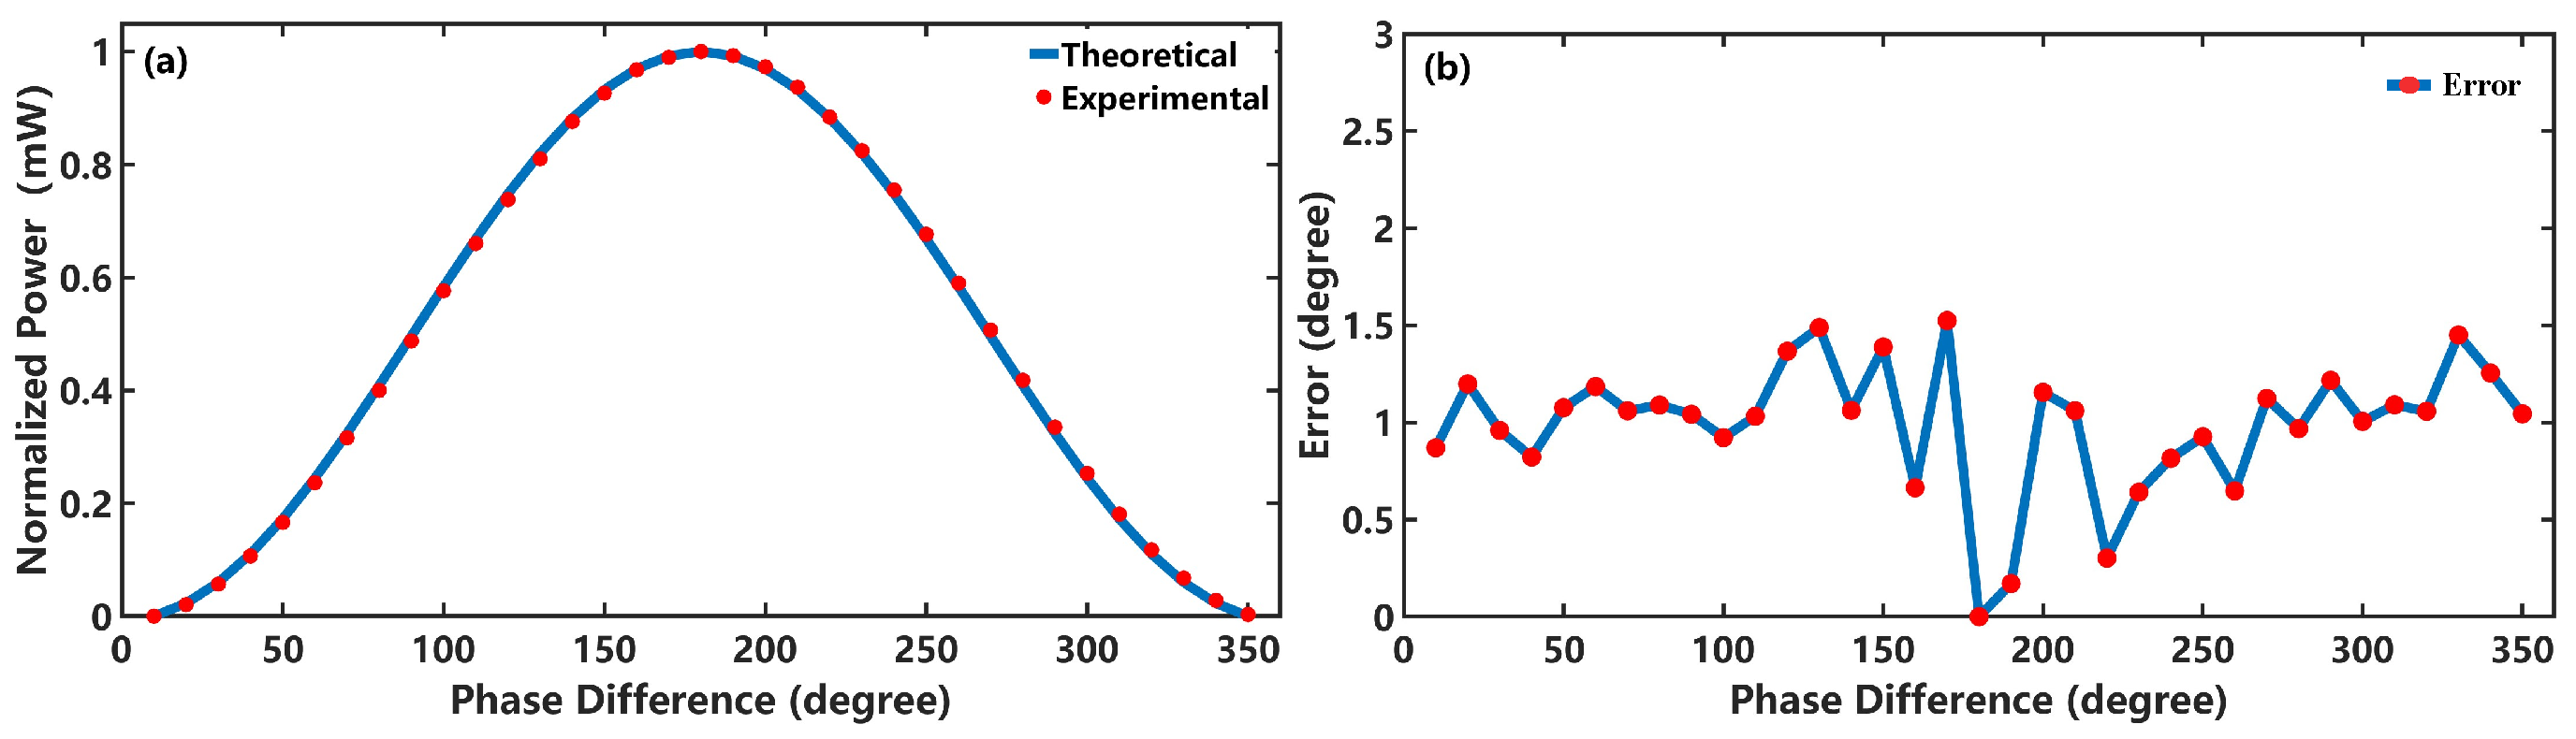
3.1. AOA Measurement
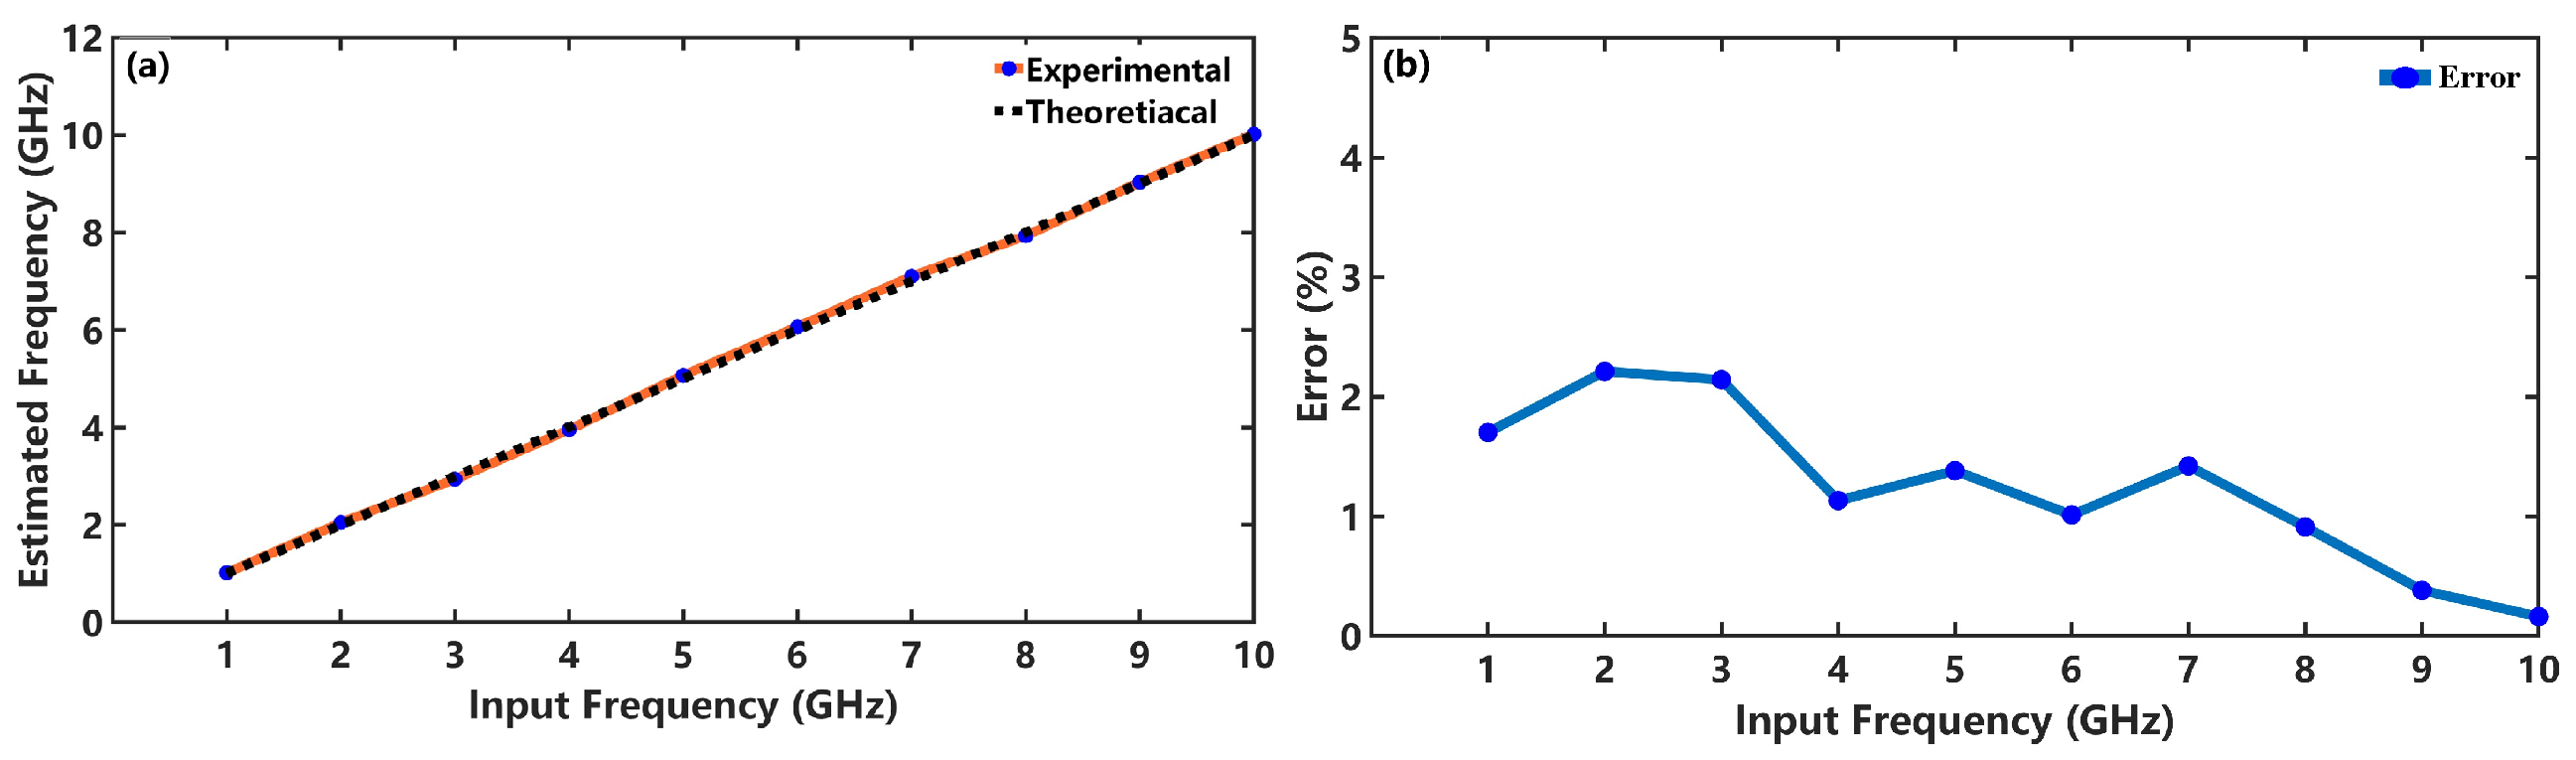
3.2. Frequency Measurement
4. Conclusions
Author Contributions
Funding
Institutional Review Board Statement
Informed Consent Statement
Data Availability Statement
Conflicts of Interest
References
- Hong, S.; Wu, J.; Xie, Y.; Ke, X.; Li, H.; Lyv, L.; Peng, Y.; Yao, Q.; Shi, Y.; Wang, K.; et al. Versatile parallel signal processing with a scalable silicon photonic chip. Nat. Commun. 2025, 16, 288. [Google Scholar] [CrossRef] [PubMed]
- Zhang, J.; Yao, J. Photonic-assisted microwave temporal convolution. J. Light. Technol. 2016, 34, 4652–4657. [Google Scholar] [CrossRef]
- Tian, X.; Zhou, L.; Li, L.; Gunawan, G.; Nguyen, L.; Yi, X. Deep learning assisted microwave photonic dual-parameter sensing. IEEE J. Sel. Top. Quantum Electron. 2023, 29, 1–11. [Google Scholar] [CrossRef]
- Liu, B.; Xu, J.; Ruan, Y.; Yu, Y.; Xi, J.; Ji, H.; Tang, P. Two-dimensional nanoscale position sensing using microwave photonic signal induced by period-one dynamics of semiconductor laser. J. Light. Technol. 2024. [CrossRef]
- Zhang, Z.; Xu, Y.; Luo, X.; Chen, M.; Bao, H. Passively stabilized Brillouin fiber laser frequency combs for ultralow-noise microwave generation. Appl. Phys. Lett. 2024, 124, 211105. [Google Scholar] [CrossRef]
- Zhou, Y.; Ruesink, F.; Pavlovich, M.; Behunin, R.; Cheng, H.; Gertler, S.; Starbuck, A.L.; Leenheer, A.J.; Pomerene, A.T.; Trotter, D.C.; et al. Electrically interfaced Brillouin-active waveguide for microwave photonic measurements. Nat. Commun. 2024, 15, 6796. [Google Scholar] [CrossRef] [PubMed]
- Tsui, J.B. Digital Techniques for Wideband Receivers; SciTech Publishing: Raleigh, NC, USA, 2004; Volume 2. [Google Scholar]
- Zhu, D.; Pan, S. Broadband cognitive radio enabled by photonics. J. Light. Technol. 2020, 38, 3076–3088. [Google Scholar] [CrossRef]
- Spezio, A.E. Electronic warfare systems. IEEE Trans. Microw. Theory Tech. 2002, 50, 633–644. [Google Scholar] [CrossRef]
- Li, M.; Lu, Y. Angle-of-arrival estimation for localization and communication in wireless networks. In Proceedings of the 2008 16th European Signal Processing Conference, Lausanne, Switzerland, 25–29 August 2008; IEEE: Piscataway, NJ, USA, 2008; pp. 1–5. [Google Scholar]
- Teppati, V.; Ferrero, A.; Sayed, M. Modern RF and Microwave Measurement Techniques; Cambridge University Press: Cambridge, UK, 2013. [Google Scholar]
- East, P. Fifty years of instantaneous frequency measurement. IET Radar Sonar Navig. 2012, 6, 112–122. [Google Scholar] [CrossRef]
- Ghelfi, P.; Laghezza, F.; Scotti, F.; Serafino, G.; Capria, A.; Pinna, S.; Onori, D.; Porzi, C.; Scaffardi, M.; Malacarne, A.; et al. A fully photonics-based coherent radar system. Nature 2014, 507, 341–345. [Google Scholar] [CrossRef]
- Ma, C.; Yang, Y.; Liu, C.; Fan, B.; Ye, X.; Zhang, Y.; Wang, X.; Pan, S. Microwave photonic imaging radar with a sub-centimeter-level resolution. J. Light. Technol. 2020, 38, 4948–4954. [Google Scholar] [CrossRef]
- Tang, Z.; Li, Y.; Yao, J.; Pan, S. Photonics-based microwave frequency mixing: Methodology and applications. Laser Photonics Rev. 2020, 14, 1800350. [Google Scholar] [CrossRef]
- Ye, X.; Zhang, F.; Yang, Y.; Pan, S. Photonics-based radar with balanced I/Q de-chirping for interference-suppressed high-resolution detection and imaging. Photonics Res. 2019, 7, 265–272. [Google Scholar] [CrossRef]
- Pan, S.; Ye, X.; Zhang, Y.; Zhang, F. Microwave photonic array radars. IEEE J. Microwaves 2021, 1, 176–190. [Google Scholar] [CrossRef]
- Chen, H.; Chan, E.H. Simple approach to measure angle of arrival of a microwave signal. IEEE Photonics Technol. Lett. 2019, 31, 1795–1798. [Google Scholar] [CrossRef]
- Chen, H.; Chan, E.H. Photonics-based CW/pulsed microwave signal AOA measurement system. J. Light. Technol. 2020, 38, 2292–2298. [Google Scholar] [CrossRef]
- Cao, Z.; van den Boom, H.P.; Chen, M.; Okonkwo, C.M.; Zou, S.; Tangdiongga, E.; Chen, L.; Koonen, A.M. Angle-of-arrival measurement of a microwave signal based on parallel optical delay detector with accuracy monitored. In Proceedings of the 2013 Optical Fiber Communication Conference and Exposition and the National Fiber Optic Engineers Conference (OFC/NFOEC), Anaheim, CA, USA, 17–21 March 2013; IEEE: Piscataway, NJ, USA, 2013; pp. 1–3. [Google Scholar]
- Cao, Z.; van den Boom, H.P.; Lu, R.; Wang, Q.; Tangdiongga, E.; Koonen, A. Angle-of-arrival measurement of a microwave signal using parallel optical delay detector. IEEE Photonics Technol. Lett. 2013, 25, 1932–1935. [Google Scholar] [CrossRef]
- Zou, X.; Li, W.; Pan, W.; Luo, B.; Yan, L.; Yao, J. Photonic approach to the measurement of time-difference-of-arrival and angle-of-arrival of a microwave signal. Opt. Lett. 2012, 37, 755–757. [Google Scholar] [CrossRef]
- Tu, Z.; Wen, A.; Xiu, Z.; Zhang, W.; Chen, M. Angle-of-arrival estimation of broadband microwave signals based on microwave photonic filtering. IEEE Photonics J. 2017, 9, 1–8. [Google Scholar] [CrossRef]
- Li, G.; Shi, D.; Wang, L.; Xiao, Y.; Li, M.; Zhu, N.; Li, W. Unambiguous measurement of AOA using a DDMZM. Opt. Commun. 2022, 514, 128132. [Google Scholar] [CrossRef]
- Zhuo, H.; Wen, A.; Wang, Y. Photonic angle-of-arrival measurement without direction ambiguity based on a dual-parallel Mach–Zehnder modulator. Opt. Commun. 2019, 451, 286–289. [Google Scholar] [CrossRef]
- Zhang, X.; Chi, H.; Gao, Y.; He, H.; Zhai, Y. Photonic angle-of-arrival measurement of microwave signals using a triangular wave. Opt. Lett. 2023, 48, 5013–5016. [Google Scholar] [CrossRef]
- Kong, Z.; Chen, X.; Tang, H.; Dong, W.; Li, F.; Li, M.; Zhu, N.; Li, W. A Photonic Approach for Simultaneous Frequency and AOA Measurement of Multi-Target. J. Light. Technol. 2024, 43, 572–578. [Google Scholar] [CrossRef]
- Ding, J.; Zhu, D.; Yang, Y.; Ni, B.; Zhang, C.; Pan, S. Simultaneous angle-of-arrival and frequency measurement system based on microwave photonics. J. Light. Technol. 2023, 41, 2613–2622. [Google Scholar] [CrossRef]
- Zhang, X.; Yang, S.; Yang, B.; Gao, Y.; He, H.; Chi, H. Simultaneous measurement of AOA and frequency based on stimulated Brillouin scattering and frequency-to-time mapping. J. Light. Technol. 2024, 42, 5606–5615. [Google Scholar] [CrossRef]
- Wang, H.; Yang, B.; Yang, S.; Gao, Y.; Ou, J.; Zhai, Y.; Chi, H. Simultaneous frequency and angle-of-arrival measurement of microwave signals utilizing the Talbot effect and pulse interference. Opt. Commun. 2024, 573, 131047. [Google Scholar] [CrossRef]
- Li, X.; Wen, A.; Li, X.; Wang, Z. Photonic-assisted approach to simultaneous measurement of frequency and angle-of-arrival. J. Light. Technol. 2023, 41, 7379–7389. [Google Scholar] [CrossRef]
- Li, X.; Wen, A.; Li, X.; Yang, Y. Wideband frequency and angle-of-arrival measurement system based on optical subsampling. IEEE Trans. Microw. Theory Tech. 2022, 71, 784–794. [Google Scholar] [CrossRef]
- Yang, Y.; Ma, C.; Fan, B.; Wang, X.; Zhang, F.; Xiang, Y.; Pan, S. Photonics-based simultaneous angle of arrival and frequency measurement system with multiple-target detection capability. J. Light. Technol. 2021, 39, 7656–7663. [Google Scholar] [CrossRef]
- Meng, Q.; Wang, G.; Zhao, S.; Wen, Z.; Zhou, Y.; Zhu, Z. Photonics-assisted simultaneous frequency and angle-of-arrival measurement using parameter mapping method. Opt. Commun. 2024, 560, 130401. [Google Scholar] [CrossRef]
- Chen, X.; Jiang, Y.; Yu, Q.; Xu, J.; Zi, Y.; Li, J.; Lan, X.; Chen, N. All-optical microwave waveform transformation based on photonic temporal processors. Opt. Express 2022, 30, 10428–10442. [Google Scholar] [CrossRef] [PubMed]
- Yu, Y.; Jiang, F.; Tang, H.; Xu, L.; Liu, X.; Dong, J.; Zhang, X. Reconfigurable photonic temporal differentiator based on a dual-drive Mach-Zehnder modulator. Opt. Express 2016, 24, 11739–11748. [Google Scholar] [CrossRef] [PubMed]

Disclaimer/Publisher’s Note: The statements, opinions and data contained in all publications are solely those of the individual author(s) and contributor(s) and not of MDPI and/or the editor(s). MDPI and/or the editor(s) disclaim responsibility for any injury to people or property resulting from any ideas, methods, instructions or products referred to in the content. |
© 2025 by the authors. Licensee MDPI, Basel, Switzerland. This article is an open access article distributed under the terms and conditions of the Creative Commons Attribution (CC BY) license (https://creativecommons.org/licenses/by/4.0/).
Share and Cite
Luo, Y.; Jiang, Y.; Xu, J.; Lan, X.; Feng, J.; Yu, J.; Long, Q.; Jiang, T.; Zhang, H.; Wu, Y. A Flexible Photonic Method for Angle-of-Arrival and Frequency Measurements. Photonics 2025, 12, 423. https://doi.org/10.3390/photonics12050423
Luo Y, Jiang Y, Xu J, Lan X, Feng J, Yu J, Long Q, Jiang T, Zhang H, Wu Y. A Flexible Photonic Method for Angle-of-Arrival and Frequency Measurements. Photonics. 2025; 12(5):423. https://doi.org/10.3390/photonics12050423
Chicago/Turabian StyleLuo, Yunkun, Yang Jiang, Jing Xu, Xiaohong Lan, Jinjian Feng, Jiancheng Yu, Qianyou Long, Tingyi Jiang, Hui Zhang, and Yu Wu. 2025. "A Flexible Photonic Method for Angle-of-Arrival and Frequency Measurements" Photonics 12, no. 5: 423. https://doi.org/10.3390/photonics12050423
APA StyleLuo, Y., Jiang, Y., Xu, J., Lan, X., Feng, J., Yu, J., Long, Q., Jiang, T., Zhang, H., & Wu, Y. (2025). A Flexible Photonic Method for Angle-of-Arrival and Frequency Measurements. Photonics, 12(5), 423. https://doi.org/10.3390/photonics12050423