Abstract
Silicon-on-Insulator (SOI) technology and optical resonators have significantly influenced the field of photonics for malignancy sensing. Cancer, a malignant disease, necessitates the precise and advanced diagnostic technique. This study introduces a novel approach for cancer detection utilizing a micro racetrack ring resonator (MRTRR) integrated with Subwavelength Gratings (SWGs). The grating pitch size (Λ) is 300 nm. The findings demonstrate that the SWG MRTRR achieves high Sensitivity (S) due to enhanced light matter interaction and weak mode confinement. The SWG MRTRR produces a spectral envelope as the transmission output, which eliminates the limitation of free spectral range (FSR). The ‘S’ values obtained for cervical cancer, breast cancer type-1, and breast cancer type-2 are 1825 nm/RIU, 1705.14 nm/RIU, and 1004.71 nm/RIU. The Q-factor and the intrinsic Limit of Detection (iLoD) values are 269.68, 280.78, 315.76, 3.28 × 10⁻³, 3.37 × 10⁻³, and 5.09 × 10⁻³, respectively.
1. Introduction
Optical resonators that emerged from optical waveguides are potential candidates in various silicon photonic research areas. Numerous applications, including modulators, filters, and sensors, can be designed through optical resonators [1,2,3,4,5,6]. The approach towards sensors is suitable for biosensing applications, which encompass a wide range of applications, including bioterror detection, plasmonic [7], smart home healthcare diagnostics, and fundamental medical research [8,9,10,11]. In these sensors, molecular interactions between the waveguide and the analyte are detected via the evanescent field generated by wave propagation, a principle that has been central to biosensing research. The sensing mechanism relies on the evanescent field interaction between the guided optical modes and the analyte present in the cladding medium surrounding the waveguide core [12]. This evanescent field exponentially decays from the waveguide surface but remains highly sensitive to variations in the refractive index (RI) of the external medium. Any molecular binding or refractive index change in the sensing region alters the effective mode index, leading to measurable shifts in resonance wavelength or transmission characteristics. These perturbations enable the precise detection and quantification of biochemical interactions, making this mechanism highly effective for label-free optical sensing applications [13,14,15,16]. The optical properties of the system exhibit measurable changes due to variations in the effective refractive index (neff), which can be easily quantified. The neff of the propagating mode in the waveguide is influenced by modifications in the cladding region. These modifications occur as a result of bulk analyte changes or molecular binding events on the surface of the waveguide core. Consequently, these optical sensors demonstrate potential for label-free sensing and labelled sensing with the real-time observation of molecular binding [17,18].
The optical waveguides are used to design several types of resonators, out of which the SWG waveguide is suitable for obtaining high sensitivity (S). To increase the ‘S’ value, it is required to optimize the interaction between the analytes to be measured and the evanescent wave. Consequently, to enhance the ‘S’, the silicon (Si) layer of the waveguide was thinned to allow the wave to escape the Si region. The successive demonstration of rectangular waveguides and slot waveguides was conducted for RI sensing [19,20]. In addition to the evolution of the waveguide structure, Si-based sensors frequently use micro-ring resonators (MRRs) with resonance effect that further enhance light–matter interactions [21,22,23]. A significant limitation of the MRR structure is their reliance on tracking only a single resonance peak, which inherently restricts the Free Spectral Range (FSR). To address this limitation, a novel approach involving a micro racetrack ring resonator (MRTRR) integrated with gratings in the waveguides was proposed for cancer–sensing application. The formation of the envelope spectrum with an enhanced ‘S’ up to three orders was first introduced by Jin et al. in 2012 using cascaded ring resonators [24]. Such structures suffer from complex rigorous fabrication tolerances. Therefore, to overcome this drawback, the SWG MRTRR was introduced for cancer sensing.
Cancer, a death-causing malignancy, is now a common problem across the globe, out of which breast and cervical malignancies are two of the most significant health challenges that women worldwide encounter. Breast cancer with type-1 and type-2 is one of the most frequently diagnosed cancers, with the approximated stats of 2.3 million new cases in 2020, which comprises nearly 12.5% of all new cancer cases, according to a World Health Organization report [25]. Cervical cancer is less common but it remains a significant hazard, particularly in low- and middle-income countries. In 2020, there were approximately 604,000 new cases worldwide. Despite the existence of well-established screening and prevention strategies for both malignancies, disparities in access to healthcare continue to influence outcomes. For example, the survival rate of breast cancer for five years is approximately 90% in high-income countries, while it is only 66% in low-income regional areas. Conversely, the incidence of cervical cancer can be substantially diminished through early detection and vaccination against human papillomavirus (HPV). This underscores the significance of health equity and awareness in the management of these diseases. However, in India, 63 out of 100 deaths occur due to non-communicable diseases, of which cancer is responsible for 9 out of 100 deaths [26]. These statistics make it the leading cause of NCDs in India itself. In 2020, the estimated number of cancer patients was 1,392,179, and the most common locations of the disease were the breast, lung, mouth, cervix, uteri, and tongue [27,28].
Ultrasound, colonoscopy, mammography, clinical breast exam, magnetic resonance imaging (MRI), pap smear, HPV testing, and biopsy are the standard screening methods for the detection of breast and cervical cancers. These methods are precise, but the require a significant amount of time. Si photonics was identified as a technology that can assist in the early detection of cancer, as evidenced by recent reports. Using an integrated Si photonic MRR, Adam et al. conducted research in 2009 to develop a label-free cancer biomarker. Adam et al. reported the Si photonic MRR array to visualize the chemical and biochemical functionality of the sample onto the Si surface in order to capture agents of malignant cells. The quantification scheme reduces the buffer time required to identify the malignant cell sample in this method. The attentiveness of unknown carcinoembryonic antigen solvent in shield can be determined with the label-free format followed via comparable ‘S’ and enhanced precision compared to commercial enzyme-linked immunosorbent assay [2]. Another study was published in 2013 by George et al. that aimed to develop cancer biomarkers for protein and miRNA using a photonic crystal waveguide. The sensor in this study was made using a Si-based photonic crystal structure that consisted of SiO2 gratings coated with a thin film of TiO2 possessing a high refractive index to facilitate sensitive detection. An extremely concentrated electric field intensity within a 100 nm radius of the photonic crystal surface could be produced by this small design by coupling the excitation from a semiconductor laser’s fluorescence process with the resonant optical modes of the crystal. [29]. In 2016, Washburn et al. conducted additional research by developing a multiplexed cancer biomarker for the early detection of a variety of diseases. The researchers’ conclusion in this study was the development of an integrated Si photonic circuit for prognostic monitoring. Biomarkers were selected for use in a variety of organ-specific malignancies, such as those affecting body parts including the ovaries, pancreas, colorectum, liver, lungs, breast, and prostate. It is crucial to note that specific patient samples exhibited biomarker “fingerprints” that may be beneficial for a tailored cancer diagnosis using a minimally invasive technique [30]. Ali et al. published research in 2020 that demonstrated the computational examination of a Si photonic MRR for cancer detection. The ‘S’ was 200 nm/RIU, and the Q-factor was 1200 [31]. Another study was conducted by Jokar et al. in 2023 [32] that presented the computational study of a double elliptical ring resonator biosensor that utilized a photonic crystal. For cervical (HeLa) and skin (Basal) cancer cells, the reported ‘S’ and Q-factor were 1170 nm/RIU, 1116.66 nm/RIU, 422.36, and 449.16, as per [32].
In this work, an SWG MRTRR was proposed for the diagnosis of cancers that are continuously harming women’s health. The malignancy names are cervical cancer and breast type-1 and breast type-2 cancers. The SWG MRTRR eliminated the limitations of FSR and enhances ‘S’. The spectral envelope was obtained from the output port of the resonator to achieve the ‘S’, Quality (Q)-factor, and lower intrinsic Limit of Detection (iLoD). The resonator structure was designed by utilizing a Si photonics platform. To compute the structure of the SWG MRTRR, the finite element method-based COMSOL Multiphysics (version 6.2) was utilized. To ensure faithful electromagnetic wave propagation without boundary interference, scattering boundary conditions were applied to eliminate unwanted reflections. The geometry was then meshed using an extremely coarse grid of triangles with the maximum element size of 264 nm, an element growth rate of 2, a curvature factor of 1, and a resolution of 0.9. The solver configuration included a wavelength domain study and a MUMPS out-of-core solver, requiring at least 1.75 GB of physical memory and 1.85 GB of virtual memory.
2. Structure, Principle, and Design Methodology
This section is focused on the design methodology and the power transmission in the SWG MRTRR. The SOI platform was used for the geometrical structure in which Si was used as the guiding material and silica glass (SiO2) was utilized as the substrate. Figure 1a is the modal cross-sectional representation of the Si waveguide; it shows the evanescent field was interacting with the bio molecules of the cancer solution. To sense the cancerous cells, the power in the waveguide was relatively low because most of it leak outside from the core region. The structure of the SWG MRTRR was designed with a thickness of 220 nm marked with industry standards [33]. The geometric design of the SWG MRTRR was composed of two straight waveguide rails and a racetrack waveguide, popularly known as an add–drop resonator. The geometry of the racetrack resonator was quite different from a ring resonator. Here, an optimized coupler section of length Lc was inserted in between two equal halves of the ring resonator. The power was injected from one end of the straight waveguide. Then, it was coupled to the racetrack waveguide, and, finally, the output was taken from another port of the straight waveguide, as shown in Figure 1b.
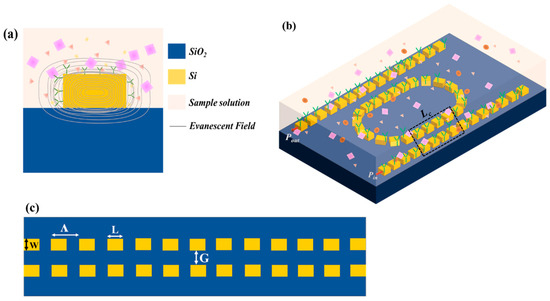
Figure 1.
(a) Mode profile showing analyte interaction in the sensing region; (b) 3D schematic of the SWG MRTRR illustrating its novel optimized design for cancer sensing; and (c) magnified view of the coupling region Lc highlighting the geometry of coupling of (b).
The SWG MRTRR was composed of the periodic rectangular Si blocks, in which each grating period (Λ) was comparatively much lower than the resonant wavelength, which was 1550 nm to form the subwavelength structure. The electromagnetic field in the SWG MRTRR travelled perfectly in the direction of propagation despite the multiple discontinuities of the structure. The dimension of the periodic structure was represented by W, L, and G, as shown in Figure 1c. ‘W’ represents the width of the Si waveguide (500 nm), ‘L’ denotes the length of the grating element (160 nm), and ‘G’ is the gap between the coupler sections (55 nm). The MRTRR featured a bend radius (R) of 10 µm, a coupling section length (Lc) of 7.5 µm, grating period (Λ) of 300 nm, and Si block (WL) length of 160 nm. The choice of selecting the add–drop racetrack resonator instead of a ring resonator stood in tailoring the critical coupling condition from the straight waveguide to the racetrack waveguide. The partial transparent region of Figure 1b shows the sensing region of the resonator, and the refractive index of this region under normal and cancerous conditions is listed in Table 1. The refractive indices for the Si core and SiO2 substrate at 1550 nm wavelength were 3.476 and 1.444 [11,34,35], respectively, calculated through the Sellmeier equation, given by Equations (1) and (2), where the Sellmeier coefficients [17,36] for Si are A1 = 11.6858, A2 = 9.39816 × 10⁻¹³ m2, A3 = 8.10461 × 10⁻³ m−2, and A4 = 1.1071 × 10⁻⁶ m; for SiO2 are B1 = 0.6961663, B2 = 0.0684043 µm, B3 = 0.4079426, B4 = 0.1162414 µm, B5 = 0.8974794, and B6 = 9.8961610 µm; and

Table 1.
Refractive index of cancerous and normal cells [37,38].
The signal transmission in the SWG MRTRR was analysed with the help of the transfer matrix method (TMM). The wavelength-dependent transmittance of the structure T(λ) is given by Equation (3) [39].
where the amplitude of the round-trip amplitude transfer coefficient is denoted by a(λ), the amplitude of the self-coupling coefficient of the coupled region is denoted by t(λ), and the round-trip phase shift of the wave propagating in the grating-based racetrack waveguide is denoted by φ(λ). The term cosφ(λ) is (2π/λ) × neffL, where neff is the effective refractive index of the guided mode of the ring waveguide, and L is the total perimeter of the ring waveguide, including the coupler section. The ‘a’ is the optical loss factor of the ring waveguide, which is equivalent to exp(-αL). The cross-coupling loss in the coupler is given by the cross-coupling coefficient ‘k’, which is equal to k = . When φ(λ) is the integer multiple of 2π, the resonance condition gets satisfied. After achieving the resonance condition, Equation (3) becomes:
Here, from Equation (4), it can be concluded that the magnitude of the resonance peaks was dependent upon the relationship between a(λ) and t(λ). The power transmission at the resonance wavelength becomes null when a(λ) = t(λ), referred to as the critical coupling state. The resonance peak of the critical coupling exhibiting the highest extinction ratio could be identified among all the resonance peaks to create an envelope spectrum. Refractive index sensing is accomplished by monitoring the variation in the spectral envelope in relation to the cladding refractive index. The cancer RI sensing was no longer constrained by the FSR of the SWG MRTRR.
When the electromagnetic wave passes through the small periodic arrangement of gratings in the SWG waveguide, it seems that it passes through the non-grate waveguide due to the small periodicity, which allowed only a zeroth-order diffraction. The configuration of the rectangular waveguide and SWG waveguide, constructed on the SOI platform, are shown in Figure 2a and Figure 2b, respectively. Figure 2a illustrates that the strip waveguide was oriented in the direction of the wave propagation, and Figure 2b possesses a rectangular Si cross-section including gratings. The SWG waveguide consisted of periodically placed Si blocks in which the Λ was significantly smaller than the operational wavelength. The finite element method (FEM) was utilized to analyse the transverse electric (TE) mode properties of the rectangular waveguide and SWG waveguide, as shown in Figure 2c,d.
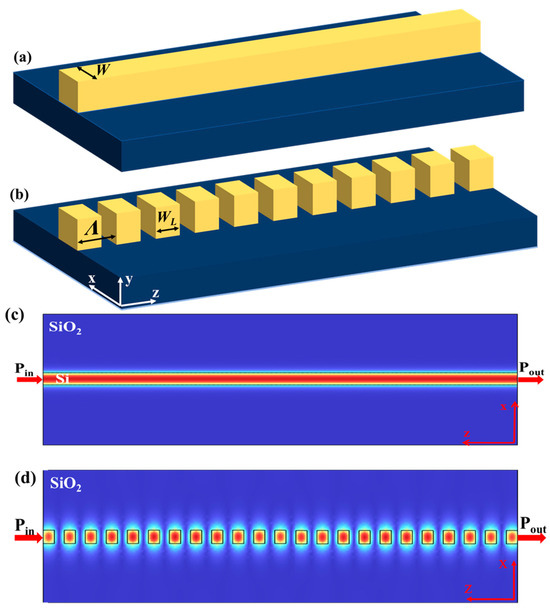
Figure 2.
Comparison of waveguide structures: (a) straight waveguide; (b) SWG waveguide, signifying design differences that influence sensitivity; power transmission profiles at 1550 nm for (c) strip waveguide and (d) SWG waveguide.
The optical mode in the form of power intensity is expressed in W/m2 and shown in Figure 3. The mode of the rectangular waveguide was primarily confined to the Si region, as illustrated in Figure 3a. The high RI difference between the core and cladding part of the waveguide resulted in the presence of only a faint evanescent field near the surface of the Si waveguide. The distribution of the evanescent field outside the Si core can be observed in the cross-sectional view of Figure 3b. Then, the optical power was effectively settled from the Si to the analyte due to presence of a foreign molecule. The wave in the SWG waveguide induced a Bloch mode, which theoretically propagated through the grated waveguide without any losses due to diffraction patterns in the cladding or radiation modes, as shown in Figure 3c. The Bloch mode was delocalized from the Si region and appeared in the truncation area between the Si segments along the wave propagation direction. Power confined within the waveguide core was justified by calculating the confinement factor (Γsub-region), as defined in Equation (5).
The Γsub-region is defined as the ratio of a square of an electric field integrating over volume of the material in a single-unit cell with the period of Λ. The sub-region of Equation (5) consists of the confinement of a slot (gap between two silicon segments), confinement of a silicon segment, and the cladding region. This factor is a critical unitless parameter that quantifies the extent to which the optical power is constrained within the central region of the waveguide. It is a metric that quantifies the extent to which the intensity distribution of the optical mode overlaps. The power confinement factors of the rectangular waveguide and SWG waveguide for the normal and cancerous cells of cervical cancer and breast type-1 and breast type-2 cancers are calculated in Table 2 and contrasted in order to quantitatively characterize the releasing light-wave field performance of the rectangular waveguide and SWG waveguide.
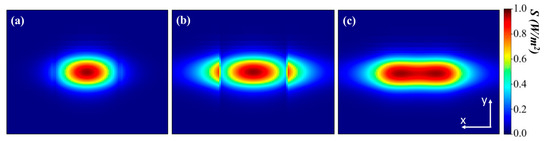
Figure 3.
Normalized power intensity representing mode cross-sectional view at 1550 nm for (a) strip waveguide; (b) SWG waveguide; and (c) cancerous solvent mode at the middle of two Si blocks of SWG waveguide.
Table 2.
Power confinement comparison for cancer RI in rectangular strip and SWG waveguides.
For a biosensor, as the refractive index of the cladding regime altered, the evanescent field extended beyond the core region, leading to the enhancement in ‘S’ values. This resulted in an optical power trade-off of ~40% to 44% between the power confined in the core and the cladding. Consequently, the guided optical mode within the core extended into the cladding region, leading to a weaker optical confinement. In the case of the rectangular waveguides, the Si core retained the majority of the power while the substrate and cladding region contained only ~10% of the power. Nevertheless, the power contained within the core Si region of the SWG waveguides decreased by ~50%, and the remaining power was distributed between the cancer solvent region and the substrate region.
To optimize the SWG waveguide, it is always required to tailor Λ and duty cycle (D). The equivalent effective index method provided an efficient approach for analysing the SWG waveguide. When the condition Λ < λB/2neff was satisfied, the SWG waveguide behaved as a conventional waveguide, allowing continuous wave propagation with a lower refractive index. Consequently, it functioned as an index-guided structure. The average refractive index contrast in the SWG waveguide depended on the ‘D’. By carefully selecting ‘D’ and ‘Λ’, the neff could be precisely engineered to optimize mode confinement and bulk sensitivity. To illustrate this, a ‘D’ of ~53% was used for calculating the neff and group index (ng), with a wavelength sweep from 1000 nm to 2000 nm, as presented in Figure 4a,b. Figure 4a illustrates the neff experienced by the guided mode. As the wavelength increased, the neff decreased due to material dispersion and reduced mode confinement. Figure 4b depicts the ng curve, highlighting the dispersion characteristics of the guided mode and its impact on the speed of wave propagation within the SWG waveguide. The steep slope of the neff and ng indicates high dispersion, which is beneficial for applications requiring reduced mode confinement. These plots were designed using the refractive index of both normal and cancerous cervical cells in the cladding regime of the SWG waveguide.
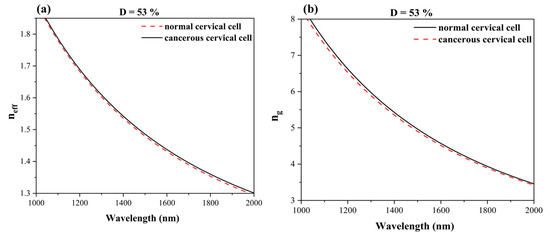
Figure 4.
Dispersion plots of SWG waveguide for 53% duty cycle (a) neff vs. wavelength and (b) ng vs. wavelength.
3. Envelope Spectrum Formation and Surface Functionalization
The regulation of dispersion characteristics linked to the critical coupling condition of the SWG MRTRR determine the tracking of the envelope spectrum. The dispersion characteristic is crucial to optimize and enhance the resonance at a coupled wavelength because of the larger extinction ratio. The intensities of the multiple resonance collectively determine the envelope spectrum. The SWG MRTRR had many structural parameters that affected the dispersion properties of the envelope spectrum such as peak wavelength and envelope slope. The plots for the round-trip amplitude transfer coefficient ‘a(λ)’ and the amplitude of self-coupling coefficient ‘t(λ)’ with respect to sweep in wavelength (1400–1800 nm) are shown in Figure 5. In this way, the bending loss, waveguide loss, and coupling loss could be calculated with the help of a(λ).
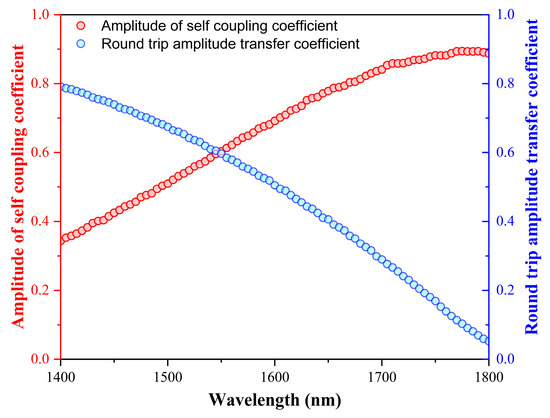
Figure 5.
The round-trip transfer coefficient and self-coupling coefficient amplitude of SWG MRTRR.
It is observed that a(λ), the red, dotted curve, is showing a decreasing slope trend due to a loss in the waveguide at 1550 nm. However, the plot for t(λ), the blue, dotted curve, shows an increasing slope trend and intersects a(λ) at 1550 nm due to a critical coupling gap between the SWG-incorporated straight waveguide and SWG-incorporated racetrack waveguide. The cosine nature of t(λ) was due to the coupled mode theory.
The plots for normal and cancerous cells of breast type-1, breast type-2, and cervical cancers with variation in the curves of a(λ) and t(λ) are shown in Figure 6. The point of intersection between a(λ) and t(λ) indicates the critical coupling condition, where resonance is achieved due to an optimal power transfer into the resonator.
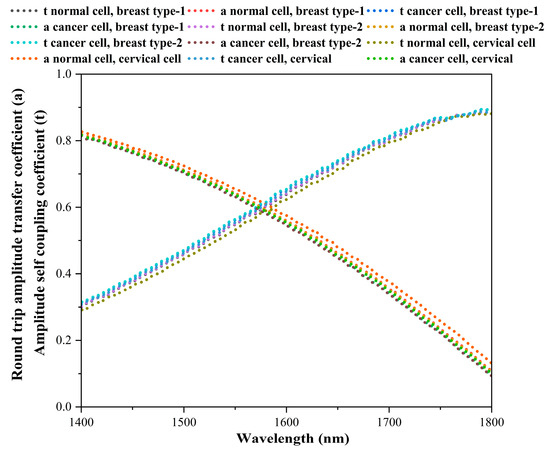
Figure 6.
Variation in a(λ) and t(λ) for normal and cancerous cells (breast type-1, breast type-2, and cervical cancers).
The use of a label-free method is preferred due to its ability to directly measure the target, eliminating the need for labelling stages, which results in reducing the labour required for sample preparation. This method enables the detection of analytes in their native state and the measurement of targets that are difficult to label [40]. In the case of fundamental label-free sensing, the sensor surface is glazed with the highly immobilized affinity structure that fixes the target (cancerous cells) at low concentrations with high specificity, as shown in Figure 7. The SWG MRTRR detected the change in the refractive index, resulting in its envelope shift [40]. The binding of the cancerous cell with the waveguide surface was carried out using a linker called organofunctional silane [41]. Consequently, two critical procedures had to be implemented: first, the sensor surface was modified by facilitating controlled surface chemistry, and, secondly, the adhesive that suits high affinity immobilization was kept on the surface while preserving its activity.
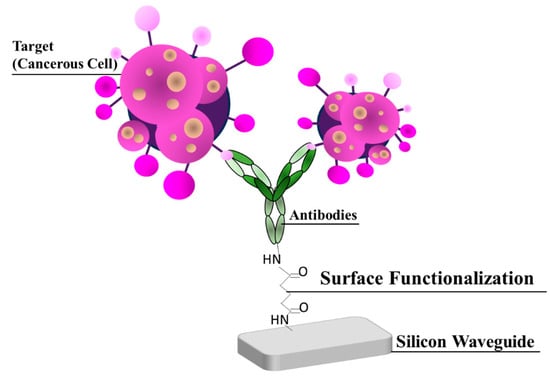
Figure 7.
Method of label-free detection with immobilized antibodies onto the Si surface attached with a linker.
In a label-free detection method, the first step is applying the surface functionalization with a waveguide for surface modification by establishing the silane, as shown in Figure 8. The bond formation of Si-O-Si between the oxidized Si surface and the malignant cells is the result of surface modification. If Si is exposed to oxygen and/or moisture, it develops a thin, native oxide layer (Figure 8b). As a result, a condensation reaction between pre-hydrolysed alkoxysilanes and an oxidized bulk Si surface occurs. To achieve a fresh or pure surface with silanol groups, the Si surface must be cleaned and activated through various methods, such as plasma cleaning [42], intense heating [41], or chemically with a concentrated acidic hydrogen peroxide solution (Piranha liquid) [43,44]. Subsequently, either ethoxy-silanes or methoxy-silanes are introduced in a pure solvent or with a minor proportion of water. The most prevalent methoxy-silanes are 3-aminopropyl-trimethoxysilanes (APTMS), which results in amino-modified surfaces, and 3-glycidyloxypropyl-trimethoxysilane (GLYMO), which produces epoxy-modified surfaces, as shown in Figure 8c. The sample is thoroughly washed and dried after an incubation period that can last from a few minutes to several hours. In order to facilitate the condensation reaction and surface functionalization, an additional curing phase may be implemented at a higher temperature.
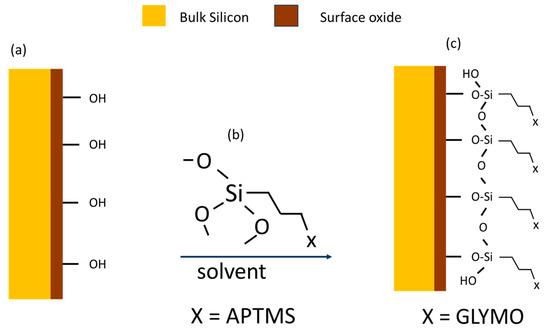
Figure 8.
(a) Surface functionalized reaction with oxidized surface of Si, (b) reaction between solvent and methoxy-silane, and (c) finalized functionalized surface.
Secondly, the immobilization of high-affinity binders requires several types of peptides [45], molecule imprinted polymers [46], and aptamers [47] for coated sensing surfaces and for the antibodies having high importance. The optimal choice for numerous biosensor applications is antibodies, which are Y-shaped proteins that are highly selective and highly sensitive to the target structure, as shown in Figure 7. Such proteins are usually covalently attached to reactive surfaces through connections that are accessible to amino groups on residues of lysine or, if present, unbound groups of sulfhydryl on cysteine residues. Several coupling pathways for immobilization can be used by using an amine group: linker molecules and Y-shaped proteins. The highly prominent amine coupling pathways and amine groups are as follows: activation of a glutaraldehyde surface for targeted protein and yielding stable amine bonds with cyanoborohydride [41], and surface modification and carboxylic acid activation with N-Hydroxysuccinimid (NHS)/1-Ethyl-3- (3-dimethylaminopropyl) carbodiimide (EDC) to achieve NHS and stable amino bonds [48].
The recipe for antibodies’ immobilization was given by Steglich et al. in 2022 [40] and is a four-step process: Firstly, the photonic chip should be gently vortexed for at least 20 s with 1 mL of 1 mole NaOH in a 2 mL tube at 1000 rpm followed by a five-minute incubation. Next, it should be vortexed in water for 20 s and incubated for another five minutes. The chip is then transferred to 1 mole HCl, vortexed for 20 s, and incubated for an additional five minutes. Finally, the chip undergoes a five-minute incubation in water followed by sequential vortexing in absolute ethanol and HPLC-grade acetone before being left to dry on a clean bench. The second step consists of a silanization process in which the solution should be prepared by mixing 10 µL of (3-glycidoxypropyl) methyl dimethoxy-silane and 10 µL of water with 980 µL of absolute ethanol. The dried chip is then immersed in this solution, gently vortexed, and incubated overnight. After incubation, the chip should be rinsed three times with approximately 1 mL of absolute ethanol and then left to dry on a clean bench. In the third step, the chip is coated with an affinity layer using 0.5 mg/mL Cys-Protein G, a commercially available reagent used for antibody quantification and purification. Following this, 100 mM phosphate-buffered saline (PBS) is prepared, and 100 µL is applied to the chip. In the final step, the antibody is immobilized by diluting it to a concentration of 1 mg/mL in PBS. Then, 100 µL of the solution is applied to the chip and incubated for one hour.
4. Result and Discussion
The performance analysis of the SWG-based MRTRR was analysed, with emphasis on the shift in the envelope transmittance spectrum for cancer cell sensing, the shift attributed to variations in the refractive indices within the cladding region. The dispersion characteristics of the critical coupling condition of the SWG MRTRR had to be regulated to construct the spectral envelope. The SWG waveguide dispersion property simplified the process of adjusting the critical coupling condition. As a result, the resonance at the wavelength that was critically coupled was readily distinguishable from the other resonances due to its elevated ER. The envelope spectrum was composed of a multiple resonance wavelength with varying depth. Additionally, the SWG MRTRR contained numerous structural parameters that could be modified to customize its dispersion characteristics including peak wavelength.
The envelope transmittance spectra of the SWG MRTRR for breast type-1, breast type-2, and cervical cancers are shown in Figure 9. The envelope spectrum exhibited the sinusoidal envelope rather than the discrete multiple resonance peak, typically observed in conventional MRRs. This behaviour arose from the superposition of multiple resonances within the structure, influenced by the periodic grating design and the critical coupling conditions of the SWG waveguide. The envelope spectrum was a result of the constructive and destructive interferences of light. The subsequent shift in the spectrum after sensing in the wavelength range of 1300 nm to 1800 nm provided the red shift in each case. The resonance wavelength (Δλres) obtained in the case of breast type-1 cancer was from 1593.2 nm to 1617.73 nm, for breast type-2 resonance shifted from 1603.8 nm to 1617.86 nm, and for cervical cancer resonance shifted from 1572 nm to 1617.2 nm. The key performance metrices to design a resonator are: FSR, which is the difference between two resonance notches; Full Width at Half Maximum (FWHM), a metric for comparison, which is equal to the 3 dB wavelength difference; Q factor, which could be calculated as λres/FWHM; ‘S’, referred to as the ratio between the change in λres to the change in the measurand refractive index (Δλres/Δn); and the iLoD, the reflection of detection capability by the change in the measurand refractive index; it can be calculated by iLoD = λres/S × Q-factor. Here, the calculation of the FSR is not required as the SWG MRTRR provided the transmittance spectrum in the form of an envelope, the elimination of FSR calculation shows the main novelty of the manuscript. The FWHMs obtained for the red, shifted transmittance were 5.8 nm, 5 nm, and 5.6 nm, respectively, for breast type-1, breast type-2, and cervical cancers. The S, Q-factor, and iLoD for cervical cancer, breast type-1 cancer, and breast type-2 cancer, are listed in Table 3.
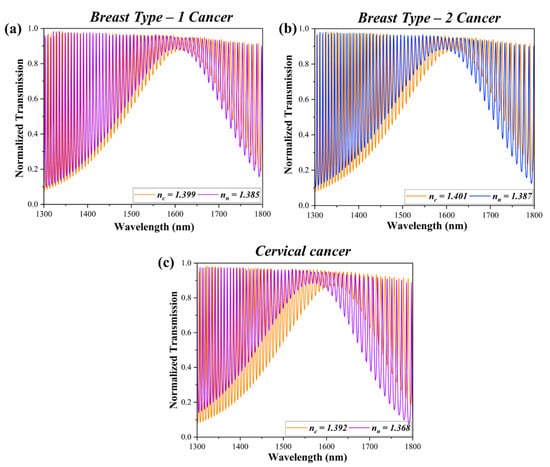
Figure 9.
Transmitted envelope spectrum for (a) breast type-1 cancer; (b) breast type-2 cancer; and (c) cervical cancer. The distinct red shift in the spectrum highlights the SWG MRTRR’s sensitivity and its capability to differentiate between cancerous cells.
Table 3.
Sensing performance parameters.
The notable finding of the SWG MRTRR are: The maximum ‘S’ is obtained for the cervical cancerous sensing followed by breast type-1 cancer and breast type-2 cancer and are 1825 nm/RIU, 1705.14 nm/RIU, and 1004.71 nm/RIU, respectively. Thereafter, the highest Q-factor and iLoD values reported by breast type-2 cancer, followed by breast type-1 and cervical cancer, are 315.76, 280.78, 269.68, 5.09 × 10⁻³, 3.37 × 10⁻³, and 3.28 × 10⁻³, respectively. Cervical cancer exhibited the largest shift in the transmitted envelope relative to both breast type-1 and breast type-2 cancers.
The comparative study of different resonators is provided in Table 4(a), which shows different transmittance spectrum type with their high ‘S’, Q-factor, detection limit, and FSR. This work distinguishes itself from previous studies by using an SWG MRTRR, which offers an enhanced ‘S’ value up to 1825 nm/RIU and an FSR-free operation, unlike the SWG MRRs used in previous studies. Table 4(b) shows different optical devices, other than resonators, which has potential in different cancers’ detection. The SWG-based MRTRR introduces several innovative advancements in the field of cancer sensing. By leveraging the unique properties of the SWG waveguides, the device achieved an ‘S’ up to 1825 nm/RIU, making it highly effective for detecting minute changes in the refractive index caused by cancerous cells. The transmittance spectrum of the SWG MRTRR formed an envelope that shifted upon sensing. The device design is optimized using FEM technique, which allow precise control over structural parameters, such as the 300 nm pitch size, to tailor dispersion characteristics and enhanced performance. The SWG MRTRR also demonstrated a high Q-factor, up to 315.76, and an iLoD as low as 3.28 × 10⁻³, ensuring the precise and reliable detection of breast type-1, breast type-2, and cervical cancers. Moreover, the dispersion characteristics of the SWG waveguide facilitated the precise adjustment of critical coupling conditions, thereby enhancing the visibility of the critically coupled resonance through an increased extinction ratio. These innovations position the SWG MRTRR as a superior tool for label-free cancer sensing, outperforming other optical devices and resonators in sensitivity and detection capabilities.
Table 4.
(a). Comparative study of resonators with sensing performance. (b). Comparative study of cancer types with sensing performance.
The approach for the fabrication and experimental setup is illustrated by Figure 10 and Figure 11. As illustrated in Figure 10, the device can be fabricated on an SOI wafer featuring a 220 nm thick Si layer and a 2 μm thick buried oxide layer. Vertical grating couplers were utilized to couple the wave between the optical fibre and the waveguide. For efficient transition between strip mode and Bloch mode, strip-to-SWG MRTRR mode converters were implemented, ensuring effective light conversion before and after transmission. During fabrication, the device structures could initially be patterned onto a resist layer using electron-beam lithography. The pattern was then transferred to the Si layer through inductively coupled plasma reactive ion etching using a gas mixture of SF6 and C4F8. The entire device, including the vertical grating couplers, can be fabricated onto a single etching step, streamlining the manufacturing process. After the removal of a residual photoresist, the device was ready to be filled with a solution for sensing applications.
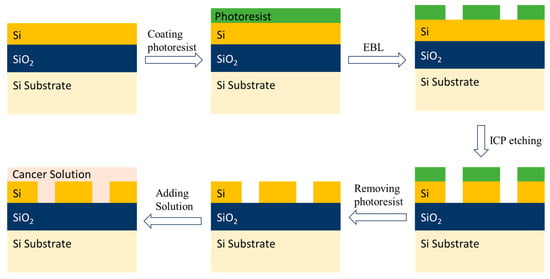
Figure 10.
Fabrication steps for SWG MRTRR using SOI platform.
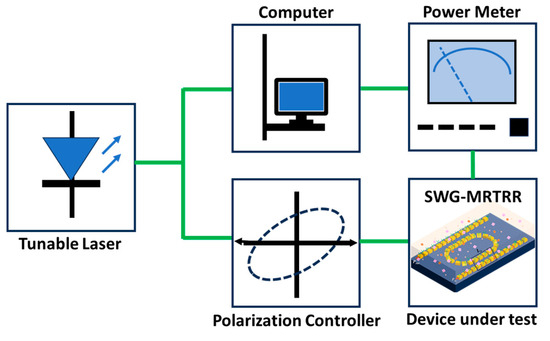
Figure 11.
Illustration of experimental setup for cancerous sensing using SWG MRTRR.
The experimental setup for cancer cell sensing using the SWG MRTRR is shown in Figure 11. A tunable laser with a low-wavelength resolution served as the light source. A polarization controller was positioned after the laser to adjust the polarization state of the incident light. The device was accessed via a single-mode fibre, which coupled the TE-mode input and output light through vertical grating couplers. To ensure precise alignment, the waveguide alignment stage was used in conjunction with a microscope, CCD, and monitor system. An optical power meter was connected to the output fibre to measure the device transmission. The software setup was made to simultaneously control both the tunable laser and power meter, enabling automated measurements. The sensing performance of the SWG MRTRR can be evaluated by monitoring spectral variations when the device is immersed with cancerous solutions.
5. Conclusions
The SOI technology-based SWG MRTRR study shows the next-generation, label-free optical biosensor. The notable finding stands in the transmittance spectrum, which forms an envelope. The outcome of the SWG MRTRR after the sensed cancerous cells provides the red shift in the envelope spectrum. The envelope spectrum is free from the FSR calculation, which means, during sensing, the complete envelope shifts upon substitution of the cladding refractive index. The SWG MRTRR is designed using an FEM technique. In this resonator, the pitch size is 300 nm, yielding an ‘S’ of 1825 nm/RIU, 1705.14 nm/RIU, and 1004.71 nm/RIU. The Q-factor and iLoD are 269.68, 280.78, 315.76, 3.28 × 10⁻³, 3.37 × 10⁻³, and 5.09 × 10⁻³, respectively, for cervical cancer, breast type-1 cancer, and breast type-2 cancer.
Author Contributions
S.V., D.S. and N.K.G. performed the investigation, simulations, data collection, data curation, and writing—original draft. R.R.S. and S.K. performed the conceptualization, methodology, validation, and review and editing. All authors have read and agreed to the published version of the manuscript.
Funding
This research received no external funding.
Institutional Review Board Statement
Not applicable.
Informed Consent Statement
Not applicable.
Data Availability Statement
The datasets generated during and/or analysed during the current study are available from the corresponding author on reasonable request.
Acknowledgments
The authors would like to acknowledge the Fund for Improvement of S&T Infrastructure (FIST) Project [SR/FST/ET-I/2024/1561] for providing support in facilitating this research. Special thanks to the Indian Science Technology and Engineering facilities Map (I-STEM) for providing software license support for COMSOL Multiphysics 6.0, used to carry out this work. This research was carried out at the Department of Electronics and Communication Engineering and Centre of Excellence in Artificial Intelligence (CoE-AI) at Netaji Subhas University of Technology, Delhi.
Conflicts of Interest
The authors declare no conflicts of interest.
References
- Shi, W.; Yun, H.; Lin, C.; Flueckiger, J.; Jaeger, N.A.F.; Chrostowski, L. Coupler-apodized Bragg-grating add–drop filter. Opt. Lett. 2013, 38, 3068. [Google Scholar] [CrossRef] [PubMed]
- Washburn, A.L.; Gunn, L.C.; Bailey, R.C. Label-Free Quantitation of a Cancer Biomarker in Complex Media Using Silicon Photonic Microring Resonators. Anal. Chem. 2009, 81, 9499–9506. [Google Scholar] [CrossRef] [PubMed]
- Reed, G.T.; Mashanovich, G.; Gardes, F.Y.; Thomson, D.J. Silicon optical modulators. Nat. Photonics 2010, 4, 518–526. [Google Scholar] [CrossRef]
- Singh, R.R.; Kumari, S.; Gautam, A.; Priye, V. Glucose Sensing Using Slot Waveguide-Based SOI Ring Resonator. IEEE J. Sel. Top. Quantum Electron. 2019, 25, 7300608. [Google Scholar] [CrossRef]
- Sajan, S.C.; Singh, A.; Sharma, P.K.; Kumar, S. Silicon Photonics Biosensors for Cancer Cells Detection—A Review. IEEE Sens. J. 2023, 23, 3366–3377. [Google Scholar] [CrossRef]
- Vardhan, S.; Gupta, N.K.; Kushwaha, A.; Verma, P.; Singh, R.R. Modelling of CO2 Gas Sensing using Spectral Envelope of SoI Integrated Racetrack Resonator. In JSAP-Optica Joint Symposia 2024 Abstracts; Optica Publishing Group: Washington, DC, USA, 2024; p. 17p_A25_4. [Google Scholar] [CrossRef]
- Vardhan, S.; Singh, R.R. Poynting Vector Analysis of SoI based Hybrid Plasmonic Rectangular Waveguide. In JSAP-Optica Joint Symposia 2022 Abstracts; Optica Publishing Group: Washington, DC, USA, 2022; p. 20p_C304_13. [Google Scholar]
- Scheler, O.; Kindt, J.T.; Qavi, A.J.; Kaplinski, L.; Glynn, B.; Barry, T.; Kurg, A.; Bailey, R.C. Label-free, multiplexed detection of bacterial tmRNA using silicon photonic microring resonators. Biosens. Bioelectron. 2012, 36, 56–61. [Google Scholar] [CrossRef]
- Shia, W.W.; Bailey, R.C. Single Domain Antibodies for the Detection of Ricin Using Silicon Photonic Microring Resonator Arrays. Anal. Chem. 2013, 85, 805–810. [Google Scholar] [CrossRef]
- Deen, M.J. Information and communications technologies for elderly ubiquitous healthcare in a smart home. Pers. Ubiquitous Comput. 2015, 19, 573–599. [Google Scholar] [CrossRef]
- Singh, R.R. Dispersion tailoring of silicon nanowire optical rectangular waveguide (SNORW). SN Appl. Sci. 2020, 2, 502. [Google Scholar] [CrossRef]
- Srivastava, D.; Vardhan, S.; Singh, R.R. SoI Based Optical 1 × 2 Wavelength Independent 3-dB Power Splitter Design Using Three Rectangular Cross-Sectional Cuboidal Waveguides. Silicon 2023, 15, 1381–1391. [Google Scholar] [CrossRef]
- Talebi Fard, S.; Grist, S.M.; Donzella, V.; Schmidt, S.A.; Flueckiger, J.; Wang, X.; Shi, W.; Millspaugh, A.; Webb, M.; Ratner, D.M.; et al. Label-Free Silicon Photonic Biosensors for Use in Clinical Diagnostics; Kubby, J., Reed, G.T., Eds.; SPIE: Bellingham, WA, USA, 2013; p. 862909. [Google Scholar]
- Densmore, A.; Vachon, M.; Xu, D.-X.; Janz, S.; Ma, R.; Li, Y.-H.; Lopinski, G.; Delâge, A.; Lapointe, J.; Luebbert, C.C.; et al. Silicon photonic wire biosensor array for multiplexed real-time and label-free molecular detection. Opt. Lett. 2009, 34, 3598. [Google Scholar] [CrossRef] [PubMed]
- Iqbal, M.; Gleeson, M.A.; Spaugh, B.; Tybor, F.; Gunn, W.G.; Hochberg, M.; Baehr-Jones, T.; Bailey, R.C.; Gunn, L.C. Label-Free Biosensor Arrays Based on Silicon Ring Resonators and High-Speed Optical Scanning Instrumentation. IEEE J. Sel. Top. Quantum Electron. 2010, 16, 654–661. [Google Scholar] [CrossRef]
- Luchansky, M.S.; Washburn, A.L.; Martin, T.A.; Iqbal, M.; Gunn, L.C.; Bailey, R.C. Characterization of the evanescent field profile and bound mass sensitivity of a label-free silicon photonic microring resonator biosensing platform. Biosens. Bioelectron. 2010, 26, 1283–1291. [Google Scholar] [CrossRef] [PubMed]
- Vardhan, S.; Singh, R.R. Design, simulation and performance comparison of SoI rectangular waveguide and SMF for methane detection. In Proceedings of the Integrated Photonics Platforms II; Baets, R.G., O’Brien, P., Vivien, L., Eds.; SPIE: Bellingham, WA, USA, 2022; p. 32. [Google Scholar]
- Fard, S.T.; Donzella, V.; Schmidt, S.A.; Flueckiger, J.; Grist, S.M.; Talebi Fard, P.; Wu, Y.; Bojko, R.J.; Kwok, E.; Jaeger, N.A.F.; et al. Performance of ultra-thin SOI-based resonators for sensing applications. Opt. Express 2014, 22, 14166. [Google Scholar] [CrossRef]
- Dwivedi, R.; Kumar, A. Refractive index sensing using silicon-on-insulator waveguide based modal interferometer. Optik 2018, 156, 961–967. [Google Scholar] [CrossRef]
- Xu, Q.; Almeida, V.R.; Panepucci, R.R.; Lipson, M. Experimental demonstration of guiding and confining light in nanometer-size low-refractive-index material. Opt. Lett. 2004, 29, 1626. [Google Scholar] [CrossRef]
- Vardhan, S.; Singh, R.R. Optimization and Comparative Analysis of Rectangular and Slot Waveguide based Symmetric Ring and Racetrack Resonators for SoI Photonic Integrated Filters. Silicon 2024, 16, 2913–2926. [Google Scholar] [CrossRef]
- Yalcin, A.; Popat, K.; Aldridge, J.; Desai, T.; Hryniewicz, J.; Chbouki, N.; Little, B.; King, O.; Van, V.; Chu, S.; et al. Optical sensing of biomolecules using microring resonators. IEEE J. Sel. Top. Quantum Electron. 2006, 12, 148–155. [Google Scholar] [CrossRef]
- Ciminelli, C.; Dell’olio, F.; Conteduca, D.; Campanella, C.; Armenise, M. High performance SOI microring resonator for biochemical sensing. Opt. Laser Technol. 2014, 59, 60–67. [Google Scholar] [CrossRef]
- Jin, L.; Li, M.; He, J.-J. Analysis of Wavelength and Intensity Interrogation Methods in Cascaded Double-Ring Sensors. J. Light. Technol. 2012, 30, 1994–2002. [Google Scholar] [CrossRef]
- Stelzle, D.; Tanaka, L.F.; Lee, K.K.; Ibrahim Khalil, A.; Baussano, I.; Shah, A.S.V.; McAllister, D.A.; Gottlieb, S.L.; Klug, S.J.; Winkler, A.S.; et al. Estimates of the global burden of cervical cancer associated with HIV. Lancet Glob. Health 2021, 9, e161–e169. [Google Scholar] [CrossRef] [PubMed]
- Monica; Mishra, R. An epidemiological study of cervical and breast screening in India: District-level analysis. BMC Womens. Health 2020, 20, 225. [Google Scholar] [CrossRef]
- Mathur, P.; Sathishkumar, K.; Chaturvedi, M.; Das, P.; Sudarshan, K.L.; Santhappan, S.; Nallasamy, V.; John, A.; Narasimhan, S.; Roselind, F.S. Cancer Statistics, 2020: Report from National Cancer Registry Programme, India. JCO Glob. Oncol. 2020, 6, 1063–1075. [Google Scholar] [CrossRef] [PubMed]
- El-Shenawee, M.; Vohra, N.; Bowman, T.; Bailey, K. Cancer detection in excised breast tumors using terahertz imaging and spectroscopy. Biomed. Spectrosc. Imaging 2019, 8, 1–9. [Google Scholar] [CrossRef] [PubMed]
- George, S.; Chaudhery, V.; Lu, M.; Takagi, M.; Amro, N.; Pokhriyal, A.; Tan, Y.; Ferreira, P.; Cunningham, B.T. Sensitive detection of protein and miRNA cancer biomarkers using silicon-based photonic crystals and a resonance coupling laser scanning platform. Lab Chip 2013, 13, 4053. [Google Scholar] [CrossRef]
- Washburn, A.L.; Shia, W.W.; Lenkeit, K.A.; Lee, S.-H.; Bailey, R.C. Multiplexed cancer biomarker detection using chip-integrated silicon photonic sensor arrays. Analyst 2016, 141, 5358–5365. [Google Scholar] [CrossRef]
- Ali, L.; Mohammed, M.U.; Khan, M.; Bin Yousuf, A.H.; Chowdhury, M.H. High-Quality Optical Ring Resonator-Based Biosensor for Cancer Detection. IEEE Sens. J. 2020, 20, 1867–1875. [Google Scholar] [CrossRef]
- Jokar, M.H.; Naraghi, A.; Seifouri, M.; Olyaee, S. Photonic crystal bio-sensor for highly sensitive label-free detection of cancer cells. Opt. Quantum Electron. 2023, 55, 660. [Google Scholar] [CrossRef]
- Han, Y.; Yan, Z.; Ng, W.K.; Xue, Y.; Wong, K.S.; Lau, K.M. Bufferless 15 µm III-V lasers grown on Si-photonics 220 nm silicon-on-insulator platforms. Optica 2020, 7, 148. [Google Scholar] [CrossRef]
- Agrawal, G.P. Fiber-Optic Communication Systems, 4th ed.; Wiley-Blackwell: Oxford, UK, 2010. [Google Scholar]
- An, L.; Liu, H.; Sun, Q.; Huang, N.; Wang, Z. Wavelength conversion in highly nonlinear silicon–organic hybrid slot waveguides. Appl. Opt. 2014, 53, 4886. [Google Scholar] [CrossRef]
- Vardhan, S.; Singh, R.R. Analytical Investigation of DNA Hybridization Sensing Using Integrated Photonic Micro-Ring Resonators. Photonics 2025, 12, 216. [Google Scholar] [CrossRef]
- Mishra, G.P.; Kumar, D.; Chaudhary, V.S.; Murmu, G. Cancer cell detection by a heart-shaped dual-core photonic crystal fiber sensor. Appl. Opt. 2020, 59, 10321. [Google Scholar] [CrossRef]
- Jabin, M.A.; Ahmed, K.; Rana, M.J.; Paul, B.K.; Islam, M.; Vigneswaran, D.; Uddin, M.S. Surface Plasmon Resonance Based Titanium Coated Biosensor for Cancer Cell Detection. IEEE Photonics J. 2019, 11, 3700110. [Google Scholar] [CrossRef]
- Xu, Y.; Fu, C.; Sun, S.; Kong, M. Wide-range refractive index sensing relied on tracking the envelope spectrum of a dispersive subwavelength grating microring resonator. Opt. Laser Technol. 2022, 154, 108304. [Google Scholar] [CrossRef]
- Steglich, P.; Rabus, D.G.; Sada, C.; Paul, M.; Weller, M.G.; Mai, C.; Mai, A. Silicon Photonic Micro-Ring Resonators for Chemical and Biological Sensing: A Tutorial. IEEE Sens. J. 2022, 22, 10089–10105. [Google Scholar] [CrossRef]
- Gaur, G.; Hu, S.; Mernaugh, R.L.; Kravchenko, I.I.; Retterer, S.T.; Weiss, S.M. Label-free detection of Herceptin® using suspended silicon microring resonators. Sens. Actuators B Chem. 2018, 275, 394–401. [Google Scholar] [CrossRef]
- Guarisco, M.; Gandolfi, D.; Guider, R.; Vanzetti, L.; Bartali, R.; Ghulinyan, M.; Cretich, M.; Chiari, M.; Bettotti, P.; Pavesi, L.; et al. A new aptamer immobilization strategy for protein recognition. Sens. Actuators B Chem. 2017, 252, 222–231. [Google Scholar] [CrossRef]
- Wong, A.K.Y.; Krull, U.J. Surface characterization of 3-glycidoxypropyltrimethoxysilane films on silicon-based substrates. Anal. Bioanal. Chem. 2005, 383, 187–200. [Google Scholar] [CrossRef]
- Antoniou, M.; Tsounidi, D.; Petrou, P.S.; Beltsios, K.G.; Kakabakos, S.E. Functionalization of silicon dioxide and silicon nitride surfaces with aminosilanes for optical biosensing applications. Med. Devices Sens. 2020, 3, e10072. [Google Scholar] [CrossRef]
- Komikawa, T.; Tanaka, M.; Yanai, K.; Johnson, B.R.G.; Critchley, K.; Onodera, T.; Evans, S.D.; Toko, K.; Okochi, M. A bioinspired peptide matrix for the detection of 2,4,6-trinitrotoluene (TNT). Biosens. Bioelectron. 2020, 153, 112030. [Google Scholar] [CrossRef]
- Gajos, K.; Szafraniec, K.; Petrou, P.; Budkowski, A. Surface density dependent orientation and immunological recognition of antibody on silicon: TOF-SIMS and surface analysis of two covalent immobilization methods. Appl. Surf. Sci. 2020, 518, 146269. [Google Scholar] [CrossRef]
- Park, M.K.; Kee, J.S.; Quah, J.Y.; Netto, V.; Song, J.; Fang, Q.; La Fosse, E.M.; Lo, G.-Q. Label-free aptamer sensor based on silicon microring resonators. Sens. Actuators B Chem. 2013, 176, 552–559. [Google Scholar] [CrossRef]
- Bañuls, M.-J.; Puchades, R.; Maquieira, Á. Chemical surface modifications for the development of silicon-based label-free integrated optical (IO) biosensors: A review. Anal. Chim. Acta 2013, 777, 1–16. [Google Scholar] [CrossRef] [PubMed]
- Ahmed, R.; Rifat, A.A.; Yetisen, A.K.; Salem, M.S.; Yun, S.-H.; Butt, H. Optical microring resonator based corrosion sensing. RSC Adv. 2016, 6, 56127–56133. [Google Scholar] [CrossRef]
- Azuelos, P.; Girault, P.; Lorrain, N.; Dumeige, Y.; Bodiou, L.; Poffo, L.; Guendouz, M.; Thual, M.; Charrier, J. Optimization of porous silicon waveguide design for micro-ring resonator sensing applications. J. Opt. 2018, 20, 085301. [Google Scholar] [CrossRef]
- Tu, Z.; Gao, D.; Zhang, M.; Zhang, D. High-sensitivity complex refractive index sensing based on Fano resonance in the subwavelength grating waveguide micro-ring resonator. Opt. Express 2017, 25, 20911. [Google Scholar] [CrossRef]
- Shi, B.; Chen, X.; Cai, Y.; Zhang, S.; Wang, T.; Wang, Y. Compact Slot Microring Resonator for Sensitive and Label-Free Optical Sensing. Sensors 2022, 22, 6467. [Google Scholar] [CrossRef]
- Flueckiger, J.; Schmidt, S.; Donzella, V.; Sherwali, A.; Ratner, D.M.; Chrostowski, L.; Cheung, K.C. Sub-wavelength grating for enhanced ring resonator biosensor. Opt. Express 2016, 24, 15672. [Google Scholar] [CrossRef]
- Butt, M.A.; Khonina, S.N.; Kazanskiy, N.L. A highly sensitive design of subwavelength grating double-slot waveguide microring resonator. Laser Phys. Lett. 2020, 17, 076201. [Google Scholar] [CrossRef]
- Sun, S.; Xiong, X.; Liang, J.; Xu, Y.; Shen, L. Envelope Spectrum of the Subwavelength Grating Slot Waveguide Microring Resonator for High-sensitivity and Wide-range Refractive Index Sensing Applications. J. Light. Technol. 2024, 42, 5390–5398. [Google Scholar] [CrossRef]
- Sun, S.; Chang, M.; Kong, M.; Xu, Y. Two-peak envelope spectrum of a subwavelength grating microring resonator for wide-range and high-sensitivity refractive index sensing. Photonics Nanostructures Fundam. Appl. 2024, 60, 101273. [Google Scholar] [CrossRef]
- Chowdhury, A.A.; Khan, M.R.H.; Islam, M.R.; Iftekher, A.N.M.; Hosen, M.S.; Mim, M.H.; Nishat, M.M. Gold nanowire-infused square-clad SPR-PCF biosensor for detection of various cancer cells. Sens. Bio-Sens. Res. 2024, 45, 100670. [Google Scholar] [CrossRef]
- Khani, S.; Hayati, M. Optical biosensors using plasmonic and photonic crystal band-gap structures for the detection of basal cell cancer. Sci. Rep. 2022, 12, 5246. [Google Scholar] [CrossRef]
- Kaur, B.; Kumar, S.; Kaushik, B.K. MXenes-Based Fiber-Optic SPR Sensor for Colorectal Cancer Diagnosis. IEEE Sens. J. 2022, 22, 6661–6668. [Google Scholar] [CrossRef]
Disclaimer/Publisher’s Note: The statements, opinions and data contained in all publications are solely those of the individual author(s) and contributor(s) and not of MDPI and/or the editor(s). MDPI and/or the editor(s) disclaim responsibility for any injury to people or property resulting from any ideas, methods, instructions or products referred to in the content. |
© 2025 by the authors. Licensee MDPI, Basel, Switzerland. This article is an open access article distributed under the terms and conditions of the Creative Commons Attribution (CC BY) license (https://creativecommons.org/licenses/by/4.0/).