Digitalized Polarization Fading Suppression and Phase Demodulation Scheme of Phase-Sensitive Optical Time-Domain Reflectometry Based on Polarization Diversity Virtual Coherence


Abstract
1. Introduction
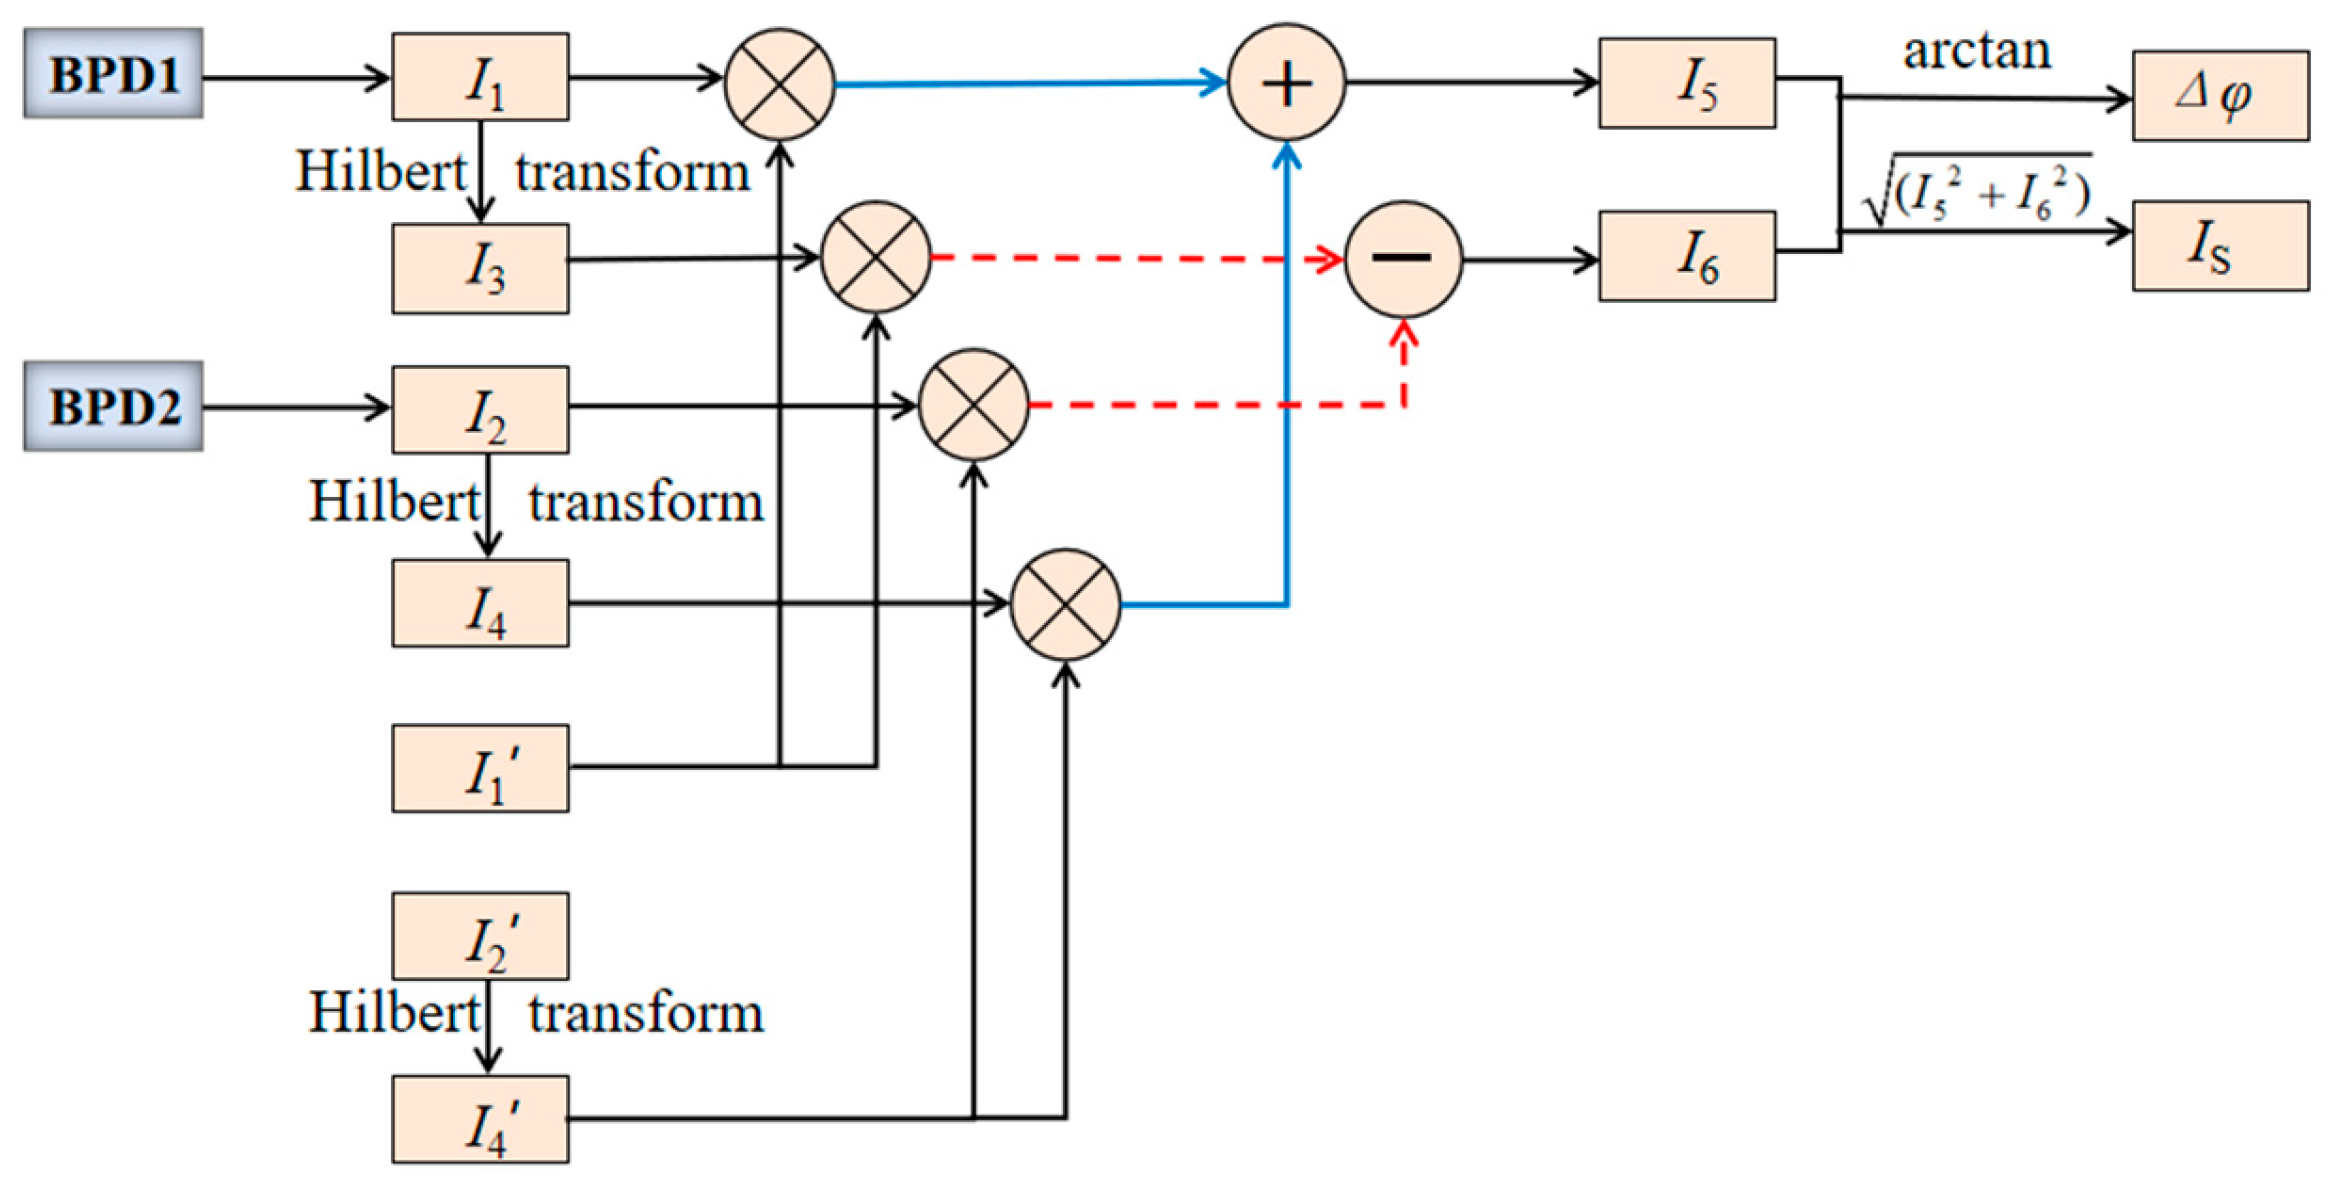
2. Demodulation Principles and Analysis
3. Experiments and Results
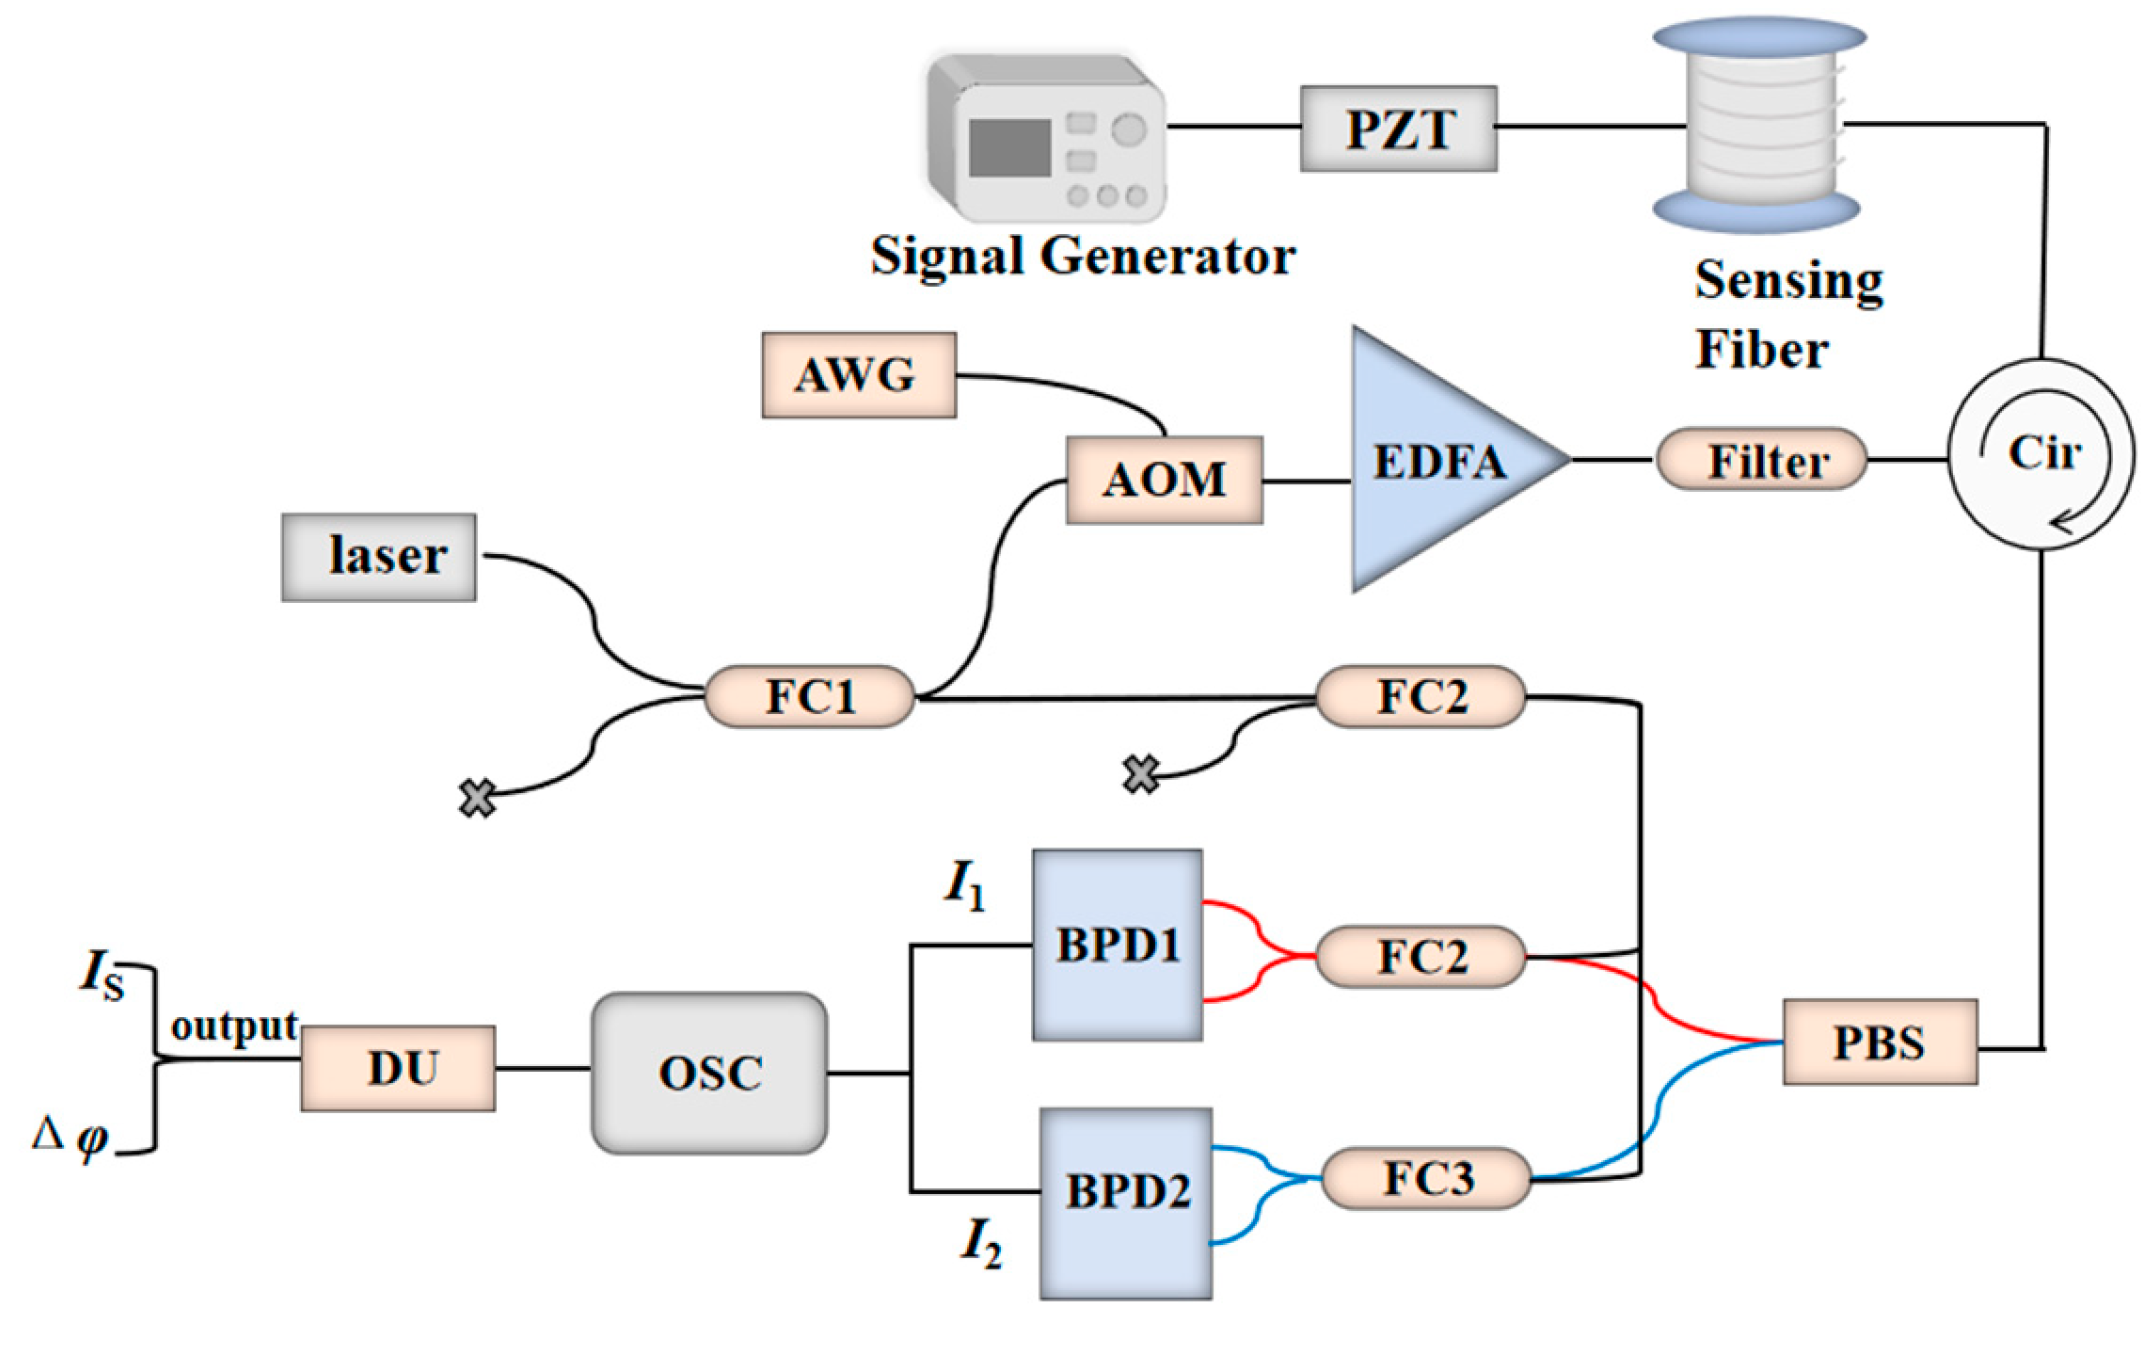
3.1. Experimental Setup
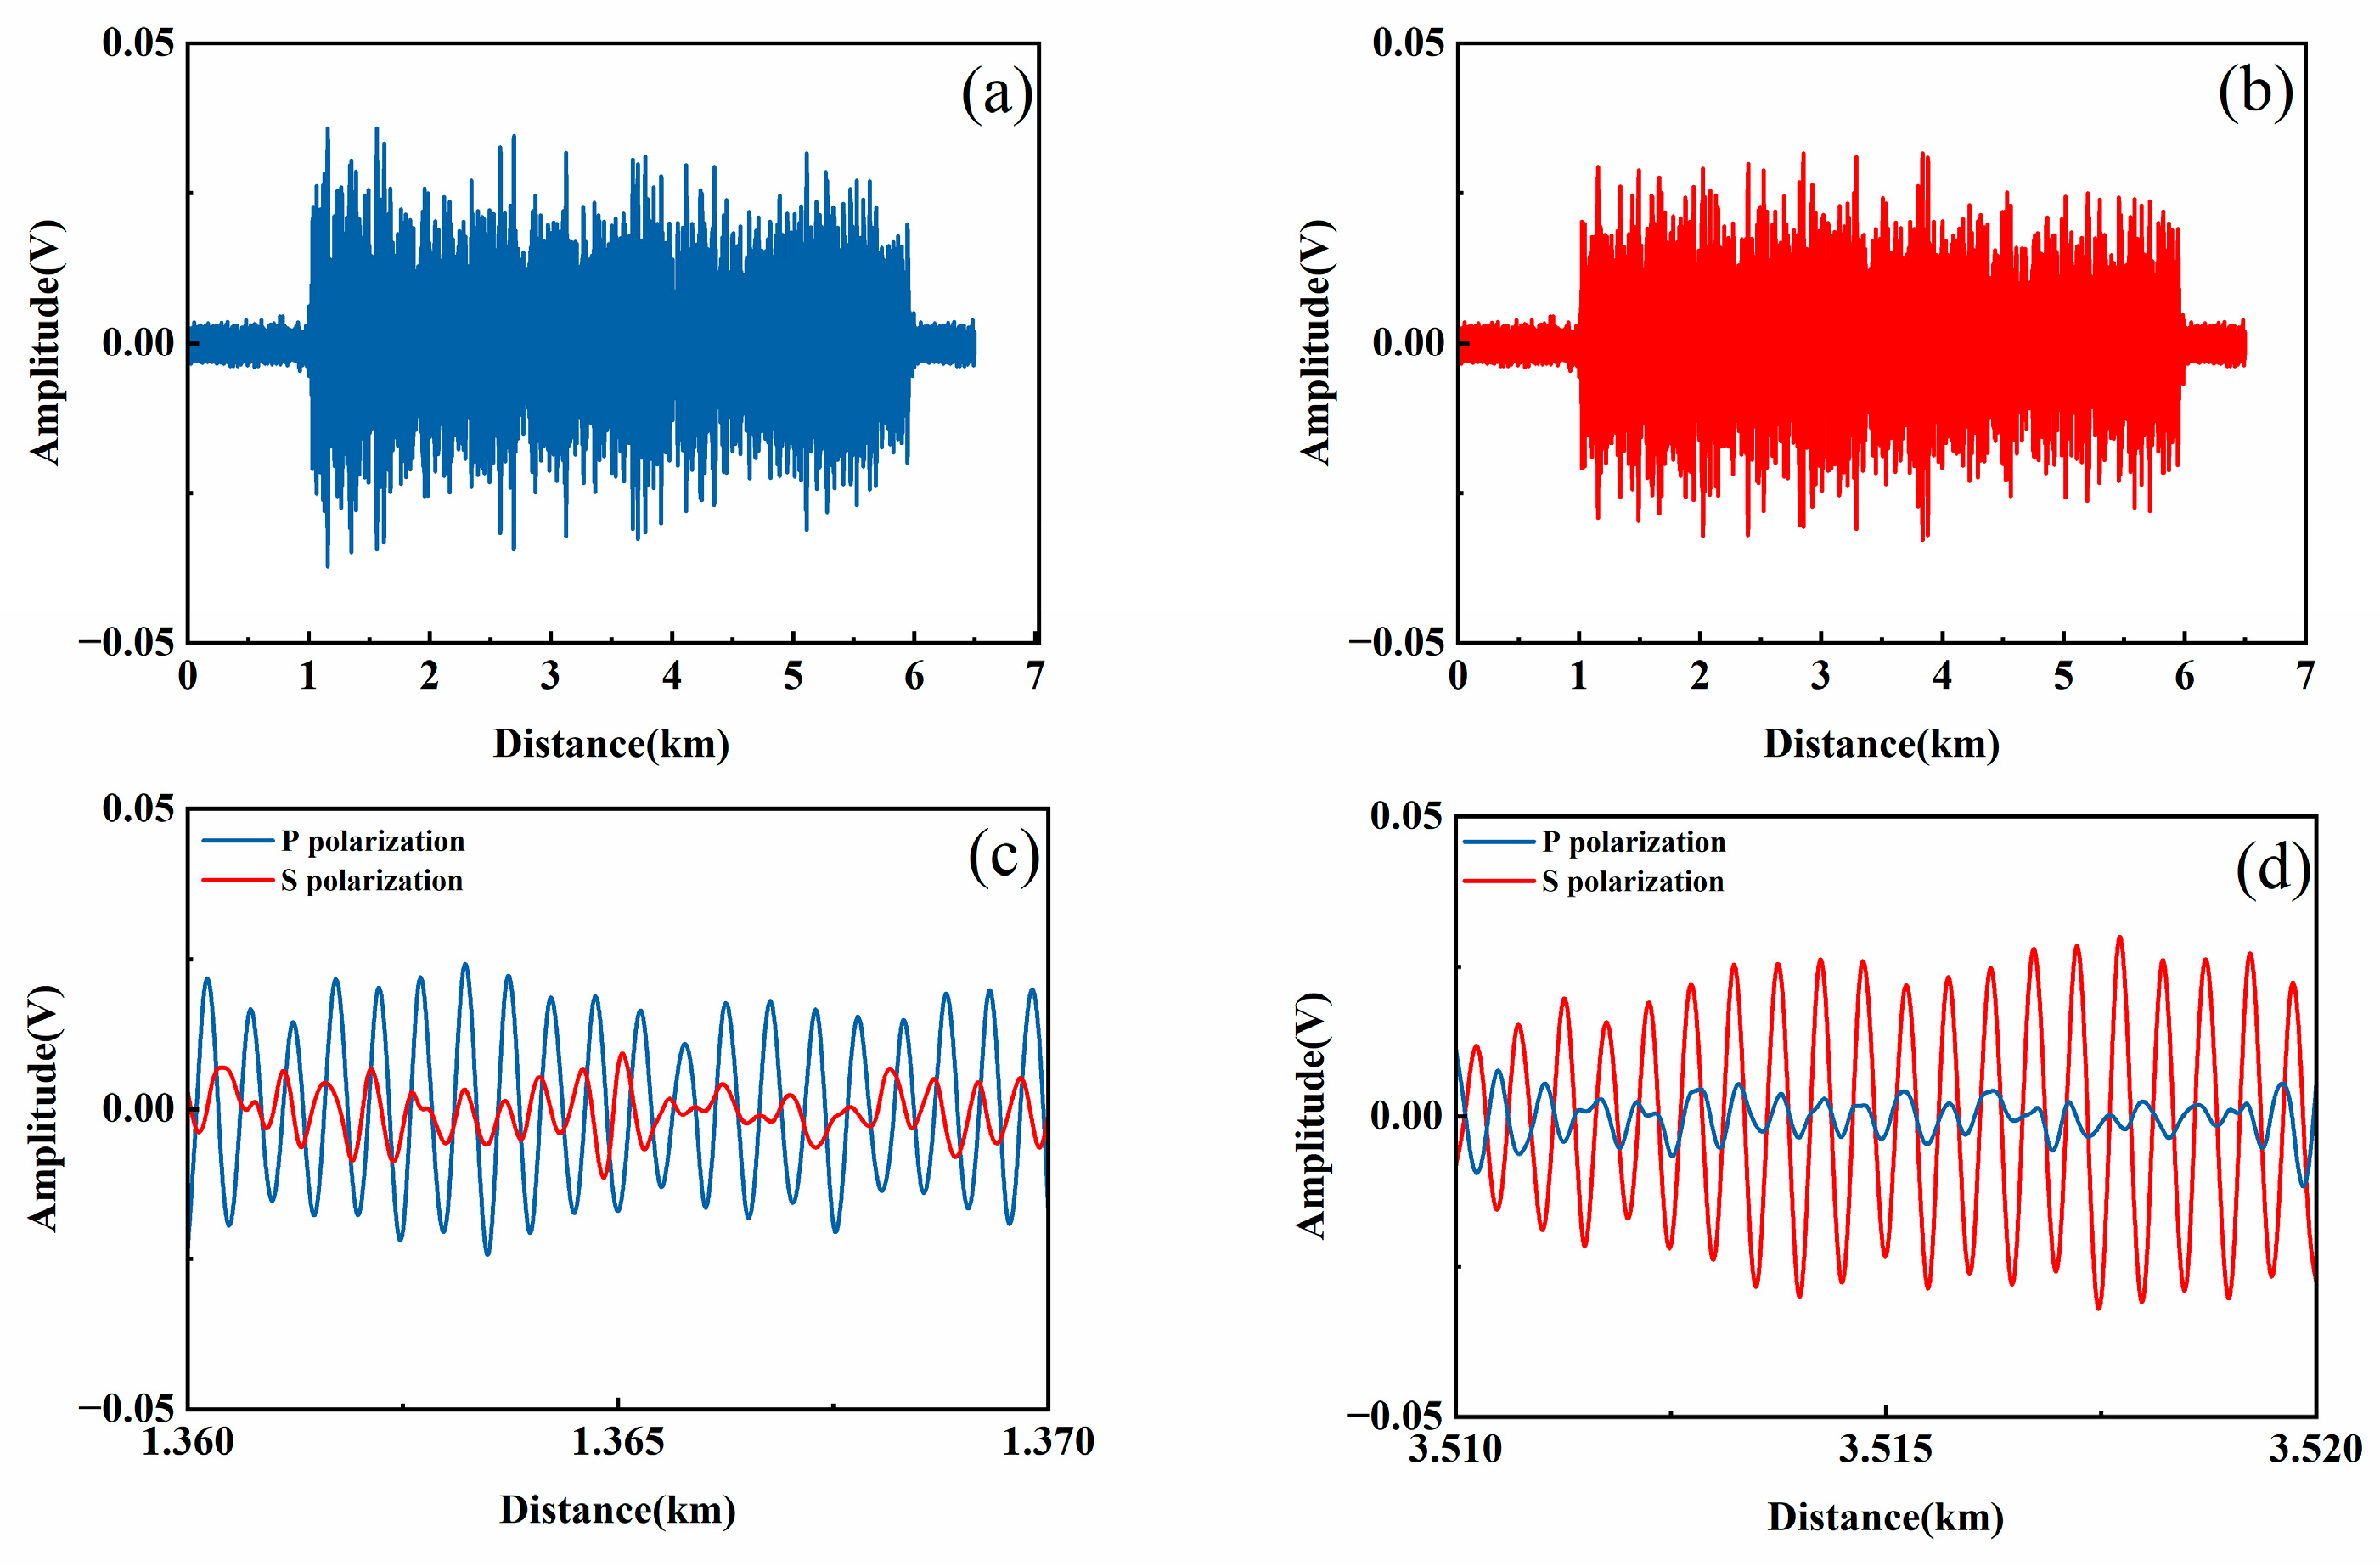
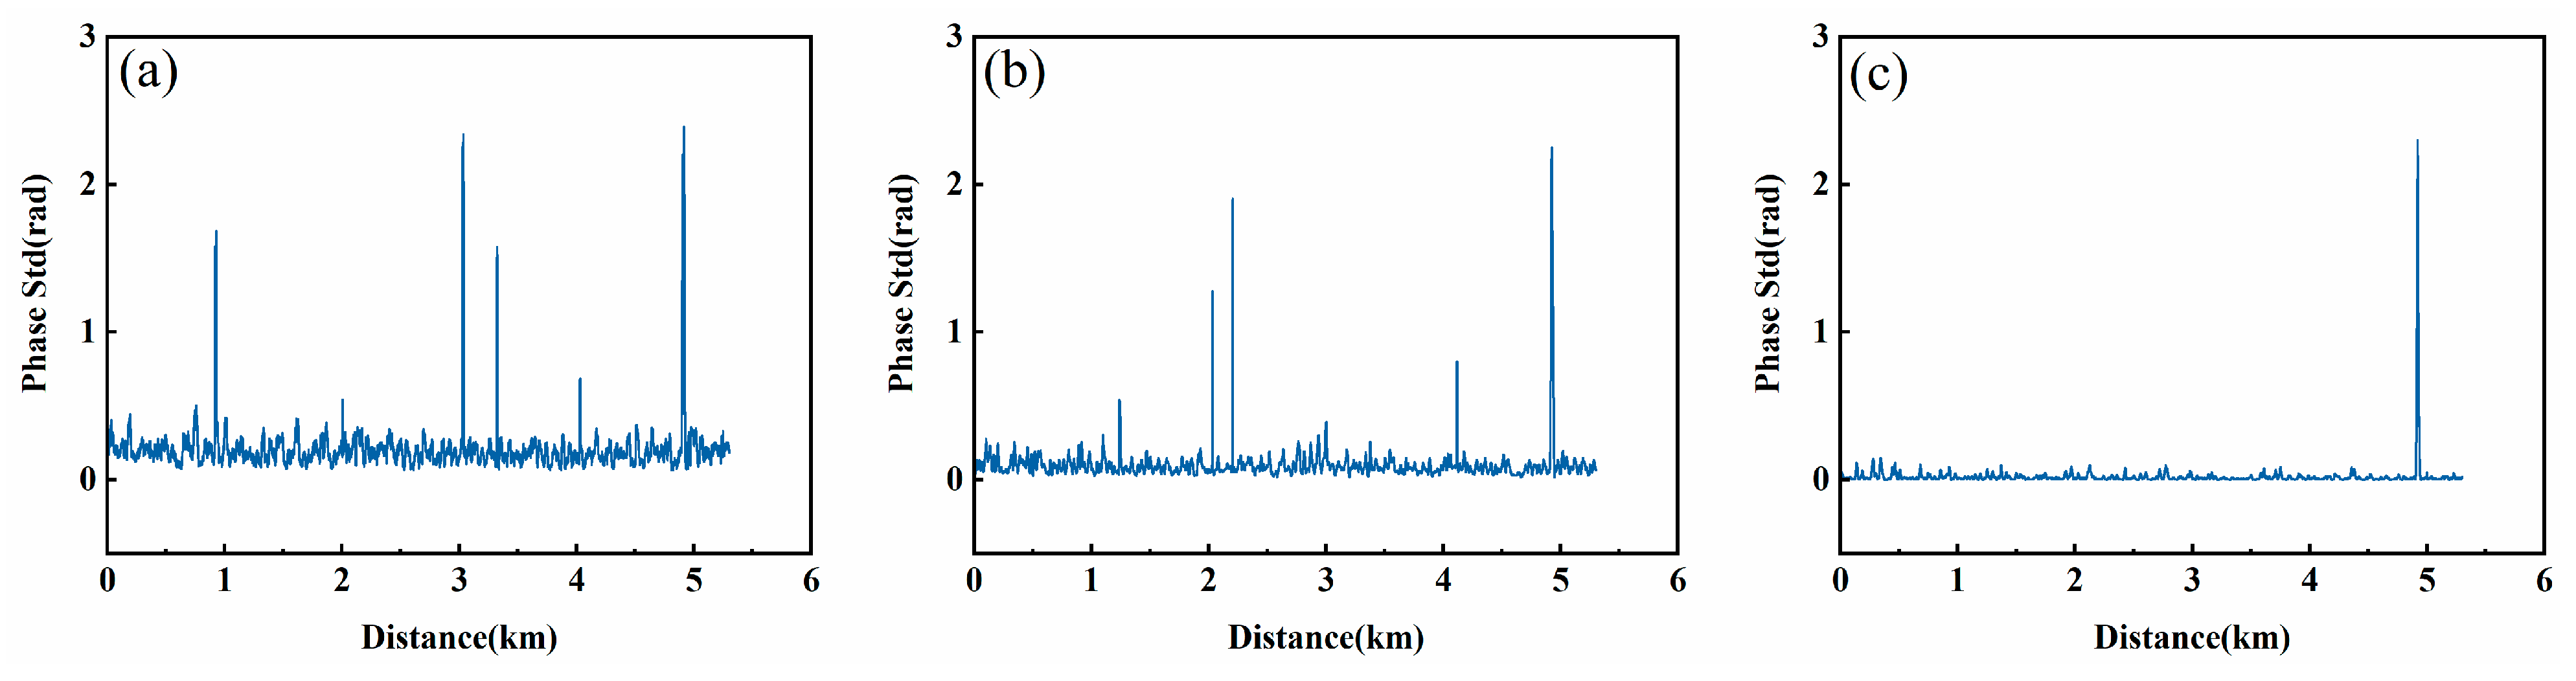
3.2. Results and Analysis
4. Conclusions
Author Contributions
Funding
Data Availability Statement
Acknowledgments
Conflicts of Interest
References
- Xie, Z.; Sun, Y.; Lv, A.; Xu, Q. Measurement and Evaluation Method of Distributed Optical Fiber Acoustic Sensing Performance. Photonics 2024, 11, 166. [Google Scholar] [CrossRef]
- Yang, N.; Zhao, Y.; Chen, J.; Wang, F. Real-time classification for Φ-OTDR vibration events in the case of small sample size datasets. Opt. Fiber Technol. 2023, 76, 103217. [Google Scholar] [CrossRef]
- Almudévar, A.; Sevillano, P.; Vicente, L.; Preciado-Garbayo, J.; Ortega, A. Unsupervised Anomaly Detection Applied to Φ-OTDR. Sensors 2022, 22, 6515. [Google Scholar] [CrossRef] [PubMed]
- Shang, Q.; Huang, D. Identification Method of Optical Fiber Perimeter Intrusion Signal Based on MATCN. Acta. Opt. Sin. 2023, 43, 2006006. [Google Scholar]
- Wang, F.; Xing, J.C. Novel Intelligent Long-Distance Optical Fiber Pre-Warning Algorithm. Acta. Opt. Sin. 2021, 41, 0706002. [Google Scholar] [CrossRef]
- Liu, X.; Wu, H.; Wang, Y.; Tu, Y.; Sun, Y.; Liu, L.; Song, Y.; Wu, Y.; Yan, G. A Fast Accurate Attention-Enhanced ResNet Model for Fiber-Optic Distributed Acoustic Sensor (DAS) Signal Recognition in Complicated Urban Environments. Photonics 2022, 9, 677. [Google Scholar] [CrossRef]
- Wang, P.; Dong, Q.; Liu, X.; Wang, Y.; Wang, D.; Jin, B. Coalbed Methane Transport Pipeline Intrusion Detection System Based on Φ-OTDR. Chin. J. Sens. Actuators 2019, 32, 144–149. [Google Scholar]
- Zhang, J.; Lian, Z.; Zhou, Z.; Zhang, J.; Xiong, M.; Liu, J. Numerical and experimental study on leakage detection for buried gas pipelines based on distributed optical fiber acoustic wave. Mea. Sci. Technol. 2021, 32, 125209. [Google Scholar] [CrossRef]
- Zhang, S.; Xiong, Z.; Ji, B.; Li, N.; Yu, Z.; Wu, S.; He, S. Water Pipeline Leakage Detection Based on Coherent φ-OTDR and Deep Learning Technology. Appl. Sci. 2024, 14, 3814. [Google Scholar] [CrossRef]
- Hooper, J.Z.; Kalkowski, M.; Muggleton, J.M. Improving Acoustic Methods of Pipeline Leak Location with Distributed Sensing. J. Phys. Conf. Ser. 2024, 2647, 192010. [Google Scholar] [CrossRef]
- Rashid, A.; Tackie-Otoo, B.N.; Abdul Latiff, A.H.; Otchere, D.A.; Jamaludin, S.N.F.; Asfha, D.T. Research Advances on Distributed Acoustic Sensing Technology for Seismology. Photonics 2025, 12, 196. [Google Scholar] [CrossRef]
- Daley, T.M.; Freifeld, B.M.; Ajo-Franklin, J.; Dou, S.; Pevzner, R.; Shulakova, V.; Kashikar, S.; Miller, D.E.; Goetz, J.; Henninges, J.; et al. Field testing of fiber-optic distributed acoustic sensing (DAS) for subsurface seismic monitoring. Bachelor Math. Sci. 2013, 32, 699–706. [Google Scholar] [CrossRef]
- Lellouch, A.; Biondi, B.L. Seismic Applications of Downhole DAS. Sensors 2021, 21, 2897. [Google Scholar] [CrossRef] [PubMed]
- Matsumoto, H.; Araki, E.; Kimura, T.; Fujie, G.; Shiraishi, K.; Tonegawa, T.; Obana, K.; Arai, R.; Kaiho, Y.; Nakamura, Y.; et al. Detection of hydroacoustic signals on a fiber-optic submarine cable. Sci. Rep. 2021, 11, 2797. [Google Scholar] [CrossRef]
- Zhan, Z.; Cantono, M.; Kamalov, V.; Mecozzi, A.; Muller, R.; Yin, S.; Castellanos, J.C. Optical polarization-based seismic and water wave sensing on transoceanic cables. Science 2021, 371, 931–936. [Google Scholar] [CrossRef]
- Chen, S.; Han, J.; Sui, Q.; Zhu, K.; Lu, C.; Li, Z. Advanced Signal Processing in Distributed Acoustic Sensors Based on Submarine Cables for Seismology Applications. Sensors 2023, 41, 4164–4175. [Google Scholar] [CrossRef]
- Cheng, F.; Chi, B.X.; Lindsey, N.J.; Dawe, T.C.; Ajo-Franklin, J.B. Utilizing distributed acoustic sensing and ocean bottom fiber optic cables for submarine structural characterization. Sci. Rep. 2021, 11, 5613. [Google Scholar] [CrossRef]
- Ölçer, İ.; Öncü, A. Adaptive temporal matched filtering for noise suppression in fiber optic distributed acoustic sensing. Sensors 2017, 17, 1288. [Google Scholar] [CrossRef]
- Qin, Z.; Zhu, T.; Chen, L.; Bao, X. High Sensitivity Distributed Vibration Sensor Based on Polarization-Maintaining Configurations of Phase-OTDR. IEEE Photonics Technol. Lett. 2011, 23, 1091–1093. [Google Scholar] [CrossRef]
- Dorize, C.; Awwad, E. Enhancing the performance of coherent OTDR systems with polarization diversity complementary codes. Opt. Express 2018, 26, 12878–12890. [Google Scholar] [CrossRef]
- Wang, Y.; Xiao, L.; Li, Y.; Liang, B.; Liu, X.; Bai, Q.; Zhang, H.; Gao, Y.; Jin, B. Polarization-fading suppression of Φ-OTDR with Rayleigh gray-scale pattern aggregation method. Appl. Opt. 2021, 60, 10429–10436. [Google Scholar] [CrossRef] [PubMed]
- Jiang, Y.; Gao, X.; He, W.; Shen, Y. Frequency multiplexed dual-pulse fiber-optic Φ-OTDR for a fading-free distributed fiber sound sensor. Appl. Opt. 2024, 63, 59–66. [Google Scholar] [CrossRef]
- Jiang, P.; Ma, L.; Hu, Z.; Hu, Y. Low-Crosstalk and Polarization-Independent Inline Interferometric Fiber Sensor Array Based on Fiber Bragg Gratings. J. Light. Technol. 2016, 34, 4232–4239. [Google Scholar] [CrossRef]
- Wang, F.; Liu, Y.; Wei, T.; Zhang, Y.; Ji, W.; Zong, M.; Zhang, X. Polarization fading elimination for ultra-weak FBG array-based Φ-OTDR using a composite double probe pulse approach. Opt. Express. 2019, 27, 20468–20478. [Google Scholar] [CrossRef]
- Yan, K.; Yang, T.; Wang, L.; Ren, Z.; Shi, S.; Zhao, Y.; Zhang, Y.; Chen, X. A Large Dynamic Range and Polarization Independent Coherent OTDR Scheme. State Key Lab of Information Photonics and Optical Communications. In Proceedings of the Asia Communications and Photonics Conference, Guangzhou, China, 10–13 November 2017. [Google Scholar]
- Cao, C.; Wang, F.; Pan, Y.; Zhang, X.; Chen, X.; Chen, Q.; Lu, J. Suppression of Signal Fading With Multi-Wavelength Laser in Polarization OTDR. IEEE Photonics Technol. Lett. 2017, 29, 1824–1827. [Google Scholar] [CrossRef]
- Zhong, Z.; Zou, N.; Zhang, X.; Li, M. Noise Suppression of Phase Signal in Phase Optical Time Domain Reflectometer. Chin. J. Lasers 2024, 51, 0506005. [Google Scholar]
- Frigo, N.; Dandridge, A.; Tveten, A. Technique for Elimanation of Polarization Fading Fiber Interferometers. Electron. Lett. 1984, 20, 319–320. [Google Scholar] [CrossRef]
- Gu, F.; Li, Y.; Song, Y.; Chen, J.; Zhang, J.; Zhang, M. Performance comparison of combining algorithms for polarization-diversity receiving in phase-sensitive OTDR. Opt. Commun. 2019, 435, 140–144. [Google Scholar] [CrossRef]
- Masoudi, A.; Belal, M.; Newson, T.P. A distributed optical fibre dynamic strain sensor based on phase-OTDR. Mea. Sci. Technol. 2013, 24, 085204. [Google Scholar] [CrossRef]
- Roy, I.G. Hilbert Transform: A Brief Overview. Resonance 2024, 29, 671–689. [Google Scholar] [CrossRef]
- Xiao, W.; Cheng, J.; Zhang, D.; Kong, Y.; Ye, H.; He, J. High stability PGC demodulation technique for fiber-optic interferometric sensor. Opto-Electron. Eng. 2022, 49, 210368. [Google Scholar]
- Yang, Y.; Sun, A.; Fan, T.; Li, Q. Digitalized phase demodulation scheme of φ-OTDR based on cross-coherence between Rayleigh back-scattering beat signals. Opt. Fiber Technol. 2022, 71, 102896. [Google Scholar] [CrossRef]
- Liu, Y.; Li, H.; Liu, T.; Fan, C.; Yan, Z.; Liu, D.; Sun, Q. Polarization dependent noise suppression for fiber distributed acoustic sensor with birefringence estimation. In Proceedings of the Conference on Lasers and Electro-Optics, San Jose, CA, USA, 10–15 May 2020. [Google Scholar]
- Zhang, X.; Sun, Z.; Shan, Y.; Li, Y.; Wang, F.; Zeng, J.; Zhang, Y. A high performance distributed optical fiber sensor based on Φ-OTDR for dynamic strain measurement. IEEE Photonics J. 2017, 9, 6802412. [Google Scholar] [CrossRef]
- He, H.; Yan, L.; Qian, H.; Zhang, X.; Luo, B.; Pan, W. Enhanced range of the dynamic strain measurement in phase-sensitive OTDR with tunable sensitivity. Opt. Express. 2020, 28, 226–237. [Google Scholar] [CrossRef]
- Wang, W.; Wang, J.; Wang, R.; Chen, Z.; Han, F.; Lu, K.; Wang, C.; Xu, Z.; Ju, B. Modeling and compensation of dynamic hysteresis with force-voltage coupling for piezoelectric actuators. Micromachines 2021, 12, 1366. [Google Scholar] [CrossRef]
- Wang, G.; Zhao, Z.; Tan, J.; Cui, S.; Wu, H. A novel multifunctional piezoelectric composite device for mechatronics systems by using one single PZT ring. Smart Mater. Struct. 2020, 29, 055027. [Google Scholar] [CrossRef]
- Fan, T.; Li, Q.; Shao, L.; Wu, Z.; Sun, A. Digital phase shift based simulated coherence phase demodulation technology for Φ-OTDR. Opt. Commun. 2023, 546, 129746. [Google Scholar] [CrossRef]


| Scheme | Fading Ratio | Localization SNR | Sensing Distance | Demodulation SNR | Spatial Resolution |
|---|---|---|---|---|---|
| Rayleigh Gray-Scale Pattern [21] | 2.10% | 15.83 dB | 6.2 km | — | 20 m |
| Frequency Multiplexed [22] | 0.32% | — | 700 m | — | |
| MRC Algorithm [29] | — | 18.19 dB | 10 km | 29.76 | 2.5 m |
| Polarization-Maintaining Configurations [19] | — | — | 400 m | — | 1 m |
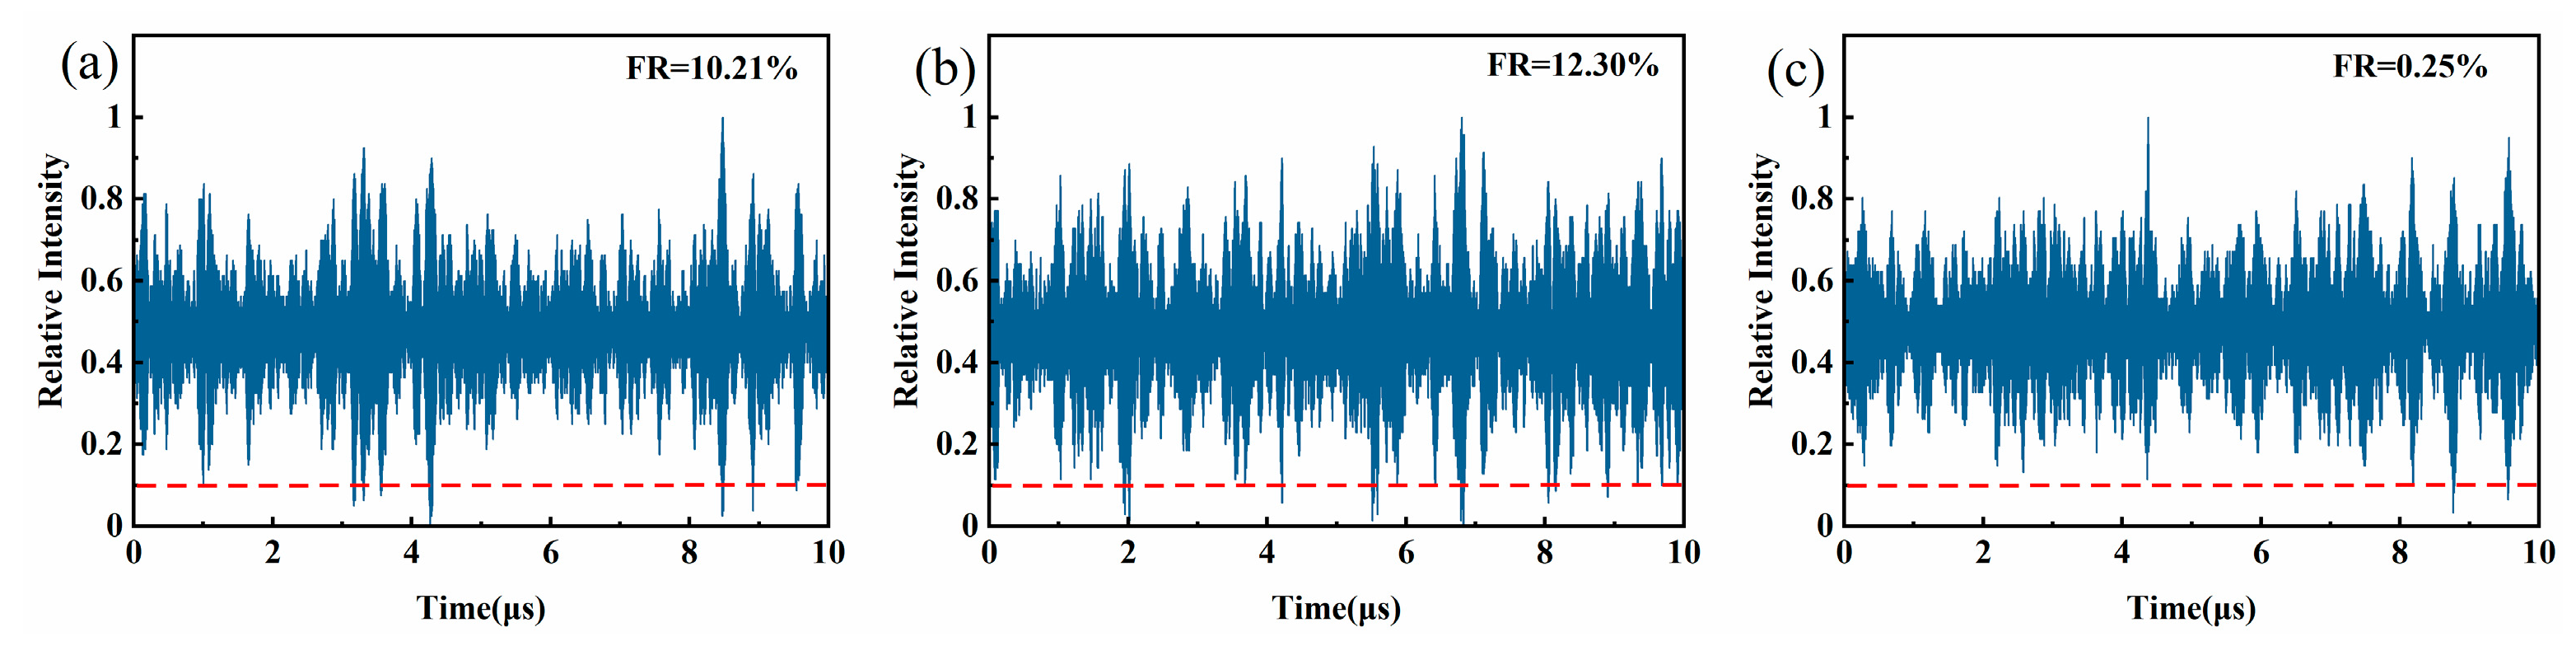
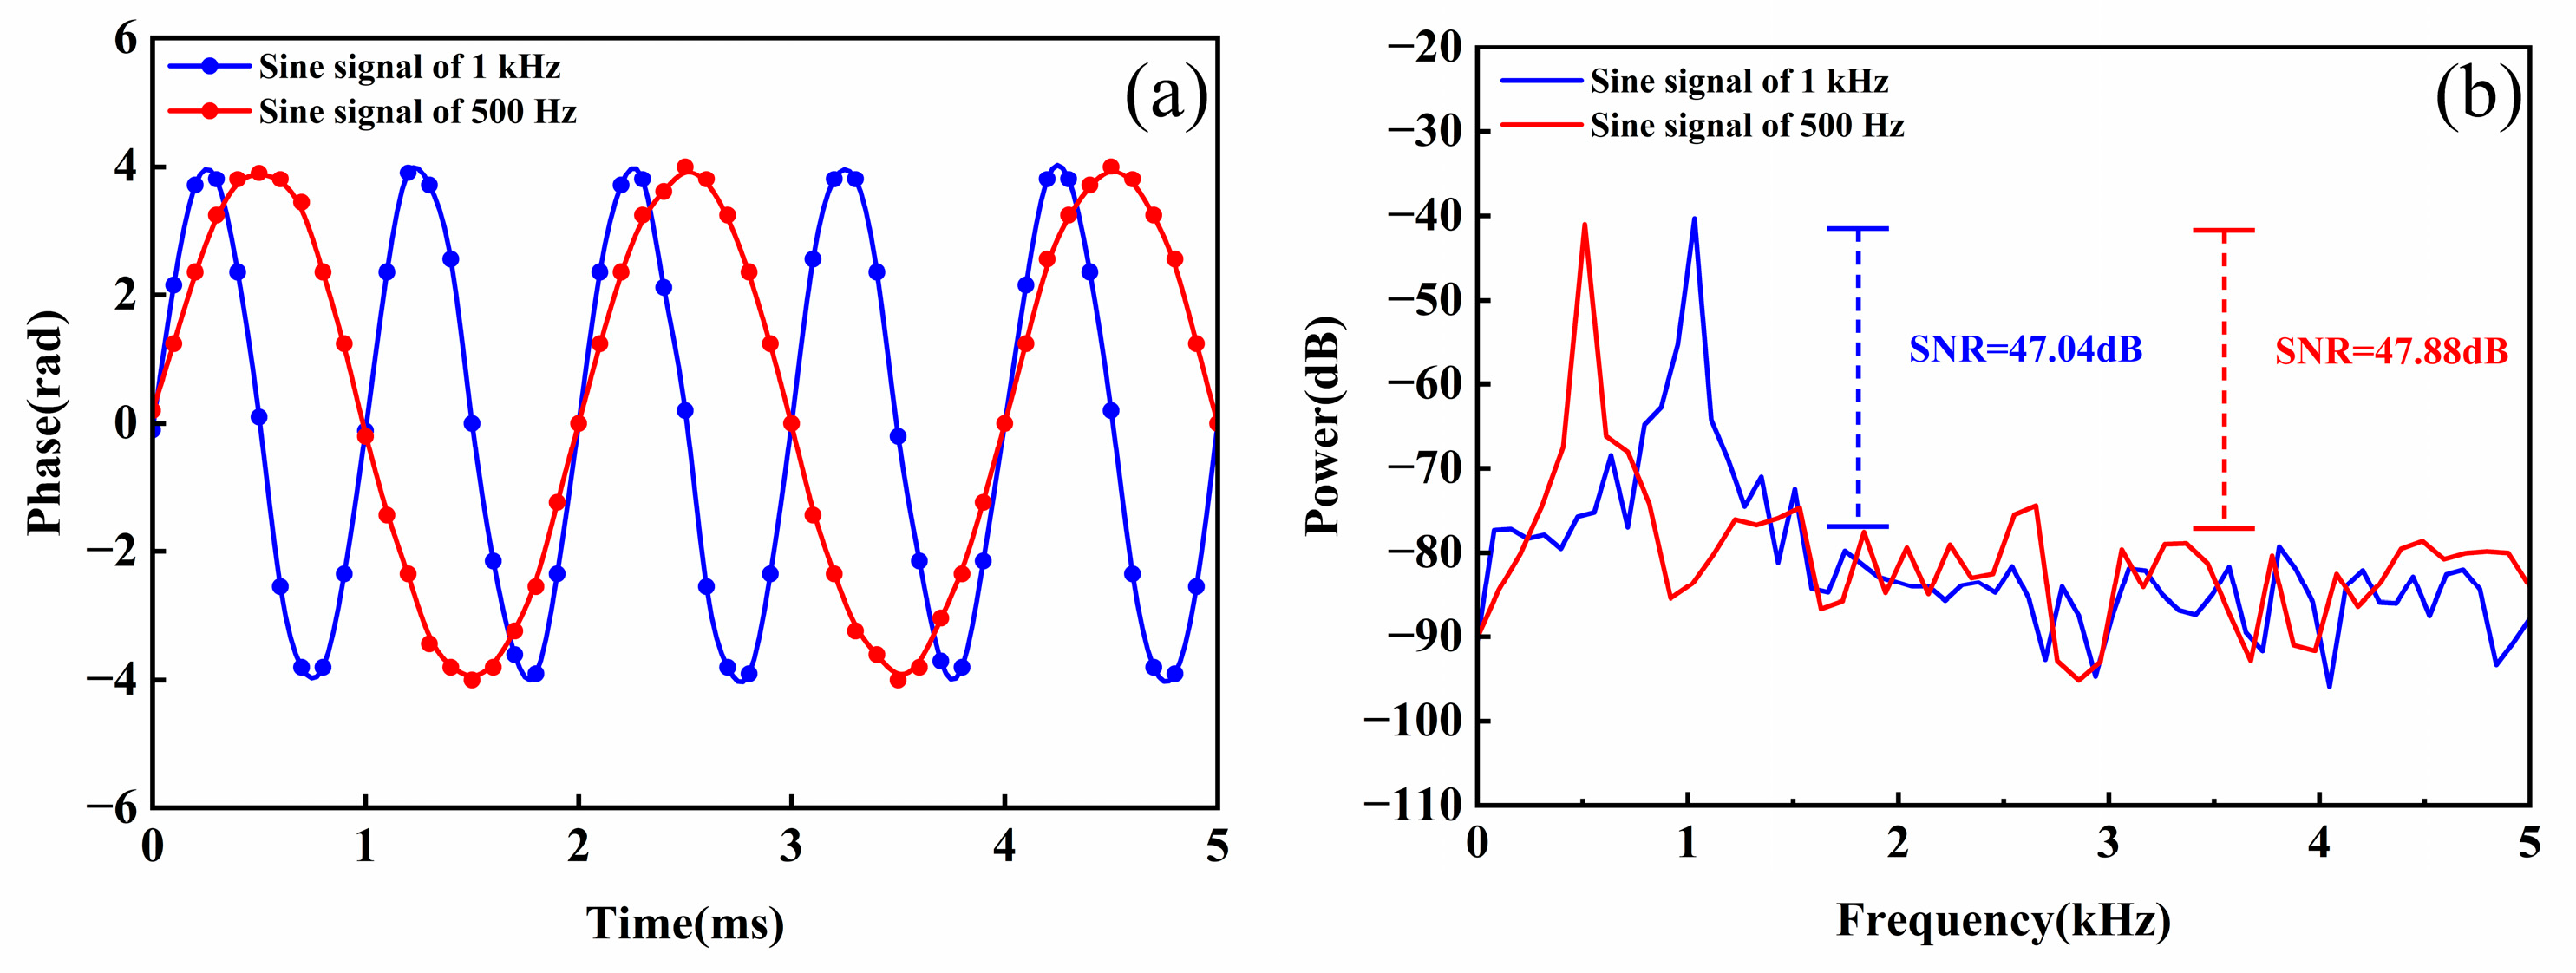
| Our Scheme | 0.25% | 27.14 dB | 20 km | 47.88 | 2 m |
Disclaimer/Publisher’s Note: The statements, opinions and data contained in all publications are solely those of the individual author(s) and contributor(s) and not of MDPI and/or the editor(s). MDPI and/or the editor(s) disclaim responsibility for any injury to people or property resulting from any ideas, methods, instructions or products referred to in the content. |
© 2025 by the authors. Licensee MDPI, Basel, Switzerland. This article is an open access article distributed under the terms and conditions of the Creative Commons Attribution (CC BY) license (https://creativecommons.org/licenses/by/4.0/).
Share and Cite
Wu, X.; Sun, A.; Liu, Y.; Ji, W. Digitalized Polarization Fading Suppression and Phase Demodulation Scheme of Phase-Sensitive Optical Time-Domain Reflectometry Based on Polarization Diversity Virtual Coherence. Photonics 2025, 12, 375. https://doi.org/10.3390/photonics12040375
Wu X, Sun A, Liu Y, Ji W. Digitalized Polarization Fading Suppression and Phase Demodulation Scheme of Phase-Sensitive Optical Time-Domain Reflectometry Based on Polarization Diversity Virtual Coherence. Photonics. 2025; 12(4):375. https://doi.org/10.3390/photonics12040375
Chicago/Turabian StyleWu, Xiatong, An Sun, Yanming Liu, and Wei Ji. 2025. "Digitalized Polarization Fading Suppression and Phase Demodulation Scheme of Phase-Sensitive Optical Time-Domain Reflectometry Based on Polarization Diversity Virtual Coherence" Photonics 12, no. 4: 375. https://doi.org/10.3390/photonics12040375
APA StyleWu, X., Sun, A., Liu, Y., & Ji, W. (2025). Digitalized Polarization Fading Suppression and Phase Demodulation Scheme of Phase-Sensitive Optical Time-Domain Reflectometry Based on Polarization Diversity Virtual Coherence. Photonics, 12(4), 375. https://doi.org/10.3390/photonics12040375