Chaotic Dynamics of Spatial Optical Rogue Waves in SBN Crystals

Abstract
1. Introduction
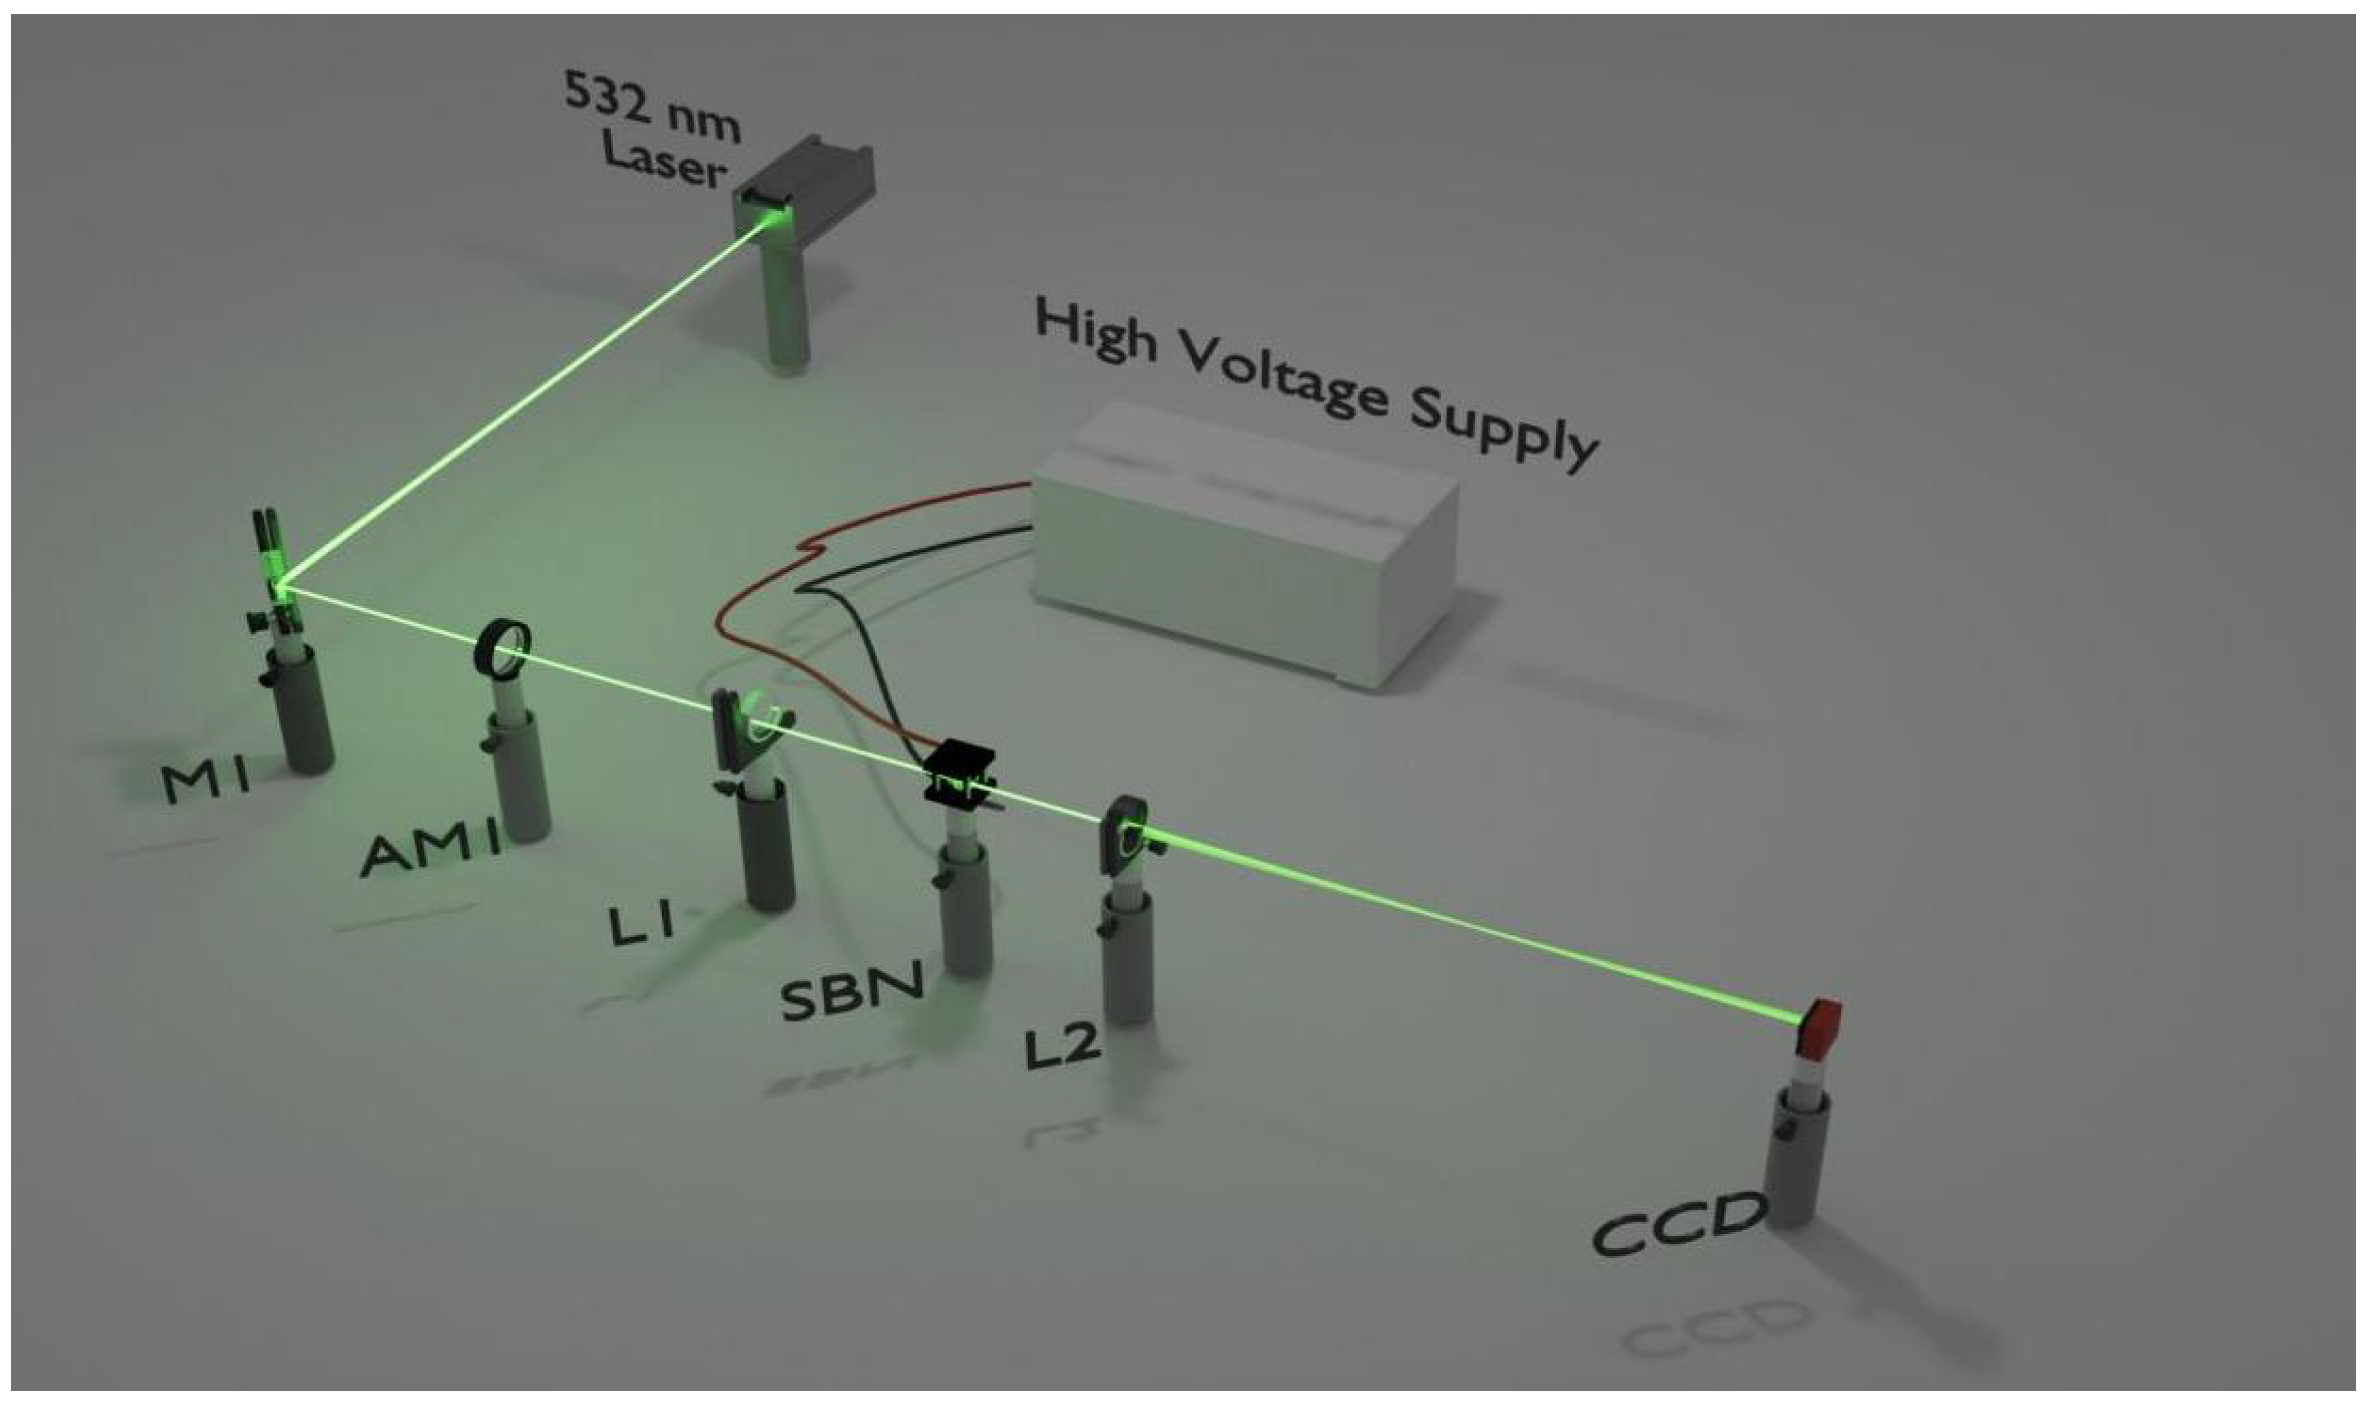
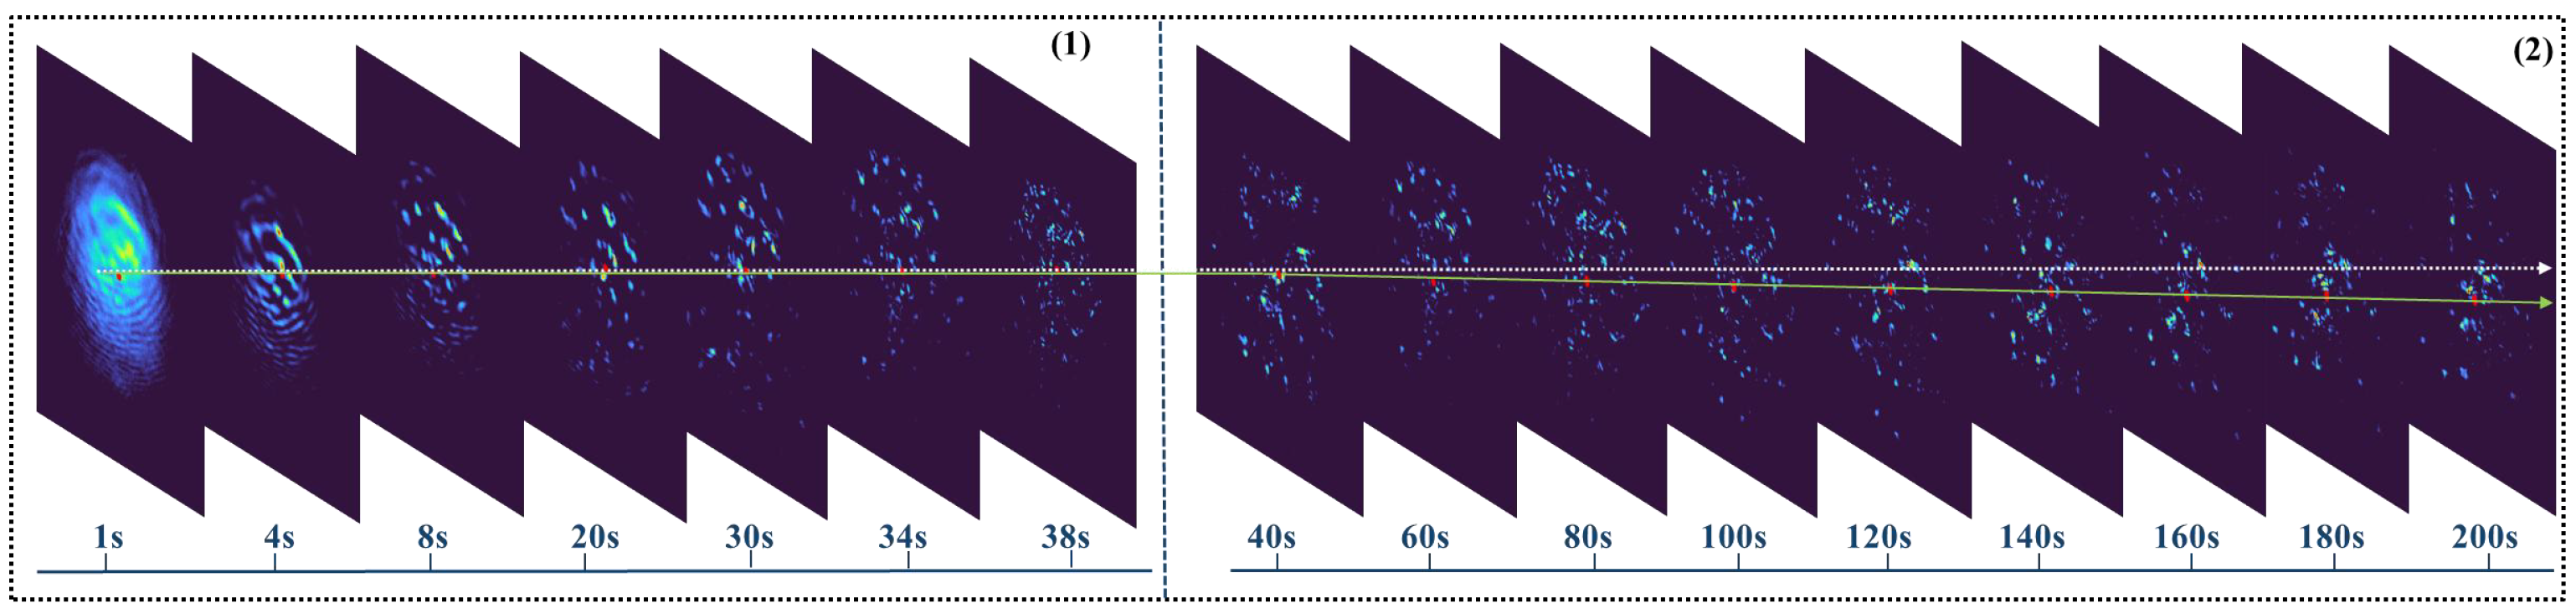
2. Experiment
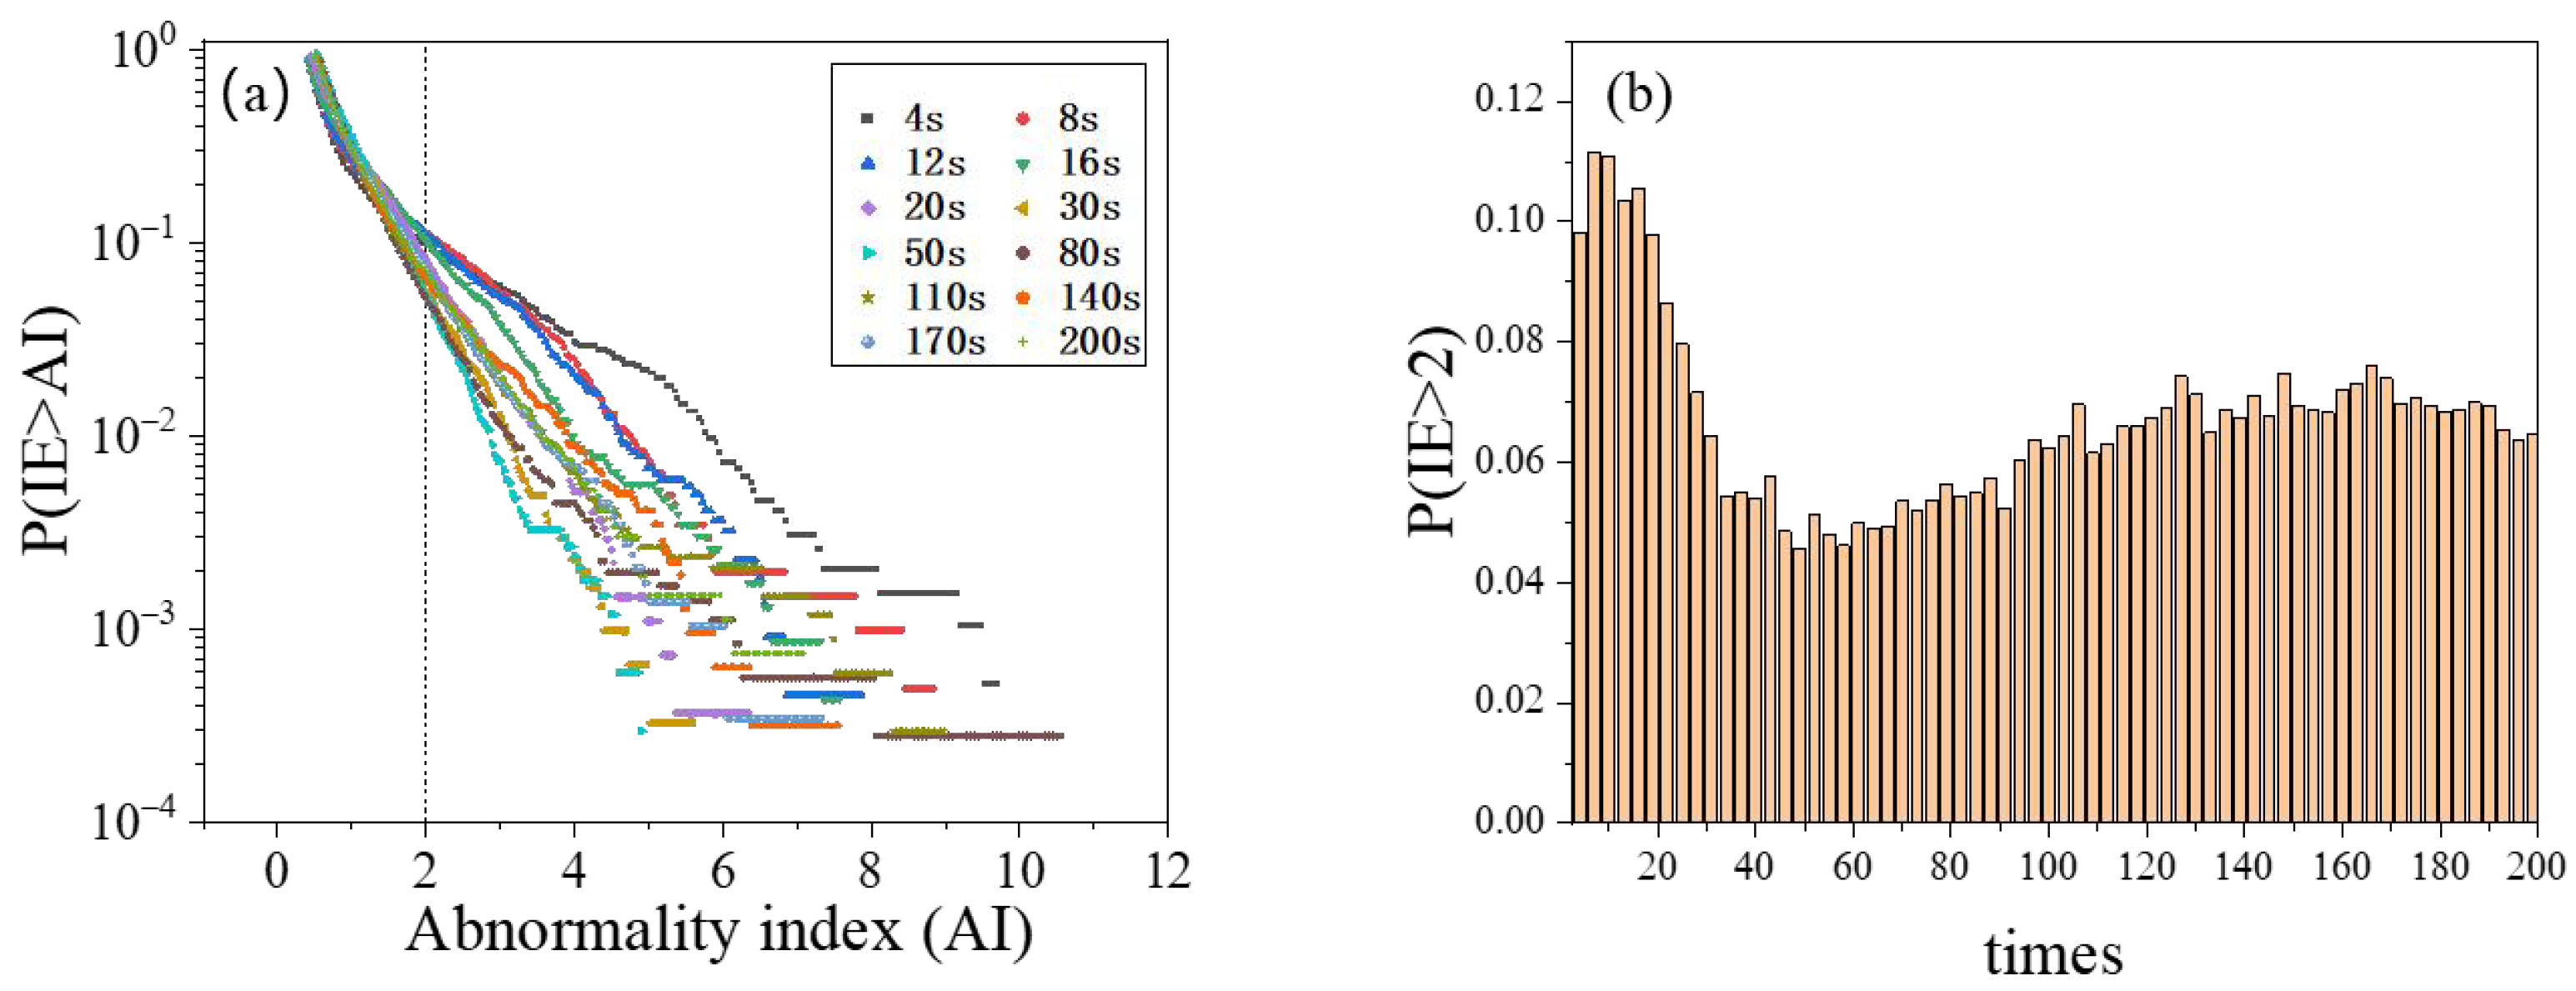
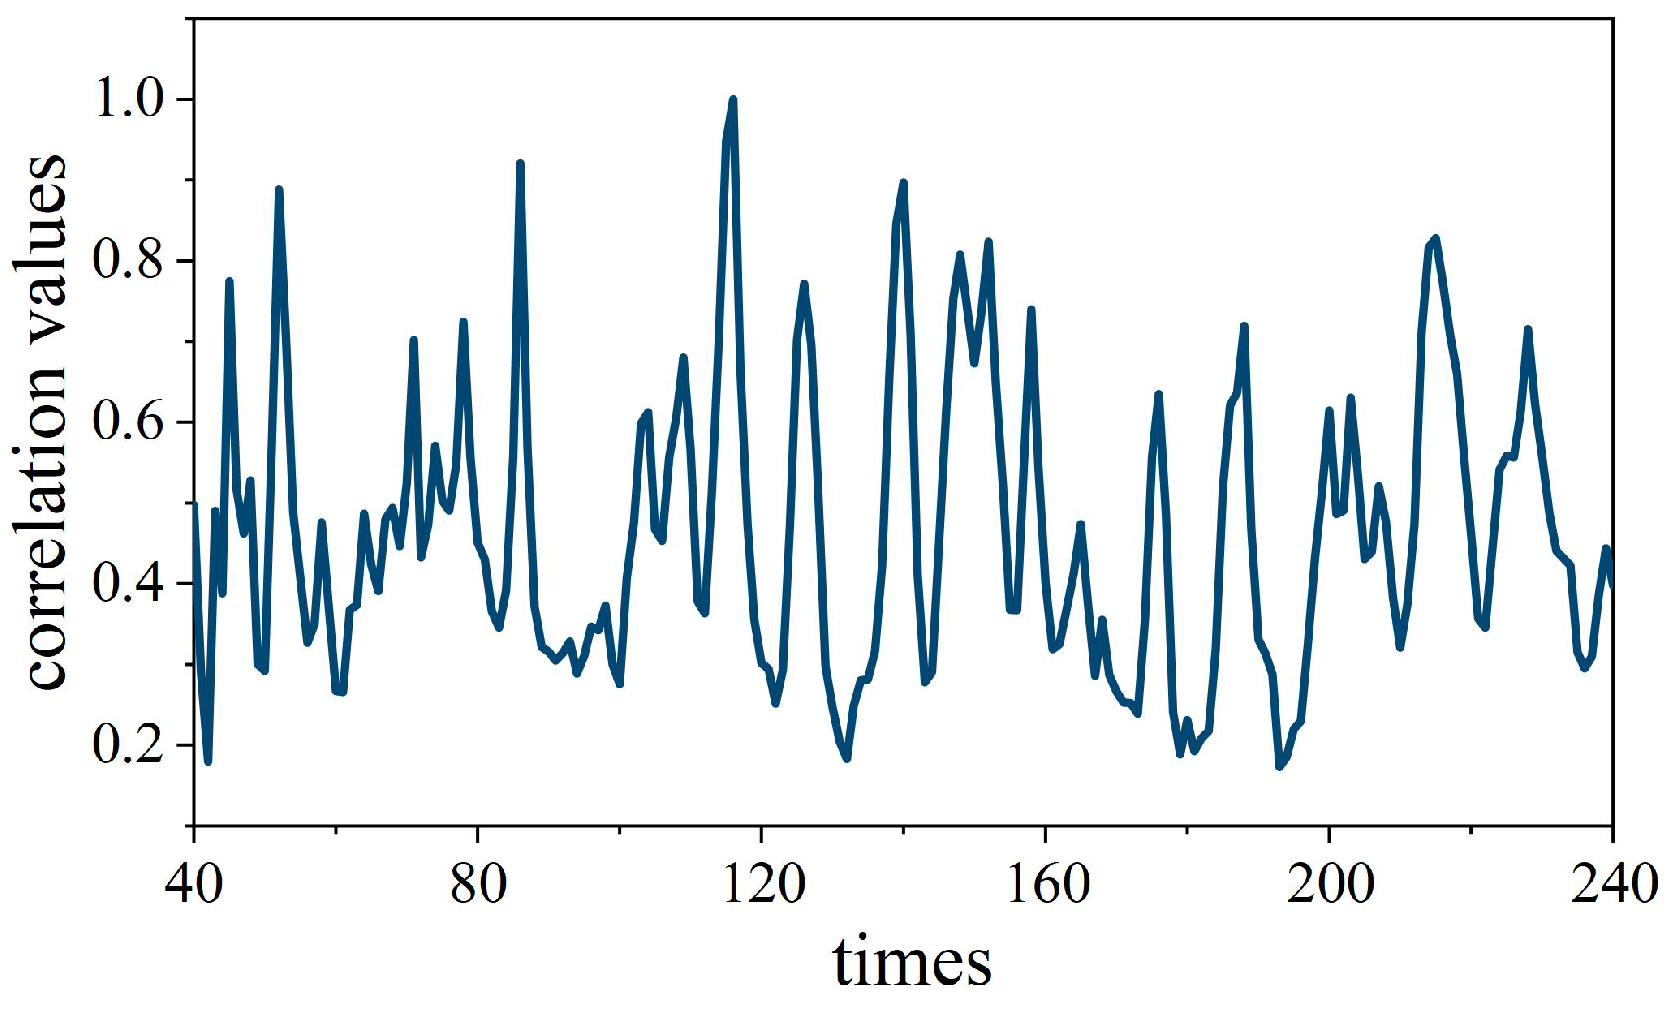
3. Simulation Analysis
4. Conclusions
Author Contributions
Funding
Institutional Review Board Statement
Informed Consent Statement
Data Availability Statement
Acknowledgments
Conflicts of Interest
References
- Tsonis, P.A.; Tsonis, A.A. Chaos: Principles and implications in biology. Bioinformatics 1989, 5, 27–32. [Google Scholar] [CrossRef] [PubMed]
- Weidenmüller, H.; Mitchell, G. Random matrices and chaos in nuclear physics: Nuclear structure. Rev. Mod. Phys 2009, 81, 539–589. [Google Scholar] [CrossRef]
- Sciamanna, M.; Shore, K.A. Physics and applications of laser diode chaos. Nat. Photonics 2015, 9, 151–162. [Google Scholar] [CrossRef]
- Julienne, P.S. Chaos in the cold. Nature 2014, 507, 440–441. [Google Scholar] [CrossRef]
- Zheng, J.; Hu, H.P. A novel method of constructing high-dimensional digital chaotic systems on finite-state automata. Chin. Phys. B 2020, 29, 090502. [Google Scholar] [CrossRef]
- Guegan, D. Chaos in economics and finance. Annu. Rev. Control 2009, 33, 89–93. [Google Scholar] [CrossRef]
- Xu, C.; Mu, D.; Aouiti, C.; Liu, Z.; Qin, Q.; Yao, L.; Hou, M. Bifurcation anti-control technique in a fractional-order stable finance model. Asian J. Control 2023, 25, 1061–1073. [Google Scholar] [CrossRef]
- Reidler, I.; Aviad, Y.; Rosenbluh, M.; Kanter, I. Ultrahigh-speed random number generation based on a chaotic semiconductor laser. Phys. Rev. Lett. 2009, 103, 024102. [Google Scholar] [CrossRef]
- Haken, H. Analogy between higher instabilities in fluids and lasers. Phys. Lett. A 1975, 53, 77–78. [Google Scholar] [CrossRef]
- Ayadi, S.; Haeberlé, O. The Lorenz model for single-mode homogeneously broadened laser: Analytical determination of the unpredictable zone. Open Phys. 2014, 12, 203–214. [Google Scholar] [CrossRef]
- Larger, L.; Soriano, M.C.; Brunner, D.; Appeltant, L.; Gutiérrez, J.M.; Pesquera, L.; Mirasso, C.R.; Fischer, I. Photonic information processing beyond Turing: An optoelectronic implementation of reservoir computing. Opt. Express 2012, 20, 3241–3249. [Google Scholar] [CrossRef] [PubMed]
- Peil, M.; Jacquot, M.; Chembo, Y.K.; Larger, L.; Erneux, T. Routes to chaos and multiple time scale dynamics in broadband bandpass nonlinear delay electro-optic oscillators. Phys. Rev. E—Stat. Nonlinear Soft Matter Phys. 2009, 79, 026208. [Google Scholar] [CrossRef] [PubMed]
- Poon, C.S.; Barahona, M. Titration of chaos with added noise. Proc. Natl. Acad. Sci. USA 2001, 98, 7107–7112. [Google Scholar] [CrossRef] [PubMed]
- Rozenman, G.G.; Shemer, L.; Arie, A. Observation of accelerating solitary wavepackets. Phys. Rev. E 2020, 101, 050201. [Google Scholar] [CrossRef]
- Xin, F.; Di Mei, F.; Falsi, L.; Pierangeli, D.; Conti, C.; Agranat, A.J.; DelRe, E. Evidence of chaotic dynamics in three-soliton collisions. Phys. Rev. Lett. 2021, 127, 133901. [Google Scholar] [CrossRef]
- Chen, Z.; Li, F.; Lou, C. Statistical study on rogue waves in Gaussian light field in saturated nonlinear media. Chin. Opt. Lett. 2022, 20, 081901. [Google Scholar] [CrossRef]
- Li, F.; Chen, Z.; Song, J.; Li, M.; Lou, C. Optical Chaos in Saturated Nonlinear Media. Photonics 2023, 10, 600. [Google Scholar] [CrossRef]
- Song, J.; Xie, H.; Feng, Y. Correlation analysis method for ocean monitoring big data in a cloud environment. J. Coast. Res. 2018, 82, 24–28. [Google Scholar]
- Keskinen, J.P.; Vuorinen, V.; Kaario, O. Nonlinear time series analysis from large eddy simulation of an internal combustion engine. Int. J. Heat Fluid Flow 2016, 57, 79–90. [Google Scholar] [CrossRef]
- Panajotov, K.; Clerc, M.G.; Tlidi, M. Spatiotemporal chaos and two-dimensional dissipative rogue waves in Lugiato-Lefever model. Eur. Phys. J. D 2017, 71, 1–8. [Google Scholar] [CrossRef]
- Valsakumar, M.; Satyanarayana, S.; Sridhar, V. Signature of chaos in power spectrum. Pramana-J. Phys. 1997, 48, 69–85. [Google Scholar] [CrossRef]
Disclaimer/Publisher’s Note: The statements, opinions and data contained in all publications are solely those of the individual author(s) and contributor(s) and not of MDPI and/or the editor(s). MDPI and/or the editor(s) disclaim responsibility for any injury to people or property resulting from any ideas, methods, instructions or products referred to in the content. |
© 2025 by the authors. Licensee MDPI, Basel, Switzerland. This article is an open access article distributed under the terms and conditions of the Creative Commons Attribution (CC BY) license (https://creativecommons.org/licenses/by/4.0/).
Share and Cite
Wang, Y.; Li, F.; Jia, R.; Song, J.; Li, M.; Chen, Z.; Lou, C. Chaotic Dynamics of Spatial Optical Rogue Waves in SBN Crystals. Photonics 2025, 12, 367. https://doi.org/10.3390/photonics12040367
Wang Y, Li F, Jia R, Song J, Li M, Chen Z, Lou C. Chaotic Dynamics of Spatial Optical Rogue Waves in SBN Crystals. Photonics. 2025; 12(4):367. https://doi.org/10.3390/photonics12040367
Chicago/Turabian StyleWang, Ying, Fuqiang Li, Ruoyi Jia, Jie Song, Meng Li, Ziyang Chen, and Cibo Lou. 2025. "Chaotic Dynamics of Spatial Optical Rogue Waves in SBN Crystals" Photonics 12, no. 4: 367. https://doi.org/10.3390/photonics12040367
APA StyleWang, Y., Li, F., Jia, R., Song, J., Li, M., Chen, Z., & Lou, C. (2025). Chaotic Dynamics of Spatial Optical Rogue Waves in SBN Crystals. Photonics, 12(4), 367. https://doi.org/10.3390/photonics12040367