Abstract
The Mutual Optical Intensity (MOI) model is further developed to simulate the propagation of partially coherent X-ray vortex beams through free space. The intensity, phase, and amplitude distributions of the degree of coherence in the far field zone are numerically calculated using the MOI model. The effects of the coherence property and topological charge on the vortex beam are analyzed. For Gaussian Schell-model vortex beams, a vortex structure appears around the coherence singularity at the amplitude distribution of the degree of coherence relative to the central point. The number and rotation direction of the vortex structure are consistent with the magnitude and sign of the topological charge of the partially coherent vortex beam. As the spatial coherence decreases, the size of the vortex structure for the phase and amplitude distributions of the degree of coherence gradually increase until they disappear. The intensity of the dark hollow region increases with increasing topological charge. In addition, for the Laguerre–Gaussian Schell-model vortex beam, there is no singularity or vortex structure at the amplitude distribution of the degree of coherence relative to the central point. Therefore, the vortex structure around the coherence singularity at the amplitude distributions of the degree of coherence relative to the central point can be used to measure the vortex beam types and topological charge.
1. Introduction
Vortex beams, characterized by a spiral phase factor of (where denotes the topological charge and represents the azimuthal angle) [1], can carry orbital angular momentum (OAM). Such beams typically exhibit a ring-shaped intensity distribution with zero intensity at the center [2]. Owing to their unique properties, vortex beams have been widely applied in fields such as optical communication [3], optical tweezers [4], optical metrology [5], super-resolution imaging [6], and quantum entanglement [7]. By superposing a series of coherent Laguerre–Gaussian beams [8] incoherently, Gori et al. realized partially coherent vortex beams with spiral phase structures. Research on vortex beams has been extended to the field of partially coherent light. Compared with a fully coherent vortex beam, a partially coherent vortex beam has lower beam scintillation, drift, and stronger self-reconstruction ability [9,10] and, therefore, has attracted increased attention. At the same time, with the development of a new generation of high-coherence X-ray sources such as free electron lasers [11] and diffraction-limit rings [12], vortex beam research can be extended to the X-ray field [13], and research on the direct alteration of atomic states can be carried out through OAM exchange [14]. Moreover, new methods can more easily be developed to study the quadrupolar transitions of materials [15].
The generalized Collins formula is the most commonly used to simulate the propagation of partially coherent vortex beams [16]. Under paraxial conditions, partially coherent beam transmission through ABCD optical systems in free space can be mathematically described based on the generalized Collins formula. The generalized Collins formula can be used to roughly estimate OAM propagation through simple optics by using the thin lens approximation. However, the calculation of the generalized Collins formula needs to match the Fraunhofer or Fresnel approximation [17]. In most synchrotron radiation experiments, the two approximations cannot be matched since the shorter wavelength is for the X-ray range. For complex optics such as fork gratings and spiral Fresnel zone plates, the derivation of the Collins formula becomes extremely difficult and nearly impossible [16]. The mutual optical intensity (MOI) model, a beamline simulation model based on statistical optics, uses mutual optical intensity to describe the propagation of partially coherent beams [18]. In the model, the wavefront is separated into multiple small elements. Within each small element, the wavefront can be considered to be fully coherent and equal in intensity. The Fresnel integral is used to compute the propagation of mutual optical intensity within each small element, and the contributions of all the elements are superimposed to realize the numerical simulation of mutual optical intensity propagation. The MOI model does not require the paraxial approximation and has high calculation accuracy. Combined with the static phase approximation, the MOI model can simulate the propagation of partially coherent beam through complex optics such as gratings and Fresnel zone plates [19,20,21]. The MOI model is developed to analyze partially coherent vortex beam propagation through free space and obtain the intensity, phase, and amplitude distributions of the degree of coherence at the far-field plane. The effects of spatial coherence and topological charge on the propagation of partially coherent vortex beams are analyzed. In addition, the difference in the simulation results at the far-field plane between the Laguerre–Gaussian Schell-model (LGSMV) and Gaussian Schell-model vortex beam (GSMV) is also analyzed.
2. Establishment of the MOI Model for the Vortex Beam
In this section, we present an introduction to the MOI model and delineate its approach for simulating the propagation of partially coherent vortex beams in free space. The following equation represents the propagation of a partially coherent beams through free space:
where is the mutual optical intensity at the far-field plane; are any two points of the far-field plane; and denote the distances of -to- and -to-, respectively; and respectively, denote the inclination factors of the inclination angles and ; and and respectively, denote the source plane surfaces. Partially coherent vortex beam models include GSMV [22], LGSMV [16], and Bessel–Gaussian Schell-model vortex beams [23]. The mutual optical intensity can be used to describe the distribution of any type of partially coherent vortex beam. The most common method for generating GSMV is using a spiral phase plate. When fully coherent light is incident on the spiral phase plate, a ring-shaped intensity distribution is generated in the far field [24]. The mutual optical intensity between points and for the GSMV can be expressed as follows [25]:
where ξ is the coherence length, is the beam root mean square (r.m.s.) size, and are the azimuthal angles, and is the intensity of the center point. The most common method for generating LGSMV is using a forked grating. When fully coherent light is incident on the forked grating, a ring-shaped intensity distribution is generated in the far-field diffraction orders [26]. The mutual optical intensity for the LGSMV with radial mode order 0 can be expressed as follows [16]:
The central spot of the closed loop where the phase cannot be defined is a singularity. The topological charge l for the phase distribution can be expressed as follows [27]:
where C is a tiny, closed loop surrounding the singularity.
Equation (1) can be solved under the condition that the optical layout matches the Fresnel or Fraunhofer approximation. However, in most X-ray experiments, the two approximation conditions cannot be matched since the shorter wavelength is in the X-ray range [28]. The analytical solution for Equation (1) is difficult. To calculate the propagation of a partially coherent vortex beam, we need to establish a numerical method. The wavefront is separated into several small elements. When the size of each element is much smaller than the spot size and coherence length, each small element can be assumed to be fully coherent and have a constant complex amplitude. Then, the Fresnel integral is used to calculate the propagation of the mutual optical intensity of each small element, and the propagation results of all small elements are summed to obtain the mutual optical intensity at the far-field plane. The wavefront at the source plane is separated equally into small elements. Each element is represented by () or mn (). Summing the integration in each small element, the integration in the total wavefront can be calculated. Thus, Equation (3) can be rewritten as follows:
where denote the integration range of the element. can be removed from the integration since the constant complex amplitude in each element. Combined with Equation (2), we can obtain the following:
where represents the space vector in the local coordinate system of the element. The integration within the bracket in Equation (7) is through the element. The integration can be defined as the following equation:
When the element size is small enough, Equation (8) can be numerically calculated with the Fresnel or Fraunhofer approximation. Therefore, the propagation of a partially coherent vortex beam can be represented by the following equation:
The MOI model also avoids performing integration calculations over large transverse domains on the rapidly varying term in Equation (1), which can significantly enhance computational efficiency with satisfactory precision. The MOI model can simulate the propagation of any type of partially coherent vortex beam with any coherence and topological charge. The mutual optical intensity characterizes the correlation information in the wavefront domain, thereby enabling quantitative determination of the ensemble-averaged coherence properties for the full radiation field. The global degree of coherence, mathematically defined as the spatial averaging of transverse coherence distribution over the beam profile, assumes normalized values from 0 (complete incoherence) to 1 (perfect coherence), formally expressed as:
where is the intensity at point P.
3. Simulation Results
The MOI model is used to simulate the propagation of a partially coherent vortex beam through free space and to obtain the intensity and the phase and amplitude distributions of the degree of coherence at the far-field plane. The mutual optical intensity at the source plane can be obtained by using Equation (2). The source energy of GSMV is 500 eV with a beam r.m.s. size of = 50 μm and a topological charge of . The propagation distance is 10 m. The coherence lengths are chosen to be ∞, 300 μm, 153 μm, 81.7 μm, and 33.5 μm, with corresponding global degrees of coherence of G = 1, 0.9, 0.7, 0.4, and 0.1, respectively. The calculation range is 200 μm at the source plane. The Fresnel number [17] is 1.6 at the edge of the source plane, and the propagation of X-rays cannot match Fresnel or Fraunhofer conditions. The source plane is separated into 100 × 100 elements with a size of each element of 2 × 2 μm. Each element is sufficiently small, and it can be treated as fully coherent with constant intensity. The propagation of X-rays in each element can match the Fresnel condition. The intensity and the phase and amplitude distributions of the degree of coherence (DOC) relative to the central point distributions at the far-field plane are shown in Figure 1. To identify the zeros more clearly, the logarithm function is adopted for the amplitude of the degree of coherence (lg(|DOC|)) [29].
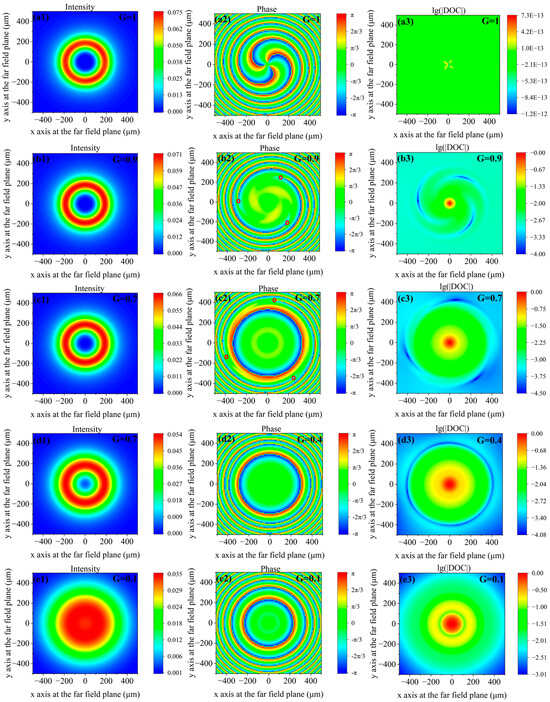
Figure 1.
(a1–e1) Intensity distributions at the far-field plane, (a2–e2) phase distributions of degree of coherence relative to the central point at the far-field plane, (a3–e3) lg(|DOC|) relative to the central point distributions at the far-field plane with different coherence lengths. The global degrees of coherence from the 1st to the 5th rows are 1, 0.9, 0.7, 0.4, and 0.1, respectively.
Figure 1(a1–a3) show the intensity and the phase and amplitude distributions of the degree of coherence relative to the central point at the far-field plane under fully coherent conditions, respectively. The diameter of the dark hollow is 174 μm. The topological charge l is 3, according to the observation of the vortex state of the phase. The phase [cf. Figure 1(a2)] distribution at the central point is uncertain, and phase singularity occurs at the central point. Therefore, the intensity [cf. Figure 1(a1)] at the central point is zero. An optical vortex occurs in a coherent field in the phase profile, and a dark hollow occurs in the intensity profile.
Figure 1(b1–b3) show the intensity and the phase and amplitude distributions of the degree of coherence with G = 0.9. Compared with the fully coherent case [cf. Figure 1(a1)], the intensity at the central point is increased to , and the diameter of the dark hollow region is reduced to 165 μm [cf. Figure 1(b1)]. The central vortex for the phase moves away from the original point and splits into three first-order coherence vortices [cf. Figure 1(b2)]. The front end of each coherence vortex has a phase uncertainty point (marked with red circles). The phase uncertainty points to damage the correlation. Therefore, the amplitude of the degree of coherence relative to the central point vanishes at locations where a phase uncertainty point appears, as shown in Figure 1(b3). Coherence singularities occur at points where the degree of coherence vanishes, according to the theoretical studies of Wolf and Gbur et al. [30]. Thus, when G = 0.9, the partially coherent vortex beam has three coherence singularities. As shown in Figure 1(b3), the coherence singularities are located at a radius of 297.6 μm, and there are three vortex structures around the three coherence singularities.
Figure 1(c1–c3) show the intensity and the phase and amplitude distributions with G = 0.7, respectively. As the coherence decreases, the intensity at the center point increases and the diameter of the dark hollow region decreases. The phase and amplitude distributions of the degree of coherence still have vortex structures, and the size of the vortex structure increases since reducing the coherence causes the coherence singularities to move away from the center reference point [31].
Figure 1(d1–d3) show the intensity and the phase, and amplitude distributions with G = 0.4, respectively. As in Figure 1(a1–c1), the intensity at the center point continues to increase, and the diameter of the dark hollow region continues to decrease. The coherence vortex for the phase of the degree of coherence and the vortex structure for the amplitude of the degree of coherence disappear. When G = 0.4, the partially coherent vortex beam has no coherence singularity or coherence vortex in the distribution of the phase or the amplitude of the degree of coherence relative to the central point at the far-field plane.
Figure 1(e1–e3) show the intensity, phase and amplitude distributions with G = 0.1, respectively. The dark hollow region of intensity disappears, and the coherence vortex for the phase of the degree of coherence and vortex structure for the amplitude of the degree of coherence also disappear. Despite the intensity distribution of the vortex beam at the far field appearing similar to the Gaussian beam with zero topological charge, the beam spot sizes at the far field of the beam with and without topological charge are different. Due to the presence of topological charge, vortex beams have an in-plane rotational component, which causes the spot size of vortex beam to be 2.6 times that of of the Gaussian beam with zero topological charge for the simulation condition of Figure 1. The calculation time of X-ray propagation from the source plane to the far-field plane is 300 s, and all simulations were performed on a laptop with an i7-13700h CPU and 32 GB RAM. Comparing the simulation results with more elements, the calculation errors in Figure 1 are less than 0.5%.
From Figure 1(b2,b3), one can extract the phase and amplitude of the degree of coherence relative to the central point along the radial direction with a radius of 297.6 μm, where the degree of coherence vanishes. The phase and amplitude distributions of the degree of coherence relative to the central point as a function of the azimuthal angle are shown in Figure 2. The phase and the amplitude of the degree of coherence have apparent periodic distributions, and the phase uncertainty point corresponds to a degree of coherence of 0. The azimuthal angles for the phase uncertainty points are −1.5 rad, 0.65 rad, and 2.76 rad, where the coherence vortex and coherence singularities can be located. For partially coherent light, the phase uncertainty points, and coherence singularities coincide with each other.
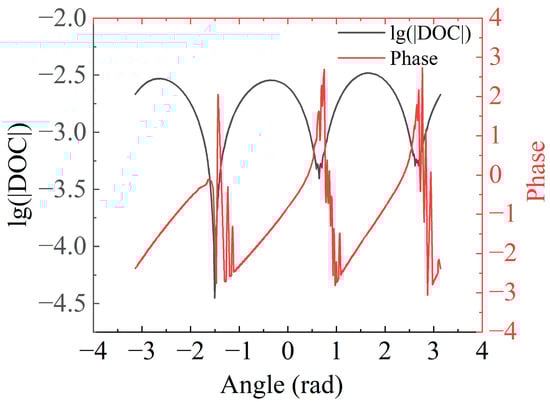
Figure 2.
The phase and amplitude distributions of the degree of coherence relative to the central point at r = 297.6 μm as a function of the azimuthal angle with G = 0.9.
The effect of topological charge on the vortex structure of the phase and amplitude distribution of the degree of coherence is analyzed. The topological charges are and , with a global degree of coherence of 0.9. The simulation results include the intensity and the phase and amplitude distributions of the degree of coherence relative to the central point, as shown in Figure 3.
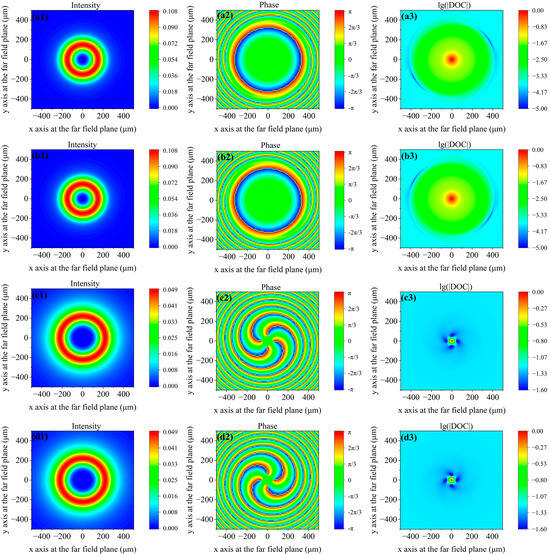
Figure 3.
(a1–d1) Intensity distributions, (a2–d2) phase distributions of the degree of coherence relative to the central point, and (a3–d3) lg(|DOC|) relative to the central point distributions in the far-field plane with different topological charges. The topological charges from the 1st to the 4th rows are 2, −2, 4, and −4, respectively.
Figure 3(a1–d1) show the intensity distributions at the far-field plane with different topological charges. The intensity distributions are the same for the same magnitude but different signs of topological charge. Figure 3(a2–d2) show phase distributions of the degree of coherence relative to the central point. The magnitude of the coherence vortex is two for Figure 3(a2,b2) and four for Figure 3(c2,d2), which are the same as the magnitudes of the topological charge. The rotation directions for Figure 3(a2,c2) are anticlockwise, which corresponds to the sign of a positive topological charge, while the rotation directions for Figure 3(b2,d2) are clockwise, which corresponds to the sign of a negative topological charge. Figure 3(a3–d3) show the amplitude distributions of the degree of coherence relative to the central point. Since the amplitude distribution of the degree of coherence is scalar, unlike the phase distribution of the degree of coherence, which is vector, the amplitude distribution of the degree of coherence has no topological property. Therefore, the number and direction, rather than the magnitude and sign, are used to describe the shape of the vortex structure in terms of the amplitude of the degree of coherence. The number of vortex structures around the coherence singularities is two for Figure 3(a3,b3) and four for Figure 3(c3,d3), which are the same as their magnitudes of topological charge. The rotation directions of the vortex structures in Figure 3(a3,c3) are anticlockwise, which corresponds to a positive topological charge, while the rotation directions in Figure 3(b3,d3) are clockwise, which corresponds to a negative topological charge. The aforementioned conclusions hold universally for the partially coherent vortex beam with different topological charges. The magnitude and sign of the topological charge can be detected by measuring the number and rotation direction of the vortex structures around the coherence singularities.
As shown in Figure 1, under low coherence conditions, there is no observed coherence singularity in the distribution of the phase or the amplitude of the degree of coherence relative to the central point. However, a partially coherent vortex beam also has a hidden coherence singularity, which is related to the chosen reference point [30]. We take the source of G = 0.4 as an example. When the coordinate of the reference point is (0, 0), there is no coherence vortex at the phase distribution of the degree of coherence at the far-field plane [cf. Figure 1(d2)], and there is no coherence singularity in the amplitude distribution of the degree of coherence [cf. Figure 1(d3)]. When the coordinate of the reference point (−100 μm, −100 μm) is chosen, there are three first-order coherence vortices in the phase distribution of the degree of coherence, as shown in Figure 4a, and there are three coherence singularities in the amplitude distribution of the degree of coherence, as shown in Figure 4b. The three first-order coherence singularities appear collinear, which is consistent with previous research [32]. However, under low coherence conditions, there is no vortex structure around the coherence singularities, which means that only the magnitude but not the sign of the topological charge can be judged by the number of coherence singularities in the amplitude distribution of the degree of coherence. The simulation result is consistent with those of previous studies [33].
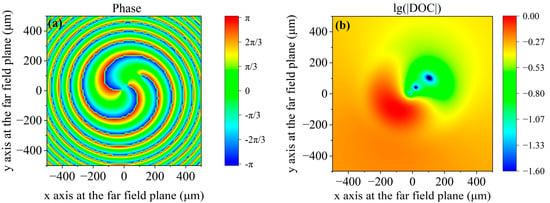
Figure 4.
Under the condition of l = 3 and G = 0.4, (a) the phase distribution of the degree of coherence relative to the point (−100 μm, −100 μm) at the far-field plane and (b) the amplitude distribution of the degree of coherence relative to the point (−100 μm, −100 μm) at the far-field plane. The three blue areas in Figure 4b indicate the three coherence singularities.
As shown in Figure 1, the dark hollow visibility of the intensity distribution at the far-field plane decreases as the global degree of coherence decreases. To analyze the influence of topological charge and coherence properties on dark hollows, the visibility of dark hollows with various topological charges and different degrees of coherence is calculated, as shown in Figure 5. The visibility of the dark hollow region increases with increasing topological charge. For the same topological charge, a higher coherence leads to greater visibility. The effect of topological charge and source coherence on the visibility of dark hollows can be explained by the fact that a partially coherent vortex beam can be considered to add a random phase to a fully coherent vortex beam. The random phase acts as a part of merging the hollow beam profile, while the vortex phase acts as a part of retaining the hollow beam profile [29]. Increasing the global degree of coherence is beneficial for visibility due to the presence of fewer random phases. For G = 0.1, when the topological charge is small, the random phase plays a dominant role, which leads to low visibility. With increasing topological charge, the vortex phase gradually plays a more dominant role, and the random phase gradually plays a less dominant role, which leads to an increase in the visibility of the intensity.
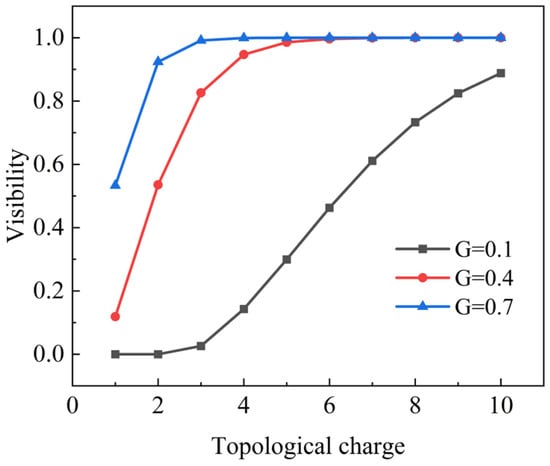
Figure 5.
Visibility of the dark hollow at the far-field plane with various topological charges. G = 0.1 (black line), G = 0.4 (red line), and G = 0.7 (black line).
When the spatial coherence is high, the topological charge of the LGSMV can be judged based on the Fourier transform of the intensity. When the spatial coherence is low, the topological charge of the LGSMV can be judged based on the amplitude of the degree of coherence [29]. To analyze the difference between the LGSMV and GSMV, we simulate the propagation of the LGSMV through free space. The LGSMV source energy is 500 eV with a beam r.m.s. size of = 50 μm and a topological charge of . The propagation distance is 10 m. The coherence lengths are chosen to be ∞, 600 μm, and 65 μm, with corresponding global degrees of coherence of G = 1, 0.9, and 0.1, respectively. The intensity, phase, and amplitude distributions of the degree of coherence relative to the central point at the far-field plane are shown in Figure 6.
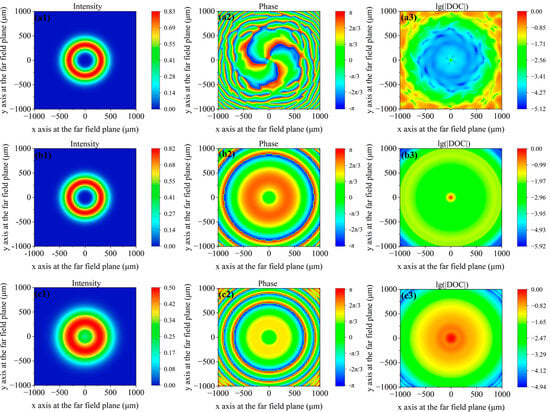
Figure 6.
(a1–c1) Intensity distributions, (a2–c2) phase distributions of the degree of coherence relative to the central point, and (a3–c3) lg(|DOC|) relative to the central point distributions at the far-field plane with different coherence lengths. The global degrees of coherence from the 1st to the 3rd rows are 1, 0.9, and 0.1, respectively.
As shown in Figure 6(a1–c1), for the LGSMV, the dark hollow region of the intensity at the far-field plane gradually disappears with decreasing global degree of coherence. For a fully coherent LGSMV, there is a phase singularity in the phase distribution relative to the central point, as shown in Figure 6(a2). The above phenomenon is the same as that of GSMV. For LGSMV, there is no coherence singularity or vortex structure with G = 0.9, which is quite different from GSMV. For LGSMV, there is no coherence vortex or coherence singularity with G = 0.1, which is the same as for GSMV. Unlike GSMV, LGSMV has no vortex structure in the amplitude distributions of the degree of coherence relative to the central point. The different simulation results between the LGSMV and GSMV are derived from the different intensity distributions at the source plane between the LGSMV and GSMV.
4. Discussion
The simulation of the propagation of a partially coherent vortex beam is a key process in the research of partially coherent vortex beams. In the visible light region, under paraxial conditions, partially coherent vortex beam transmission through ABCD optical systems in free space can be mathematically described based on the generalized Collins formula [16]. When partially coherent vortex beams are extended into the X-ray regime, conventional simulation methods based on the generalized Collins formula become inapplicable due to the breakdown of Fresnel and Fraunhofer approximations [17]. To enable rapid and accurate simulation of partially coherent vortex beams in the X-ray regime, the vortex phase is embedded into the MOI model. Based on the MOI model, we can simulate the propagation of a partially coherent vortex beam and analyze the effects of spatial coherence and topological charge. The development of the MOI model will be helpful for the design of vortex beam generation optics in the field of synchrotron radiation.
The topological charge is a characteristic parameter of the vortex beam, determining the spiral wavefront distribution. The topological charge detection is significant for the applications of vortex beams. The traditional methods for topological charge detection, such as interferometry [34], diffraction [35], and Fourier transform [36], are not appropriate for partially coherent beams. Based on the amplitude distribution of the degree of coherence, we propose a new method for detecting topological charges of partially coherent vortex beams. The magnitude and sign of the topological charge can be detected by measuring the number and rotation direction of the vortex structures around the coherence singularities in the amplitude distribution of the degree of coherence.
5. Conclusions
In this paper, the MOI model is developed to quantitatively simulate the propagation of a partially coherent vortex beam through free space. For Gaussian Schell-model vortex beams, the vortex structure in the amplitude distribution of the degree of coherence for a partially coherent vortex beam in the far field is theoretically observed. This vortex structure corresponds to the topological charge. The number of vortex arms is equal to the magnitude of the topological charge. The rotation direction of the vortex structure corresponds to the sign of the topological charge. Thus, a new method for detecting topological charges can be developed. Reducing the global degree of coherence causes coherence singularities to move away from the center point. Under low coherence conditions, the coherence vortex and coherence singularities disappear when the reference point is the central point. When an off-axis reference point is chosen, the coherence vortex and coherence singularities reappear, but there is no longer a vortex structure in the distribution of the amplitude of the degree of coherence. Increasing the topological charge or global degree of coherence of a partially coherent vortex beam can increase the intensity visibility in the far-field plane. For the Laguerre–Gaussian Schell-model vortex beams, there is no singularity or vortex structure at the amplitude distribution of the degree of coherence relative to the central point. By observing the phase and amplitude distribution of the degree of coherence, the vortex beam types can be measured.
Author Contributions
Investigation and conceptualization, W.S., X.M. and Y.W.; software, W.S., X.M., J.R. and Y.W.; writing, W.S.; correction and supervision, X.M., Y.W., J.R. and H.Y.; funding acquisition, Y.W. All authors have read and agreed to the published version of the manuscript.
Funding
This research was funded by the National Key Research and Development Program of China (2021YFA1601003).
Institutional Review Board Statement
Not applicable.
Informed Consent Statement
Not applicable.
Data Availability Statement
The data presented in this study are openly available in figshare at https://doi.org/10.6084/m9.figshare.28579790.v1.
Conflicts of Interest
The authors declare no conflicts of interest.
References
- Allen, L.; Beijersbergen, M.W.; Spreeuw, R.J.C.; Woerdman, J.P. Orbital Angular Momentum of Light and the Transformation of Laguerre-Gaussian Laser Modes. Phys. Rev. A 1992, 45, 8185–8189. [Google Scholar] [CrossRef] [PubMed]
- Yao, A.M.; Padgett, M.J. Orbital Angular Momentum: Origins, Behavior and Applications. Adv. Opt. Photonics 2011, 3, 161–204. [Google Scholar] [CrossRef]
- Wang, J.; Yang, J.Y.; Fazal, I.M.; Ahmed, N.; Yan, Y.; Huang, H.; Ren, Y.X.; Yue, Y.; Dolinar, S.; Tur, M.; et al. Terabit Free-Space Data Transmission Employing Orbital Angular Momentum Multiplexing. Nat. Photonics 2012, 6, 488–496. [Google Scholar] [CrossRef]
- Ng, J.; Lin, Z.F.; Chan, C.T. Theory of Optical Trapping by an Optical Vortex Beam. Phys. Rev. Lett. 2010, 104, 103601. [Google Scholar] [CrossRef]
- Lavery, M.P.J.; Speirits, F.C.; Barnett, S.M.; Padgett, M.J. Detection of a Spinning Object Using Light’s Orbital Angular Momentum. Science 2013, 341, 537–540. [Google Scholar] [CrossRef]
- Tamburini, F.; Anzolin, G.; Umbriaco, G.; Bianchini, A.; Barbieri, C. Overcoming the Rayleigh Criterion Limit with Optical Vortices. Phys. Rev. Lett. 2006, 97, 163903. [Google Scholar] [CrossRef]
- Vaziri, A.; Pan, J.W.; Jennewein, T.; Weihs, G.; Zeilinger, A. Concentration of Higher Dimensional Entanglement: Qutrits of Photon Orbital Angular Momentum. Phys. Rev. Lett. 2003, 91, 227902. [Google Scholar] [CrossRef]
- Gori, F.; Santarsiero, M.; Borghi, R.; Vicalvi, S. Partially Coherent Sources with Helicoidal Modes. J. Mod. Opt. 1998, 45, 539–554. [Google Scholar] [CrossRef]
- Cai, Y.; Zhu, S.-Y. Ghost Interference with Partially Coherent Radiation. Opt. Lett. 2004, 29, 2716–2718. [Google Scholar] [CrossRef]
- Zhao, C.; Cai, Y.; Lu, X.; Eyyuboğlu, H.T. Radiation Force of Coherent and Partially Coherent Flat-Topped Beams on a Rayleigh Particle. Opt. Express 2009, 17, 1753–1765. [Google Scholar] [CrossRef]
- Emma, P.; Akre, R.; Arthur, J.; Bionta, R.; Bostedt, C.; Bozek, J.; Brachmann, A.; Bucksbaum, P.; Coffee, R.; Decker, F.J.; et al. First Lasing and Operation of an Angstrom-Wavelength Free-Electron Laser. Nat. Photonics 2010, 4, 641–647. [Google Scholar] [CrossRef]
- Eriksson, M.; van der Veen, J.F.; Quitmann, C. Diffraction-Limited Storage Rings—A Window to the Science of Tomorrow. J. Synchrotron Radiat. 2014, 21, 837–842. [Google Scholar] [CrossRef] [PubMed]
- Huang, N.S.; Deng, H.X. Generating X-Rays with Orbital Angular Momentum in a Free-Electron Laser Oscillator. Optica 2021, 8, 1020–1023. [Google Scholar] [CrossRef]
- Sakdinawat, A.; Liu, Y. Soft-X-Ray Microscopy Using Spiral Zone Plates. Opt. Lett. 2007, 32, 2635–2637. [Google Scholar] [CrossRef]
- van Veenendaal, M.; McNulty, I. Prediction of Strong Dichroism Induced by X Rays Carrying Orbital Momentum. Phys. Rev. Lett. 2007, 98, 157401. [Google Scholar] [CrossRef]
- Wang, F.; Cai, Y.J.; Korotkova, O. Partially Coherent Standard and Elegant Laguerre-Gaussian Beams of All Orders. Opt. Express 2009, 17, 22366–22379. [Google Scholar] [CrossRef]
- Goodman, J.W. Introduction to Fourier Optics; Roberts and Company Publishers: Greenwood Village, CO, USA, 2005. [Google Scholar]
- Meng, X.; Xue, C.; Yu, H.; Wang, Y.; Wu, Y.; Tai, R. Numerical Analysis of Partially Coherent Radiation at Soft X-Ray Beamline. Opt. Express 2015, 23, 29675–29686. [Google Scholar] [CrossRef]
- Meng, X.; Shi, X.; Wang, Y.; Reininger, R.; Assoufid, L.; Tai, R. Mutual Optical Intensity Propagation through Non-Ideal Mirrors. J. Synchrotron Radiat. 2017, 24, 954–962. [Google Scholar] [CrossRef]
- Meng, X.Y.; Wang, Y.; Shi, X.B.; Ren, J.C.; Sun, W.H.; Cao, J.F.; Li, J.Q.; Tai, R.Z. Mutual Optical Intensity Propagation through Non-Ideal Two-Dimensional Mirrors. J. Synchrotron Radiat. 2023, 30, 902–909. [Google Scholar] [CrossRef]
- Ren, J.C.; Wang, Y.; Meng, X.Y.; Sun, W.H.; Cao, J.F.; Li, J.Q.; Tai, R.Z. Research on Partially Coherent Light Propagation through Zone Plates. Opt. Express 2021, 29, 40947–40956. [Google Scholar] [CrossRef]
- Kotlyar, V.V.; Almazov, A.A.; Khonina, S.N.; Soifer, V.A.; Elfstrom, H.; Turunen, J. Generation of Phase Singularity through Diffracting a Plane or Gaussian Beam by a Spiral Phase Plate. J. Opt. Soc. Am. A-Opt. Image Sci. Vis. 2005, 22, 849–861. [Google Scholar] [CrossRef] [PubMed]
- Orlov, S.; Regelskis, K.; Smilgevicius, V.; Stabinis, A. Propagation of Bessel Beams Carrying Optical Vortices. Opt. Commun. 2002, 209, 155–165. [Google Scholar] [CrossRef]
- Seiboth, F.; Kahnt, M.; Lyubomirskiy, M.; Seyrich, M.; Wittwer, F.; Ullsperger, T.; Nolte, S.; Batey, D.; Rau, C.; Schroer, C.G. Refractive Hard X-Ray Vortex Phase Plates. Opt. Lett. 2019, 44, 4622–4625. [Google Scholar] [CrossRef]
- Wang, F.; Zhu, S.J.; Cai, Y.J. Experimental Study of the Focusing Properties of a Gaussian Schell-Model Vortex Beam. Opt. Lett. 2011, 36, 3281–3283. [Google Scholar] [CrossRef]
- Lee, J.C.T.; Alexander, S.J.; Kevan, S.D.; Roy, S.; McMorran, B.J. Laguerre–Gauss and Hermite–Gauss Soft X-Ray States Generated Using Diffractive Optics. Nat. Photonics 2019, 13, 205–209. [Google Scholar] [CrossRef]
- Soskin, M.S.; Vasnetsov, M.V. Singular optics. In Progress in Optics; Wolf, E., Ed.; Elsevier: Amsterdam, The Netherlands, 2001; Volume 42, pp. 219–276. [Google Scholar]
- Kujala, N.; Marathe, S.; Shu, D.M.; Shi, B.; Qian, J.; Maxey, E.; Finney, L.; Macrander, A.; Assoufid, L. Kirkpatrick-Baez Mirrors to Focus Hard X-Rays in Two Dimensions as Fabricated, Tested and Installed at the Advanced Photon Source. J. Synchrotron Radiat. 2014, 21, 662–668. [Google Scholar] [CrossRef]
- Zhao, C.L.; Wang, F.; Dong, Y.; Han, Y.J.; Cai, Y.J. Effect of Spatial Coherence on Determining the Topological Charge of a Vortex Beam. Appl. Phys. Lett. 2012, 101, 261104. [Google Scholar] [CrossRef]
- Gbur, G.; Visser, T.D.; Wolf, E. ‘Hidden’ Singularities in Partially Coherent Wavefields. J. Opt. A-Pure Appl. Opt. 2004, 6, S239–S242. [Google Scholar] [CrossRef]
- Gbur, G.; Swartzlander, J.G.A. Complete Transverse Representation of a Correlation Singularity of a Partially Coherent Field. J. Opt. Soc. Am. B 2008, 25, 1422–1429. [Google Scholar] [CrossRef]
- Dong, M.; Zhao, C.L.; Cai, Y.J.; Yang, Y.J. Partially Coherent Vortex Beams: Fundamentals and Applications. Sci. China-Phys. Mech. Astron. 2021, 64, 224201. [Google Scholar] [CrossRef]
- Lu, X.Y.; Zhao, C.L.; Shao, Y.F.; Zeng, J.; Konijnenberg, S.; Zhu, X.L.; Popov, S.; Urbach, H.P.; Cai, Y.J. Phase Detection of Coherence Singularities and Determination of the Topological Charge of a Partially Coherent Vortex Beam. Appl. Phys. Lett. 2019, 114, 201106. [Google Scholar] [CrossRef]
- Zhao, Q.; Dong, M.; Bai, Y.; Yang, Y. Measuring High Orbital Angular Momentum of Vortex Beams with an Improved Multipoint Interferometer. Photonics Res. 2020, 8, 745–749. [Google Scholar] [CrossRef]
- Guo, C.-S.; Lu, L.-L.; Wang, H.-T. Characterizing Topological Charge of Optical Vortices by Using an Annular Aperture. Opt. Lett. 2009, 34, 3686–3688. [Google Scholar] [CrossRef]
- Prabhakar, S.; Kumar, A.; Banerji, J.; Singh, R.P. Revealing the Order of a Vortex through Its Intensity Record. Opt. Lett. 2011, 36, 4398–4400. [Google Scholar] [CrossRef]
Disclaimer/Publisher’s Note: The statements, opinions and data contained in all publications are solely those of the individual author(s) and contributor(s) and not of MDPI and/or the editor(s). MDPI and/or the editor(s) disclaim responsibility for any injury to people or property resulting from any ideas, methods, instructions or products referred to in the content. |
© 2025 by the authors. Licensee MDPI, Basel, Switzerland. This article is an open access article distributed under the terms and conditions of the Creative Commons Attribution (CC BY) license (https://creativecommons.org/licenses/by/4.0/).