Abstract
Laser additive manufacturing (AM) technology has become an important method for the manufacturing of high-performance aluminum alloy parts. However, the thermal effect of the molten pool and the defect formation mechanism are still the key issues restricting forming quality. To address this issue, this paper systematically investigates the effects of key parameters such as laser power and pulse frequency on the thermal conductivity, kinetic behavior, and defect control of the molten pool through multi-physics coupled numerical simulation to provide theoretical support for improving the quality of components. It is found that the laser power and pulse frequency play a key role in the molten pool morphology and defect generation, with too low a power leading to non-fusion and too high a power triggering overheating and cracking, and too low a frequency leading to unstable morphology and too high a frequency triggering grain coarsening and thermal stress cracking. The optimized process parameters (power 700–800 W, frequency 72–100 KHz) effectively improved the melt pool morphology and reduced the defects. This study reveals the intrinsic mechanism of melt pool dynamics and defect formation, which provides important instructions for optimizing the aluminum alloy additive manufacturing process.
1. Introduction
With the continuous development of manufacturing technology, the limitations of traditional subtractive manufacturing and forging processes, such as challenges in achieving high precision, efficiency, and the production of complex shapes, have become increasingly apparent [1,2,3,4]. These shortcomings fail to meet the modern industry’s stringent requirements for high-performance metal parts [5,6]. In response, additive manufacturing (AM) has emerged as a revolutionary technology that enables the precise shaping of complex components through the layer-by-layer stacking of materials [7]. Among AM methods, selective laser melting (SLM) stands out as a prominent approach, utilizing a high-power-density laser beam to melt and rapidly solidify metal powders, enabling precise control over microstructure and grain size [8,9,10,11,12,13,14]. This capability significantly enhances the mechanical properties, strength, and durability of materials, making SLM particularly advantageous for manufacturing high-performance metal parts, especially under extreme conditions [15].
Despite its advantages, SLM technology faces challenges arising from the complex kinetic behavior of the molten pool at high temperatures and energy densities [16,17]. Phenomena such as thermal convection, the Marangoni effect, recoil pressure, and surface tension interact in the molten pool, often leading to instabilities [18]. These instabilities can induce defects such as porosity, cracks, spheroidization, oxide inclusions, and residual stresses, which compromise the final product’s quality [19,20,21,22]. For example, numerical simulations by Zou et al. [1] revealed that the interplay between recoil pressure and surface tension is a critical factor for bubble formation, a key precursor to porosity. Such findings highlight the need to study and mitigate these defects to enhance SLM’s reliability and applicability.
Numerous researchers have investigated the relationship between processing parameters and melt pool behavior to optimize defect control. Zhang et al. [2], for instance, used computational fluid dynamics (CFDs) to analyze how Marangoni convection influences pore formation at high scanning speeds and low power densities. Similarly, Wu et al. [3] demonstrated that optimizing pulsed laser parameters can improve the microstructure and surface quality of parts. Other studies, such as those by Liu et al. [4] and Chen et al. [5], have emphasized the critical role of laser energy density and scanning speed in defect formation mechanisms, including porosity and cracks. These studies underscore the importance of understanding the thermal and fluid dynamics of the molten pool for process optimization.
Aluminum alloys, known for their lightweight properties, high strength, and excellent corrosion resistance, are widely used in industries such as aerospace, rail transportation, and construction. However, conventional manufacturing processes struggle with the precision and performance optimization required for complex geometries [23,24,25]. SLM offers a promising solution by enabling precise control over aluminum alloy microstructures and enhancing their strength, toughness, and reliability. Advances in numerical simulation have provided valuable insights into the molten pool’s thermodynamic behaviors, such as the Marangoni effect and recoil pressure, offering theoretical guidance for process improvement [26]. However, the high computational cost of such simulations remains a significant challenge for practical applications. In SLM, the evolution of the melt pool represents the shaping of the base material [27]. By controlling the position of the laser, the shape of a certain layer of material can be shaped, and thus it is melted and solidified layer by layer, bonding with the upper and lower layers [28,29,30].
For a more detailed study, this paper aims to address these challenges by combining numerical simulation with experimental methods to investigate the thermal effects and defect formation processes in the laser molten pool. Using a multi-physics coupling model developed in COMSOL, this study incorporates key phenomena such as the Marangoni effect and evaporation recoil to analyze the formation mechanisms of defects like porosity and their impact on the molten pool’s surface. The research further examines the influence of processing parameters on melt pool morphology, providing theoretical guidance for optimizing laser processing technology. By advancing the understanding of melt pool dynamics, this study contributes to the broader development of SLM technology for high-performance manufacturing applications.
2. Numerical Simulation and Thermal Effect Analysis
2.1. Thermal Effects and Phase Transition Phenomena
When a laser is directed at a metallic material, the metal surface absorbs the heat emitted by the laser, and the surface temperature then rises rapidly to form a molten pool. This process involves several thermal effects and phase transitions, including melting evaporation and subsequent solidification [31]. The high power of the laser causes the surface of the metal material to reach an extremely high temperature in a short period. As the temperature rises further toward the metal’s vaporization temperature, the material begins to vaporize and a downward recoil pressure is generated. This recoil pressure pushes the molten pool downward and deepens it, forming a structure similar to a ‘hole’. This phenomenon is very common in laser additive manufacturing, especially selective laser melting and laser cladding.
The process involves three modes of heat transfer. As shown in Figure 1. The first is thermal conduction, where the laser shines on the surface of the metal, the material absorbs the thermal energy of the laser, and the heat diffuses from the surface to the interior of the material through thermal conduction. The good thermal conductivity of the metal material allows the temperature gradient of the melt pool to change rapidly and significantly, and the heat diffuses in three dimensions through thermal conduction within the metal. The second is thermal radiation; when the temperature of the metal is higher than the ambient temperature, the metal surface releases energy to the surroundings through thermal radiation. The role of thermal radiation is especially obvious in the high-temperature stage, especially on the surface of the molten pool, and thermal radiation becomes one of the important ways of heat dissipation from the molten metal pool. The third is heat convection, which occurs when heat is dissipated via convection between the molten metal and the surrounding protective gas (e.g., argon) as the metal melts [31]. Especially on the upper surface of the melt pool, convective heat dissipation between the molten liquid metal and the protective gas will effectively take away part of the heat of the melt pool. This convection has a great influence on the stability and temperature uniformity of the melt pool. The thermal effects and phase transition phenomena are represented as follows:
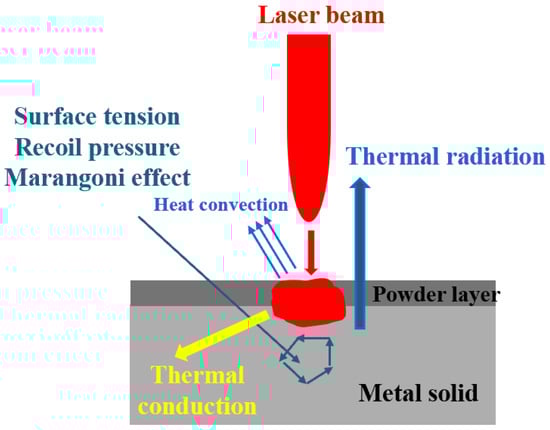
Figure 1.
Schematic diagram of the process of laser interaction with materials.
2.1.1. Mechanisms for Coupling Phase Transitions and Physical Effects
During selective laser melting (SLM), metallic materials undergo complex phase transition phenomena, including melting and solidification, and these processes are closely coupled with a variety of physical effects such as recoil pressure, surface tension, and the Marangoni effect. Laser heating causes a rapid increase in the surface temperature of the metal, above the melting point at which the material melts, and the subsequent cooling process leads to the solidification of the metal.
When the surface of a metallic material is irradiated with a high-intensity laser beam, the surface temperature rises rapidly, leading to the formation of a temperature gradient. Areas with a higher temperature have lower surface tension and areas with a lower temperature have higher surface tension. Due to the inhomogeneity of the surface tension, the metallic liquid flows along the surface from the region of lower surface tension to the region of higher surface tension. This is known as the Marangoni effect, which affects the shape and stability of the melt pool and intensifies bubble migration. The rapid increase in surface temperature causes the evaporation of the surface metal and the release of metallic gases close to the laser–material interaction zone. In addition, the metal vapor generated from the melt pool is much denser than the atmosphere, which leads to the condensation of the vapor particles on the upper surface and generates recoil pressure on the melt pool below [32]. When the laser stops heating, the temperature of the melt surface decreases, the recoil pressure is no longer present, and the liquid-phase metal surface is solidified and shaped by surface tension, etc., as shown in Figure 2.
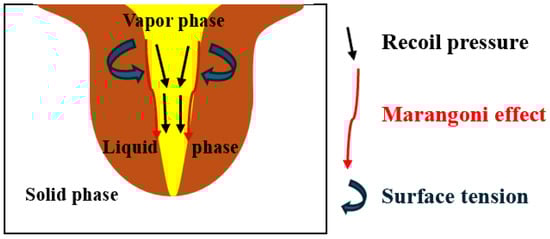
Figure 2.
Influence of forces on melt pool fluid flow.
The model is built based on the recoil pressure model proposed by Semak, as shown in Equation (1) [31]. In the calculation model, the actual recoil pressure is applied to the melt pool only when .
where denotes the incident laser energy. denotes the latent heat of evaporation. denotes the mass of the vapor molecule. denotes the surface temperature of the melt. denotes the thermal conductivity of the gas. denotes the gasification temperature. T denotes the temperature.
When the recoil pressure ceases to act, the surface tension becomes the only force on the surface of the melt pool, and the surface tension can be expressed as (2) and (3):
where denotes the flow velocity of the liquid-phase metal in the direction of . denotes the flow velocity of the liquid-phase metal in the direction of denotes the surface tension of the fluid.
During metal curing and forming, the force that affects metal forming is surface tension, and the temperature gradient during metal curing produces the Marangoni effect, which can be expressed as the shear stress on the upper surface of the melt pool. At this point, the forces at the liquid–gas interface combine in such a way that the shear stress is proportional to the surface temperature gradient, and Equation (4) [31] is added to the laminar flow module to represent the shear stress.
where denotes dynamic pressure. denotes the unit tensor. denotes the dynamic viscosity. denotes the velocity field. denotes the surface tension.
2.1.2. Governing Equation
The high-energy laser causes the metal powder to melt or evaporate in a short period, and many hydrodynamic behaviors occur in the melt pool. The main hydrodynamic behaviors in the melt pool are surface tension, the Marangoni effect, and recoil pressure. In this study, the liquid metal is considered a laminar incompressible Newtonian fluid, and its mass and momentum conservation equations can be expressed as follows:
where denotes the unit matrix. denotes the dynamic viscosity. denotes the transpose matrix. denotes the offset fluid velocity when the temperature is below the melting temperature. is the gravitational acceleration. denotes the tangential and normal vectors of surface tension. denotes temperature. denotes the melting temperature. denotes the coefficient of volume expansion of the liquid-phase metal [31].
The metal powder bed fusion process is a localized rapid melting and solidification process. With the rapid movement of the laser heat source, the temperature of the entire system changes over time and space, but throughout the process of spreading the temperature field of the melt pool, the energy changes and transfers are carried out simultaneously in a complete energy system, and this system needs to comply with the principle that the total energy does not increase and does not decrease, i.e., the energy shift is only embodied in the form of the shift. According to the laws of thermodynamics, this heat flow mutual coupling process is a nonlinear transient heat transfer process, and the main thermal behaviors occurring in the metal particles are convection, radiation, and vaporization heat loss. The heat conduction governing equation shown in Equation (7) is satisfied as follows:
where denotes temperature. denotes laser scan time. denotes the density. denotes the specific heat capacity. denotes the thermal conductivity. denotes the laser energy modeled by the heat source. denotes velocity vector. denotes convective heat dissipation. denotes radiative heat dissipation.
2.2. Model Modeling
2.2.1. Geometric Modeling
The laser–material interaction process is very complex. To observe more accurately the effect of the processing parameters on the molten pool, this paper first models a static laser single pulse on a two-dimensional axisymmetric sample, as shown in Figure 3. The equivalent of the two-dimensional model is shown in Figure 3a, where the metal material interaction zone during laser irradiation is equivalent to a rectangle of 6 mm in length and 3 mm in height, and a rectangle of 6 mm in length and 1.5 mm in height is set up as the gas-phase interaction zone.
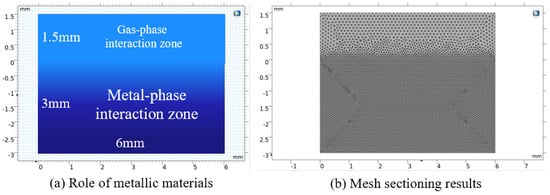
Figure 3.
Geometric model simplification.
In the process of analyzing the temperature distribution of the melt pool, the type of mesh in the finite element model will have a large impact on the results. Therefore, it is necessary to reasonably select the mesh type to match the material geometry of the melting model, so as not to affect the effect of the finite element mesh of the geometric model, and to avoid the simulation results of the temperature distribution of the molten pool not conforming to the actual characteristics of the temperature distribution of the molten pool in the laser melting process. Choosing a reasonable mesh type can also improve the calculation efficiency of the model.
The two-dimensional solid cell type is selected to construct the temperature distribution model of the molten pool of the working process based on the transient analysis method. The mesh needs to have the correct heat conduction characteristics, and at the same time, it needs to meet the basic requirements of reasonable delineation and efficient operation, and the results need to be in good conformity with the actual situation. The meshing operation can be carried out using the mesh generation module of the COMSOL 6.2 software. The mesh is selected according to the geometrical dimensions of the model. Triangular meshes are suitable for two-dimensional models, while tetrahedral meshes are suitable for three-dimensional models. Since this paper only needs to simulate the heat transfer of the melt pool on the 2D melt pool temperature field, the triangular mesh is chosen for the mesh type. In addition, the mode of model geometry mesh division will also have a greater impact on the analysis nodes of the simulation model, as well as the analysis efficiency. The smaller the mesh division, the finer the computational units of the model, the more accurate the analysis results, and the greater the increase in time required for model computation in relative terms. Considering the need to generate a large number of samples through the model, the model grid cannot be too small, due to the limitation of computer computing power. As shown in Figure 3b, the finite element mesh of the model is divided into the matrix and the preset powder layer. When setting up, the mesh of the upper pre-powder layer is densely divided, and the mesh at the junction of the pre-powder layer and the substrate is also very dense, which is conducive to a more detailed analysis of the heat conduction process in the upper layer. The mesh of the lower substrate away from the junction is sparser, which is conducive to improving the efficiency of the calculation.
2.2.2. Material Parameters
As a nonlinear heat transfer transient state analysis model, a melt pool is formed by melting the material with loaded laser energy. Due to the small diameter of the spot, there is a great temperature gradient around it, so during the movement of the laser spot, the temperature change in the material and the substrate is extremely obvious, and in this case, the properties of the material such as the heat transfer coefficient, the specific heat, and the density will also produce constant changes. Therefore, we need to consider the influence of these material properties on the temperature distribution of the melt pool. To more accurately simulate the melt pool temperature field distribution and morphological changes in the metal additive manufacturing process, this paper establishes the empty material in COMSOL Multiphysics, sets the material property parameters that are more affected by the temperature as the interpolation function, and adds the interpolation function to the self-constructed material library. The rest of the material property parameters, such as solid-phase line temperature and liquid-phase line temperature, etc., are set in the form of constants in the software and added to the self-constructed material library. Table 1 summarizes the material property parameters for 7075 aluminums alloys [33].

Table 1.
Material parameters of 7075 aluminum alloys.
2.2.3. Heat Source Model
To realize the simulation model in conditions close to the temperature distribution of the laser melting bath in real experiments, it is necessary to select and compare several existing feasible moving heat source models to make the simulation results of the model more in line with the requirements. The following three types of movable heat sources are commonly used [32].
- (1)
- Rosenthal’s resolving heat source
In the physical simulation of melt pool distribution, initially, the researchers used the Rosenthal analytical mode for the centralized heat source model description, where they replaced a moving laser spot with a heat source point with a centralized heat distribution, which is also known as Rosenthal’s analytical heat source. Its heat distribution is mainly described in Equations (8)–(10):
where is the air temperature around the lower substrate material in °C; is the total energy input in J; λ is the diffusivity; is the thermal conductivity; ν is the traveling speed of the spot in mm/s; is an integer constant; is the thickness of the material in mm; and is the positional coordinates of any point.
Rosenthal’s resolving heat source is suitable for a special case; the laser source is emitted at a distance from the upper surface of the powder, in which case the laser beam can be regarded as a parallel light source shining on the upper surface of the powder. However, the distance of the laser light source from the upper surface of the powder makes the temperature distribution of the melt pool from the model less consistent with the actual experimental results. Therefore, the Rosenthal analytical heat source has obvious shortcomings and is not suitable as a mobile heat source for the melt pool temperature distribution model.
- (2)
- Gaussian circular heat source
Researchers have improved the Rosenthal analytical heat source to obtain a new model of the heat source. The model uses a Gaussian distribution to fit the energy density distribution of the laser spot, so it is called a Gaussian circular heat source. For laser melting experiments, the laser heat source forms a laser spot with a diameter of several millimeters on the upper surface of the clad powder material and moves to scan it, with the heat flux at the center of the laser spot being the largest and decreasing towards the edges, which is consistent with a Gaussian circular heat source. Equation (11) can be used to describe the heat distribution of this Gaussian heat source:
where denotes the input laser heat flow. denotes the emissivity of the powder. σ denotes the Stephen Bolt. The blue indicating that the metal is in a low-temperature state, the red indicating that the metal is in a high-temperature state, and the gradient of the colors indicating the gradual change in the temperatures. As shown in Figure 4.
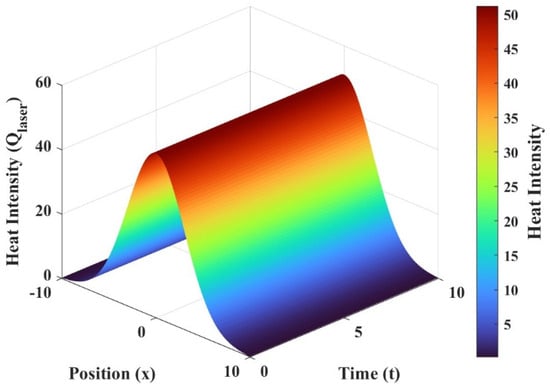
Figure 4.
Gaussian heat source distribution map.
Where denotes the laser power. denotes the scanning speed. denotes the scanning time. denotes the spot radius.
In this paper, an analytic function is designed to simulate the periodic transmission of laser pulses, as shown in Equation (12). The heat source can be set to pulse mode by adding this analytic function in COMSOL Multiphysics.
where indicates the pulse-on time. denotes the pulse-on frequency. denotes the rectangular wave. denotes the modular equation of the laser beam.
- (3)
- Double elliptic heat source
This model simulates the forward build-up of energy density from the phenomenon of ‘forward digging and stirring’ of the laser beam, and is mainly used for the analysis of three-dimensional heat sources, which tend to have a ‘forward’ distribution of energy density in the forward direction of travel.
As shown in Figure 5, the double elliptic heat source model has a ‘flat’ semi-ellipse in the front part and a relatively ‘slender’ semi-ellipse in the back part of the model. The length of the double elliptic heat source is , the width is , and the peak heat flux of the heat source is .
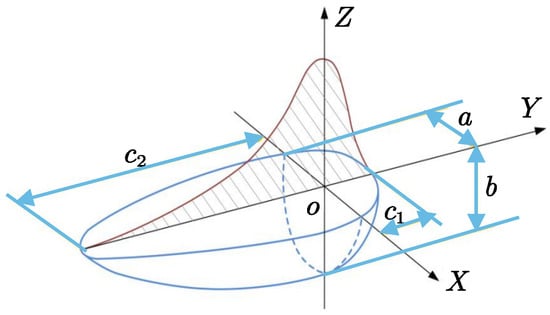
Figure 5.
Schematic diagram of heat flow distribution of double elliptic heat source.
By combining the laser scanning process and heat flow distribution law in the actual laser melting experiments and analyzing the above heat sources, it can be seen that the Rosenthal analytical heat source model is only suitable for the case where the distance between the emitting end of the laser source and the upper surface of the powder material is relatively far, which is unsuitable for the moving heat source in the melting pool temperature distribution model. The double elliptic heat source is used, which has a hysteresis energy density distribution characteristic along the scanning direction, and will obtain a larger laser melting pool than in the actual case. The double elliptic heat source has a lagging energy density distribution along the scanning direction, which results in a larger laser pool than the actual laser melting, so the model is not suitable for the simulation of the laser melting pool temperature field and is only suitable for the simulation of the laser welding pool. Hong [33] also mentions that the simulated pool shape of the double elliptic heat source is not more than 5% of the error of the actual pool shape in the arc welding. The Gaussian circular heat source is more suitable for this paper, which can produce a laser beam with a spot radius of 1.5 mm [33], and the energy is more concentrated, so it will not make the material and the substrate generate too large a molten pool by heating. Therefore, the Gaussian circular heat source, which has more concentrated energy and a shape of the light source plane in line with the requirements of the laser spot, is suitable to be used as a mobile light source for the simulation of the temperature distribution of the laser cladding molten pool in the simulation model of this paper. Meanwhile, in order to accommodate the process equipment, the laser radius was set to 0.15 mm in the simulation.
2.2.4. Initial and Boundary Condition Settings
In this section, the initial and boundary conditions of the metal additive manufacturing process are set according to the heat source model. At t = 0, the laser heat source starts to act on the material, and the initial temperature at this time is set as the ambient temperature in COMSOL Multiphysics, as shown in Equation (13):
T0 = 26
When the sample reaches thermal equilibrium, the sample surface conduction heat is equal to the sample surface and external convection transfer heat and sample surface radiation heat dissipation, minus the energy absorbed from the laser beam in this region, as shown in Equation (14):
The boundary conditions in the energy control equation for convective heat dissipation and radiative heat dissipation are calculated using the following Equations (15) and (16):
where is the convective heat transfer coefficient, is the ambient temperature, is the Stefan–Boltzmann constant, is the emissivity, and denotes the thermal conductivity.
2.3. Analysis of Numerical Simulation Results of Molten Pool Defect Generation
2.3.1. Two-Dimensional Melt Pool Evolution and Temperature Field Distribution
Metal additive manufacturing is characterized by high laser energy density and a small interaction area; the interaction zone between the laser and the material reaches a very high temperature in a short time, and the liquid-phase metal flows in all directions under the combined effect of surface tension and recoil pressure. The formation process of the metal additive manufacturing melt pool and the characteristics of the fluid flow are shown in Figure 6. There are two isotherms in the figure; the red one represents the liquidus temperature, and the green one represents the solidus temperature.
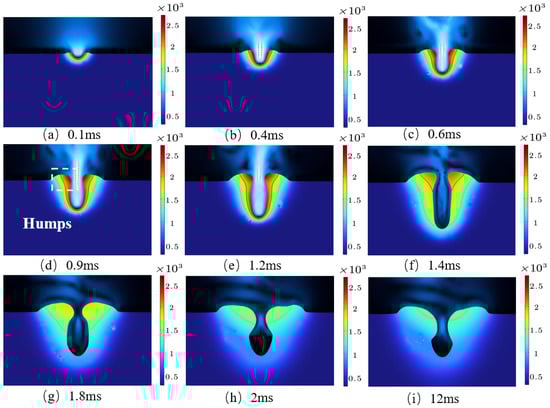
Figure 6.
Melt pool morphology at different moments.
The laser reaches the upper surface of the aluminum alloy metal at 0.1 ms, as shown in Figure 6a, the surface temperature of the molten pool is 843 K, which has not reached the melting point of the aluminum alloy metal, and the material is still in a solid state and has not started to melt. At 0.4 ms, due to the heat transfer of energy, the metal surface temperature continues to rise, as shown in Figure 6b. The surface temperature of the metal material is 1560 K, higher than the liquid-phase line temperature of the metal 1466 K, the solid-phase metal is melted to generate the liquid-phase metal, the temperature of the surface of the metal is high enough at this time and has produced a certain volume of liquid-phase metal, and metal samples of the center of the molten pool have been formed. As the temperature rises further, the liquid metal begins to gasify; the figure with arrows describes the movement of the gas-phase metal, as shown in Figure 6c. The gas-phase metal will produce the liquid-phase metal inside the molten pool of the recoil pressure and the liquid-phase metal will be subjected to the force of the movement of the liquid-phase metal to the surrounding area, resulting in the formation of the middle of the molten pool of the small holes. With the continuous irradiation of the laser, the size of the molten pool and the holes increases, the length of the molten pool becomes longer, and the depth of the molten pool deepens. At the time of 0.9 ms, the gas-phase metal increases, pushing the liquid-phase metal in the molten pool to flow, the flowing liquid-phase metal is in contact with the solid-phase metal and conducts heat, the molten metal is discharged from the interaction zone to the two sides, and the liquid-phase metal is piled up on the two sides of the surface, forming a ‘hump’-like shape, as shown in Figure 6d. With the continuous transfer of energy, the length of the molten pool becomes deeper and deeper. Due to the Gaussian distribution of the laser heat source, the temperature gradient on the metal surface increases and generates thermal stresses, and it is obvious that the upper surface of the metal material is no longer a flat straight line at 1.2 ms, the middle is higher than the two sides, and that with the increase in stress, the hump will become more and more obvious. Due to the formation of more and more liquid-phase metal, the surface tension of the liquid-phase metal is such that the liquid above the hole comes from both sides to the center of the bulge, as shown in Figure 6e. The liquid metal on the left and right sides of the upper part of the melt pool shows a tendency to meet, forming a gas cavity below the small hole, and a small amount of liquid-phase metal below is kept at the bottom of the melt pool by gravity. At this time, the laser is suddenly turned off and the temperature is immediately reduced. When the surface temperature is lower than the vaporization temperature, the recoil pressure disappears, and the liquid-phase metal is solidified and formed by gravity and surface tension, resulting in the phenomenon of the melt pool collapsing during the cooling process, as shown in Figure 6f–i.
In summary, recoil pressure, surface tension, gravity, and shear stress are the main factors that produce flow in a liquid melt pool. During the heating cycle, when the surface temperature is higher than the gasification temperature, the recoil pressure squeezes the molten material out of the laser–material interaction zone and the laser acts directly on the interior of the metallic material, thus further increasing the depth of the melt pool. When the temperature drops below the gasification temperature, the recoil pressure disappears, surface tension and gravity cause the molten material to move back to its original position, and the liquid metal gradually cools as the temperature decreases. Finally, the higher cooling rate and the shear stresses generated by surface tension together determine the solidification of the material into a certain shape.
2.3.2. Mechanism of Influence of Melt Pool Temperature Field on Defect Formation
In metal additive manufacturing processes, if the laser energy density is too small, the metal powder heat cannot be completely fused into the liquid metal, which will produce a powder not fused phenomenon, resulting in metal molding samples’ internal spherical defects or delamination defects, as shown in white circle in Figure 7a. If the laser energy density is too large, the metal temperature will instantly rise far beyond the evaporation temperature, the metal material produces a large amount of vapor, the melt pool behavior will become very complex, and at this time, unreasonable control of the laser heat will produce holes and other defects. A faster scanning speed may lead to the molten pool being cooled too quickly or failing to fully form a uniform metal layer, which may lead to cracks; and a slower scanning speed may make the molten pool overheat, resulting in localized areas of excessive melting and porosity. In this paper, these defects are summarized as two kinds. One is that the appearance of the metal sample has been shaped inside the small holes, cracks, and other defects, which will be collectively referred to as internal defects, and the other is that a part of the sample has been shaped to appear in the printing process of a layer of uneven and not polished defects, which will be collectively referred to as surface defects. The formation of surface defects is closely related to the location of internal defects (pores).
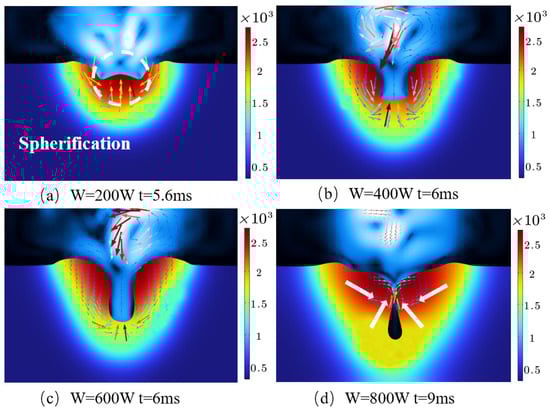
Figure 7.
Defect formation under different parameters.
Figure 7 shows the kinetic behavior of the molten pool as a function of laser power, revealing that high power may lead to internal porosity. We can see that during the SLM process, a depression region can be observed near the laser beam spot. When the metal evaporates, the huge recoil vapor pressure (blue arrows) exerts a downward force on the molten metal, forming a depressed zone. The molten metal is pushed towards the end of the melt track by the recoil vapor pressure and the Marangoni force, forming a large open locking hole. The molten metal on both sides of the melt flows towards the center of the cavity under surface tension and temperature gradient forces. This process is shown by the four white arrows in Figure 7d (the four white arrows form a combined force towards the center of the cavity). When the laser power is 2600 W, the lower heat input is not enough to melt the metal completely, and it is easy for spherical defects to be formed on the metal surface. At the same time, due to the low heat input, the depression area is shallow, indicating that the downward recoil pressure is weak at this time. As a result, we can only observe a small portion of molten metal flowing to the tail of the melt track. Surface tension reduces the homogeneity and continuity of the track, leading to the formation of spheroidization defects. As the laser power increases, the increase in heat input leads to more metal reaching the boiling point and the recoil pressure gradually dominating the flow of molten metal. The darker and more shapely downward velocity vectors close to the wall of the lock hole also show an increase in recoil pressure. The recessed area is deeper and more of the melt flows towards the tail of the melt trajectory. The large open locking hole formed at this point is still relatively large, preventing the molten metal from merging with the walls of the locking hole. At the same time, the melt also effectively fills the depression area, avoiding the possibility of pore defects inside the solidified specimen, as shown in Figure 7b,c.
When the laser power is increased to 3400 W, the amount of metal liquid increases, and the interaction and competition of various forces in the molten pool become more intense, resulting in unstable flow in the molten pool. Under strong recoil pressure and temperature gradient forces, a large amount of melt flows towards the lock hole wall, forming a deep and narrow open lock hole. As the laser beam continues to heat, this cycle becomes common and repeats itself. Under recoil, the molten metal on both sides of the locking hole wall eventually merges. This results in the formation of a closed bubble at the bottom of the locking hole, as shown in arrows of Figure 7d. Therefore, this deep and narrow geometry is one of the key factors contributing to the near-spherical pores in the solidified metal during the SLM process.
2.3.3. Influence of Porosity Location on Surface Defect Formation
Figure 8, Figure 9 and Figure 10 show the evolution of the defects at different locations of the melt pool when the gas cavity is located in the metal curing and forming, respectively. The black part indicates the gas cavity, the blue part indicates the cured metal, the color gradient zone at the edge indicates the solid–liquid melting zone, and the upper part of the figure is the indicator of the distribution of the temperature field, with the blue indicating that the metal is in a low-temperature state, the red indicating that the metal is in a high-temperature state, and the gradient of the colors indicating the gradual change in the temperatures.
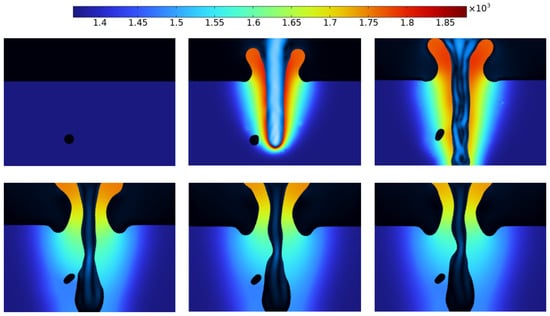
Figure 8.
Metal solidification process when the gas chamber is at the bottom of the bath.
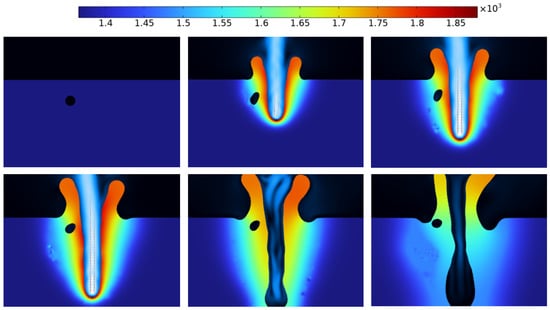
Figure 9.
Metal solidification process when the gas chamber is in the middle of the bath.
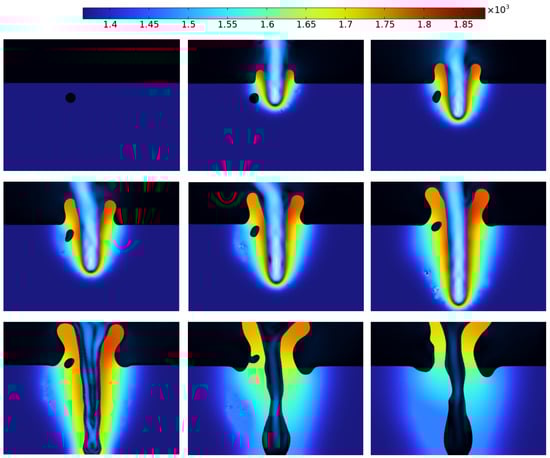
Figure 10.
Metal solidification process when the gas chamber is at the top of the bath.
Figure 8 shows the dynamic distribution of the gas cavity during the metal curing process when the gas cavity formation position is low. At this time, the laser radiation intensity is high, due to the recoil pressure, and the melt pool quickly forms small holes. As the laser continues to irradiate the metal material, the liquid melt pool inside the small holes becomes deeper and deeper, due to the higher density of metal vapor, and the metal vapor in the small holes inside the position also becomes deeper and deeper. When the laser stops completely, the gas cavity appears at the bottom of the molten pool. Due to the deep location of the gas cavities formed in the small holes, the gas cavities inside the liquid metal cannot reach the surface of the metal during the limited time for which the metal is curing, and pore defects are formed inside the molded sample as the metal cures.
Figure 9 shows the dynamic distribution of the gas cavity as the metal solidifies when the laser is completely stopped and a gas cavity is formed in the middle of the melt pool. At this time, the laser radiation intensity is high, the depth of the small holes created during laser irradiation is appropriate, and the gas cavity is located in the middle of the metal material. When the laser stops heating, due to the gas cavity formation position and the distance between the metal surface being more appropriate, the gas cavity can reach the metal surface in a limited period of time. When the gas cavity reaches the metal surface, the liquid metal continues to solidify the molding. However, if the laser stops heating at an inappropriate time at this time, it may result in the liquid-phase metal not being able to fill all of the gas cavity when the gas cavity reaches the metal surface, resulting in an uneven metal surface.
Figure 10 shows the process of solidification of the metal when the gas cavities in the melt pool are formed at a higher position. In this case, the laser intensity is low, the holes in the melt pool are shallow, and the gas cavities are formed at a high position. In the limited time after the laser is switched off, the gas cavity has enough time to reach the metal surface, and the liquid metal is cured directly without defects.
By simulating the position of the gas cavity in the process of defect formation, it was found that under the action of a high-power laser, a strong instability occurs in the melt pool solidification process. When the laser stops heating, a gas cavity is created during the melt pool collapse process, and the initial position of the gas cavity determines whether there is time to capture the bubbles along the front of the solidified metal or not. When the laser energy is too high, the temperature of the molten pool is too high, and the small holes become deeper under recoil pressure, the gas cavity is formed too low, and the gas cavity does not have enough time to reach the metal surface during solidification and forming, thus creating pore defects inside the metal sample. Therefore, the optimal melt pool shape and temperature field distribution under different process parameters can be obtained through several numerical simulations, to reasonably control the temperature of the melt pool, the depth of the small holes, and the position of the gas cavity formation, to reduce the defect rate of the molded samples.
3. Influence of Different Process Parameters on the Molten Pool
During selective laser melting (SLM), the behavior of the liquid metal phase is significantly affected by the laser power and pulse frequency. The temperature distribution, flow pattern, and phase transition behavior of the liquid metal phase can be described using the phase transition flow equations. These equations are capable of revealing the dynamic properties of the liquid metal phase in the melt pool by taking into account energy transfer, mass transfer, and momentum transfer.
Laser heating causes the rapid warming of the metal surface, which absorbs the laser energy and then gradually transfers the heat to the interior via heat conduction, radiation, and convection. In the liquid phase of the metal, the energy equation is integrated based on the previous article:
The flow behavior of liquid metal in a metal bath is influenced by factors such as temperature gradients and the Marangoni effect. The momentum equation describes the flow process of the liquid metal in the molten pool and is integrated based on the previous paper:
The solidification process of the liquid metal phase is also an important physical phenomenon in SLM. The phase transition process can be described using the phase transition equation, which is usually solved based on the temperature field and the latent heat of the phase transition:
where is the phase transition scalar for the solid–liquid phase, is the diffusion coefficient, and is the source phase of the phase transition to describe the behavior of the phase transition induced by temperature change.
From Equations (17)–(19) above, it can be concluded that high laser power ( leads to a rapid rise in molten pool temperature (), resulting in more metal transitioning into the liquid phase. However, excessively high laser power may cause the over-melting of the metal, generate vapor pressure, and lead to defects such as porosity or cracks. Conversely, low laser power may result in incomplete melting and the formation of unfused defects. From Equation (18) above, it can be concluded that temperature gradient-driven surface tension differences () affect the liquid metal mobility ( in the melt pool, which further affects the uniformity and cooling rate. From Equation (19) above, it can be concluded that the solidification process of liquid metal into solid metal is governed primarily by the temperature field and the latent heat of phase transition (). Furthermore, higher pulse frequencies can accelerate the response of the molten pool to laser heating, influencing the rates of heat accumulation and cooling. However, overly high pulse frequencies may prevent the effective cooling of the molten pool, causing overheating and grain coarsening, while excessively low frequencies may lead to rapid cooling, which impacts the quality of the melted metal and its formation. Thus, the analysis shows that laser power and pulse frequency critically affect the temperature field and dynamic behavior of the molten pool, and that the proper adjustment of these parameters is essential for optimizing melt pool quality and controlling defects.
3.1. Effect of Different Laser Powers on the Molten Pool
To investigate the effect of laser power on the temperature field distribution during molten pool formation, 11 different sets of simulation parameters were set. The laser power was increased from 2000 W to 4000 W in 200 W steps, the graphical data set was obtained from the results of the parametric scanning, and the time was increased from 0 to 15 s in 1 μs. The pulse width was set to 60 ms, and the laser heat source was transmitted repeatedly within 6 s.
To study the effect of laser power on the temperature field distribution of aluminum alloy metal samples in the metal additive manufacturing process, it is important to note that when a high-intensity laser irradiates the surface, about 60% of the laser energy will be reflected in the surface layer of the metal samples. When the surface temperature of the metal material rises, the reflectivity decreases sharply again, and when the surface temperature reaches the melt temperature, the reflectivity value is kept at a certain value. The reflectivity of the aluminum alloy material is set to be constant, as the metal temperature remains above the melting temperature during the printing process. The temperature versus time curve of the center node of the extracted metal surface throughout the process is shown in Figure 11.
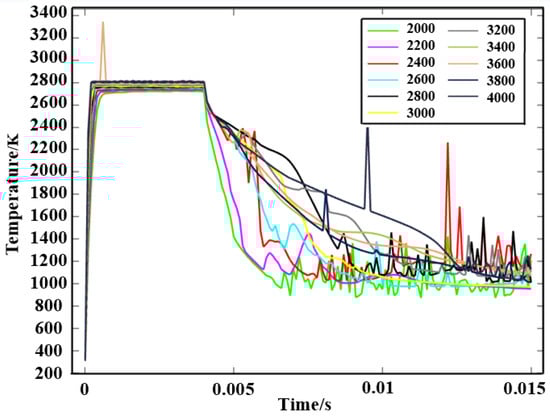
Figure 11.
Variation in the maximum temperature at the point of the surface under different laser powers.
Figure 11 shows the variation curve of the maximum temperature at the center point of the molten pool for different laser powers. The temperature rises during the period when the laser pulse is on and falls during the period when the laser pulse is off, and the temperature rises and falls repeatedly during the cycle. For the 3600 W curve, there is a distinct peak that does not match reality, so this could be due to an error perturbation in the computer calculations. By calculating the average maximum temperature for different laser powers, it can be obtained that the maximum temperature at the surface of the molten pool increases with the increase in the laser power under the condition of a certain pulse frequency.
The laser power is too small, as shown by the 2000 W and 2200 W temperature lines in Figure 11. The maximum temperature at the center of the surface during the whole process is always lower than the melting temperature of the stainless steel metal, and the upper surface of the metal material is unable to form a liquid melting pool, which in turn does not allow for the melt-curing process, leading to spheroidization defects and severely preventing the prototype from being shaped. As the laser power increases, the temperature exceeds the evaporation temperature of the aluminum alloy, the gas-phase metal forms a recoil pressure, the molten pool sinks downwards, the depth of the molten pool deepens further, and the heat can reach the bottom of the molten pool to fully melt with the metal material, increasing the overall temperature of the sample part. The change in laser power directly affects the change in the melt pool temperature, finishing the maximum temperature of the center point of the melt pool under the action of different laser power, as shown in Figure 12.
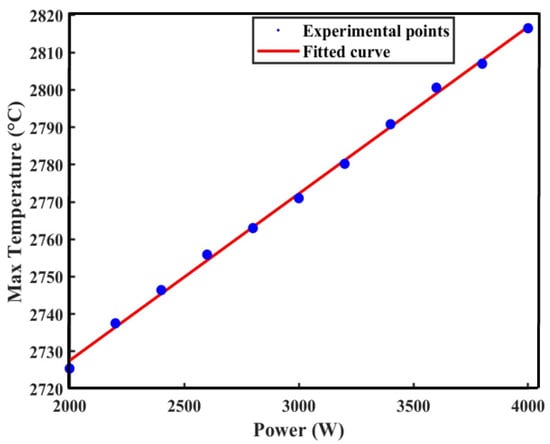
Figure 12.
Relation between laser power and maximum melt pool temperature.
Figure 12 shows the fitted curve of the temperature peak during pulsed laser application as a function of laser power during the metal additive manufacturing process. With the increase in laser power, the peak temperature during the whole laser processing period rises from 2725 K (2000 W) to 2816 K (4000 W), and the fitting function of laser power and molten pool temperature is T = 0.04P + 2638.15 (T: molten pool temperature, P: laser power) by directing the data of laser power and molten pool temperature to MATLAB 2023b, which shows a linear growth relationship. is 0.9982, proving that it shows a linear growth relationship.
Therefore, at the same pulse frequency, the laser power has an obvious positive correlation with the temperature of the molten pool surface. The highest temperature of the molten pool surface changes in a zigzag pattern with the switching of the pulsed laser, and the fitting results of temperature and laser power show a linear relationship. To ensure that the printing process can be carried out smoothly, the molten pool temperature should be higher than the melting point, so that the laser power can be as large as possible within a certain range.
3.2. Effect of Different Pulse Frequencies on the Molten Pool
To study the effect of different pulse frequencies on the temperature field and the distribution of the melt pool, the control variable method was used to select 3000 W as a fixed parameter within the laser power range determined in the previous section, and the pulse frequency was used as a single variable for numerical simulation. A two-dimensional model is used to study the distribution of the molten pool at different pulse frequencies from 66 KHZ to 200 KHZ in the single-layer melt channel metal additive manufacturing process. Figure 13 shows the melt pool formed by the pulse frequency from 66 KHZ to 200 KHZ at 14 ms, where the red contour is the solid-phase line temperature of aluminum alloy and the blue–black contour is the liquid-phase line temperature of aluminum alloy.
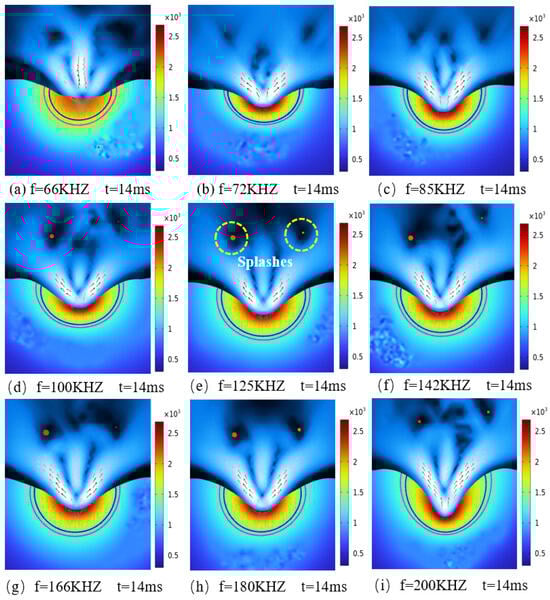
Figure 13.
Melt pool temperature field at different pulse frequencies.
It can be observed from Figure 13 that the faster the pulse frequency is, the more thermal energy is accumulated at each melting point per unit time, resulting in the depth and volume of the melt pool increasing and the temperature distribution becoming more uniform. As the pulse frequency increases, the maximum temperature of the melt pool gradually increases and the height and width of the melt pool expands. The increase in pulse frequency leads to higher fluctuation in the bath temperature, which affects the stability of the bath. A lower pulse frequency results in a relatively more stable bath temperature and avoids excessive heat build-up.
However, the pulsed heating process also leads to periodic fluctuations in the temperature field of the melt pool, which increases with higher pulse frequency, and this intensification of fluctuations affects the shape and stability of the melt pool. Figure 13d–i shows that the higher pulse frequency makes the temperature change in the melt pool more intense, and that the generation of the local overheating region often leads to the gasification phenomenon on the surface of the melt pool, which not only affects the morphology of the melt pool, but also may cause metal sputtering, which further reduces the surface quality of the processed parts. In addition, a high pulse frequency can lead to a large temperature difference between the rapidly rising temperature in the center of the bath and the lower temperature in the surrounding area, due to the short cooling time. This temperature difference can lead to the development of thermal stresses, which in turn can initiate cracks or other structural defects.
Therefore, the pulse frequency has a crucial influence on the melt pool morphology, temperature distribution, and defect formation. The reasonable selection of pulse frequency can not only optimize the morphology of the melt pool and reduce defects, but also improve the mechanical properties of the material. According to the results of the study, the preliminary selection of pulse frequencies of 72 KHZ, 85 KHZ, and 100 KHZ are appropriate.
3.3. Effect of Process Parameter Interactions on the Melt Pool
In practical production, laser power and pulse frequency are often complementary. If the pulse frequency is improperly selected when the pulse frequency is too fast to lead to the printing process not being carried out smoothly, by adjusting the laser power, the transient temperature of the printing process is often too high, the metal evaporation produces splash behavior, more defects will be produced in the molding sample, and the severe splash behavior will cause immeasurable damage to the processing. If the laser power is too low, resulting in insufficient laser energy conduction, too slow a pulse frequency will lead to too long a scanning time, and the production efficiency will be greatly reduced. Therefore, it is necessary to adjust the process parameters within a reasonable interval.
In this paper, the temperature field and shape distribution of the molten pool formed in 18 groups of different combinations of process parameters were compared. In addition, to apply the conclusions of this paper to engineering practice, the laser power scanning range of 600 W–900 W is finally selected by using the linear correlation in Section 3.1 and the gas-phase line temperature of aluminum alloy. Figure 14 shows the molten pool morphology under different combinations of process parameters on a large scale.
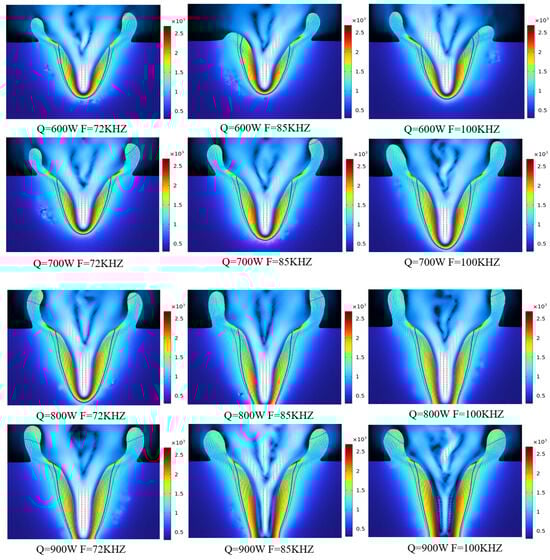
Figure 14.
Melt pool morphology under different combinations of processing parameters.
As shown in Figure 14, with the increase in laser power and pulse frequency, the metal splashing on both sides of the molten pool is abnormally obvious, and its longitudinal depth accounts for the gas-phase interaction zone increasing from 20% to 85% and even exceeding the gas-phase interaction zone. However, in the region of 700 W and 800 W, the metal splashing on both sides shows obvious instability, which indicates that the coupling of the laser power and the pulse frequency to the molten pool is obvious in the interactions of laser power and pulse frequency at this stage, and a small-scale analysis is carried out at this stage.
Table 2 lists the simulated melt pool temperature field and shape distribution of the melt pool under different combinations of small-scale process parameters in the metal additive manufacturing process, which is set for a metal material with a thickness of 3 mm and a length of 6 mm.
Table 2.
Melt pool parameters under different process parameters.
As can be seen from the simulation results in Table 2, the optimum pulse frequency corresponding to the laser power of 700 W, 720 W, and 740 W is 100 KHZ, at which time the depth of the molten pool formed is about 98% of the thickness of the molten pool, and it can be assumed that the laser can melt the metal material completely. The optimal pulse frequency for laser power 760 W and 780 W is 85 KHZ, at which time the laser energy can penetrate to the bottom of the metal material, reaching a depth of 99.6%, which will not cause delamination due to the temperature being too low for complete fusion, nor excessive remelting of the lower metal due to the temperature being too high. In addition, the optimal pulse frequency for laser power 800 W is 72 KHZ, and at 800 W laser power, higher temperature changes will penetrate the substrate.
According to the multi-process parameter matching simulation established by the simulation model, this paper proposes a multi-process parameter matching relationship for the metal additive manufacturing molding process. As shown in Figure 15, the blue region is a more reasonable region for multi-process parameter matching, which is established based on the fact that the lowest temperature must be higher than the melting point, and the highest temperature cannot be higher than the remelting temperature of the lower metal. In this area, there are several better-matched parameter lines, and the optimized values on the better lines are all reasonable. Subsequently, the process parameter matching database can be established by continuing to study the process parameter matching set, and the process parameters can be input within a reasonable range to predict the morphology and temperature of the molten pool and avoid possible defects.
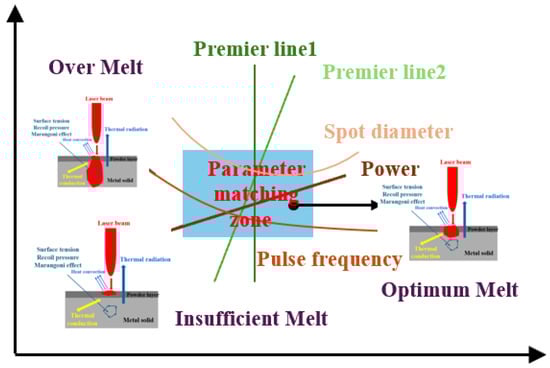
Figure 15.
Process parameter matching relationship diagram.
4. Conclusions
In this paper, the thermal effect, kinetic behavior, and defect formation mechanism of the molten pool in the process of selective laser melting (SLM) are systematically investigated through multi-physics coupled numerical simulation, focusing on the effects of laser power and pulse frequency on the morphology of the molten pool, the temperature distribution and the generation of defects, and proposing the optimization of the process parameters to improve the quality of the molding method.
The research shows the following:
1. Laser power: Too low a power value can lead to the insufficient melting of the melt pool and the formation of unfused defects. Too high a power value can cause overheating, cracking, and porosity. Optimized power ranges from 700 W to 800 W, which balances melt pool morphology and defect control;
2. Pulse frequency: Too low a frequency will lead to unstable melt pool morphology. Too high a frequency will lead to grain coarsening and thermal stress cracking. The optimized frequency range is 72 KHz–100 KHz, which helps to maintain the stability of melt pool temperature and morphology;
3. Defect formation mechanism: The study reveals that the coupling of the Marangoni effect and recoil pressure significantly affects the melt pool morphology and defect generation. The optimization of the process parameters can reduce porosity and surface spattering and improve the densification and mechanical properties of molded parts;
4. Bubble behavior: The recoil pressure drives the molten metal downward to form deep holes, the Marangoni effect triggers the lateral flow of liquid metal, and these dynamics together determine the dynamic trajectory of the bubbles. The optimization of the parameters directs the bubble migration to non-critical areas, thus effectively reducing pores and surface defects.
In the future, it is necessary to further study the integrated role of multiple parameters and develop real-time dynamic process adjustment methods to enhance the reliability and applicability of SLM technology in the manufacturing of high-performance metal parts.
Author Contributions
Conceptualization, Y.X. and X.P.; methodology, Y.X.; validation, S.L. (Shucheng Li) and X.Z.; formal analysis, H.L.; investigation, F.S.; data curation, S.Q.; writing—original draft preparation, Y.X.; writing—review and editing, S.L. (Shiqing Li); visualization, X.S.; supervision, B.W.; funding acquisition, X.P. All authors have read and agreed to the published version of the manuscript.
Funding
This work is supported by the National Natural Science Foundation of China (52305594); Natural Science Foundation of Hunan Province (2024JJ6460); China Postdoctoral Science Foundation Grant (2024M754299); Strategic Priority Research Program of the Chinese Academy of Sciences (XDA25020317); and Jiangxi Provincial Natural Science Foundation (20224BAB214053, 20242BAB25104).
Institutional Review Board Statement
Not applicable.
Informed Consent Statement
Not applicable.
Data Availability Statement
The data underlying the results presented in this paper are not publicly available at this time, but may be obtained from the authors upon reasonable request.
Conflicts of Interest
The authors declare no conflicts of interest.
References
- Zou, S.; Sui, F.; He, X.; Dai, K.; Xu, W.; Dong, C. A numerical study on the generation and migration of bubbles in laser powder bed fusion IN 718 alloy. Mater. Lett. 2023, 351, 135019. [Google Scholar] [CrossRef]
- Shi, L.; Wu, C.; Fu, L. Effects of tool shoulder size on the thermal process and material flow behaviors in ultrasonic vibration enhanced friction stir welding. J. Manuf. Process. 2020, 53, 69–83. [Google Scholar] [CrossRef]
- Wang, Y.; Qiu, L.; Zhao, W. High precision radially-polarized-light pupil-filtering differential confocal measurement. Opt. Laser Technol. 2016, 82, 87–93. [Google Scholar] [CrossRef]
- Podgornik, B.; Šinko, M.; Godec, M. Dependence of the wear resistance of additive-manufactured maraging steel on the build direction and heat treatment. Addit. Manuf. 2021, 46, 102123. [Google Scholar] [CrossRef]
- Chen, J.; Wang, C.; Peng, Y.; Zhao, W.; Li, J. Numerical simulation analysis of molten pool evolution in selective laser melting of 316L powder. Laser Technol. 2023, 43, 42–54. [Google Scholar]
- Ye, H.; Han, Q.; Lv, Q.; Pan, P.; An, J.; Yang, X. Monolithic integration of an InP-based 4 × 25 GHz photodiode array to an O-band arrayed waveguide grating demultiplexer. Opt. Laser Technol. 2017, 97, 290–296. [Google Scholar] [CrossRef]
- Szafrański, M.; Tylczyński, Z.; Wiesner, M.; Czarnecki, P.; Ghazaryan, V.; Petrosyan, A. Above-room-temperature ferroelectricity and piezoelectric activity of dimethylglycinium-dimethylglycine chloride. Mater. Des. 2022, 220, 110893. [Google Scholar] [CrossRef]
- Zhang, Y.; Lian, H.; Yang, G.; Zhao, S.; Ni, P.; Chen, H.; Li, C. Inaccurate-Supervised Learning with Generative Adversarial Net. IEEE Trans. Cybern. 2023, 53, 1522–1536. [Google Scholar] [CrossRef] [PubMed]
- Liu, S.; Wu, Z.; Zhou, W.; Zhou, H.; Zhang, K.; Yin, D.; Lei, Y.; Qiu, Y. A review of welding simulation methods for large components. Prog. Nat. Sci. Mater. Int. 2023, 33, 551–568. [Google Scholar] [CrossRef]
- Liu, Q.; Lu, W.; Wang, X. Effect of pulsed laser parameters on the formation of molten pool in laser surface melting of aluminum alloy. Surf. Andoatings Technol. 2018, 347, 68–76. [Google Scholar]
- Godino, L.; Pombo, I.; Girardot, J.; Sanchez, J.; Iordanoff, I. Modelling the wear evolution of a single alumina abrasive grain: Analyzing the influence of crystalline structure. J. Mech. Work. Technol. 2020, 277, 116464. [Google Scholar] [CrossRef]
- Erdemir, A.; Besier, T.F.; Halloran, J.P.; Imhauser, C.W.; Laz, P.J.; Morrison, T.M.; Shelburne, K.B. Deciphering the “Art” in Modeling and Simulation of the Knee Joint: Overall Strategy. J. Biomech. Eng. 2019, 141, 071002. [Google Scholar] [CrossRef]
- Fu, G.; Li, S.; Li, H.; Ren, Z.; Peng, Q.; Xiao, H.; Li, S. Numerical simulation of molten pool behavior and defect mechanisms in multi-track selective laser melting of copper alloys. Surf. Technol. 2024, 53, 118–128. [Google Scholar]
- Chen, H.; Wang, R.; Si, J.; Fang, S.; Yao, X.; Yan, M. Prediction of melt track width and molten pool temperature in laser powder bed fusion: A novel numerical model. Chin. J. Nonferrous Met. 2024, 34, 997–1009. [Google Scholar]
- Wang, X.; Zhang, T.; Xu, G.; Gong, Q. Numerical analysis of dynamic coupling behavior of keyhole and molten pool in rotary laser welding of aluminum alloys. Therm. Process. Technol. 2024, 53, 23–27. [Google Scholar]
- Peng, J.; Long, W.; Zhang, Y. Progress and analysis of numerical simulation of dynamic behavior of molten pool in laser welding. Electr. Weld. Mach. 2022, 52, 13–19. [Google Scholar]
- Qu, R.; Huang, L.; Xiao, D. Numerical simulation of molten pool evolution and metal spattering during selective laser melting. Acta Aeronaut. Sin. 2022, 43, 405–424. [Google Scholar]
- Li, H.; Fu, G.; Ren, Z.; Li, S.; Peng, Q.; Xiao, H.; Li, S. Numerical simulation of molten pool dynamics in multi-beam selective laser melting splicing regions. Surf. Technol. 2023, 52, 406–418. [Google Scholar]
- Luo, J.; Zhu, G.; Li, J.; Xie, G.; Wang, L.; Shi, S. Progress in numerical simulation of temperature and flow fields in laser cladding molten pool. Surf. Technol. 2023, 52, 67–84. [Google Scholar]
- Wang, Y.; Ji, X.; Liang, Y. Numerical simulation of temperature field in selective laser melting considering molten pool flow effects. Laser Technol. 2022, 42, 30–43. [Google Scholar]
- Qian, X.; Zhao, L.; Li, Z. Numerical simulation study on the influence of substrate temperature on molten pool characteristics in laser additive manufacturing. Chin. J. Comput. Mech. 2024, 41, 822–829. [Google Scholar]
- Xiong, A.; Ding, J.; Liu, Y.; Zhang, X.; Shao, S. Numerical simulation of laser cladding molten pool on titanium alloy surface. Laser Technol. 2019, 39, 381–386. [Google Scholar]
- Zhou, S.; Duan, R.; Su, Z.; Li, X. Numerical simulation analysis of surface tension-driven molten pool formation in laser welding of austenitic stainless steel thin plates. Electr. Weld. Mach. 2024, 54, 87–93. [Google Scholar]
- Chen, H.; Zhu, G.; He, J.; Wang, L. Numerical simulation of non-horizontal molten pool flow in laser powder internal feeding cladding with posture variation. Surf. Technol. 2024, 53, 190–199, 208. [Google Scholar]
- Xie, W.; Li, J.; Zhou, J.; Ji, X.; Yin, Y.; Zhang, S.; Duan, W.; Duan, X.; Dang, L. Numerical simulation of molten pool evolution in selective laser melting of IN718 alloy. Spec. Cast. Nonferrous Alloys 2024, 44, 490–495. [Google Scholar]
- Ouyang, Z.; Lu, G.; Guo, L.; Zhang, Q. Simulation analysis of temperature field in laser welding and calculation of molten pool depth. Laser Technol. 2018, 38, 52–57. [Google Scholar]
- Hu, B.; Lu, Y.; Chen, Y.; Liu, Y.; Hu, L.; Peng, J.; Yang, J. Research and numerical simulation of molten pool in laser welding of silicon steel sheets. Laser Optoelectron. Prog. 2024, 61, 261–271. [Google Scholar]
- Song, B.; Men, X.; Zhang, G.; Pan, Y.; Li, Y.; Jiang, Z.; Fu, X. Research progress on molten pool dynamics and defect control in laser cladding. Surf. Technol. 2024, 53, 71–91. [Google Scholar]
- Liu, Q.; Yuan, M.; Hua, M.; Meng, H.; Gao, S. Geometric evolution of single-track molten pool in selective laser melting of 316L stainless steel. Precis. Form. Eng. 2023, 15, 128–136. [Google Scholar]
- Long, Y.; Shi, K.; Zhao, W.; Dai, D.; Gu, D. Thermodynamic numerical simulation of molten pool in laser powder bed fusion of aluminum alloys. Spec. Cast. Nonferrous Alloys 2022, 42, 1082–1086. [Google Scholar]
- Yao, Y. Research on numerical simulation and defect detection in metal additive manufacturing molten pool. Metall. Met. Process. 2022, 87, 122–233. [Google Scholar]
- Guo, Y. Research on modeling method for predicting temperature distribution model of laser cladding molten pool based on deep learning. Metall. Met. Process. 2021, 89, 33–99. [Google Scholar]
- Hong, X.L.; Huang, B.S.; Li, T.N.; Huang, S.Y. Research progress on several common welding process heat source models. J. Mater. Heat Treat. 2023, 44, 25–38. [Google Scholar]
Disclaimer/Publisher’s Note: The statements, opinions and data contained in all publications are solely those of the individual author(s) and contributor(s) and not of MDPI and/or the editor(s). MDPI and/or the editor(s) disclaim responsibility for any injury to people or property resulting from any ideas, methods, instructions or products referred to in the content. |
© 2025 by the authors. Licensee MDPI, Basel, Switzerland. This article is an open access article distributed under the terms and conditions of the Creative Commons Attribution (CC BY) license (https://creativecommons.org/licenses/by/4.0/).