Laser Linewidth Measurement Using an FPGA-Based Delay Self-Homodyne System

 ,
,  ,
,  and
and 
Abstract
1. Introduction
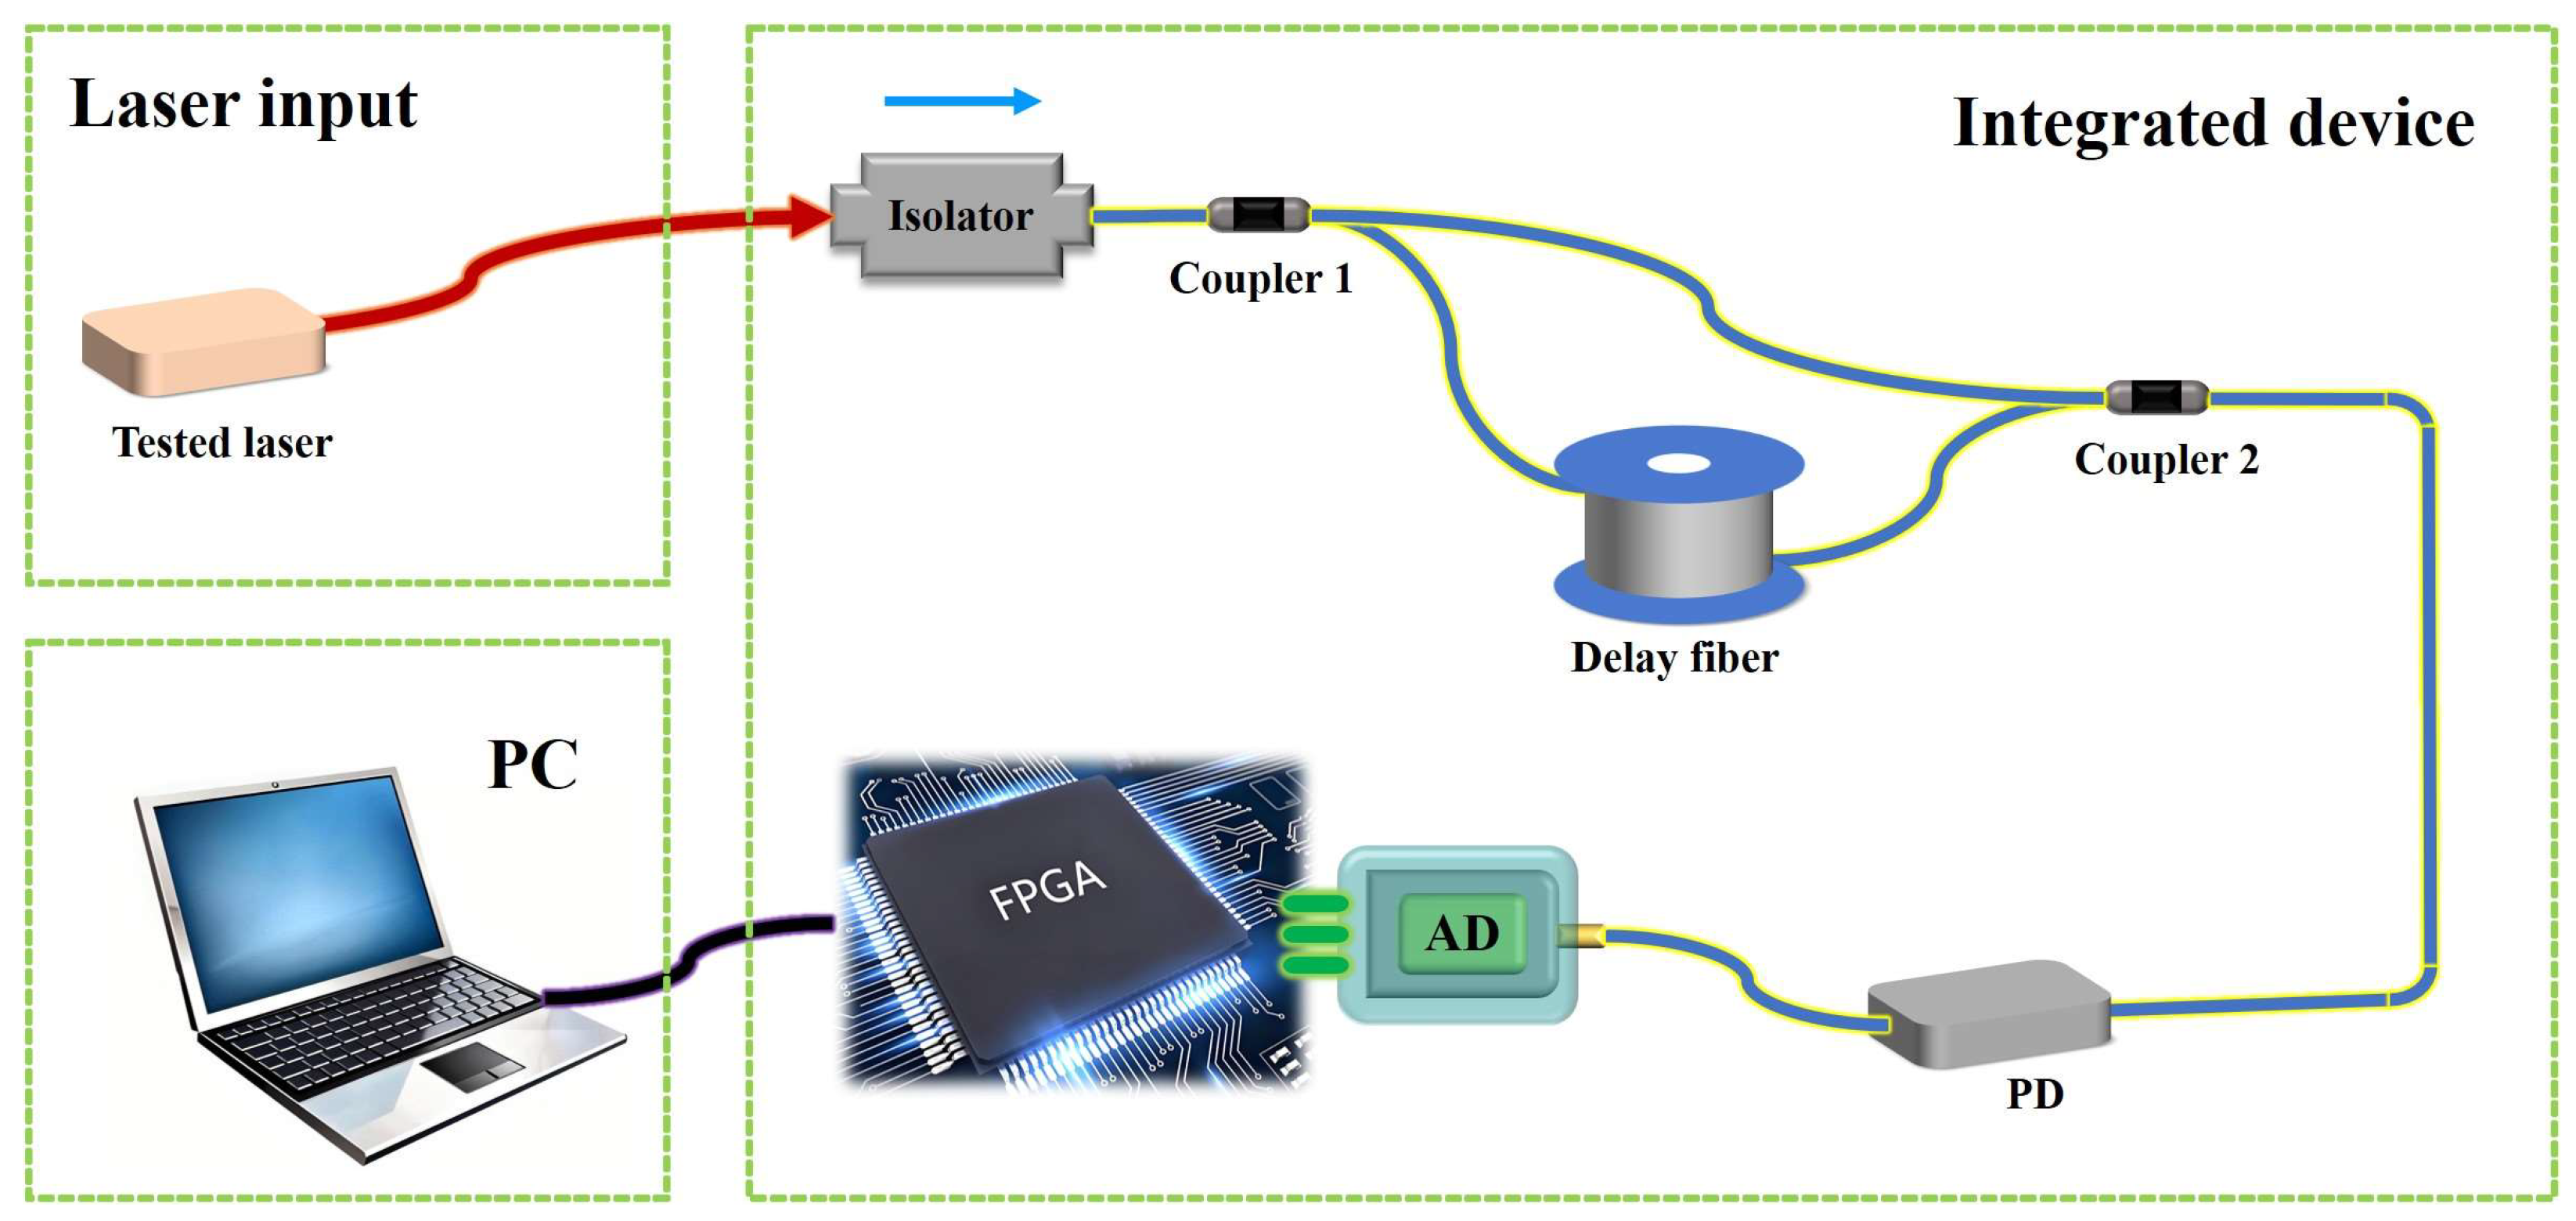
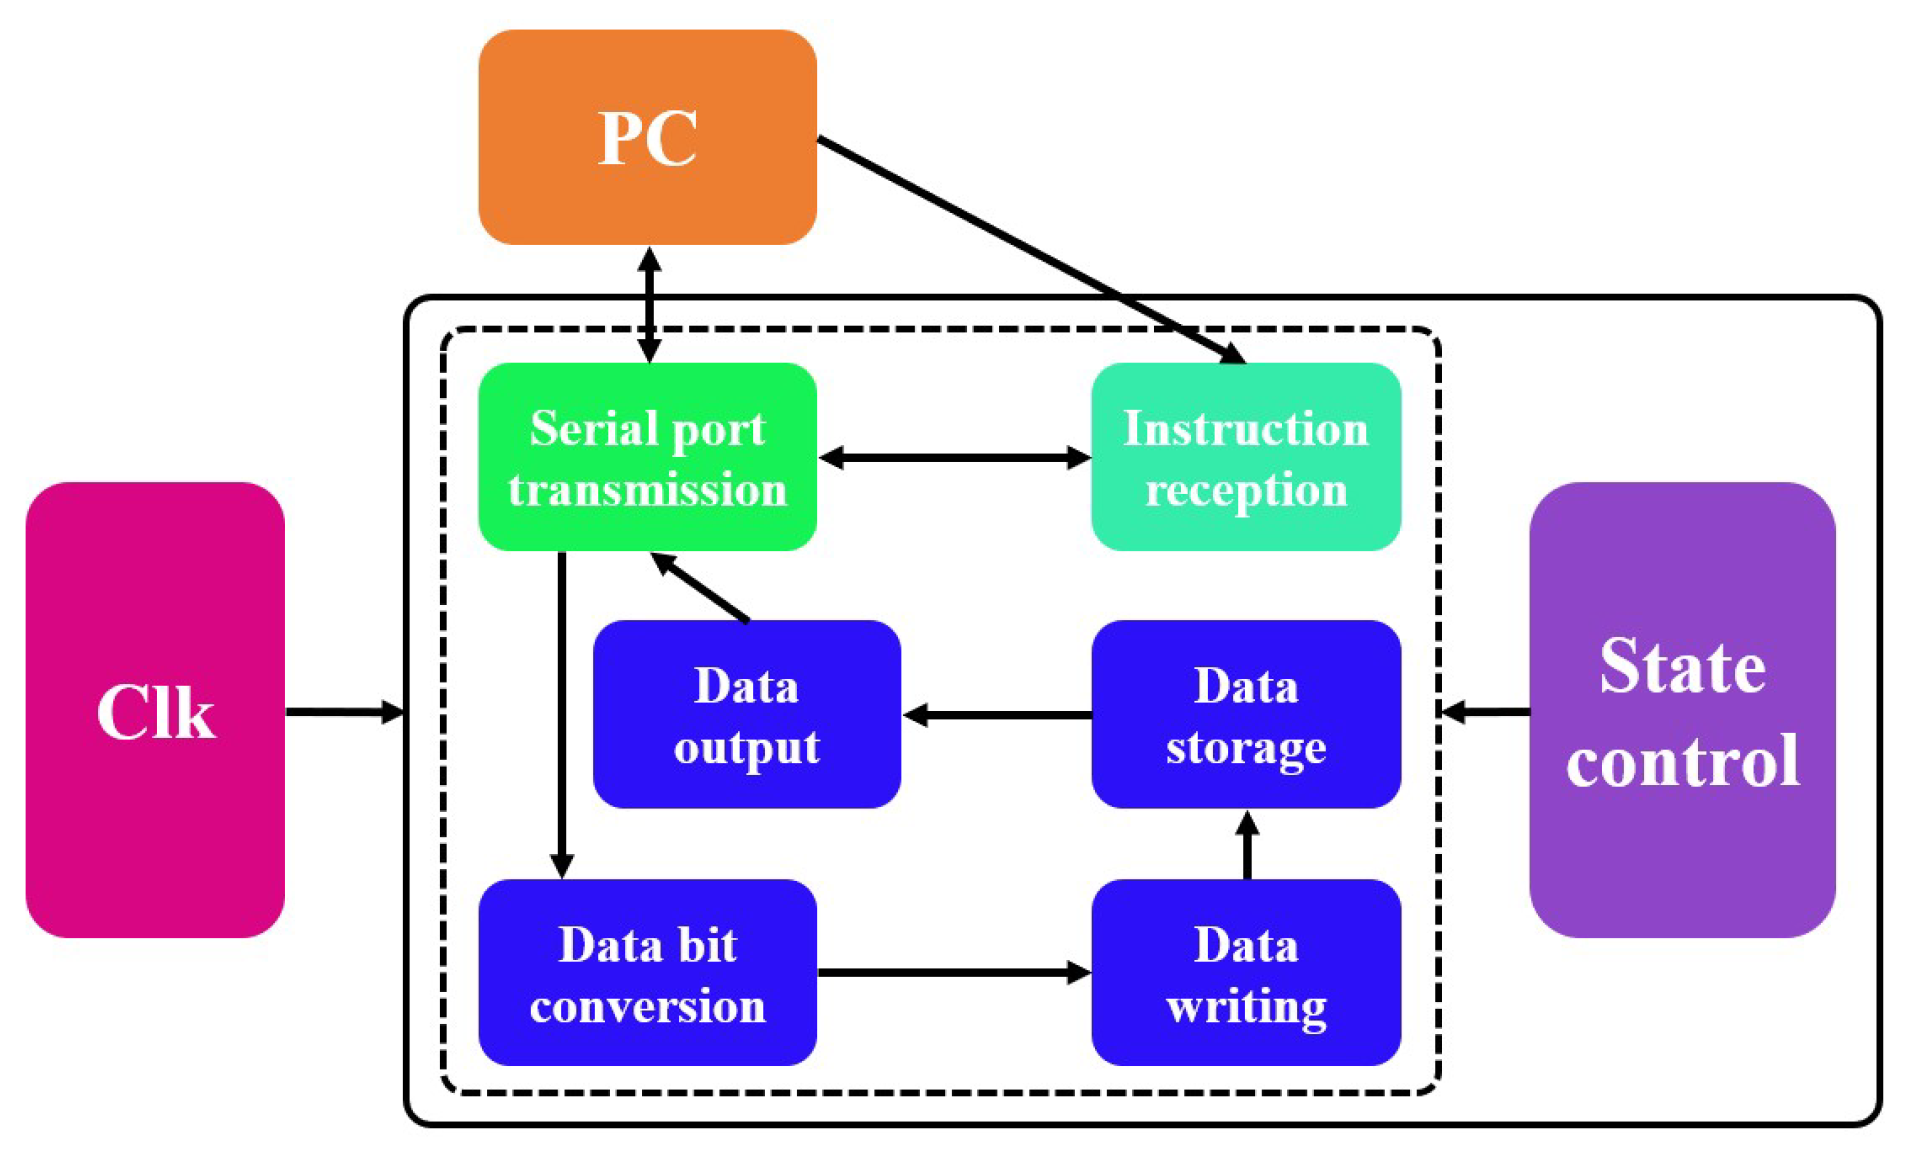
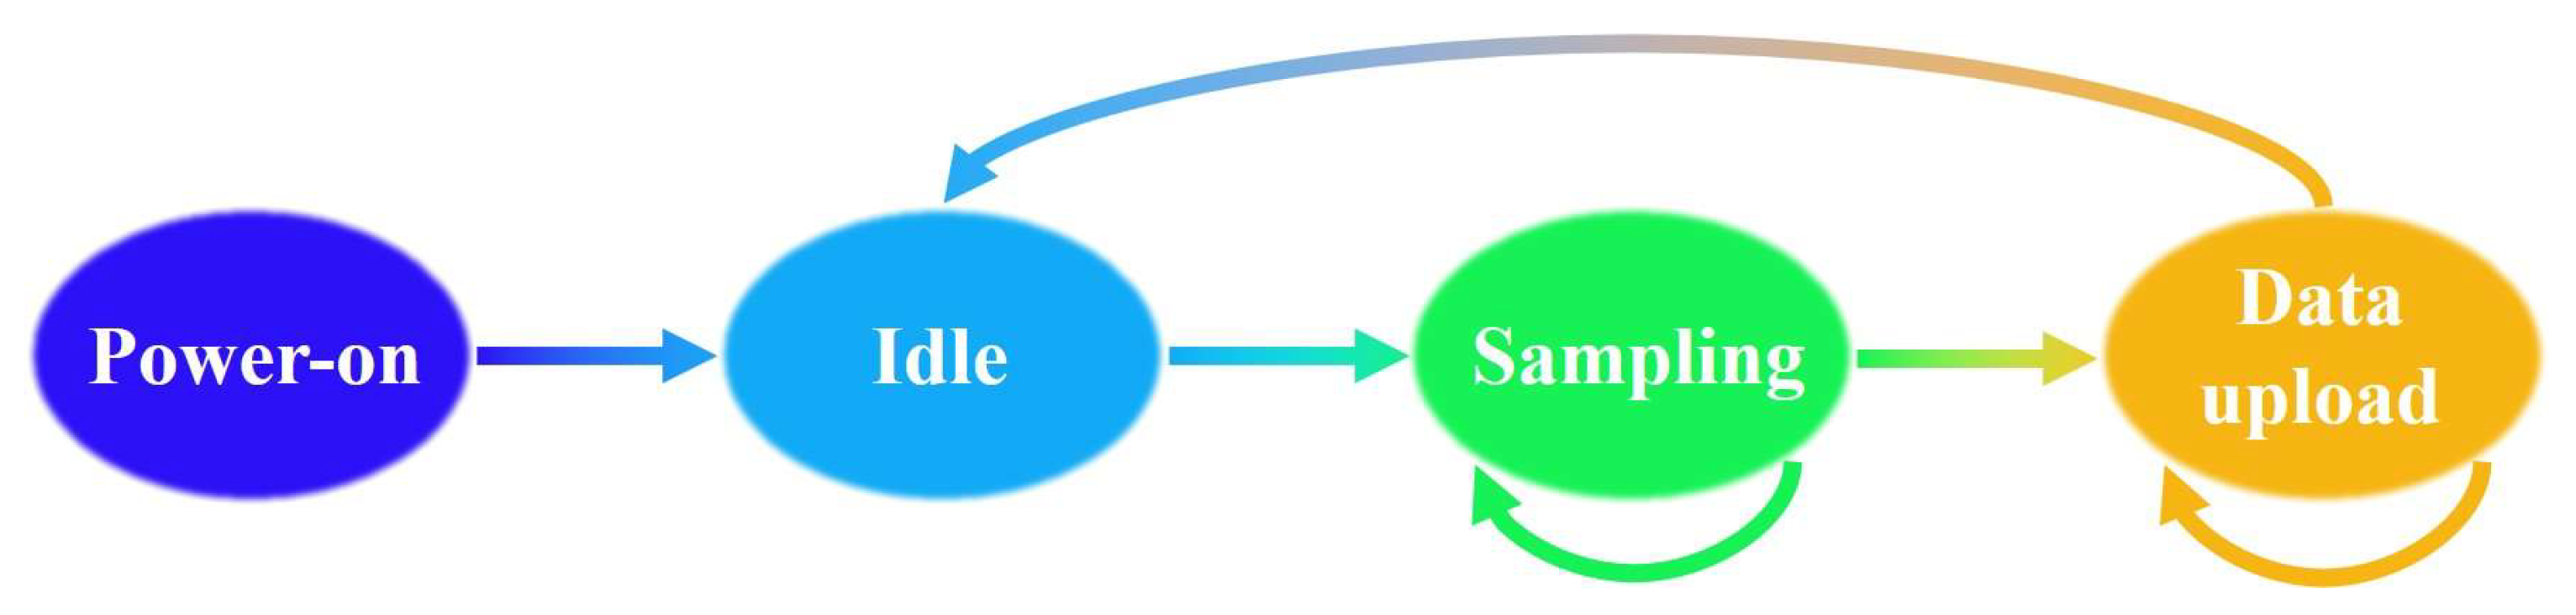
2. Experimental Setup and Principles
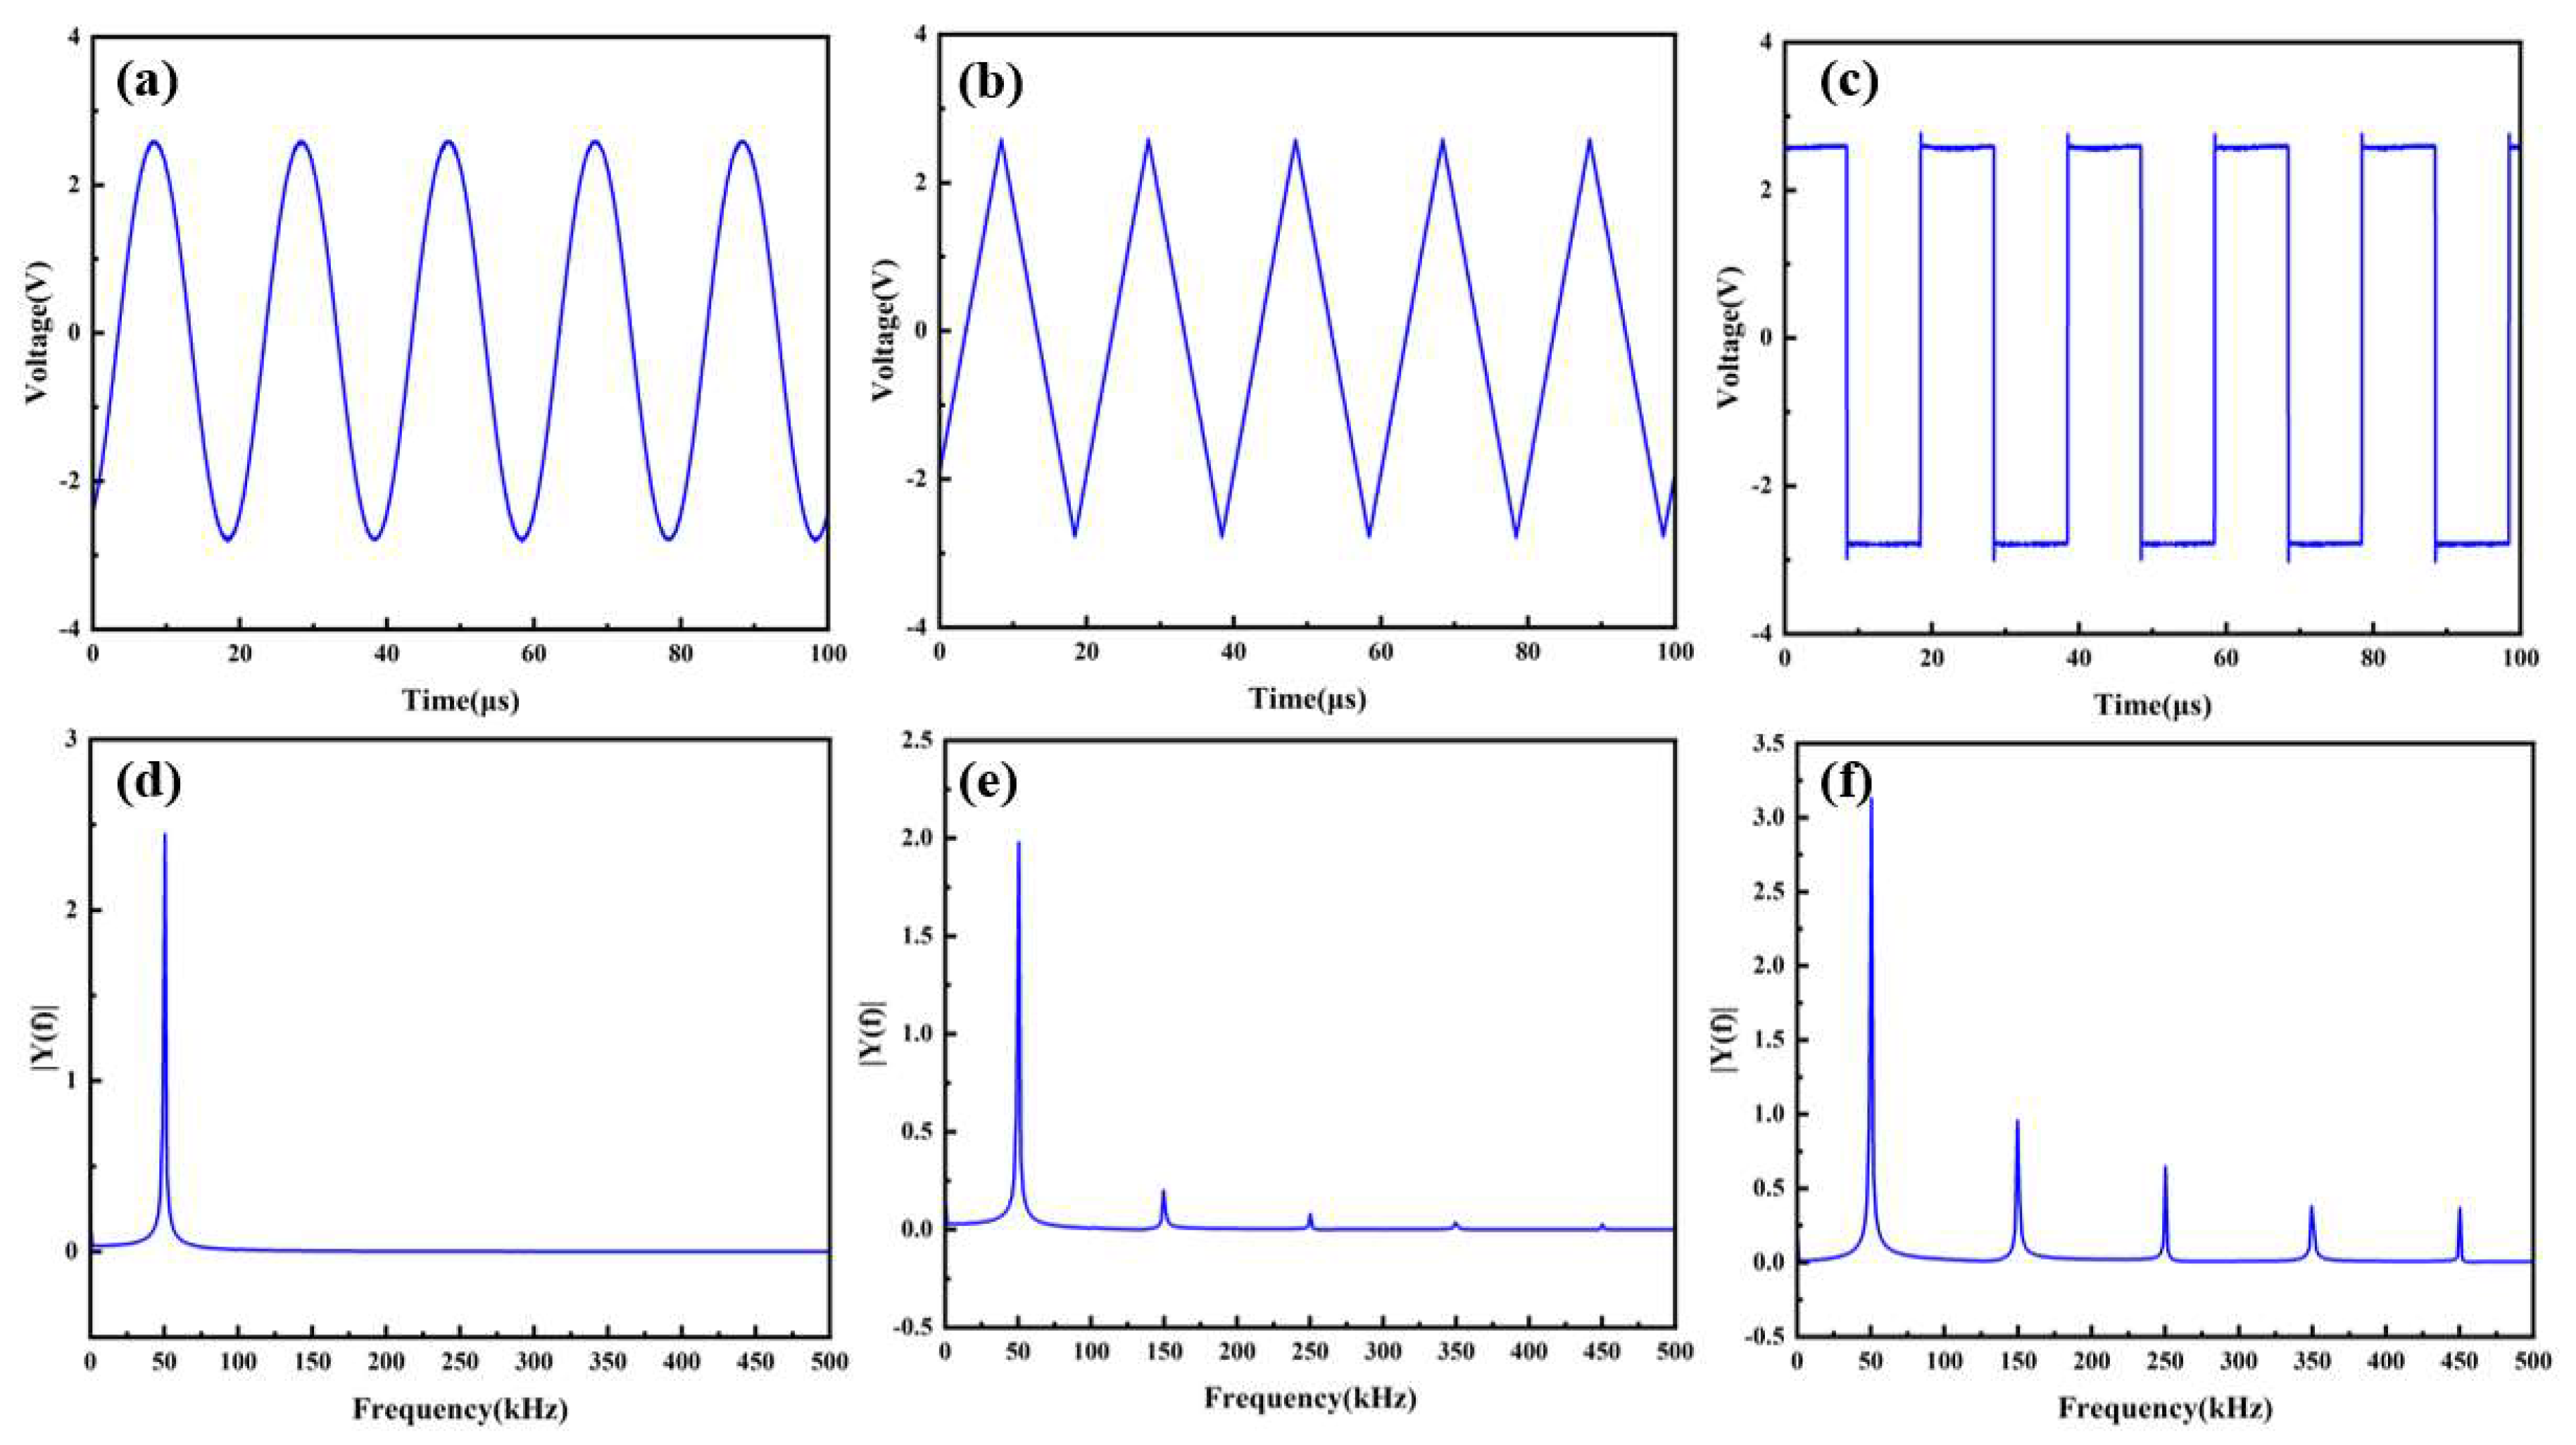
3. Experimental Results and Analysis
4. Conclusions
Author Contributions
Funding
Institutional Review Board Statement
Informed Consent Statement
Data Availability Statement
Conflicts of Interest
References
- Bai, Z.; Zhao, Z.; Tian, M.; Jin, D.; Pang, Y.J.; Li, S.; Yan, X.; Wang, Y.; Lu, Z. A comprehensive review on the development and applications of narrow-linewidth lasers. Microw. Opt. Technol. Lett. 2022, 64, 2244–2255. [Google Scholar] [CrossRef]
- Wen, H.; Zhai, Y.Q.; Lu, B.L.; Chen, H.W. Single-Longitudinal Mode Ytterbium-Doped Fiber Laser with Ultra-Narrow Linewidth and High OSNR Using a Double-Ring Passive Subcavity. Photonics 2023, 10, 500. [Google Scholar] [CrossRef]
- Zhao, J.Y.; Zhang, L.L.; Li, Y.; Wang, J.M. Improving 795 nm Single-Frequency Laser’s Frequency Stability by Means of the Bright-State Spectroscopy with Rubidium Vapor Cell. Photonics 2024, 11, 1165. [Google Scholar] [CrossRef]
- Zhang, G.J.; Cen, Q.Z.; Hao, T.F.; Yin, X.J.; Zi, X.Z.; Shi, N.N.; Li, W. Self-Injection Locked Silica External Cavity Narrow Linewidth Laser. J. Light. Technol. 2023, 41, 2474–2483. [Google Scholar] [CrossRef]
- Guesmi, K.; Bahloul, F.; Semaan, G.; Meng, Y.C.; Salhi, M.; Sanchez, F. Widely tunable, narrow line width and low optical noise continuous-wave all fiber Er:Yb co-doped double-clad ring laser. J. Opt. 2016, 19, 015501. [Google Scholar] [CrossRef]
- Sato, K.; Kondo, Y.; Nakao, M.; Fukuda, M. 1.55-μm narrow-linewidth and high-power distributed feedback lasers for coherent transmission systems. J. Light. Technol. 1989, 7, 1515–1519. [Google Scholar] [CrossRef]
- Bai, Z.; Zhao, Z.; Qi, Y.; Ding, J.; Li, S.; Yan, X.; Wang, Y.; Lu, Z. Narrow-linewidth laser linewidth measurement technology. Front. Phys. 2021, 9, 768165. [Google Scholar] [CrossRef]
- Zhao, Z.; Bai, Z.; Jin, D.; Chen, X.; Qi, Y.; Ding, J.; Yan, B.; Wang, Y.; Lu, Z.; Mildren, R.P. The influence of noise floor on the measurement of laser linewidth using short-delay-length self-heterodyne/homodyne techniques. Micromachines 2022, 13, 1311. [Google Scholar] [CrossRef]
- Zheng, Z.; Luo, Q.; Wang, X.; Ma, X.; Zhang, W.; Fang, W.; Chen, X.; Huang, S.; Zhou, Y.; Gao, W. Comparison of different linewidth measuring methods for narrow linewidth laser. Sensors 2022, 23, 122. [Google Scholar] [CrossRef]
- Huang, S.; Zhu, T.; Liu, M.; Huang, W. Precise measurement of ultra-narrow laser linewidths using the strong coherent envelope. Sci. Rep. 2017, 7, 41988. [Google Scholar] [CrossRef]
- Ayalew, H.D. Narrow-Linewidth Compound Ring Fiber Laser Using HBF as a Feedback for Sensing and Communication Application. In Advances of Science and Technology; Springer: Cham, Switzerland, 2022; pp. 173–183. [Google Scholar]
- Rossi, L.; Marini, D.; Bastianini, F.; Bolognini, G. Analysis of enhanced-performance fibre Brillouin ring laser for Brillouin sensing applications. Opt. Express 2019, 27, 29448–29459. [Google Scholar] [CrossRef] [PubMed]
- Chen, H.; Bai, Z.; Chen, J.; Li, X.; Zhu, Z.H.; Wang, Y.; Omatsu, T.; Mildren, R.P.; Lu, Z. Diamond Raman Vortex Lasers. ACS Photonics 2025, 12, 864–869. [Google Scholar] [CrossRef]
- Tan, W.; Wang, Y.; Chen, P.; Chen, R.; Zhu, S.; Yin, H.; Li, Z.; Chen, Z.; Dai, S. High average power nanosecond pulsed single longitudinal mode diamond Raman laser in the 1.6 µm waveband. Funct. Diam. 2024, 4, 2423623. [Google Scholar] [CrossRef]
- Chen, M.; Meng, Z.; Wang, J.F.; Chen, W. Ultra-narrow linewidth measurement based on Voigt profile fitting. Opt. Express 2015, 23, 6803–6808. [Google Scholar] [CrossRef]
- Ahmadi, M.; Dutta, T.; Mukherjee, M. Scalable narrow linewidth high power laser for barium ion optical qubits. Opt. Express 2024, 32, 17879–17892. [Google Scholar] [CrossRef]
- Cui, M.; Huang, J.; Yang, X. Research review on laser linewidth measurement methods. Prog. Laser Optoelectron. 2021, 58, 70–97. [Google Scholar]
- Chen, J.Q.; Chen, C.; Sun, J.J.; Zhang, J.W.; Liu, Z.H.; Qin, L.; Ning, Y.Q.; Wang, L.J. Linewidth Measurement of a Narrow-Linewidth Laser: Principles. Methods, and Systems. Sensors 2024, 24, 3656. [Google Scholar] [CrossRef]
- Li, L.; Zhao, Z.; Yu, Q.; Sheng, L.; Qi, Y.; Ding, J.; Yan, B.; Wang, Y.; Lu, Z.; Bai, Z. Multistage cyclic filtering system utilizing a single-longitudinal-mode Brillouin fiber laser with a fiber ring and reflective saturable absorber. Opt. Commun. 2025, 577, 131434. [Google Scholar] [CrossRef]
- Zhang, C.; Huang, L.; Guan, T.; Mao, Y.; Dang, L.; Lan, T.; Shi, L.; Gao, L.; Zhu, T. Laser coherence linewidth measurement based on deterioration of coherent envelope. Opt. Laser Technol. 2024, 172, 110498. [Google Scholar] [CrossRef]
- Zhao, Z.; Bai, Z.; Jin, D.; Qi, Y.; Ding, J.; Yan, B.; Wang, Y.; Lu, Z.; Mildren, R.P. Narrow laser-linewidth measurement using short delay self-heterodyne interferometry. Opt. Express 2022, 30, 30600–30610. [Google Scholar] [CrossRef]
- Li, Y.; Wang, Z.; Qin, Y.; He, S.; Gao, M.; Liang, H.; Liu, X.; Jiang, X.; Liu, Q. Kalman filtering-enhanced short-delay self-heterodyne interferometry for linewidth measurement. Opt. Lett. 2023, 48, 3793–3796. [Google Scholar] [CrossRef] [PubMed]
- Dúill, Ó.P.S.; Barry, P.L. Simplified Laser Frequency Noise Measurement Using the Delayed Self-Heterodyne Method. Photonics 2024, 11, 813. [Google Scholar] [CrossRef]
- Turner, L.D.; Weber, K.P.; Hawthorn, C.J.; Scholten, R.E. Frequency noise characterisation of narrow linewidth diode lasers. Opt. Commun. 2002, 201, 391–397. [Google Scholar] [CrossRef]
- Zhang, X.; Yang, F.; Feng, Z.; Wei, F.; Cai, H.; Qu, R. Narrow-linewidth swept laser phase reconstruction and noise measurement technology and its applications. Opt. Express 2018, 26, 32958–32970. [Google Scholar] [CrossRef] [PubMed]
- Wang, P.; Wang, M.Z.; David, Z. A compound pressure signal acquisition system for multichannel wrist pulse signal analysis. IEEE Trans. Instrum. Meas. 2014, 63, 1556–1565. [Google Scholar] [CrossRef]
- Cummings, M.; Haruyama, S. FPGA in the software radio. IEEE Commun. Mag. 1999, 37, 108–112. [Google Scholar] [CrossRef]
- Monmasson, E.; Cirstea, M.N. FPGA design methodology for industrial control systems—A review. IEEE Trans. Ind. Electron. 2007, 54, 1824–1842. [Google Scholar] [CrossRef]
- Cong, J.; Ding, Y. FlowMap: An optimal technology mapping algorithm for delay optimization in lookup-table based FPGA designs. IEEE Trans. Comput.-Aided Des. Integr. Circuits Syst. 1994, 13, 1–12. [Google Scholar] [CrossRef]
- Teng, F.; Chen, Y.X.; Min, C.A.; Scott, G.; Christopher, R.; Pamela, L.; Dwight, W. Square or sine: Finding a waveform with high success rate of eliciting SSVEP. Comput. Intell. Neurosci. 2011, 2011, 364385. [Google Scholar] [CrossRef]
- Mercer, L.B. 1/f frequency noise effects on self-heterodyne linewidth measurements. J. Light. Technol. 1991, 9, 485–493. [Google Scholar] [CrossRef]
- Richter, L.; Mandelberg, H.; Kruger, M.; McGrath, P. Linewidth determination from self-heterodyne measurements with subcoherence delay times. IEEE J. Quantum Electron. 1986, 22, 2070–2074. [Google Scholar] [CrossRef]
- Huang, S.H.; Wan, M.; Wu, J.; Lu, D.; Zhang, B.; Zheng, Y.; Liu, C.; Fang, X. Precise laser linewidth measurement by feature extraction with a short-delay self-homodyne. Appl. Opt. 2022, 61, 1791–1796. [Google Scholar] [CrossRef] [PubMed]
- Wang, Z.H.; Ke, C.J.; Zhong, Y.B.; Xing, C.; Wang, H.Y.; Yang, K.Y.; Cui, S.; Liu, D.M. Ultra-narrow-linewidth measurement utilizing dual-parameter acquisition through a partially coherent light interference. Opt. Express 2020, 28, 8484–8493. [Google Scholar] [CrossRef]
- Wu, L.J.; Ji, Z.H.; Ma, W.X.; Su, D.Q.; Zhao, Y.T.; Xiao, L.T.; Jia, S.T. Narrow laser linewidth measurement with the optimal demodulated Lorentzian spectrum. Appl. Opt. 2024, 63, 1847–1853. [Google Scholar] [CrossRef]
Disclaimer/Publisher’s Note: The statements, opinions and data contained in all publications are solely those of the individual author(s) and contributor(s) and not of MDPI and/or the editor(s). MDPI and/or the editor(s) disclaim responsibility for any injury to people or property resulting from any ideas, methods, instructions or products referred to in the content. |
© 2025 by the authors. Licensee MDPI, Basel, Switzerland. This article is an open access article distributed under the terms and conditions of the Creative Commons Attribution (CC BY) license (https://creativecommons.org/licenses/by/4.0/).
Share and Cite
Bu, F.; Zhao, Z.; Li, L.; Zhang, C.; Li, T.; Qi, Y.; Ding, J.; Yan, B.; Zhao, C.; Wang, Y.; et al. Laser Linewidth Measurement Using an FPGA-Based Delay Self-Homodyne System. Photonics 2025, 12, 203. https://doi.org/10.3390/photonics12030203
Bu F, Zhao Z, Li L, Zhang C, Li T, Qi Y, Ding J, Yan B, Zhao C, Wang Y, et al. Laser Linewidth Measurement Using an FPGA-Based Delay Self-Homodyne System. Photonics. 2025; 12(3):203. https://doi.org/10.3390/photonics12030203
Chicago/Turabian StyleBu, Fanqi, Zhongan Zhao, Longfei Li, Cunwei Zhang, Tie Li, Yaoyao Qi, Jie Ding, Bingzheng Yan, Chen Zhao, Yulei Wang, and et al. 2025. "Laser Linewidth Measurement Using an FPGA-Based Delay Self-Homodyne System" Photonics 12, no. 3: 203. https://doi.org/10.3390/photonics12030203
APA StyleBu, F., Zhao, Z., Li, L., Zhang, C., Li, T., Qi, Y., Ding, J., Yan, B., Zhao, C., Wang, Y., Lu, Z., Ding, Y., & Bai, Z. (2025). Laser Linewidth Measurement Using an FPGA-Based Delay Self-Homodyne System. Photonics, 12(3), 203. https://doi.org/10.3390/photonics12030203