Abstract
Yttria-Stabilized Zirconia (YSZ) is an important material in thermal barrier coatings (TBCs), which are widely applied in aviation engines and ground gas turbines. Therefore, the quality inspection of the YSZ layer is of great significance for the safety of engines and gas turbines. In this work, the YSZ powder is mixed with Polytetrafluoroethylene (also known as teflon) in different mass ratios and pressed into tablets with different thicknesses. A terahertz time-domain spectroscopy system is used to obtain their time-domain spectra, and their frequency spectra are then obtained by fast Fourier transform. Based on theory formulas, we obtained the frequency-dependent curves of the absorption coefficient, refractive index, and absorbance of the YSZ tablets. The results show that the YSZ tablets have characteristic absorption peaks in the terahertz band, and these peaks are affected by the mass ratio of YSZ to teflon and the thickness of the tablets. Finally, we conducted a terahertz Raman spectroscopy test of the YSZ tablets for the first time. The results show that in the range from 0 to 1600 cm−1, there are about ten strong Raman peaks. More importantly, these peaks are approximately independent of the mass ratio and the thickness of tablets. This study is of great significance for the nondestructive testing of TBC quality using terahertz spectroscopy technology.
1. Introduction
Thermal barrier coatings (TBCs) [1] refer to a laminated metal ceramic composite coating composed of a metal transition layer and a ceramic thermal protection functional coating with good heat resistance and insulation properties. TBCs are a key technology for high-pressure turbine blades [2,3], the core hot end components of advanced gas turbine engines, and have been successfully applied in aviation engines and ground gas turbines. TBCs can further increase the operating temperature of modern gas engines, thereby improving engine thermal efficiency and the thrust-to-weight ratio.
TBCs consist of a ceramic coating (TC) and a bonding coating (BC). The material for TC is usually Yttria-Stabilized Zirconia (YSZ), which is usually prepared by atmospheric plasma spraying (APS) [4,5]. The material for BC is usually MCrAlY alloy, which is located between TC and the superalloy substrate. Its main function is to improve the mechanical matching and physical compatibility between the substrate and the TC.
Terahertz wave is electromagnetic radiation whose frequency lies between the microwave and infrared regions. It has many advantages, such as (1) good security: terahertz photons have low energy and do not cause ionization of biological tissues, making them particularly suitable for biomedical imaging [6]; (2) broadband: it can be used for future broadband wireless communication [7]; (3) fingerprint spectrum, which can be used in the field of drug enforcement and quality monitoring of drug production [8]; (4) good penetrability: it can penetrate non-metallic and non-polar materials, such as textiles, plastics, and packaging materials, as well as smoke. Therefore, it can be applied in the fields of counter-terrorism, security inspection, and nondestructive testing [9].
Due to TC’s good penetration and BC’s good reflectivity for terahertz waves, terahertz spectroscopy can be used to detect defects [10,11,12,13] and measure the thickness of TBCs. For example, Ye et al. used the terahertz reflectance spectrum to quantitatively determine the porosity in TBCs [14]. Andrew presented a normal incidence terahertz reflectivity technique to determine the optical thickness and birefringence of YSZ TBCs [15]. Liu et al. used Terahertz Time-domain Spectrometer (THz-TDS) technology to measure the coating thickness distribution of TBCs, and the measurement deviation was within 12.1 µm [16]. Luo et al. combined terahertz pulsed imaging and an optical coherence tomography detection method for multiple defects in TBCs [17], and the defects with a depth of 519 μm and a width of 100 μm were measured. Sun et al. proposed a long short-term memory network and local extrema to measure the thickness of TBCs [18]. After that, they proposed a terahertz residual network to accurately infer TC thickness by extracting the refractive index online [19]. Recently, they developed a terahertz model-data-driven interpretable neural network to measure TBC thickness [20]. It should be noted that for all these measurement methods based on terahertz technology, the optical parameters of material YSZ should be measured first.
In this work, we first present the preparation method for a YSZ tablet. Then, we test its THz-TDS and obtain its optical parameters by calculation. Finally, we test the terahertz Raman spectrum of the YSZ tablets and observe terahertz Raman absorption peaks.
2. Materials and Methods
2.1. Prepare Tablets of YSZ Powder
The most commonly used methods for preparing TBCs are APS and electron beam physical vapor deposition (EB-PVD). APS TBCs are generally layered structures with good thermal insulation performance but poor thermal shock resistance and low bonding strength. The EB-PVD TBCs have columnar crystal structures with excellent thermal shock resistance and high bonding strength but relatively low thermal insulation performance [21].
Plasma spraying physical vapor deposition (PS-PVD) technology is considered one of the most promising technologies for the preparation of high-performance TBCs [22,23]. It can achieve sufficient powder gasification at ultra-low pressure. The coating formed by this technology has good thermal insulation performance, high bonding strength, and good thermal shock resistance.
However, for every technology, the YSZ powder is an indispensable raw material. The YSZ powder used in our experiment was Metco-233C, purchased from Oerlikon Co., Ltd. Its main component is 8Y2O3-ZrO2, with a particle size distribution of −125 + 45 μm, and is suitable for high-performance coating applications. The powder was prepared by agglomeration sintering, and spherical powder was produced by APS technology. Using a plasma arc spray gun, a strong arc is generated between the positively charged anode and the negatively charged cathode of the powder material. Through the action of an arc, the process gas is ionized into a plasma state, forming a high-temperature plasma jet. When used to prepare TBCs, the powder is injected into a plasma jet, and the powder particles quickly melt in the high-temperature environment of the jet and are sprayed onto the surface of the target object to be sprayed.
In order to characterize the terahertz spectrum response of the YSZ powder, we first weighed the YSZ powder to be compressed using an electronic analytical balance (model FA224C, shown in Figure 1a). Then, we used the fully automatic tablet machine (model JZP-60, shown in Figure 1b) produced by Tianjin Jingtuo Instrument Company for tablet pressing. When setting the parameters of the tablet press, only the upper and lower pressure limit and time need to be set. The upper limit of pressurization is generally set at 12 tons, the lower limit is set at 8 tons, and the time is 10 s, respectively. In order to obtain a complete tablet, it is necessary to constantly adjust the upper and lower pressure limits and pressure time by observing the fragmentation and thickness of the sample.
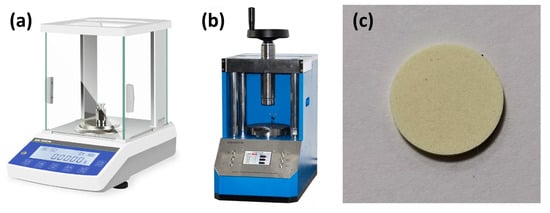
Figure 1.
(a) Electronic analytical balance, (b) tablet machine, and (c) photograph of one tablet.
Due to the poor adhesion of pure YSZ powder, there are defects at the edges after compression. To improve the integrity of compressed tablets, a small amount of teflon powder should be mixed into the pure YSZ powder and thoroughly mixed before compression. In order to investigate the influence of mass ratio and sample thickness on the spectrum, we prepared different types of tablets, which are listed in Table 1 and Table 2. In Table 1, we set the mass ratio of YSZ to teflon as a constant at 3:1 and proportionally changed their mass. In Table 2, we set the mass of YSZ as a constant at 0.24 g and gradually increased the mass of teflon from 0.08 g to 0.30 g. To increase the credibility of the results in this work, four pure YSZ tablets with masses of 0.264 g, 0.267 g, 0.301 g, and 0.307 g were prepared. In addition, some thick mixture samples were also prepared to investigate the effect of thickness on the spectrum.

Table 1.
Thin tablets with constant mass ratio but different thicknesses.
Table 2.
Thin tablets with constant mass of YSZ but different mass ratios.
Finally, we placed the compressed tablets into a vacuum drying oven, model DHG-9055A, manufactured by Shanghai Yiheng Scientific Instrument Co., Ltd., Shanghai, China. We set the oven temperature to a maximum of 70 °C and heated them for 20 min from the initial temperature to the maximum degree before taking them out for spectral testing. The tablets with different thicknesses and the same diameter of 13 mm were obtained, and the photograph of one tablet is shown in Figure 1c.
2.2. Terahertz Testing Methods and Parameters
The terahertz transmission spectra of the samples are obtained by using a terahertz time-domain spectrometer CCT-1800, which is produced by China Communication Microelectronics Technology Co., Ltd., Shenzhen, China. Its spectrum range is 0.1 THz–4.5 THz, and it has a dynamic range of 75 dB in transmission mode. The terahertz wave is produced by a GaAs photoconductive semiconductor emitter grown at low temperature and detected by a GaAs photoconductive semiconductor receiver made by the same process. Figure 2a shows the optical schematic of the spectrometer, and Figure 2b presents its photograph.
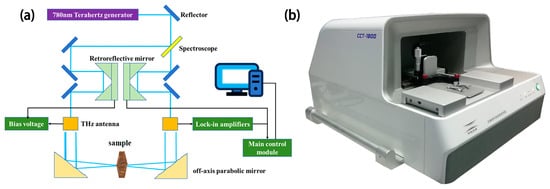
Figure 2.
(a) Schematic diagram, and (b) photograph of THz-TDS spectrometer CCT-1800.
In the experiment, the nitrogen environment as a reference and its terahertz time-domain spectrum is first tested. Then, the sample is set on the focus of the terahertz waves by using a sample holder. The transmitted terahertz waves can reach the detector; thus, the terahertz time-domain spectrum of the sample can be obtained. The terahertz transmission spectrum can be calculated by [24]
where Etsam(ω) is the electric field strength of the transmitted terahertz signal from the sample, and Eref (ω) is that from the reference, respectively. Finally, it is easy to get the frequency-domain spectrum and the phase information by fast Fourier transform (FFT) of the terahertz time-domain spectrum.
3. Results and Discussion
3.1. Terahertz Spectra in Time Domain and Frequency Domain
For the four thin mixture tablets with different mass ratios and the reference of nitrogen, the measured terahertz time-domain spectra and the corresponding frequency-domain spectra obtained by fast Fourier transform are shown in Figure 3a and b, respectively. Figure 3a shows that the terahertz time-domain spectra of four mixture tablets are delayed more than 3 ps relative to that of the reference nitrogen. At the same time, Figure 3b shows that the power of the reference signal is bigger than that of the samples due to the absorption of terahertz waves by the samples. Due to the signal above 1.5 THz being very weak, we only studied the terahertz spectra and material parameters below 1.5 THz in the following sections.
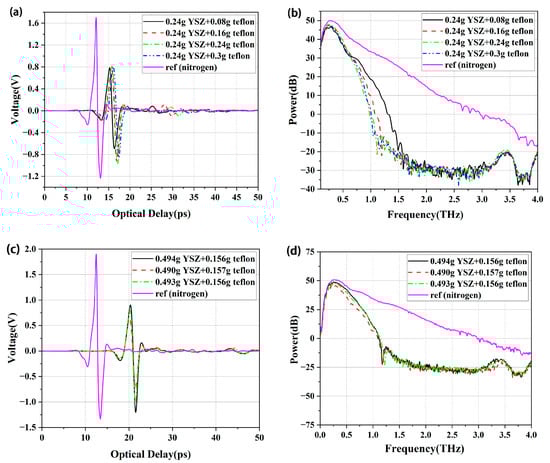
Figure 3.
(a) Time-domain spectroscopy and (b) frequency-domain spectroscopy of thin tablets with different mass ratios; (c) time-domain spectroscopy and (d) frequency-domain spectroscopy of thick tablets with constant mass ratio.
In order to study the effect of thickness on the spectra, we prepared three thick mixture samples with almost identical mass ratios of YSZ to teflon of 3:1, i.e., sample #1 is 0.494 g YSZ + 0.156 g teflon, sample #2 is 0.490 g YSZ + 0.157 g teflon, and sample #3 is 0.493 g YSZ + 0.156 g teflon. Their THz time-domain spectra and frequency-domain spectra are shown in Figure 3c and Figure 3d, respectively. Comparing Figure 3b,d, it can be seen that terahertz spectra are affected by the thickness of samples.
3.2. Absorption Coefficient (α)
The phenomenon in which the intensity of light decreases with the propagation distance when it propagates through a medium is called absorption of light. The absorption coefficient α(ω) is written as [25]
where c is the speed of light in vacuum and к (ω) denotes the imaginary part of the frequency-resolved complex refractive index n(ω) = n(ω) + i·к (ω), which can be derived from the measured THz transmitted field via the following equation:
where d is the thickness of the sample.
Based on these formulas and the frequency spectra obtained in the experiment, the absorption coefficients of the samples with constant mass ratio but different thicknesses are plotted in Figure 4a, and those with a constant mass of YSZ but different ratios of teflon are presented in Figure 4b, respectively.
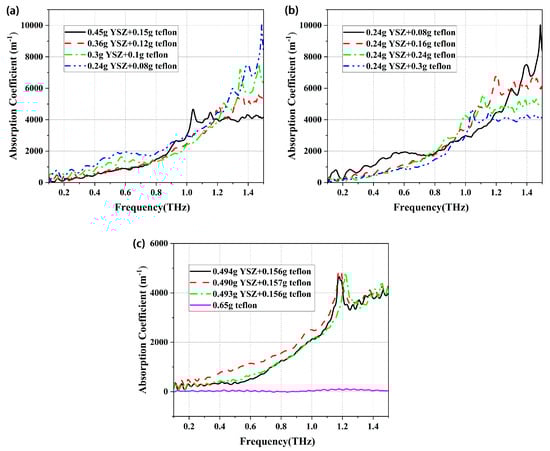
Figure 4.
Absorption coefficient of thin samples (a) with constant mass ratio but different thicknesses; (b) with a constant mass of YSZ but different ratios of teflon; and (c) absorption coefficient of thick samples and teflon.
Figure 4a shows that the absorption coefficient of every sample gradually increases with the frequency in the range from 0.1 to 1.5 THz. For the tablet with 0.24 g YSZ and 0.08 g teflon, there are three distinct absorption peaks located at 1.3 THz, 1.40 THz, and 1.48 THz, respectively. When the mass of YSZ and Teflon is increased, these absorption peaks show a distinct red shift. This may be caused by steric hindrance [26], i.e., the steric hindrance of certain functional groups in the molecule is relatively large, which can affect the planarity of the molecule, reduce the degree of conjugation, and cause a blue shift in the absorption peak.
Figure 4b indicates that the absorption gradually decreases with the increase in mass in the frequency range from 1.20 THz to 1.50 THz. With the increase in teflon mass in the tablets, the three absorption peaks located at 1.3 THz, 1.40 THz, and 1.48 THz show a distinct red shift. Therefore, the absorption coefficient is not only affected by the thickness of the tablets but also by the mass ratio of YSZ to teflon.
Figure 4c shows that the teflon has no absorption in the terahertz band, and there is a strong absorption peak near 1.2 THz for every thick sample. By comparing Figure 4c with Figure 4a,b, it is found that some absorption peaks that appeared in the thin samples disappeared in the thick samples. The probable reason is that the thinner the sample, the more reflections of terahertz waves on the front and rear surfaces, and the greater the influence of the Fabry-Perot (F-P) effect.
3.3. Refractive Index (n)
The refractive index of the YSZ tablets can be given as [20]
where ω = 2πf is the angular frequency, d is the thickness of sample, c is the light speed in air, and φr(ω) and φs(ω) are the angular frequency-dependent phase of the reference signal and that of the sample, respectively. The measured refractive index of the tablets with different thicknesses and different mass ratios is in Figure 5.
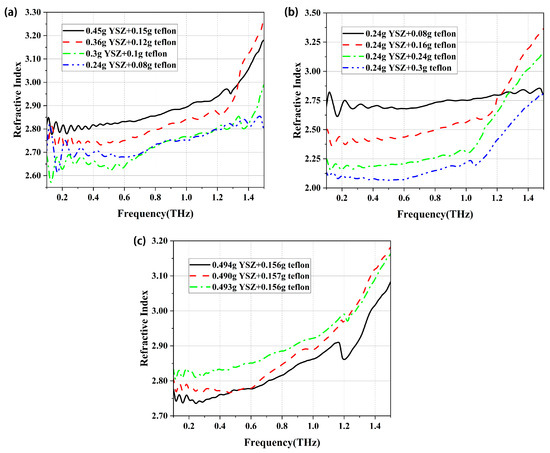
Figure 5.
Refractive index of thin samples (a) with constant mass ratio but different masses and (b) with constant mass of YSZ but different ratios of teflon; (c) refractive index of three thick samples.
Figure 5a shows that the refractive index gradually increases in the frequency range from 0.2 to 1.5 THz. At the same time, the refractive index of the tablet with 0.45 g YSZ and 0.15 g teflon is bigger than that of the tablet with 0.36 g YSZ and 0.12 g teflon in the frequency range from 0.2 to 1.34 THz. However, this phenomenon is reversed above 1.34 THz.
Figure 5b shows that if the YSZ mass is constant, the refractive index decreases with the mass of teflon in the frequency range from 0.1 to 1.2 THz. In addition, the refractive index of the tablet with 0.08 g teflon shows good stability, while that of other samples increases rapidly above 1.0 THz. Figure 5c indicates that the refractive index of three thick samples with almost identical mass ratios gradually increases in the range from 0.1 to 1.2 THz, and it will increase rapidly above 1.2 THz. The difference between these curves may be due to the uneven mixing of YSZ powder and teflon powder in the sample.
3.4. Absorbance (A)
Absorbance is a physical quantity used to measure the degree to which light is absorbed when passing through a solution or substance. It represents the logarithm of the ratio of the incident light intensity before passing through a substance to the transmitted light intensity after passing through the substance (I0/I1), with a base of 10, denoted as lg (I0/I1), and it is given by
where T = I1/I0 is the transmission, and it can also be written as
where ∆dB is the value of the amplitude of the sample minus that of the reference. Based on these formulas and the date obtained from the experiment, the absorbance of the thin samples with constant mass ratio but different thicknesses is shown in Figure 6a. And those with constant mass of YSZ but different mass ratios are presented in Figure 6b. For the pure teflon tablet with a mass of 0.65 g and three thick samples, their absorbance spectra are presented in Figure 6c.
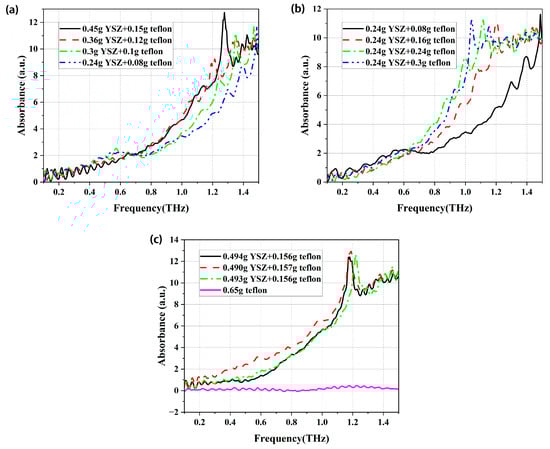
Figure 6.
Absorbance of thin samples (a) with constant mass ratio but different thickness, and (b) with constant mass of YSZ but different mass ratio; (c) absorbance of three thick samples and pure teflon tablet.
Figure 6a shows that if the mass ratio of YSZ to teflon is a constant of 3:1, the absorbance peaks are mainly located in the frequency range from 1.0 THz to 1.5 THz. And the thicker the sample, the stronger the absorbance. Figure 6b indicates that with the increase in the mass ratio of YSZ to teflon, the absorption band widens, and the absorption peak undergoes a red shift. In addition, Figure 6c shows that the strong absorption peaks of three thick samples are located near 1.2 THz, while the teflon tablet has almost no absorption in the range from 0.1 THz to 1.5 THz. Therefore, the teflon only increases the adhesion of the mixture and does not change the absorption peak of the YSZ powder.
3.5. Terahertz Raman Spectrum
Raman spectroscopy is a type of scattering spectrum. It analyzes scattering spectra with frequencies different from the incident light to obtain information on molecular vibration and rotation, and it can be applied to study molecular structures. Raman spectroscopy of samples in the terahertz frequency is performed using a terahertz Raman spectrometer TR-785 produced by China Communication Microelectronics Technology Co., Ltd. During the Raman spectroscopy test, the relevant experimental parameters are as follows: In the basic setting section, the test model is set as a single sample with a laser intensity of 80 mW and an integration time of 1000 mS. In the pre-processing setting section, the smooth processing involves 20 wavelengths and two orders, and the baseline processing involves 5000 wavelengths and two orders. In the peak detection section, we set the detection mode to local noise standard deviation (SD), the minimum peak is 10, and the local SD = 2.
- (1)
- Influence of thickness on terahertz Raman spectrum
The test results of the samples with the same mass ratio of 3:1 but different thicknesses are shown in Figure 7a, indicating that there is a strong Raman peak at 54 cm−1. In addition, there are more than 10 secondary absorption peaks in the range from 0 to 1600 cm−1. More importantly, the thickness of the sample has little effect on the Raman peaks of the samples. Therefore, we can identify the 8YSZ material from other materials by these Raman peaks.
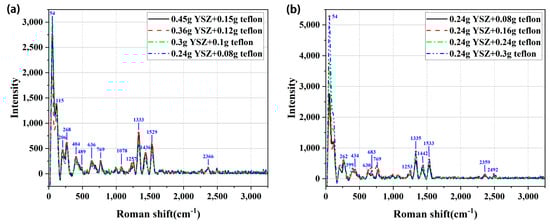
Figure 7.
Terahertz Raman spectra of samples (a) with constant mass ratio but different masses of YSZ; and (b) with constant mass of YSZ but different mass ratios of YSZ to teflon.
- (2)
- Effect of mass ratio on terahertz Raman spectrum
In order to investigate the effect of mass ratio on the Raman spectra of the samples, we set the mass of YSZ as 0.24 g, and that of the teflon was selected as 0.08 g, 0.16 g, 0.24 g, and 0.30 g, respectively. The measured results are shown in Figure 7b, indicating that the mass ratio of YSZ to teflon has little effect on the Raman spectra, and only a few Raman peaks show a small shift in peak positions. This is because the doping of teflon powder only adds to the adhesion of YSZ powder and cannot change its crystal structure.
- (3)
- Effect of thickness or mass on terahertz Raman spectrum of pure YSZ tablets
To study the effect of thickness or mass on the terahertz Raman spectrum of pure YSZ tablets, we prepared four YSZ tablets with different masses of 0.264 g, 0.267 g, 0.301 g, and 0.307 g, respectively. The tested results are shown in Figure 8a, which indicates that these absorption peaks are independent of mass or thickness because the crystal structure of the YSZ tablet is not changed with the thickness.
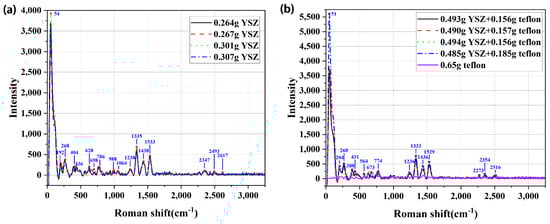
Figure 8.
(a) Terahertz Raman spectra of samples with pure YSZ powder and (b) terahertz Raman spectra of a pure teflon sample and four mixture samples.
- (4)
- Effect of teflon doping on terahertz Raman spectrum
The terahertz Raman spectra of pure teflon and four samples with different mass ratios are presented in Figure 8b. It is evident from this figure that the pure teflon tablet has almost no distinct terahertz Raman absorption peak. Comparing Figure 8a,b, it can be seen that almost all absorption peaks exist after doping, with very few peaks showing slight shifts. Therefore, the terahertz Raman spectrum is almost independent of the doping of teflon.
It should be noted that the geometric shape of the sample has no effect on the test results because the area of the sample is more than twice the focal spot area of the terahertz wave. In addition, a rough surface can increase scattering and reduce the amplitude of transmitted terahertz waves, but it does not affect the number and position of absorption peaks of the terahertz spectrum.
4. Conclusions
In conclusion, we tested YSZ powder tablets by using THz-TDS system, and got THz frequency domain spectra by the FFT method. After that, we calculated and obtained optical parameters of the YSZ materials, such as absorption coefficient, refractive index, absorbance, etc. Moreover, a terahertz Raman spectrometer was used to test the Raman spectroscopy of YSZ tablets for the first time. The results show that the YSZ powder has characteristic absorption peaks and Raman peaks in the terahertz band. The terahertz absorption peaks are affected by the thickness and mass ratio of YSZ to teflon, while the Raman peaks are approximately independent of the thickness and the mass ratio. Therefore, we cannot use a constant refractive index to calculate the thickness of the YSZ layer in the TBCs at different thicknesses. These results are of great significance for the nondestructive testing of defects in TBCs, which are widely used in the aviation and aerospace fields.
Author Contributions
Conceptualization and methodology, M.Y.; validation and formal analysis, C.L. and M.Y.; investigation, L.L. and Y.M.; resources, D.W. and H.Y.; data curation, C.L.; writing—original draft preparation, M.Y. and Y.S.; writing—review and editing Y.P. and H.M.; visualization, F.H. and Y.F.; supervision, Y.S.; project administration, S.G.; funding acquisition S.G. All authors have read and agreed to the published version of the manuscript.
Funding
This research was funded by the Key R&D Program of Zhejiang (No. 2024SSYS0076).
Institutional Review Board Statement
Not applicable.
Informed Consent Statement
Not applicable.
Data Availability Statement
Data underlying the results presented in this paper are not publicly available at this time but may be obtained from the authors upon reasonable request.
Conflicts of Interest
The authors declare no conflicts of interest.
References
- Prabhu, R.; Kavimani, V.; Gopal, P.M.; Sahadevan, J. Thermal barrier coating on inconel 718: Understanding cyclic oxidation kinetics. Surf. Eng. 2024, 40, 478–486. [Google Scholar] [CrossRef]
- Tao, Q.; Wang, Y.; Wei, D.; Yang, S. Thermal oxidation description methodology of thermal barrier coatings on gas turbine blades considering service characteristics. Chin. J. Aeronaut. 2024, 37, 410–424. [Google Scholar] [CrossRef]
- Padture, N.P.; Gell, M.; Jordan, E.H. Thermal barrier coatings for gas-turbine engine applications. Science 2002, 296, 280–284. [Google Scholar] [CrossRef] [PubMed]
- Chen, D.Y.; Dambra, C. Thick columnar-structured thermal barrier coatings using the suspension plasma spray process. Coatings 2024, 14, 996. [Google Scholar] [CrossRef]
- Jiang, P.; Yang, L.; Li, D.; Chen, Y. Residual stress in air-plasma-sprayed thermal barrier coatings under long-term high-temperature oxidation. Surf. Coat. Technol. 2024, 484, 130827. [Google Scholar] [CrossRef]
- Wan, M.; Healy, J.J.; Sheridan, J.T. Terahertz phase imaging and biomedical applications. Opt. Laser Technol. 2020, 122, 105859. [Google Scholar] [CrossRef]
- Yu, J.J.; Wang, Y.Y.; Ding, J.J.; Zhang, J.; Li, W.P.; Wang, F.; Wang, C.; Wang, K.H.; Tan, Y.X.; Zhu, M.; et al. Broadband photon-assisted terahertz communication and sensing. J. Lightwave Technol. 2023, 41, 3332–3349. [Google Scholar] [CrossRef]
- Wang, J.R.; Lindley-Hatcher, H.; Liu, K.; Pickwell-MacPherson, E. Evaluation of transdermal drug delivery using terahertz pulsed imaging. Biomed. Opt. Express 2020, 11, 4484–4490. [Google Scholar] [CrossRef]
- Jiang, X.L.; Xu, Y.; Zhao, D.C. Terahertz non-destructive testing and imaging of corrosion in coated steel plates. Constr. Build. Mater. 2023, 385, 131427. [Google Scholar] [CrossRef]
- Sun, F.; Fan, M.; Cao, B.; Ye, B.; Liu, L. High-resolution terahertz imaging of debonding defects in thermal barrier coatings using an optimal wavelet transform. IEEE Trans. Instrum. Meas. 2023, 72, 4505211. [Google Scholar] [CrossRef]
- Ye, D.D.; Li, R.; Xu, J.F.; Pan, J.B. Data-driven method for porosity measurement of thermal barrier coatings using terahertz time-domain spectroscopy. Coatings 2023, 13, 1060. [Google Scholar] [CrossRef]
- Cao, B.; Yang, D.; Fan, M. A terahertz fast imaging method for debonding defects of thermal barrier coatings based on dual-channel convolutional neural network. Mater. Eval. 2023, 81, 41–50. [Google Scholar] [CrossRef]
- Luo, M.T.; Zhong, S.C.; Huang, Y.; Zhang, Z.H.; Nsengiyumva, W.; Tu, W.L. Experimental study of a thin thermally grown oxide layer in thermal barrier coatings based on the swt-bp algorithm and terahertz technology. Appl. Opt. 2024, 63, 3430–3437. [Google Scholar] [CrossRef] [PubMed]
- Ye, D.; Wang, W.; Zhou, H.; Li, Y.; Fang, H.; Huang, J.; Gong, H.; Li, Z. Quantitative determination of porosity in thermal barrier coatings using terahertz reflectance spectrum: Case study of atmospheric-plasma-sprayed ysz coatings. IEEE Trans. Terahertz Sci. Technol. 2020, 10, 383–390. [Google Scholar] [CrossRef]
- Waddie, A.J.; Schemmel, P.J.; Chalk, C.; Isern, L.; Nicholls, J.R.; Moore, A.J. Terahertz optical thickness and birefringence measurement for thermal barrier coating defect location. Opt. Express 2020, 28, 31535–31552. [Google Scholar] [CrossRef]
- Liu, L.H.; Yu, H.Y.; Zheng, C.L.; Ye, D.D.; He, W.; Wang, S.L.; Li, J.N.; Wu, L.; Zhang, Y.T.; Xie, J.H.; et al. Nondestructive thickness measurement of thermal barrier coatings for turbine blades by terahertz time domain spectroscopy. Photonics 2023, 10, 105. [Google Scholar] [CrossRef]
- Luo, M.T.; Zhong, S.C.; Huang, Y.; Zhang, Z.H.; Tu, W.L. Combined terahertz pulsed imaging and optical coherence tomography detection method for multiple defects in thermal barrier coatings. Coatings 2024, 14, 380. [Google Scholar] [CrossRef]
- Sun, F.S.; Fan, M.B.; Cao, B.H.; Zheng, D.D.; Liu, H.; Liu, L. Terahertz based thickness measurement of thermal barrier coatings using long short-term memory networks and local extrema. IEEE Trans. Ind. Inf. 2022, 18, 2508–2517. [Google Scholar] [CrossRef]
- Sun, F.S.; Fan, M.B.; Cao, B.H.; Liu, L. Thzresnet: A physics-inspired two-stream residual network for thermal barrier coating thickness measurement. IEEE Trans. Ind. Inf. 2023, 19, 8328–8339. [Google Scholar] [CrossRef]
- Sun, F.S.; Cao, B.H.; Fan, M.B.; Ye, B.; Liu, L. Thzminet: A terahertz model-data-driven interpretable neural network for thickness measurement of thermal barrier coatings. IEEE Trans. Ind. Inf. 2024, 20, 4722–4734. [Google Scholar] [CrossRef]
- Guo, H.; Gong, S.; Xu, H. Research progress on new high/ultra-high temperature thermal barrier coatings and processing technologies. Acta Aeronaut. Astronaut. Sin. 2014, 35, 2722–2732. [Google Scholar] [CrossRef]
- von Niessen, K.; Gindrat, M.; Refke, A. Vapor phase deposition using plasma spray-pvd™. J. Therm. Spray Technol. 2010, 19, 502–509. [Google Scholar] [CrossRef]
- Mauer, G.; Vaßen, R. Plasma spray-pvd: Plasma characteristics and impact on coating properties. J. Phys. Conf. Ser. 2012, 406, 012005. [Google Scholar] [CrossRef]
- Wei, D.W.; Hu, F.R.; Jiang, M.Z.; An, S.; Gao, Z.P.; Luo, W.Y.; Zhang, L.H.; Lin, S.J. Flexible terahertz broadband absorber based on a copper composite film. ACS Appl. Mater. Interfaces 2024, 16, 54731–54741. [Google Scholar] [CrossRef]
- Chen, T.Y.; Wang, X.K.; Han, P.; Sun, W.F.; Feng, S.F.; Ye, J.S.; Xu, Y.D.; Zhang, Y. First- and second-order photon–phonon interactions and optical parameters of ZnTe crystal: A broadband terahertz time-domain spectroscopy study. J. Phys. D Appl. Phys. 2019, 52, 455101. [Google Scholar] [CrossRef]
- Stewart, D.; Dalton, M.; Long, S.; Kannan, R.; Yu, Z.; Cooper, T.; Haley, J.; Tan, L.-S. Steric hindrance inhibits excited-state relaxation and lowers the extent of intramolecular charge transfer in two-photon absorbing dyes. Phys. Chem. Chem. Phys. 2016, 18, 5587–5596. [Google Scholar] [CrossRef] [PubMed]
Disclaimer/Publisher’s Note: The statements, opinions and data contained in all publications are solely those of the individual author(s) and contributor(s) and not of MDPI and/or the editor(s). MDPI and/or the editor(s) disclaim responsibility for any injury to people or property resulting from any ideas, methods, instructions or products referred to in the content. |
© 2025 by the authors. Licensee MDPI, Basel, Switzerland. This article is an open access article distributed under the terms and conditions of the Creative Commons Attribution (CC BY) license (https://creativecommons.org/licenses/by/4.0/).