Article

Optically Referenced Microwave Generator with Attosecond-Level Timing Noise

1
National Time Service Center, Chinese Academy of Sciences, Xi’an 710600, China
2
School of Astronomy and Space Sciences, University of Chinese Academy of Sciences, Beijing 100049, China
3
Key Laboratory of Time Reference and Applications, Chinese Academy of Sciences, Xi’an 710600, China
*
Author to whom correspondence should be addressed.
Photonics 2025, 12(2), 153; https://doi.org/10.3390/photonics12020153
Submission received: 17 January 2025 / Revised: 9 February 2025 / Accepted: 10 February 2025 / Published: 13 February 2025
(This article belongs to the Special Issue New Perspectives in Microwave Photonics)

Abstract

:
Microwave sources based on ultrastable lasers and optical frequency combs (OFCs) exhibit ultralow phase noise and ultrahigh-frequency stability, which are important for many applications. Herein, we present a microwave source that is phase-locked to an ultrastable continuous-wave laser, with a relative frequency instability of 7 × 10 16 at 1 s. An Er:fiber-based OFC and an optic-to-electronic converter with low residual noise are employed to confer optical frequency stability on the 9.6 GHz microwave signal. Instead of using the normal cascaded Mach–Zehnder interferometer method, we developed a microwave regeneration method for converting optical pulses into microwave signals to further suppress the additional noise in the optic-to-electronic conversion process. The microwave regeneration method employs an optical-to-microwave phase detector based on a fiber-based Sagnac loop to produce the error signal between a 9.6 GHz dielectric resonator oscillator (DRO) and the OFC. The 9.6 GHz microwave (48th harmonic of the comb’s repetition rate) signal with the frequency stability of the ultrastable laser was achieved using a DRO that was phase-locked to the optical comb. Preliminary evaluations showed that the frequency instability of the frequency synthesizer from the optical to the 9.6 GHz microwave signal was approximately 2 × 10 15 at 1 s, the phase noise was 106 dBc Hz−1 at 1 Hz, and the timing noise was approximately 9 as Hz−1/2 (phase noise approx. 125 dBc Hz−1). The 9.6 GHz signal from the photonic microwave source exhibited a short-term relative frequency instability of 2.1 × 10 15 at 1 s, which is 1.5 times better than the previous results.

1. Introduction

Microwave signals with ultrahigh-frequency stability have many essential applications, such as in deep-space navigation [1], ultrahigh-resolution radar systems [2], atomic frequency standards [3,4], and ultrahigh-resolution very-long-baseline interferometers [5]. Recently, as targets increase in complicity and diversity, the urgent demand for high-resolution radars has increased significantly. Unfortunately, the performance of conventional electronic radar systems is substantially constrained by pronounced time jitter during the generation and processing of radar waveforms with high frequencies and wide bandwidths. Fortunately, ultrahigh-frequency-stability microwave oscillators can be used in the radars to improve the spectral resolution of the signals transmitted and received. Therefore, ultralow phase noise microwave sources are essential to optimize microwave radar remote sensing systems performance metrics including maximum detectable range and measurement accuracy [6,7,8]. Recent advancements in frequency standard technology have been achieved through cold-atom fountain clock implementations, demonstrating quantum projection noise at the 10 14 / τ 1 / 2 level and exceptional short-term stability performance [9]. However, most fountain clocks use a local oscillator based on quartz oscillators, which limits the frequency stability to 10 13 / τ 1 / 2 , due to the Dick effect [10]. The Dick effect can be eliminated using a pure microwave signal with a frequency stability better than 1 × 10 14 at 1 s as the local oscillator of the fountain clock. Therefore, using an ultrastable photonic microwave source is one solution for eliminating the Dick effect. Recently, the development of cold-atomic optical clocks with ultrahigh-frequency stabilities has progressed rapidly [11]. Consequently, optical atomic clocks are poised to redefine the Système International second. Atomic optical clocks, outperforming primary microwave standards by a factor of over 100, revolutionize precision measurement and unlock groundbreaking applications at the 10 18 level [12,13,14,15]. However, it is difficult to directly apply the ultrahigh-frequency stability laser signal generated by the optical clock to various systems. Thus, the photonic microwave generation technology can be used to divide and synthesize the optical frequency to any desired microwave/radio frequency (RF). In addition, ultrastable microwave oscillators can be used as frequency sources of the microwave frequency transfer system to improve the frequency stability [16,17,18].
To date, ultrastable lasers exhibit the best short-term stability up to 4 × 10 17 [19]. As such, an increasing number of research groups have focused on photonic microwave generation based on an ultrastable optical reference. Laboratoire National de Métrologie et d’Essais-Systèmes de Référence Temps-Espace (LNE-SYRTE, Paris, France) employed an optical frequency comb (OFC) to convert an ultrastable laser frequency into the microwave frequency, and they obtained a 12 GHz microwave signal with a frequency instability of 6.5 × 10 16 at 1 s and phase noise of 106 dBc/Hz at 1 Hz [20]. The National Institute of Standards and Technology (NIST, Gaithersburg, MD, USA) achieved broadband frequency tuning from an RF to 100 GHz based optical cavity and OFC [21]. This paper presents a photonic microwave generator that employs a photonic microwave regeneration method to convert optical pulses into microwave signals instead of using a repetition-rate multiplier based on a series of cascaded Mach–Zehnder interferometers (MZIs) [22]. This method uses a fiber-loop optical microwave phase detector (FLOM-PD) to detect the phase difference between the optical pulses from an OFC and the microwave signals from a dielectric resonator oscillator (DRO). Thereafter, the phase difference is employed to feedback the control voltage of the DRO using a loop filter to realize phase stabilization. With this optical microwave regeneration technology, the high-speed and high-input power photodetector used in the photoelectric conversion process is unnecessary, which reduces the pressure of high-sensitivity photodetector selection. Finally, we obtained a 9.6 GHz microwave signal with a frequency instability of 2.1 × 10 15 at 1 s. Notably, this high-frequency-stability microwave signal will promote the research on high-precision cesium atomic fountain clocks, optical clocks and network radars.

2. Materials and Methods

The photonic-generated microwave source takes an ultrastable laser as the frequency reference. By leveraging the ability of a femtosecond optical frequency comb to link optical frequencies and microwaves, it transfers the frequency stability of the ultrastable laser to the microwave frequency band. Through precise photodetection and phase locking of the stabilized optical comb signal, the system ultimately generates microwave radiation inheriting the superior frequency stability characteristics of the original ultrastable laser source. Figure 1 illustrates the configuration of the photonic-based microwave frequency generation system. The photonic microwave frequency source consists of three components: an ultrastable laser, an optical frequency comb (OFC), and an optic-to-electronic converter. The frequency source reference is a 10 cm (length) ultrahigh-finesse Fabry–Pérot (F-P) cavity, whose stability can reach the 10 16 level, and its performance is primarily restricted by the thermal noise originating from the mirror’s coating. To achieve an ultrastable photonic microwave frequency source, the overall procedure involves two key steps. Initially, the stability of the cavity length is established by locking the frequency of a continuous-wave (CW) laser to a resonant mode within the cavity. Subsequently, the CW laser frequency is synthesized into the target microwave frequencies in two stages: optical frequency synthesis using an optical frequency comb (OFC) and optic-to-electronic conversion.

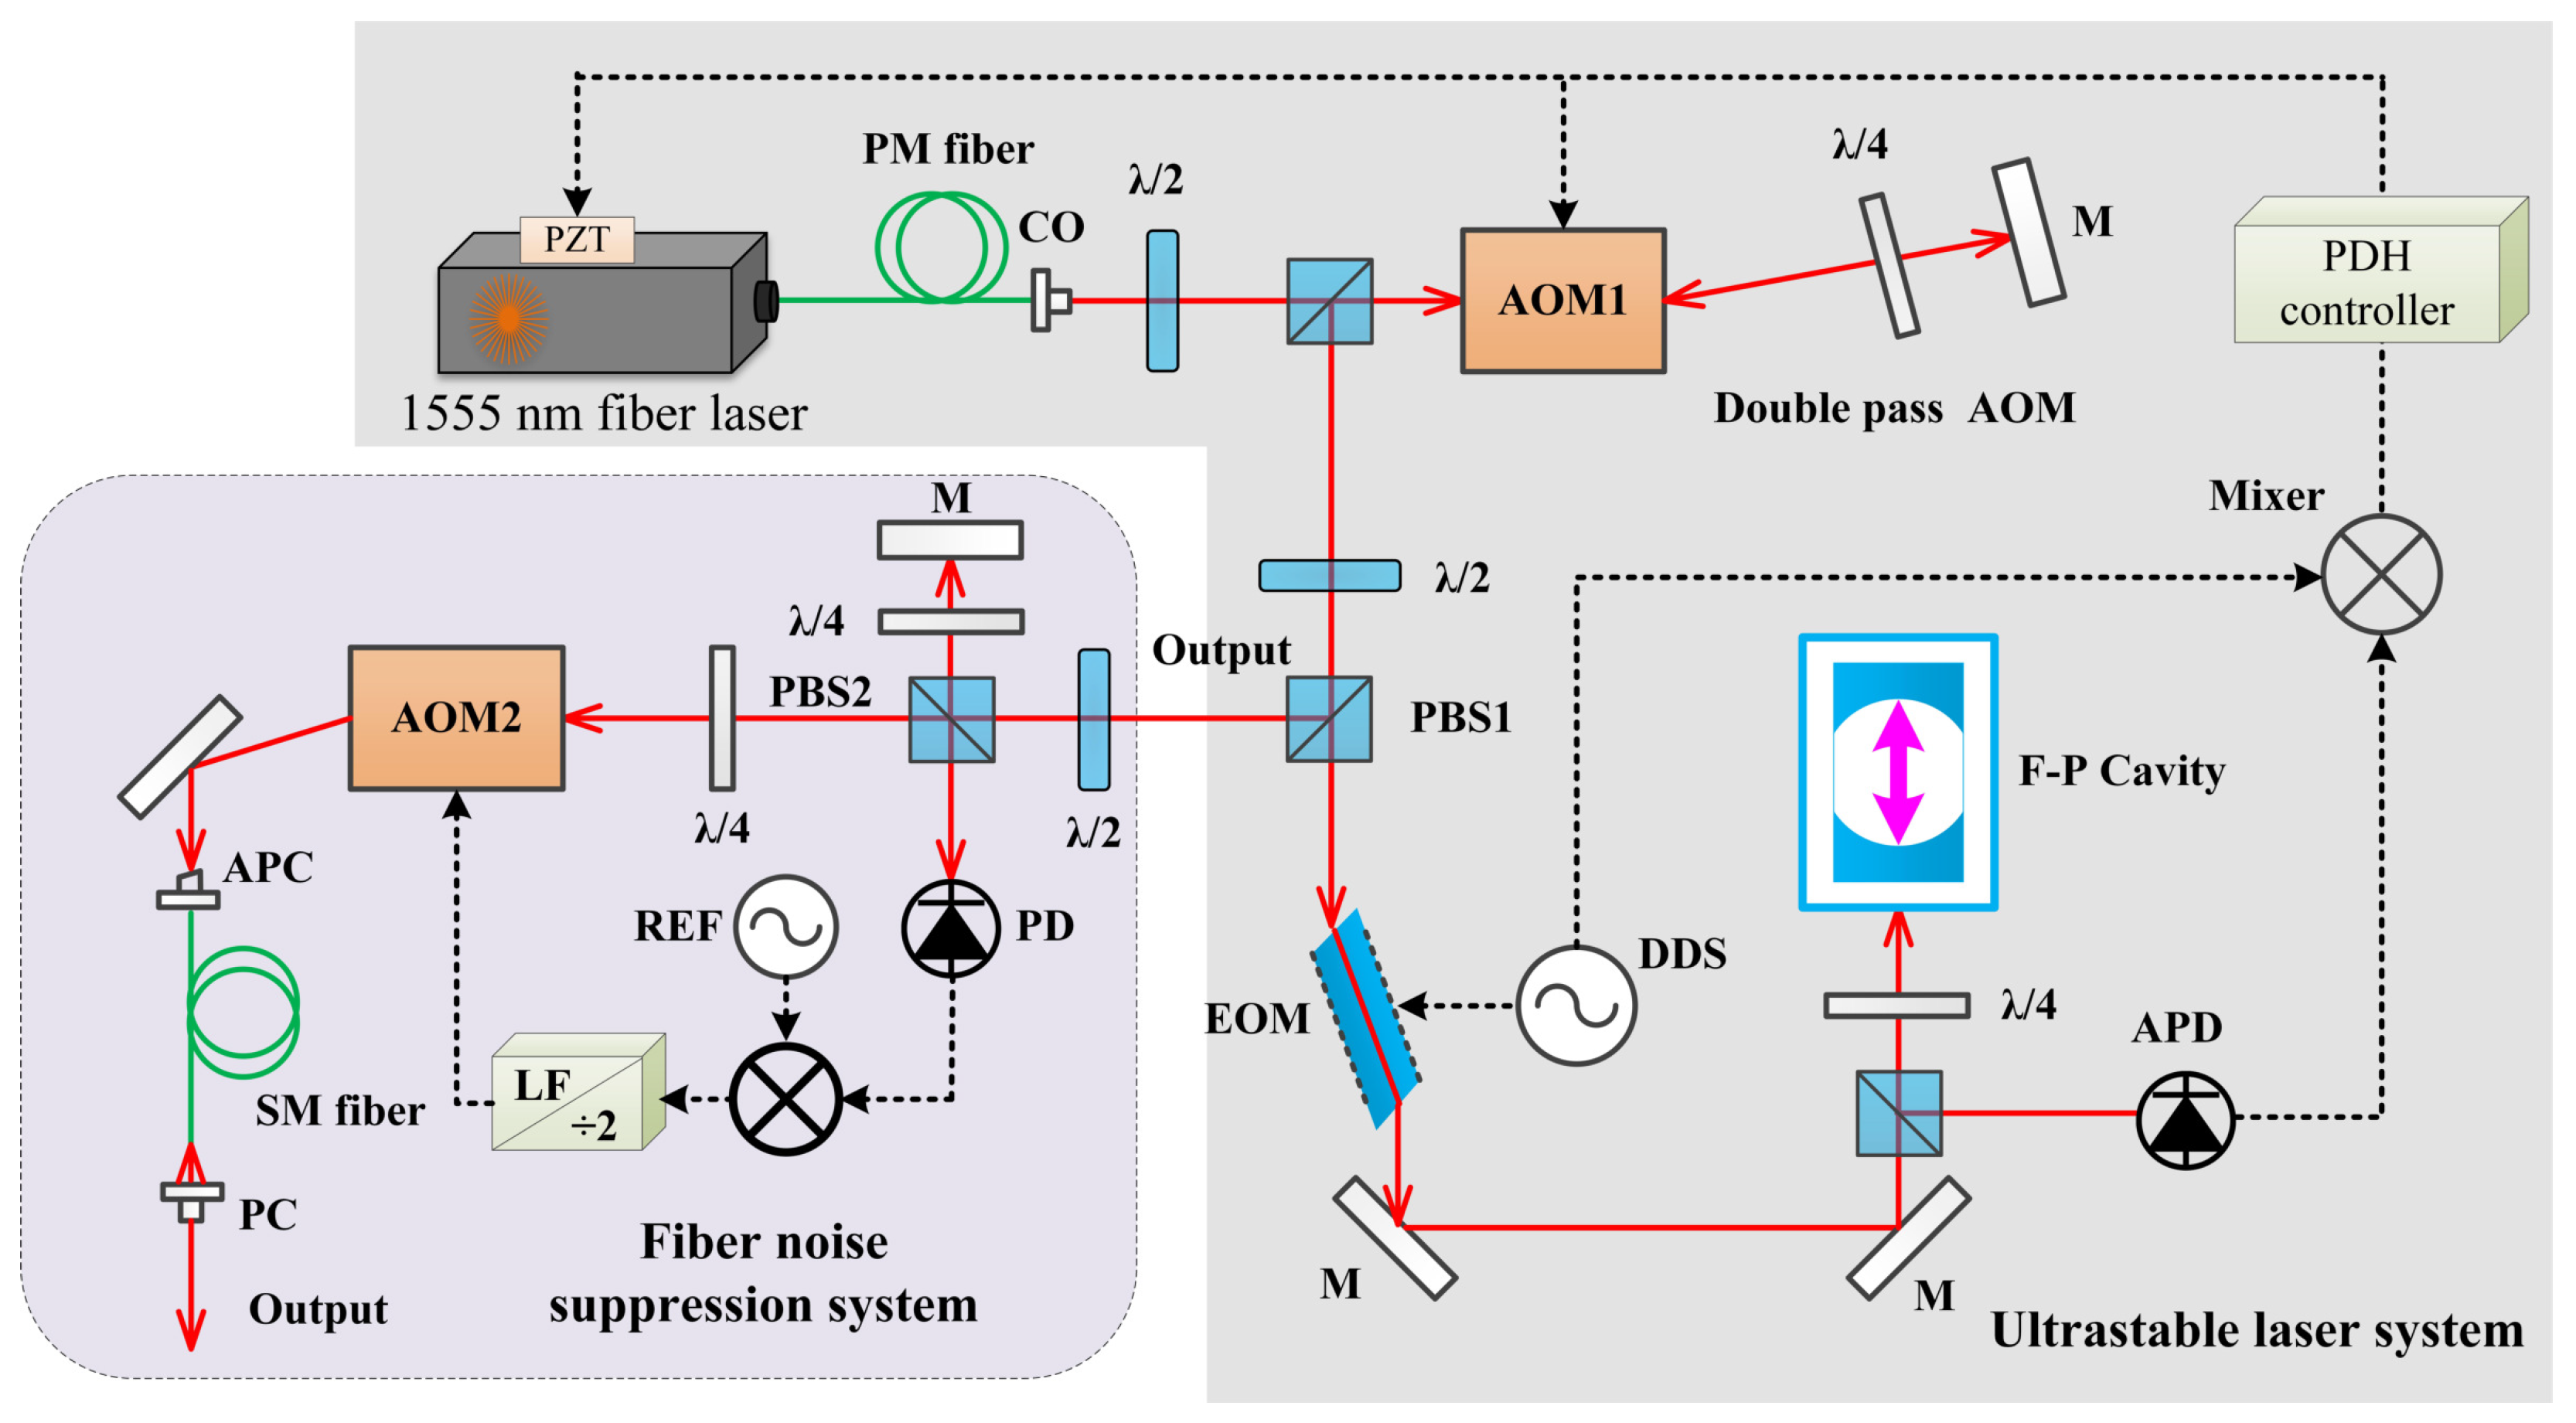
2.1. Ultrastable Laser
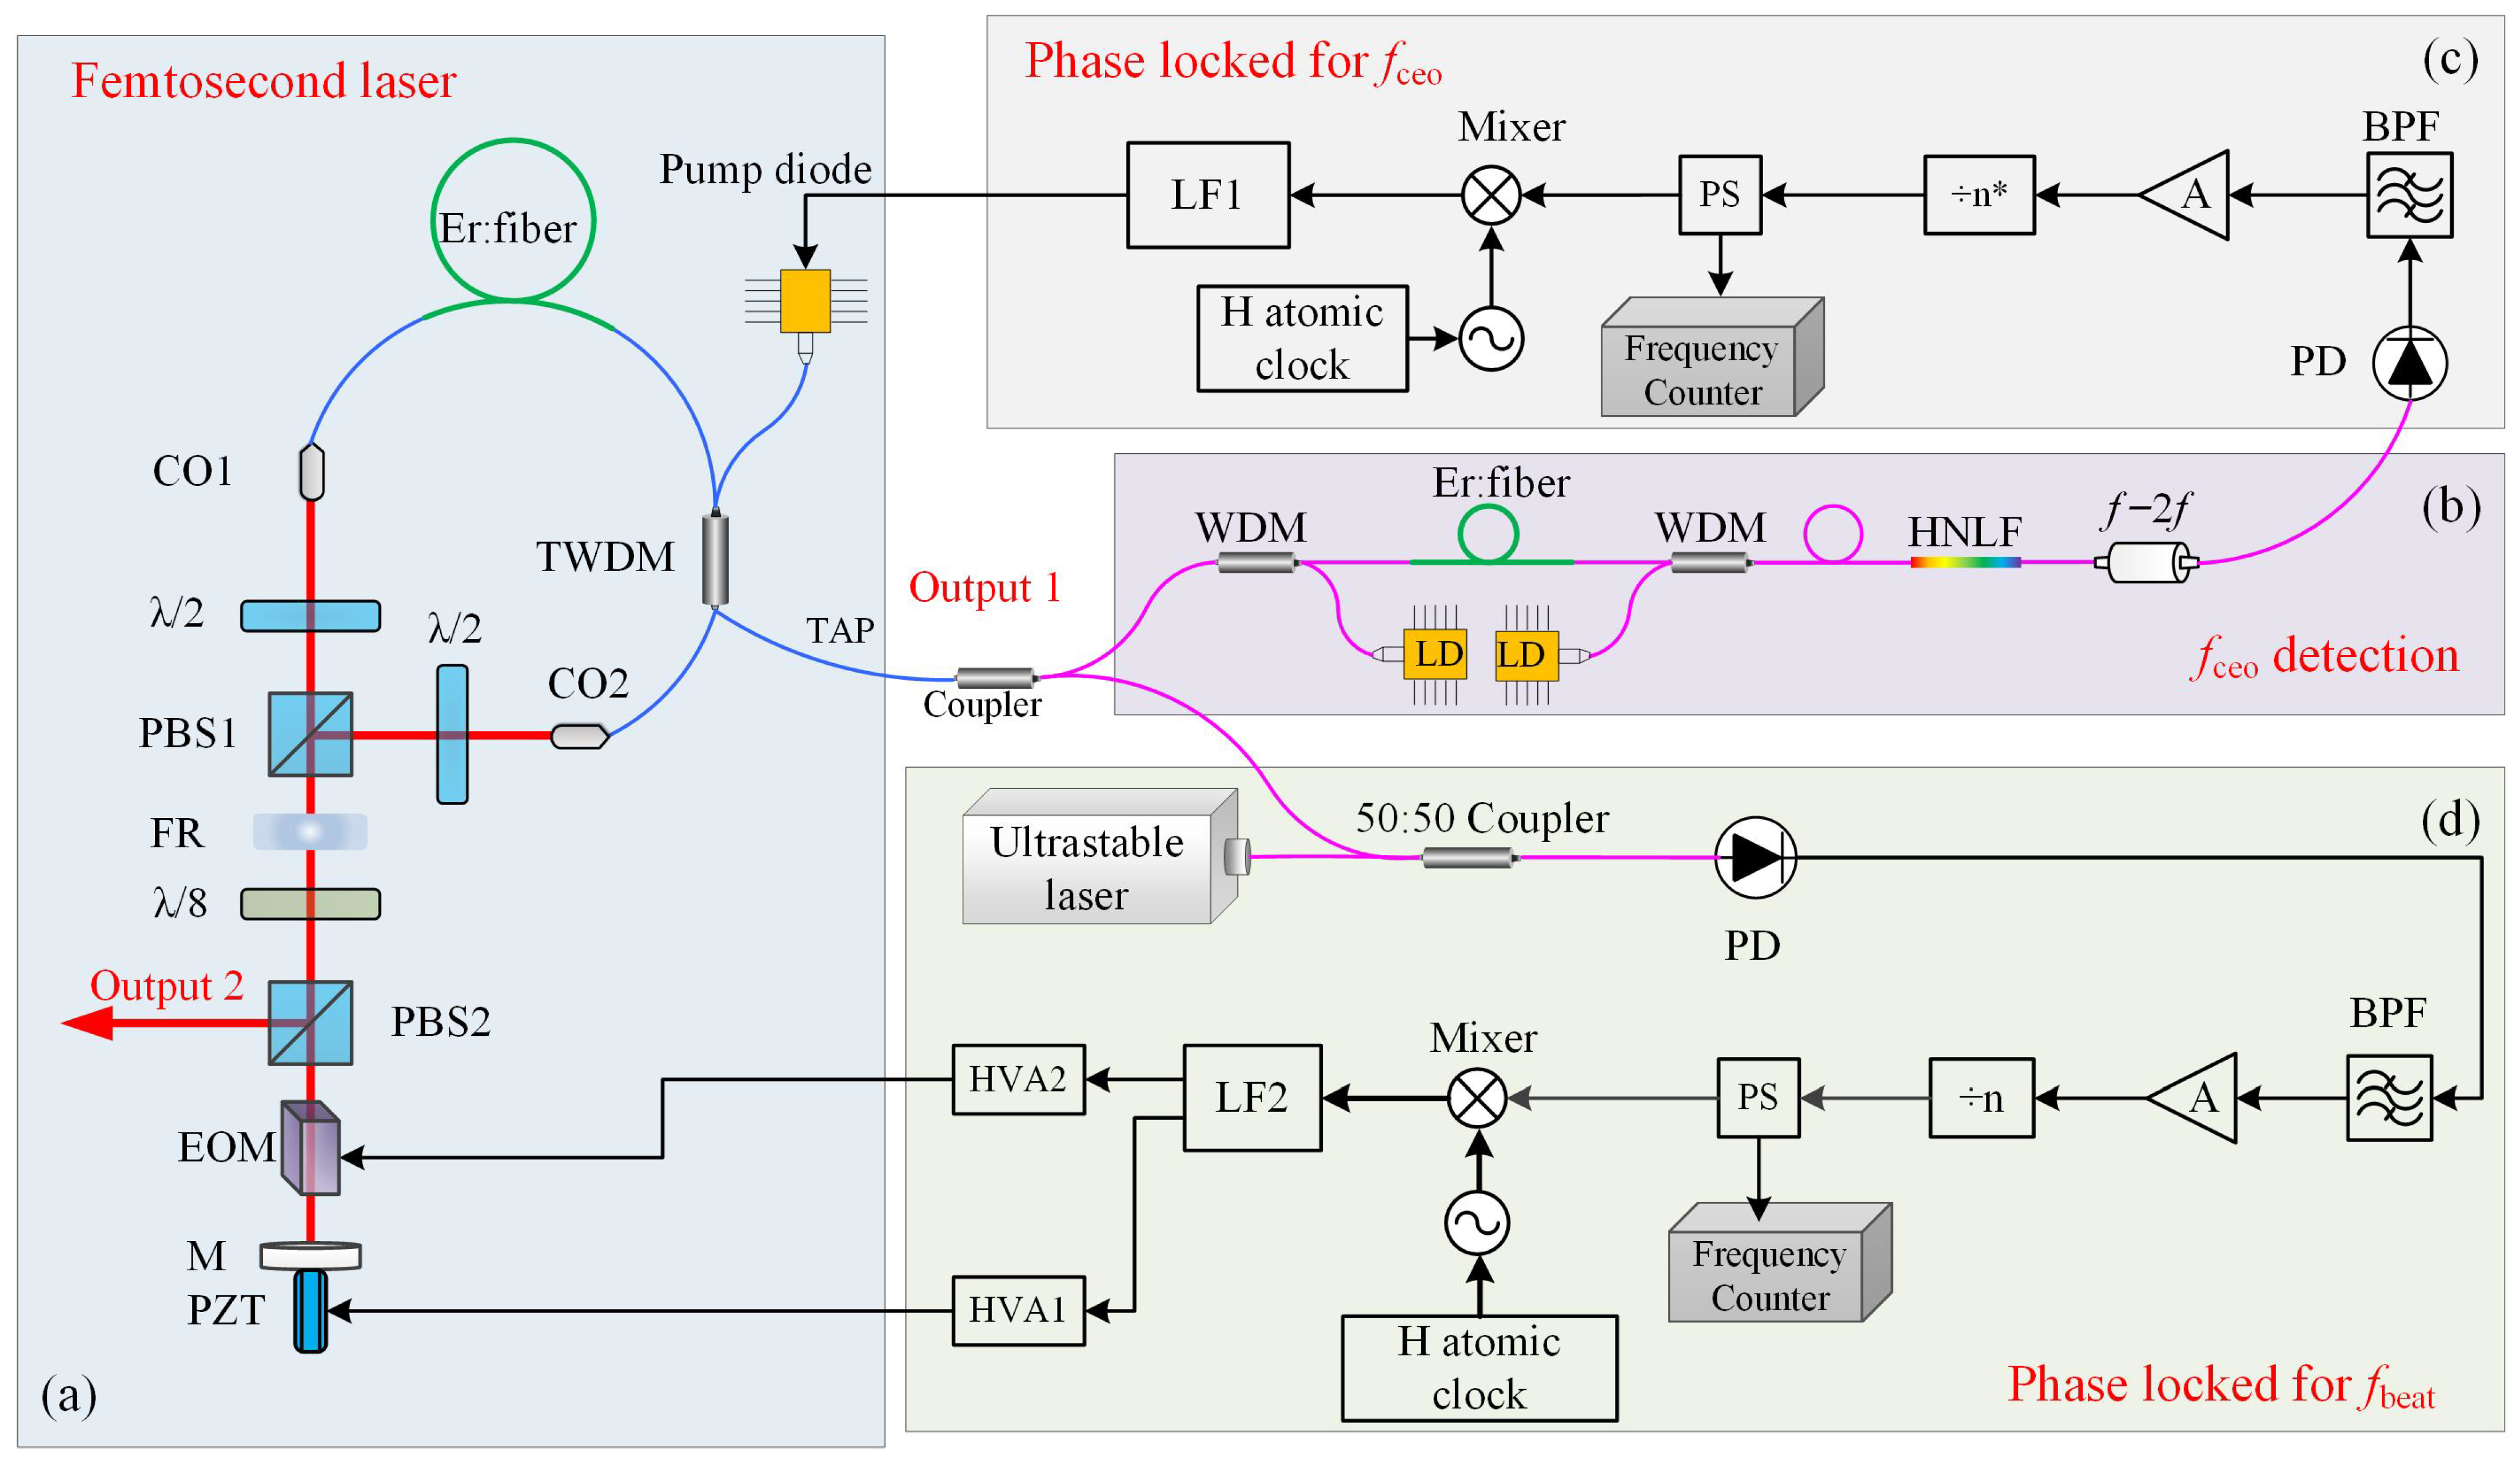
In the initial part, the frequency of a 1555 nm CW laser is stabilized to the resonant frequency of the cavity by employing the Pound–Drever–Hall (PDH) technique [23]. The CW laser inherits the stability of the optical cavity length. This leads to the generation of a highly stable frequency source centered at 193 THz. Its relative instability is about 7 × 10 16 within the time range from 1 to 10 s. Further details regarding the ultrastable laser can be found in Refs. [24,25].
The ultrastable laser experiment setup is shown in Figure 2, and the frequency was stabilized onto an F-P cavity using the well-known PDH technique [23]. The cavity has a cylindrical shape with a length of 10 cm and a diameter of 11 cm. Further, it is made of ultralow expansion glass. A commercial fiber laser is locked to the F-P cavity with a finesse of 610,000. The laser passes the acousto-optic modulator (AOM) twice to obtain the broadband frequency control effect. A voltage-controlled oscillator (VCO) operating at 80 MHz drives the AOM. It offers a 0.5 MHz servo bandwidth for the control of the laser frequency. The double-pass configuration enables a broad tuning range of approximately 10 MHz and offsets beam deflections [26]. A free space electro-optic modulator (EOM) cut at Brewster’s angle is employed to modulate the laser, significantly reducing the effects of residual amplitude modulation (the details can be found in Ref. [25]). Next, the error signal is obtained by mixing the EOM’s driver frequency signal and the cavity-reflected light after photodetection by an avalanche photodetector. Finally, the PDH servo-control electric circuit converts the error signal into two controller voltage signals. One is used to drive the VCO for rapid noise correction, while the other is used to adjust the piezoelectric transducer (PZT) voltage of the fiber laser for large range control.
Active feedback control is employed in the fiber noise suppression system to reduce the noise generated by the environment of the ultrastable laser output fiber [27]. This method is illustrated in the schematic diagram located in the lower left section of Figure 2. After passing through a polarizing beam splitter (PBS) 2, the frequency-stabilized CW laser is divided into two beams of unequal power by adjusting the half-wave plate, with a small portion serving as the reference light. The majority of the beam is modulated by the AOM, which operates at a resonance frequency of 110 MHz, and is then coupled into the single-mode fiber via an angled physical contact (PC) interface. The output end of the fiber employs a PC interface, reflecting 4% of the light back into the original optical path in accordance with Fresnel’s law. Analyzing the beat note of the reflected light and the earlier reference light portion in the PBS allows for the assessment of noise introduced by this transmission fiber. Subsequently, the noise can be reduced by adjusting the VCO’s voltage in the AOM driver, which is locked to an RF reference through a loop filter. It should be noted that the reflected light traverses the transmission fiber and AOM twice, requiring the error signal to be twice the frequency of the divider in the fiber noise suppression system.

2.2. OFC

The second part is an Er-doped fiber-based OFC, which is used as an optical frequency divider to divide the optical frequency to microwave/RF signals [28]. Generally, the frequency of a mode in an optical comb, denoted as ν n , is precisely determined by the equation ν n = n · f r + f c e o . Here, n is an integer (typically around one million in this context), f r represents the repetition rate of the laser pulses, and f c e o corresponds to the carrier–envelope–offset frequency. When f c e o is phase-locked to a stable radio frequency (RF) reference, the phase relationship between ν n and f r becomes firmly established.
In the photonic microwave generation system, the OFC serves as the optical frequency divider. The schematic diagrams of the Er:fiber femtosecond laser frequency comb and the frequency detection/control system are shown in Figure 3. The Er:fiber femtosecond OFC consists of a mode-locked laser (shown in part (a)), an f c e o generation and detection system (shown in part (b)), a phase-locked system for f c e o (shown in part (c)), and a phase-locked system for f r (shown in part (d)).
The oscillator is a femtosecond pulse mode-locked laser based on a nonlinear amplifying loop mirror [29], which consists of a fiber loop and a free space linear arm. To ensure robustness, all the fibers used are polarization-maintaining (PM) fibers. The fiber loop consists of a 40 cm long highly Er-doped fiber, a ∼50 cm single-mode PM fiber, and a wavelength division multiplexer. The free space part contains two collimators, three wave plates, a Faraday rotator, two PBSs, a PZT mounted on a high reflector, and a lithium niobate crystal (EOM) acting as a fast cavity length controller. When the mode-locked laser undergoes self-locking, an external RF signal must be applied to the same lithium niobate crystal. The 3 dB bandwidth of the OFC is about 30 nm centered at 1550 nm, and it has an output power of approximately 10 mW at the output 1 port. We used output 1 to generate fceo instead of the higher-power (∼50 mW) output 2 because the noise performance of output 2 is worse than that of output 1 [30]. A coupler splits output 1 into two parts. One is used to detect f c e o , while the other is used to detect f r and build the beat optical path between the OFC and an ultrastable laser.
The f c e o detection and frequency stabilization system are shown in Figure 3b,c, respectively. f c e o is obtained using the f − 2 f interference method. We conduct pre-chirping, amplification, and width compression to generate short pulses with an average power greater than 200 mW and a pulse duration of ∼80 fs. Thereafter, a spliced highly nonlinear fiber produces an octave-spanning supercontinuum (SC) from 1 μ m to 2 μ m. After that, the SC light is fed into a common-path f − 2 f interferometer. The f c e o is detected by an InGaAs photodetector with a signal-to-noise ratio (SNR) of ∼40 dB, under a 300 kHz resolution. We pick up the f c e o signal of OFC1 at 284 MHz (280.8 MHz in OFC2) with a band-pass frequency filter, and amplify the f c e o to ∼3 dBm. Subsequently, we divide the f c e o frequency with a 20-time frequency divider (40 times in OFC2) to 14.2 MHz (7.02 MHz in OFC2). A reference frequency, which is synchronized to a hydrogen clock, is used to produce the phase error signal by comparing its phase to the frequency-divided f c e o . We stabilize the f c e o onto the reference signal by feeding back the error signal to the diode-pumped laser’s current modulation port via a proportional-integral (PI) controller.
Figure 3d demonstrates the process of stabilizing f r onto an ultrastable laser. The beat note between the comb and the ultrastable laser is detected by an InGaAs photodetector, with an SNR of ∼35 dB under a 300 kHz resolution. We select the f b e a t of OFC1 at 319.6 MHz (270 MHz in OFC2) using a band-pass filter. Afterward, we employ a 40-time frequency divider to divide the selected signal to 7.99 MHz (6.75 MHz in OFC2) to improve robustness. The frequency-divided f b e a t signal is then mixed with a reference signal from a 10 MHz hydrogen clock to generate an error signal. This error signal is processed by a PI controller, and the output is amplified to 150 V using a high-voltage operational amplifier (PA88), which then drives the EOM and PZT. Finally, the f b e a t value is stabilized onto the reference frequency by controlling the EOM and PZT, yielding long-term tight phase locking.

2.3. Optic-to-Electronic Converter

The third part is an ultralow-residual-phase-noise optic-to-electronic converter, which is used to generate the photonic microwave signal from an OFC that phase-locked to the ultrastable laser. The generation of a microwave signal from an optical pulse train produced by an optical frequency comb (OFC) through direct photodetection faces precision limitations due to excess noise. This noise arises from several factors, including amplitude-to-phase conversion during photodetection, fluctuations in beam alignment, and pulse distortions caused by nonlinearities in the photodetector [31,32]. To compress the excess phase noise in the course of the optical-to-microwave conversion process, several significant techniques have been proposed and applied. One approach for achieving optic-to-electronic conversion is using a repetition-rate multiplier to redistribute the photocurrent to the desired harmonic frequency [33]. However, the obtained microwave rate is the 2 n -times repetition rate and the harmonic obtained through the n-cascade repetition-rate multiplier. Moreover, this method requires a wide-bandwidth photodiode with high-input power and saturability.

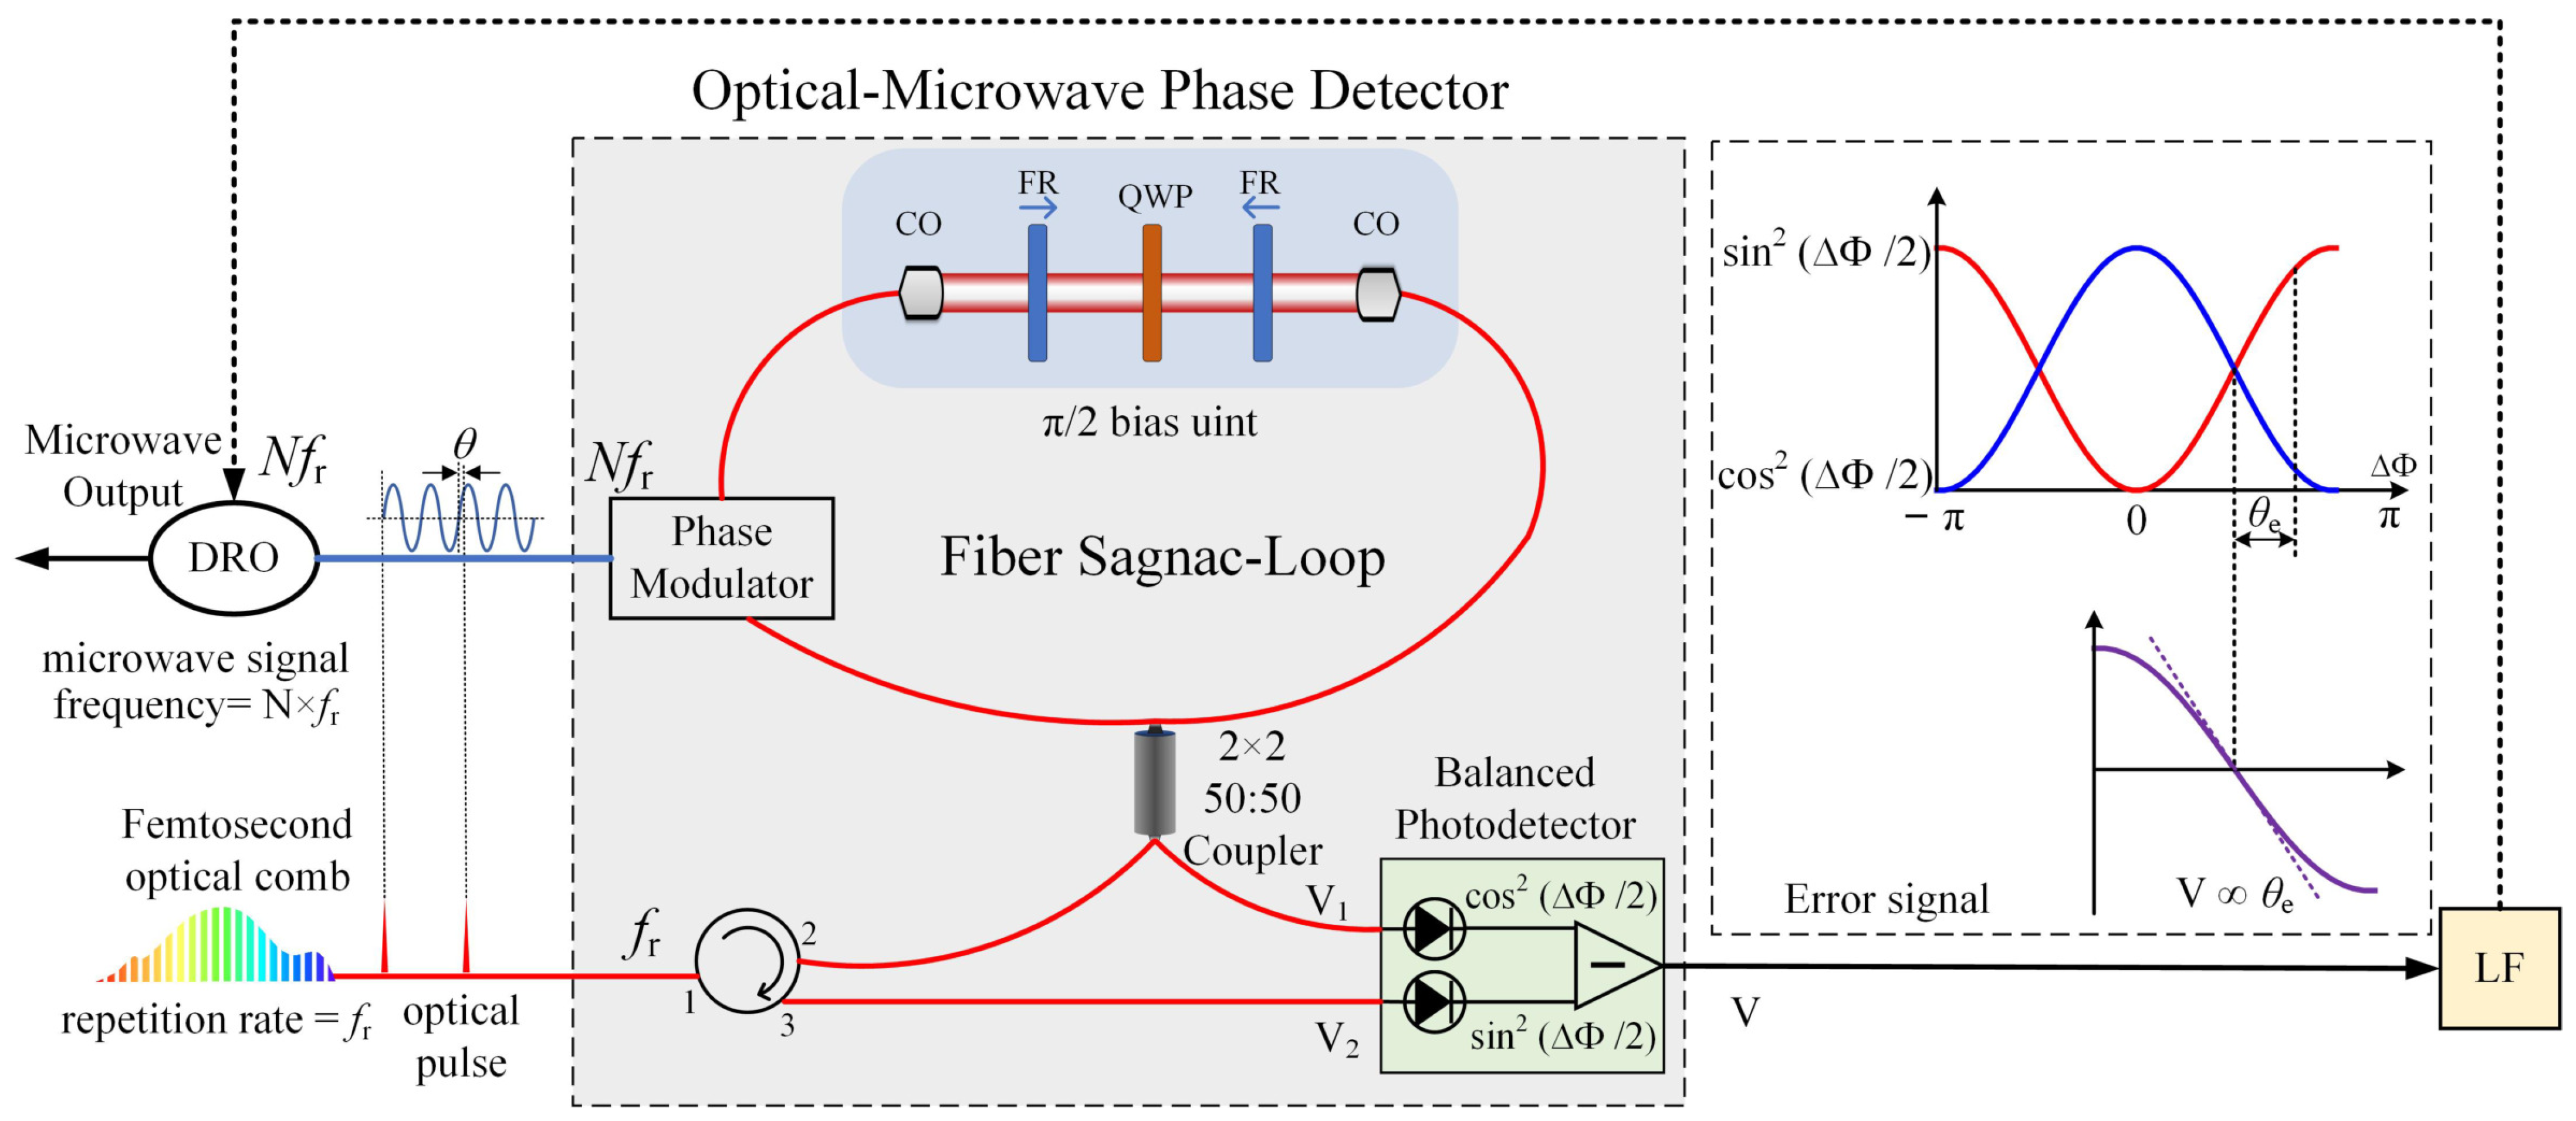
2.3.1. Experimental Setup of the Microwave Regeneration System

To address the issue mentioned above, a microwave signal regeneration method is used for the optic-to-electronic conversion, instead of the high-speed pulse train photodetection by using the cascaded MZI method. The schematic diagram is shown in Figure 4. At its core, this method involves phase locking a DRO onto a pulse of the phase-locked Er:fiber-based OFC and, subsequently, obtaining the ultrastable, photonic microwave signal from the DRO. To ensure long-term stability and high-precision synchronization between the DRO and OFC, a FLOM-PD is employed to detect and compensate for their phase error in the optical domain [34,35,36]. In this case, the optical-to-microwave phase is defined as the distinction between the mode-locked pulse and the zero-crossing point of the microwave signal, which is represented by θ , as shown in Figure 4. We can determine the relative relationship between the mode-locked pulse and the microwave signal by using the optical-to-microwave phase and, subsequently, obtain their relative relationship in the time domain.
The gray section of Figure 4 illustrates the schematic of the optical-to-microwave phase detector. This detector incorporates a fiber-based Sagnac loop, which consists of a unidirectional high-speed LiNbO3 phase modulator and a nonreciprocal phase shifter ( π /2). The optical pulse is injected into the fiber loop via a circulator. A microwave signal, with a frequency that is an integer multiple of the laser repetition rate, modulates the optical pulse through the phase modulator. The voltage difference between the two outputs of the Sagnac loop corresponds to the phase error ( θ e ) between the optical pulse train and the microwave signal. This voltage signal, detected by a balanced photodetector, enables accurate optical-to-microwave phase detection. Using a PI controller, the DRO frequency can be phase-locked based on this output voltage. As a result, an ultrastable frequency signal with a value of N f r is regenerated from the phase-stabilized DRO.

2.3.2. Principle Analysis of the Optical-to-Microwave Phase Detector

The gray dotted box in the middle of Figure 4 illustrates the schematic of the optical-to-microwave phase detector. A mode-locked Er:fiber laser operating at a repetition rate of 200 MHz serves as the pulse source. The input optical pulse train is directed through an optical circulator and then introduced into the Sagnac loop via the circulator’s output 2 port using a 50:50 coupler. Within the Sagnac loop, a 9.6 GHz phase modulator is strategically placed to ensure that the temporal delay between the counterpropagating pulses at the modulator matches the period of the RF signal, which is approximately 0.1 ns for the 9.6 GHz dielectric resonator oscillator (DRO). Moreover, the nonreciprocal phase shifter within the Sagnac loop guarantees that the phase difference between the counterpropagating light beams is maintained at π /2. This guarantees that the two pulses undergo inverse phase modulation. A balanced photodetector is utilized to detect the output optical beams. This phase difference is mainly caused by the nonreciprocal π /2 phase shifter and phase modulator.
In this system, we employ a traveling-wave phase modulator. The light traveling in the same direction as the microwave signal will be effectively modulated when a microwave frequency signal is applied to the phase modulator. Further, the light in the opposite direction of propagation of the microwave signal will not be effectively modulated [37,38]. The phase provided by the phase modulator changes dynamically in response to the voltage applied to it.
Interference occurs when the counterpropagating pulses reach the coupler again along the loop. The two voltages output by the Sagnac loop interferometer are detected by a balanced photodetector. The output voltage of the balanced photodetector is denoted as Δ V , which is expressed by the following formula:
Δ V = E 2 cos Δ Φ · R ,
where R is the resistance of the photodetector. Δ Φ is the phase difference of the Sagnac loop, which is the sum of the π / 2 phase shift and the phase difference introduced by the phase modulator. Consider that the microwave signal applied to the phase modulator is a sine wave:
V = V 0 sin ( 2 π f R F t ) ,
where f R F is the frequency of the microwave signal output from the DRO and V 0 is the amplitude of the microwave.
If we substitute Δ φ = π V π V (phase error generated by phase modulation) and Equation (2) into Equation (1), the Δ V can be written as
Δ V = E 2 sin ( π V π V 0 sin ( 2 π f R F t ) ) R .
It can be inferred from the above formula that if the pulse coincides with the zero point of the microwave signal, then Δ V = 0. Namely, the output of the balanced detector is 0; if not, then Δ V ≠ 0, i.e., the output of the balanced detector is not 0. When the frequency of the microwave signal is exactly an integer multiple of the laser’s pulse-repetition frequency, i.e., f R F = N f r , the output corresponding to the balanced detector is a constant value. When f R F N f r , the output of the balanced detector will change with time. If the difference between the integer multiple of the laser’s pulse-repetition frequency and the frequency of the microwave signal is constant, the output of the balanced detector will change periodically, i.e., the error signal will have a stable frequency.
The sensitivity of the optical-to-microwave phase detection is given by
K d = Δ V θ e ,
where θ e represents the optical-to-microwave phase and Δ V represents the corresponding phase detection voltage.
Further, θ e can be written as follows:
θ e = 2 π f R F Δ t ,
K d = Δ V θ e = Δ V 2 π f R F Δ t .
Here, Δ t represents the time difference corresponding to the optical microwave phase θ e in the time domain. Considering that the phase detection occurs in a small area near zero, the θ e = 2 π f R F Δ t value is small. Thus, Equation (3) can be written as:
Δ V = E 2 π V π V 0 θ e R .
When x approaches 0, sinx = x. Thus, the phase detection sensitivity ( K d ) can be written in the following form:
K d = G R E 2 π V π V 0 = G R P i n ϕ 0 ,
where G represents the transimpedance gain of the balanced detector, P i n = | E | 2 represents the input optical power of the optical-to-microwave phase detector, and ϕ 0 = π V 0 / V π represents the modulation depth.

3. Results

We have evaluated the performance of the entire photonic microwave generator, as well as that of each component.

3.1. Ultrastable Laser Performance Evaluation and Results

We built two identical ultrastable lasers for the performance evaluation. We photodetected the beat note signal between the two ultrastable lasers and recorded the beat note by using a dead-time free Π -type counter (K + K Messtechnik, Witten, Germany, model FXQE80) in the phase-averaging mode. Figure 5a shows the frequency instability result of the ultrastable laser. The modified Allan deviation was employed to determine the frequency instability of the ultrastable laser. The instability value was 7 × 10 16 at 1–10 s on average. The phase noise power spectral density (PSD) of the ultrastable laser is demonstrated in Figure 5b. We converted the beat note signal into a voltage fluctuation by using a homemade frequency-to-voltage converter. Further, the voltage fluctuation signal was inputted into a fast Fourier transform (FFT) analyzer (Stanford, Sunnyvale, CA, USA, model SR785), and the results indicated that the performance of the ultrastable laser is close to the calculated thermal noise limit.

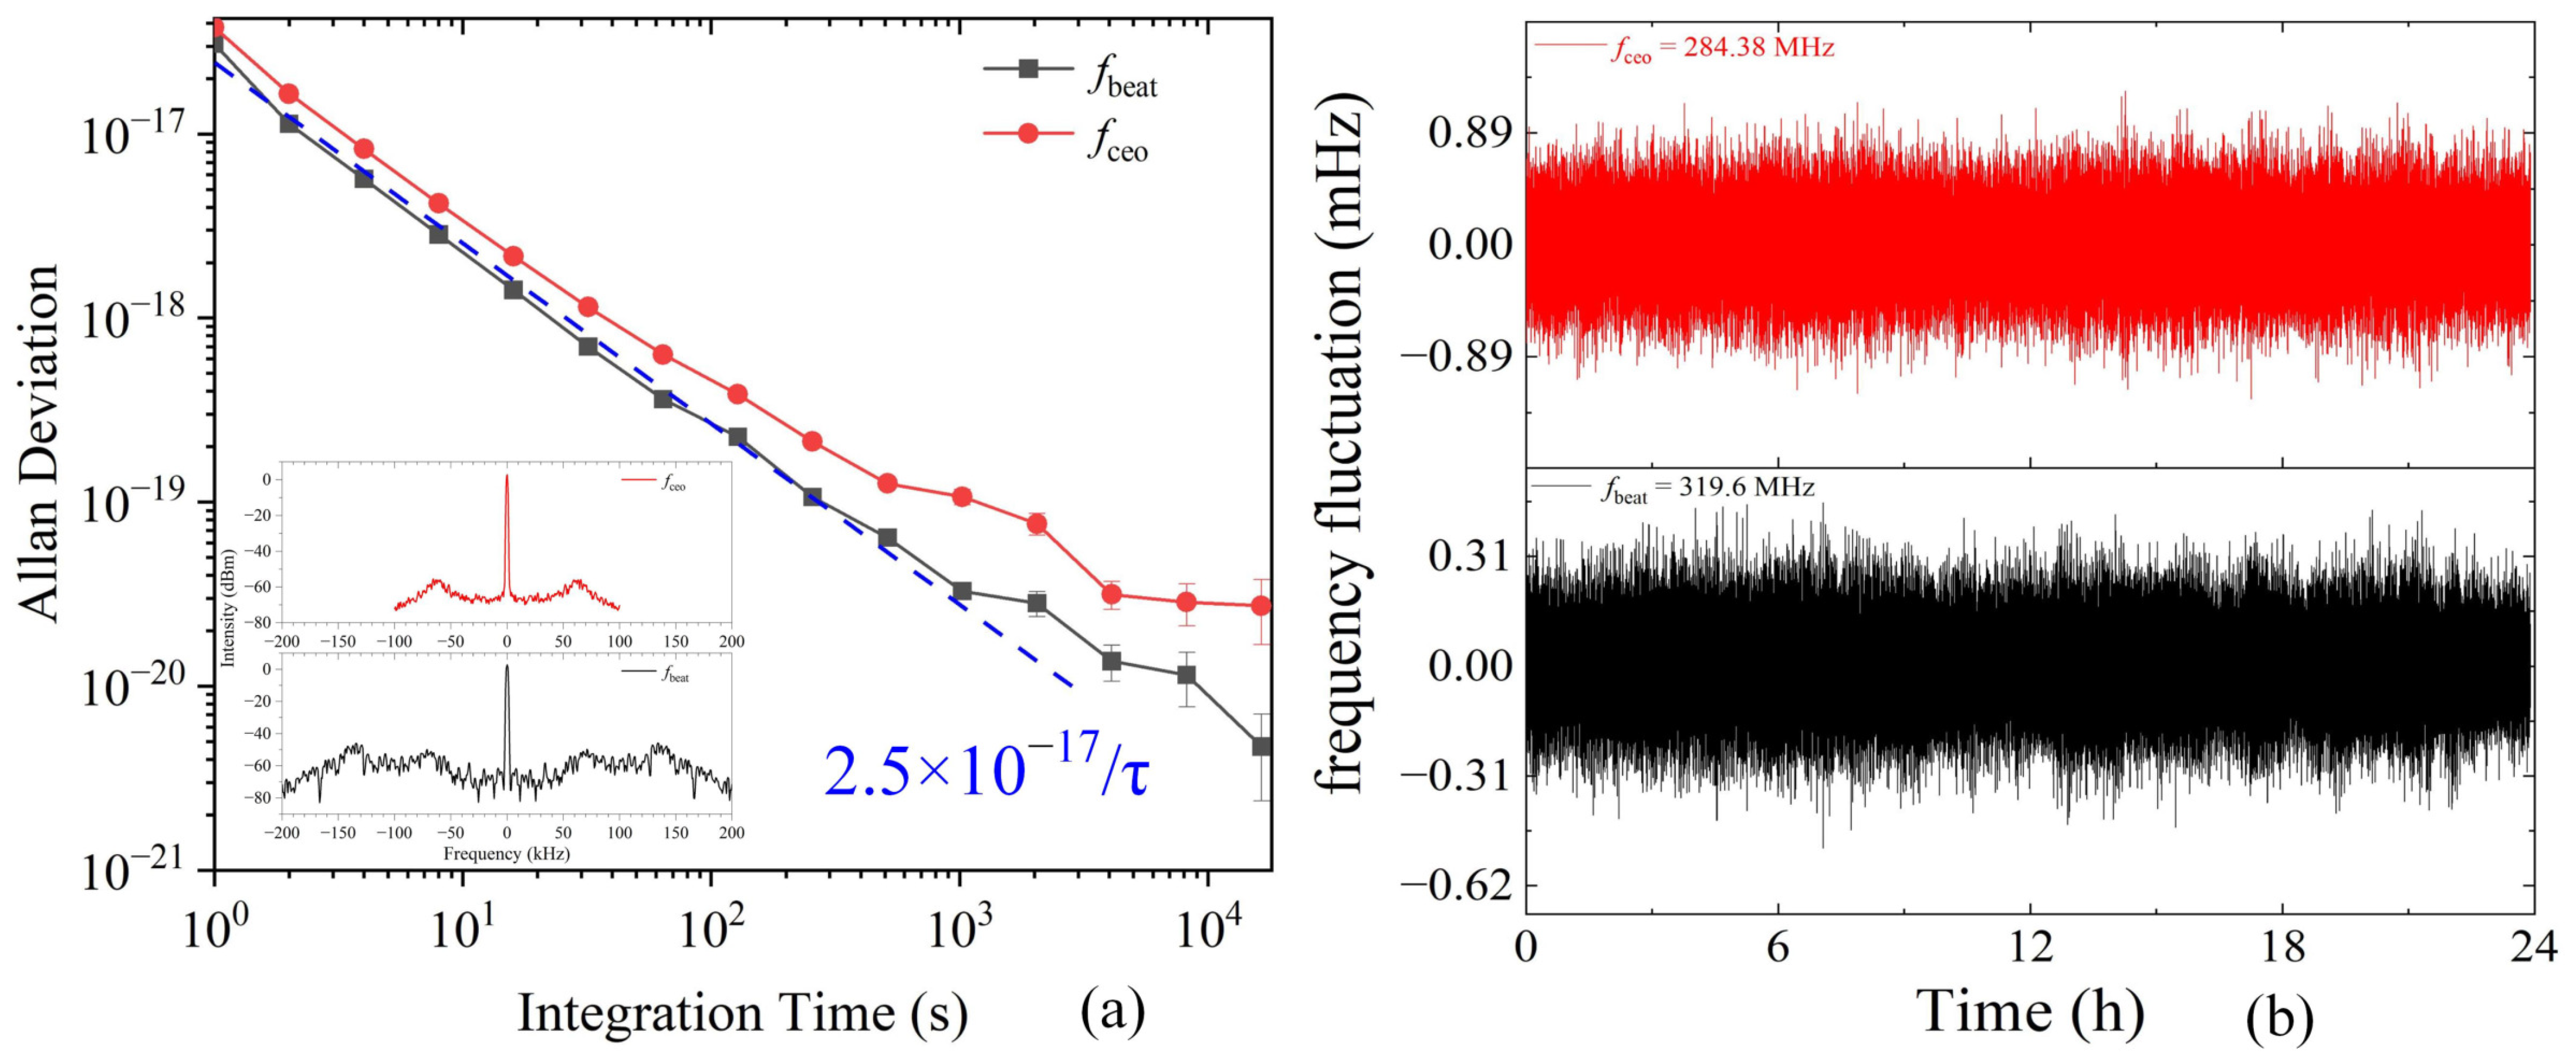
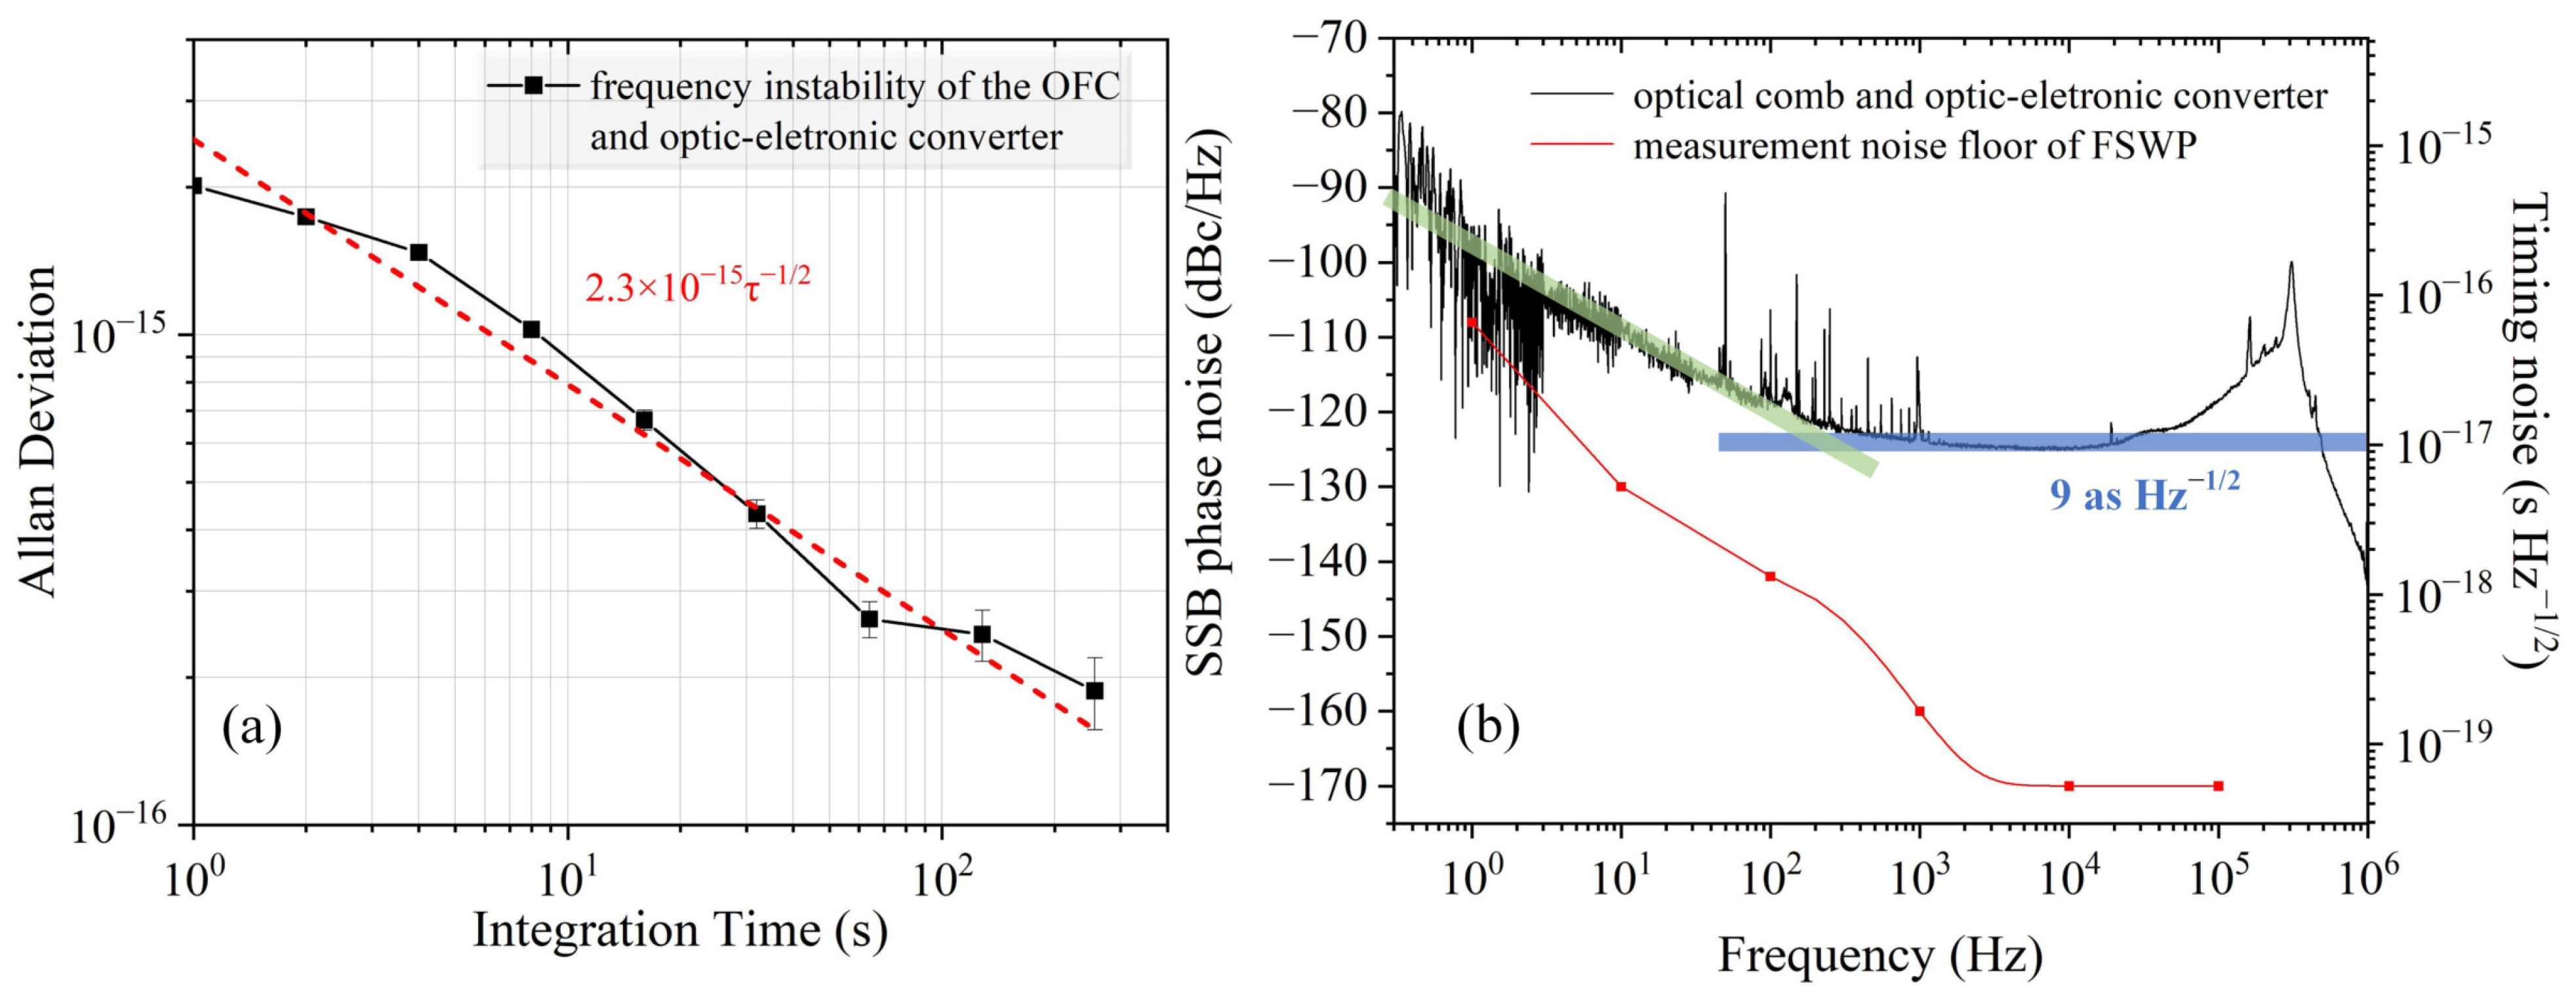
3.2. Performance Evaluation and Results of the Femtosecond OFC

We have evaluated the in-loop frequency control capability of f c e o and f b e a t to characterize the performance of the OFC. The frequency-stabilized f c e o and f b e a t values are recorded with a dead-time Π -type counter under the 1000-time averaging mode. Figure 6a demonstrates the in-loop relative frequency instability and phase-locked bandwidths of f c e o and f b e a t . The frequency instability of f c e o is approximately 3.8 × 10 17 at 1 s and decreases to 10 20 at 10 4 s, with a slope of 1 / τ . The frequency instability of f b e a t is approximately 3 × 10 17 at 1 s and decreases to the 10 21 level at 10 4 s, with a slope of 1 / τ . The phase-locked bandwidth of fceo is approximately 70 kHz, while the phase-locked bandwidth of fbeat is around 140 kHz. Figure 6b shows that the frequency fluctuations of the phase-stabilized f c e o and f b e a t are approximately 1.78 mHz and 0.62 mHz, respectively. Note that the frequency stabilization system of f c e o uses a 20-time frequency divider and the pump–current slow feedback mode. Therefore, the phase-locked system performance of f c e o is almost the same as that of f b e a t ’s.

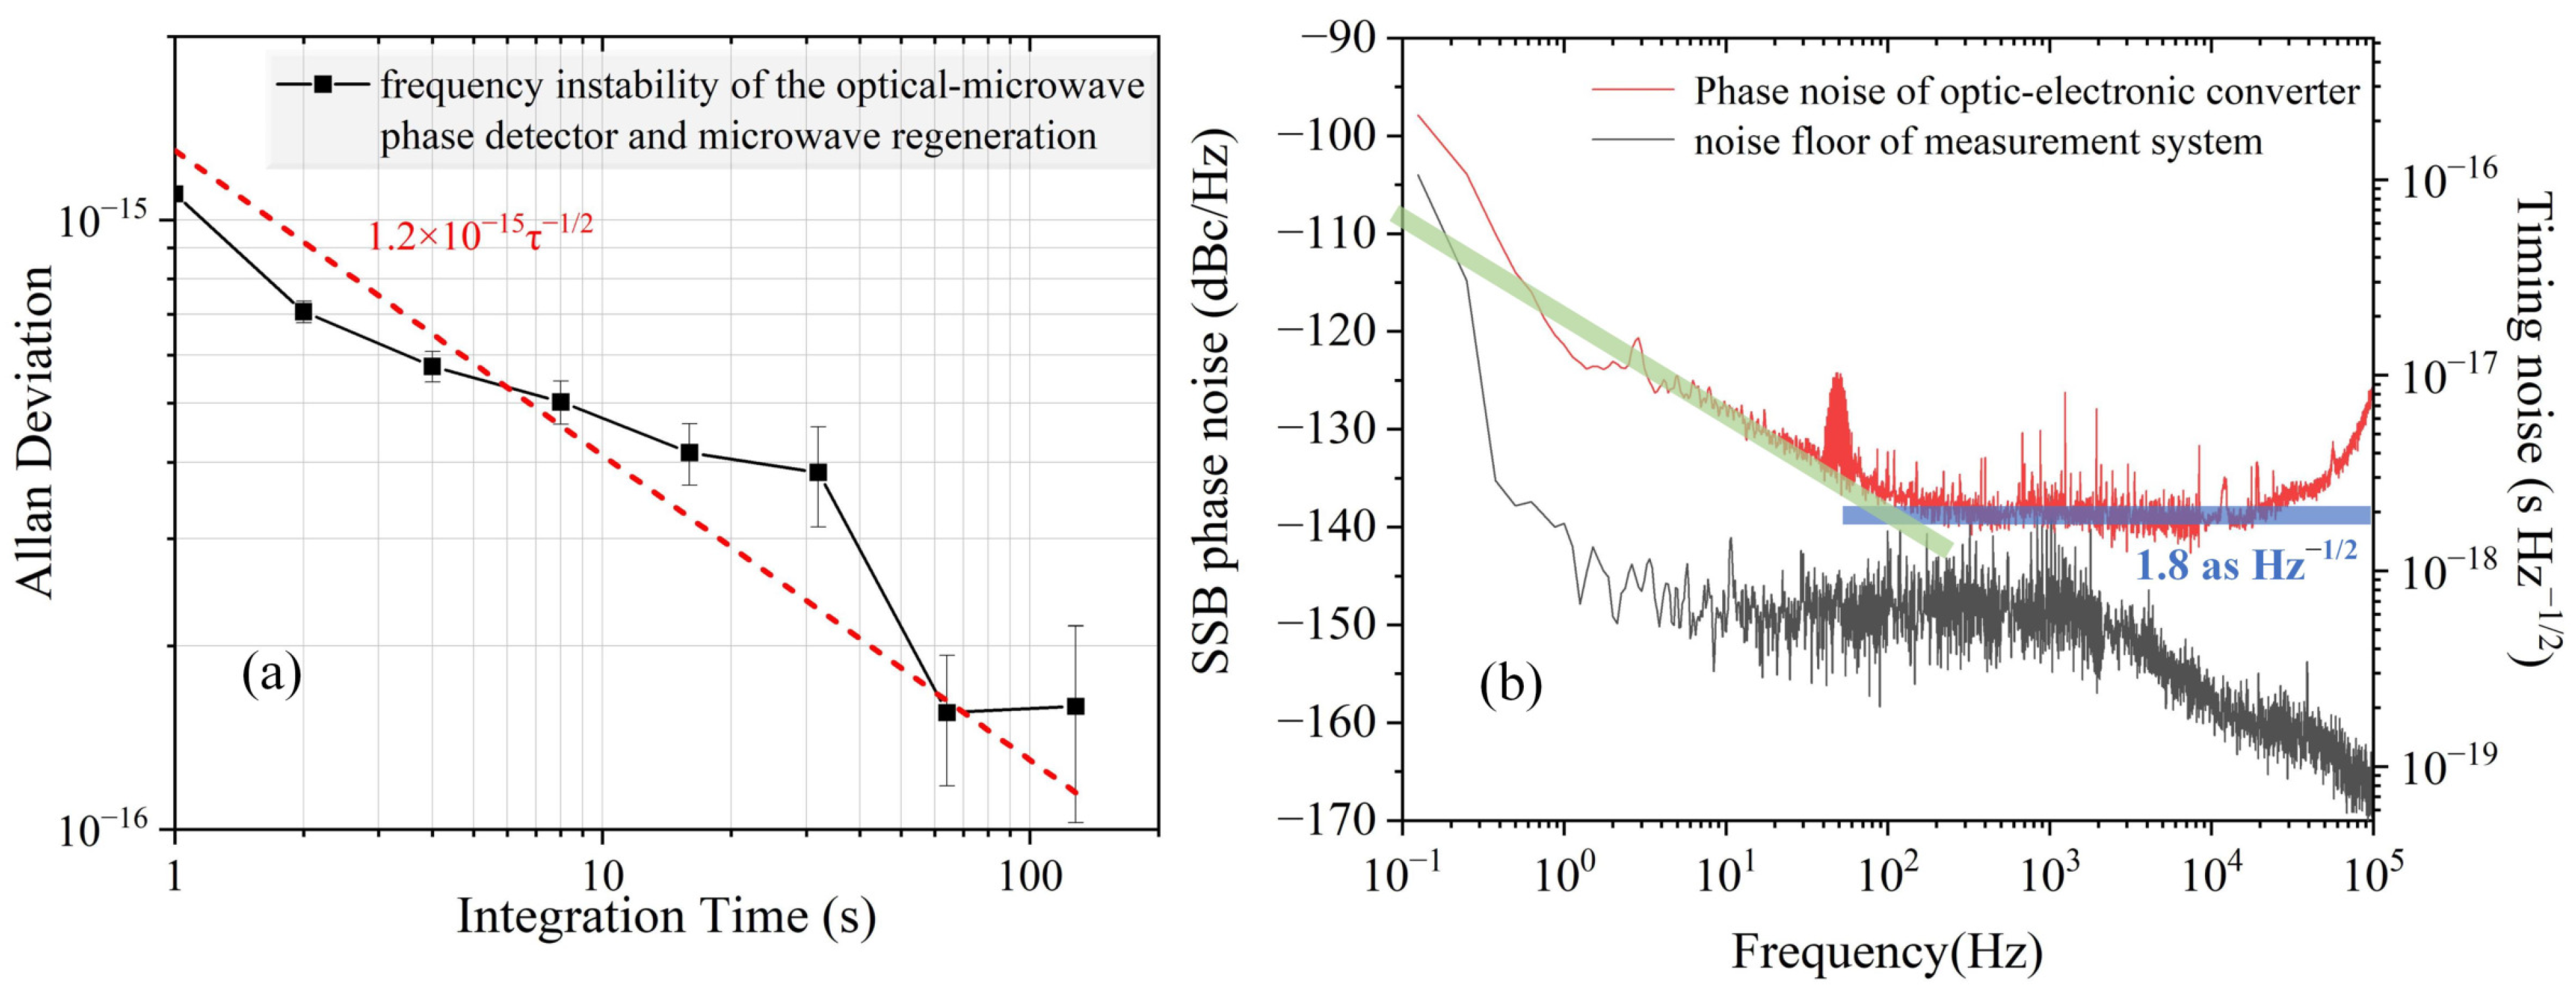
3.3. Performance Evaluation and Results of the Optic-to-Electronic Converter

To assess the relative frequency instability and additional phase noise of the optical-to-microwave conversion system, we have built two independent and identical systems to perform evaluation by comparing with each other, as shown in the green dashed box of Figure 7. Both of these optical-to-microwave conversion systems were phased-locked to a common OFC and generated two 9.6 GHz signals. The phase detector was a 7 dBm level mixer that gives the phase difference variation. A phase shifter was employed to establish the quadrature phase difference between the two 9.6 GHz signals at the mixer inputs. The signal output from the mixer IF port transformed the phase noise into voltage fluctuations. Thereafter, the voltage was separated into two parts: one was transmitted to an FFT analyzer to test the additional phase noise, while the other was inputted into a digital voltmeter to record the voltage fluctuations and calculate the Allan deviation by Stable32.
The relative frequency instability and the single sideband (SSB) phase noise of the optic-to-electronic converter are shown in Figure 8. In this record, the phase jitters were converted into the voltage fluctuations, which were outputted through the mixing of two identical optic-to-electronic converter systems and recorded by a digital voltmeter with a 7 1 2 digital resolution. The Allan deviation was calculated via these phase differences using the Stable32 software. The frequency instability was 1.1 × 10 15 at 1 s. An FFT analyzer was employed to measure the phase noise PSD, as shown in Figure 8b (red curve). The phase noise at 1 Hz is 121 dBc/Hz, and at lower Fourier frequencies, the phase noise deviates from the 1/f behavior. From 100 Hz to 20 kHz, the phase noise is approximately 138 dBc/Hz, which corresponds to a timing noise of 1.8 attosecond Hz−1/2.

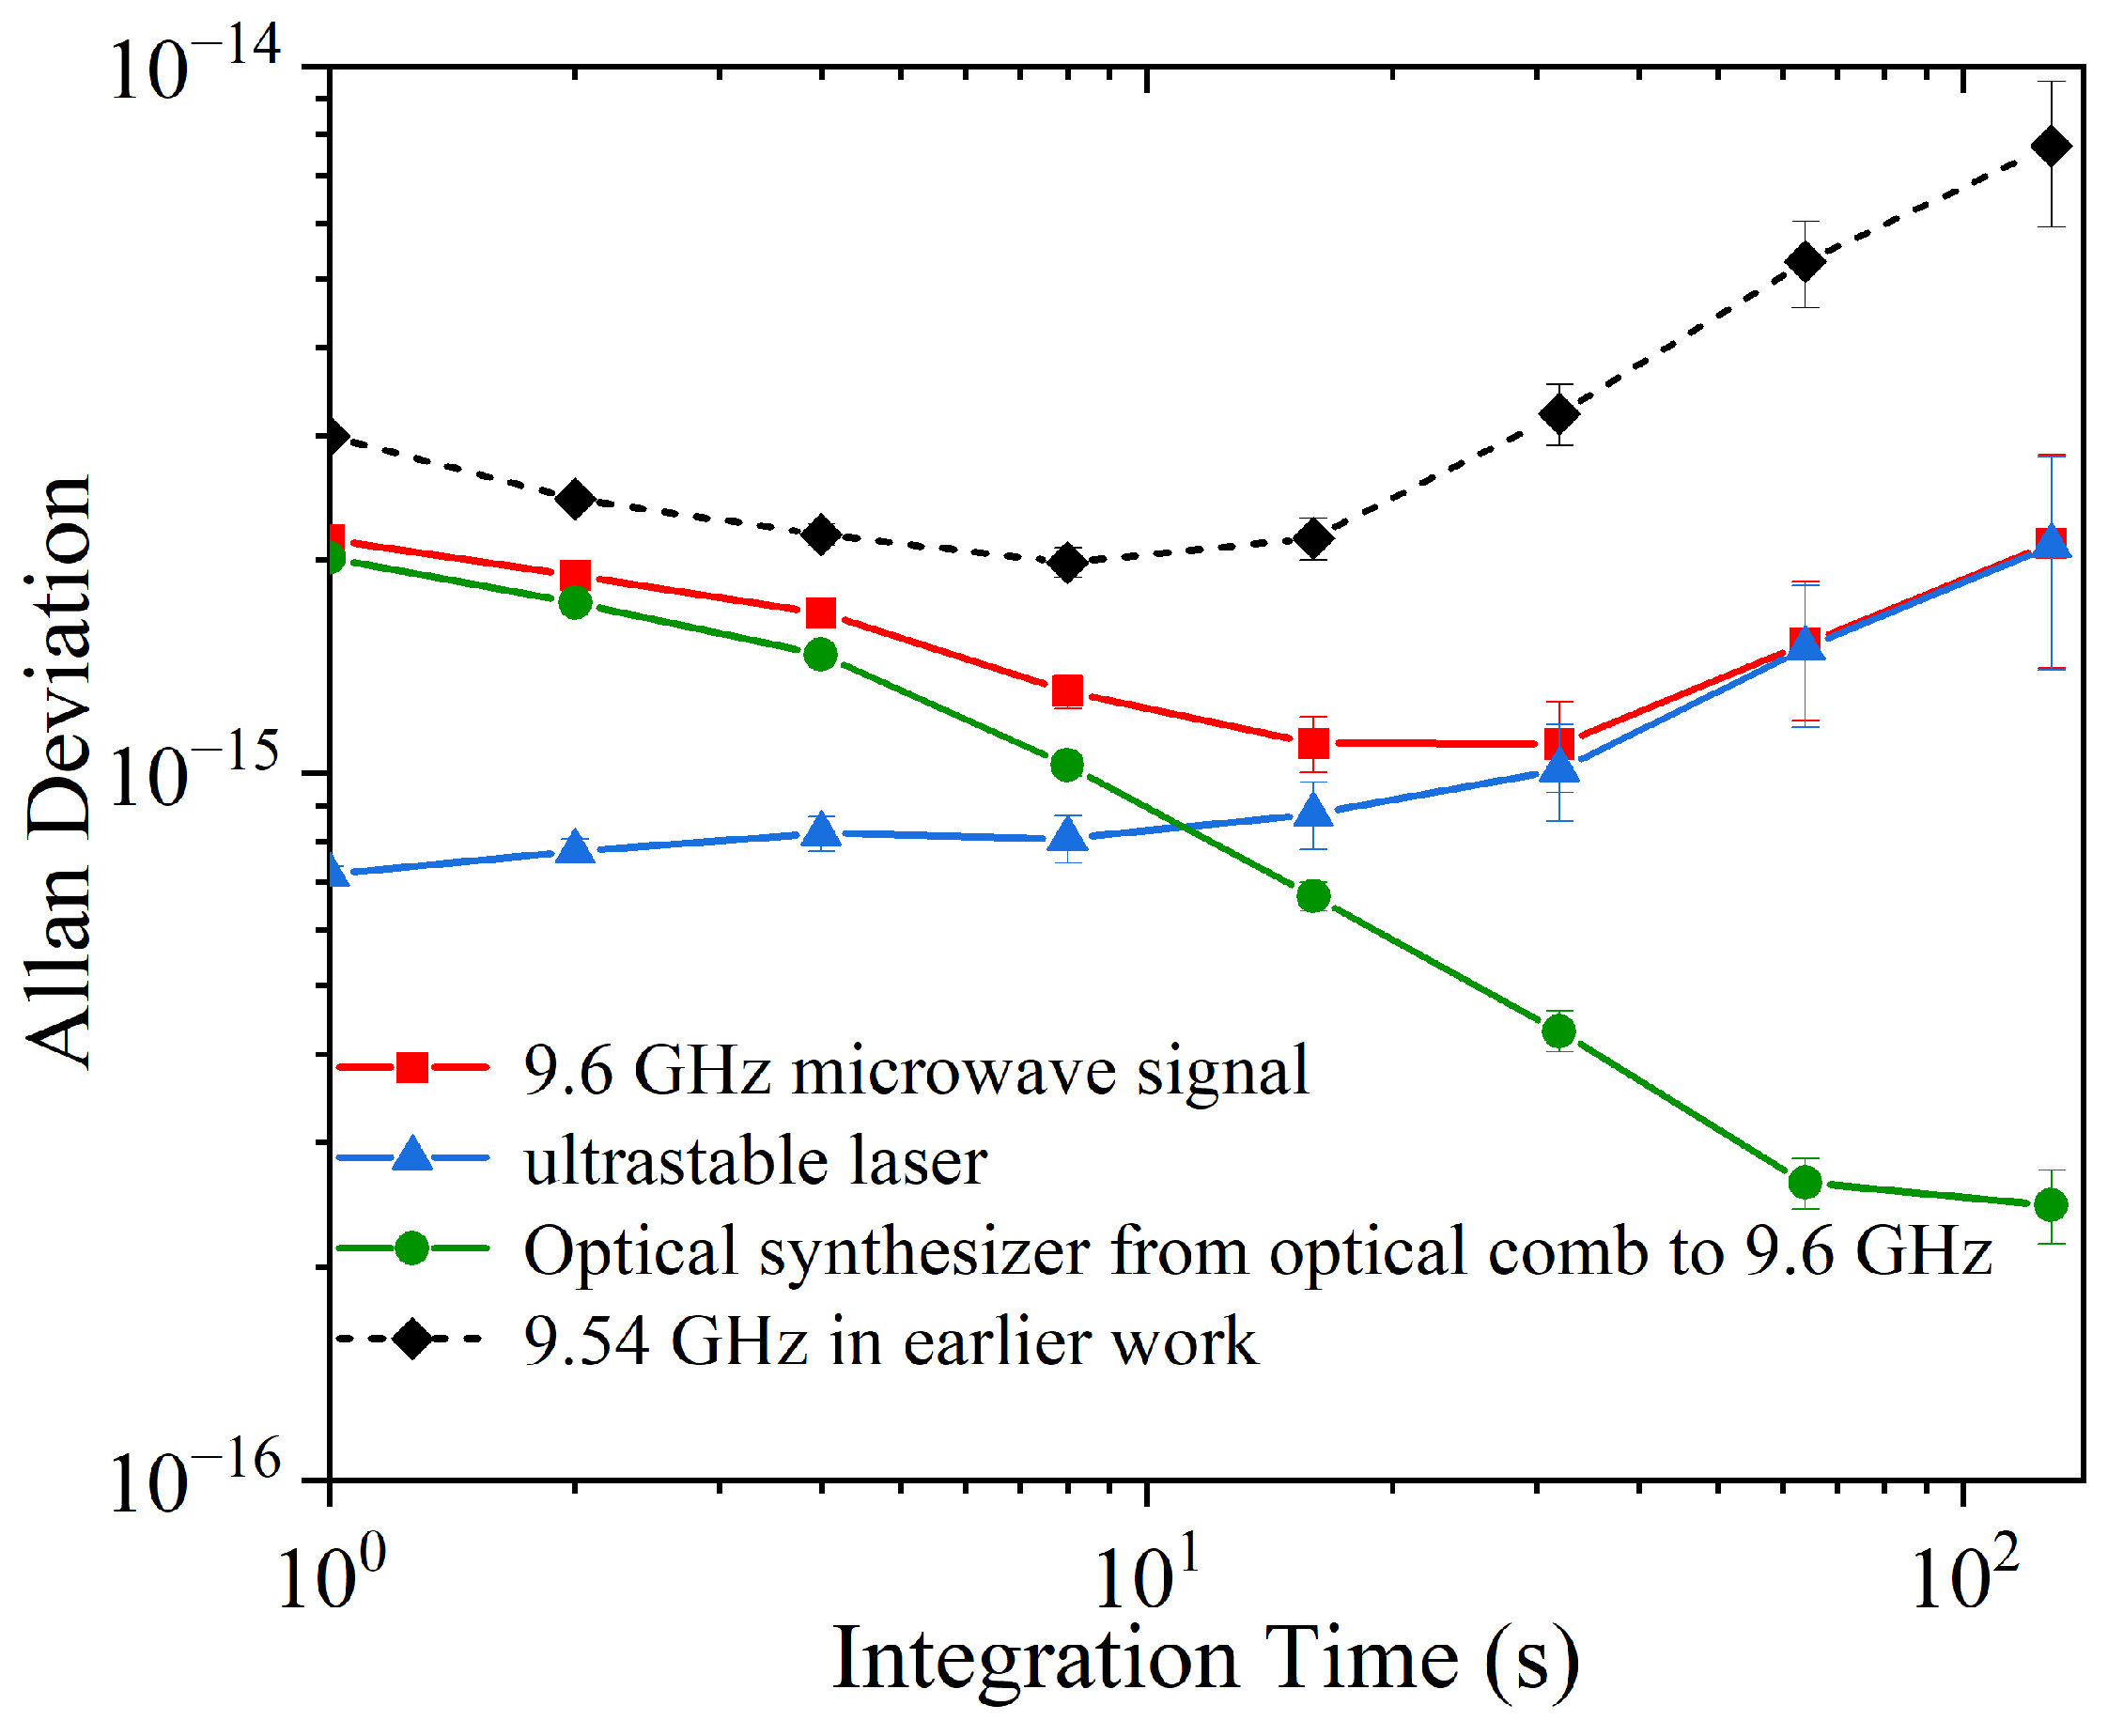
3.4. The Frequency Instability of the Photonic Microwave Generator

To evaluate the performance of the photonic microwave generator more accurately, a comparable or superior reference system was needed. Therefore, we built a separate but identical reference system, which is shown in Figure 7. The auxiliary assessment system includes an OFC with a repetition rate of 200,000,130 Hz, the 48th harmonic of the f r detection part, and an optical-to-microwave converter to regenerate the ∼9.6 GHz microwave reference. Both photonic microwave generator systems were referenced to a shared ultrastable laser.
We evaluated the frequency instability of the photonic microwave signal by comparing the two outputs from the under-test system and the reference system. In this measurement, the 10 MHz reference was supplied by an H-master clock with a frequency instability of 10 13 at 1 s. The measurement noise floor of the employed frequency counter (Agilent, Santa Clara, CA, USA, model 53230A) was at the level of 10 12 at 1 s when a 100 MHz signal was measured. Therefore, the frequency difference of the two microwave signals should be less than 1 MHz to improve the equivalent measurement noise floor by 10 15 at 1 s. In practice, we changed the repetition rate of one comb to be similar to the other. The f r of the under-test comb was 200,000,130 Hz, while that of the reference f r was 200,015,918 Hz. Thus, the difference in frequency was approximately 757 kHz. The relative frequency instability was evaluated by calculating the Allan deviation of the 757 kHz signal normalized with 9.6 GHz. We employed the phase noise analyzer (Rohde & Schwarz, M u ¨ nchen, Germany, model FSWP 8) for the phase noise evaluation. However, since the phase noise analyzer allows signal phase noise measurements from 1 MHz to 8 GHz, we mixed the under-test microwave down to ∼1 MHz with the reference microwave by changing the repetition rate of the reference system.
The performance measurement results of the optical divider and the microwave regeneration part are demonstrated in Figure 9. The frequency instability is 2 × 10 15 at 1 s, as shown in Figure 9a. The phase noise is 106 dBc/Hz at 1 Hz and 109 dBc/Hz at 10 Hz, as shown in Figure 9b (black curve). Furthermore, from 1 kHz to 100 kHz, the phase noise is 125 dBc/Hz, which corresponds to a timing noise of 9 as Hz−1/2.
Finally, the frequency instability of the 9.6 GHz signal was derived from the ultrastable laser, assuming the OFC and optic-to-electronic converter contribute independent noise. Therefore, the frequency instability of the photonic microwave-generated signal was obtained by taking the arithmetic square root of the square sum of these components. The green curve shows the frequency instabilities of the OFC and the optic-to-electronic converter, and the blue curve in Figure 10 demonstrates the frequency instability of the ultrastable laser. In this way, we estimated the relative frequency instability of the 9.6 GHz signal to be 2.1 × 10 15 at 1 s, as shown in the red curve of Figure 10. Compared to that of the 9.54 GHz signal (the black dotted curve) generated previously by the photonic microwave generator, the frequency stability is improved by a factor of 1.5.

4. Discussion

Here, a photonic microwave generation system has been demonstrated, where an Er:fiber-based OFC is phase-locked to an ultrastable laser at 1550 nm wavelength. A 9.6 GHz (48th harmonic of the repetition rate) microwave signal with a frequency instability of 2.1 × 10 15 at 1 s was achieved by the microwave regeneration method from the optical pulse of the phase-locked comb. Further, the frequency stability was 1.5 times better than that of the previous system using a cascaded MZI for the optical-to-microwave conversion. Considering that the frequency instability of the ultrastable laser was 7 × 10 16 at 1 s, the optic-to-electronic converter with a frequency instability of 1.1 × 10 15 mainly limits the generated microwave signal. For this method, the optic-to-electronic conversion relies on an optical-to-microwave photodetector, and most of the components of the optical-to-microwave phase detector are fiber devices. We hypothesize that the fiber length deviation and fiber noise introduced by the environment may deteriorate the additional phase noise. Conversely, the phase detector requires equal power intensities for the two input lights of the balanced photodetector. However, one of the light outputs from the Sagnac loop passes through the circulator before reaching the balanced photodetector. Therefore, although we carefully adjusted the optical power of the two input lights of the balanced detector, there may still be the problem of unbalanced light intensity. Therefore, the power imbalance may lead to noise deterioration during the optic-to-electronic conversion process.
To explore other technologies to further reduce the additional noise in the optic-to-electronic conversion process, we analyzed the phase noise of microwave signals introduced during direct photodetection. The phase noise of the obtained microwave signal was determined by the SNR of the photodetection unit. The detected f r signal’s additional phase noise primarily originated from thermal noise, shot noise, and amplitude-to-phase conversion caused by saturation effects [39]. Reference [40] confirms that the corresponding SSB phase noise introduced by the thermal and shot noises can be effectively suppressed at relatively high-input optical powers when the PD is not saturated. Moreover, the saturation of the photodetector is due to short-term charge accumulation and is dependent on the energy of the laser pulse. The Er:fiber-based OFC has a relatively low repetition rate (in this case, ∼200 MHz) and correspondingly high pulse energy. As such, the saturation rate of the photodiode increases during the photodetection of the repetition rate. Considering this characteristic, other methods for reducing the addition phase noise should be considered. One such approach is to cut down the single-mode energy of the pulsed light, thereby increasing the saturation point of the photodiode. Another involves the direct use of high-saturation, high-speed photodetectors. The research is in progress.

5. Conclusions

We have demonstrated a photonic microwave generation source based on a high-finesse F-P cavity, where an Er:fiber-based OFC is phase-locked to an ultrastable laser. To improve the frequency stability of the optical-to-microwave frequency conversion, a microwave signal regeneration method based on the fiber Sagnac loop was employed instead of the repetition-rate multiplier method. Lastly, an additional frequency instability of 1.1 × 10 15 at 1 s was achieved by comparing two identical and independent systems, and the optical-to-microwave conversion exhibited a phase noise of 121 dBc/Hz at 1 Hz, which reaches 138 dBc/Hz, with a corresponding timing noise of 1.8 as Hz−1/2. The frequency instability of the OFC and optical-to-microwave part was 2 × 10 15 at 1 s, and the phase noise was 106 dBc/Hz at 1 Hz, which reached 125 dBc/Hz, with a corresponding timing noise of 9 as Hz−1/2. Finally, we employed the microwave signal regeneration system for the optical-to-microwave conversion. This was achieved via the regeneration of the 9.6 GHz signal with a relative frequency instability of 2.1 × 10 15 at 1 s from the repetition rate of the OFC that was phase-locked to an ultrastable laser with a relative frequency instability of 7 × 10 16 at 1 s. Notably, this frequency instability was 1.5 times better than the previous result. Leveraging such a highly stable frequency source, the short-term frequency instability of cesium fountain clocks can be enhanced from 10 13 τ 1 / 2 to 10 14 τ 1 / 2 .

Author Contributions

Conceptualization, L.Y.; experimental setup and laser frequency controller, L.Y.; optical comb femtosecond laser, P.Z., B.R. and M.L.; project administration, J.R.; writing—original draft preparation, L.Y.; writing—review and editing, J.R., Z.D. and S.Z. All authors have read and agreed to the published version of the manuscript.

Funding

This research was funded by the National Natural Science Foundation of China (Grant No. 12103060), Natural Science Basic Research Program of Shaanxi Province (No. 2023-JC-YB-078), Key Research and Development Program of Shaanxi (No. 2023-YBGY-402) and the National Natural Science Foundation of China (No. 12173044).

Institutional Review Board Statement

Not applicable.

Informed Consent Statement

Not applicable.

Data Availability Statement

Restrictions apply to the availability of these data. The ownership of data belongs to the National Time Service Center (NTSC), Chinese Academy of Sciences. These data can be available from the correspongding author with the permission of NTSC.

Acknowledgments

The authors would like to thank the editors and reviewers for their efforts to help the publication of this work.

Conflicts of Interest

The authors declare no conflicts of interest. The funders had no role in the design of the study; in the collection, analyses, or interpretation of data; in the writing of the manuscript, or in the decision to publish the results.

References

  1. Fortier, T.M.; Kirchner, M.S.; Quinlan, F.; Taylor, J.; Bergquist, J.C.; Rosenband, T.; Lemke, N.; Ludlow, A.; Jiang, Y.; Oates, C.W.; et al. Generation of ultrastable microwaves via optical frequency division. Nat. Photonics 2011, 5, 425–429. [Google Scholar] [CrossRef]
  2. Jiang, Y.Y.; Ludlow, A.D.; Lemke, N.D.; Fox, R.W.; Sherman, J.A.; Ma, L.; Oates, C.W. Making optical atomic clocks more stable with 10−16-level laser stabilization. Nat. Photonics 2011, 5, 158–161. [Google Scholar] [CrossRef]
  3. Abbott, B.P. Observation of gravitational waves from a binary black hole merger. Phys. Rev. Lett. 2016, 116, 061102. [Google Scholar] [CrossRef] [PubMed]
  4. Abbott, B.P. Prospects for observing and localizing gravitational-wave transients with advanced LIGO and advanced virgo. Living Rev. Relativ. 2016, 19, 1. [Google Scholar] [CrossRef] [PubMed]
  5. Nand, N.R.; Hartnett, J.G.; Ivanov, E.N.; Santarelli, G. Ultra-stable very-low phase-noise signal source for very long baseline interferometry using a cryocooled sapphire oscillator. IEEE Trans. Microw. Theory Tech. 2011, 59, 2978–2986. [Google Scholar] [CrossRef]
  6. Xiao, X.; Li, S.; Peng, S.; Xing, L.; Xue, X.; Zheng, X.; Zhou, B. A large-range autofocus microwave photonic radar based on adaptive spatial filtering along the range direction. Opt. Commun. 2020, 477, 126354. [Google Scholar] [CrossRef]
  7. Chizh, A.L.; Mikitchuk, K.B.; Skotorenko, I.V. Optoelectronic reference X-band oscillator for radar systems. Quantum Electron. 2021, 51, 254–259. [Google Scholar] [CrossRef]
  8. Li, R.; Li, W.; Ding, M.; Wen, Z.; Li, Y.; Zhou, L.; Yu, S.; Xing, T.; Gao, B.; Luan, Y.; et al. Demonstration of a microwave photonic synthetic aperture radar based on photonicassisted signal generation and stretch processing. Opt. Express 2017, 25, 14334–14340. [Google Scholar] [CrossRef] [PubMed]
  9. Weyers, S.; Lipphardt, B.; Schnatz, H. Reaching the quantum limit in a fountain clock using a microwave oscillator phase locked to an ultrastable laser. Phys. Rev. A 2009, 79, 031803. [Google Scholar] [CrossRef]
  10. Santarelli, G.; Audoin, C.; Makdissi, A.; Laurent, P.; John Dick, G.J.; Clairon, A. Frequency stability degradation of an oscillator slaved to a periodically interrogated atomic resonator. IEEE Trans. Ultrason. Ferroelectr. Freq. Control 1998, 45, 887–894. [Google Scholar] [CrossRef]
  11. Campbell, S.L.; Hutson, R.B.; Marti, G.E.; Goban, A.; Darkwah Oppong, N.; McNally, R.L.; Sonderhouse, L.; Robinson, J.M.; Zhang, W.; Bloom, B.J.; et al. A fermi-degenerate three-dimensional optical lattice clock. Science 2017, 358, 90–94. [Google Scholar] [CrossRef] [PubMed]
  12. Beloy, K.; Bodine, M.I.; Bothwell, T.; Brewer, S.M.; Bromley, S.L.; Chen, J.; Deschênes, J.; Diddams, S.A.; Fasano, R.J.; Fortier, T.M.; et al. Frequency ration measurements at 18-digit accuracy using an optical clock network. Nature 2021, 591, 564–569. [Google Scholar]
  13. Brewer, S.M.; Chen, J.; Hankin, A.M.; Clements, E.R.; Chou, C.W.; Wineland, D.J.; Hume, D.B.; Leibrandt, D.R. 27Al+ quantum-logic with a systematic uncertainty below 10−18. Phys. Rev. Lett. 2019, 123, 033201. [Google Scholar] [CrossRef] [PubMed]
  14. Bothwell, T.; Kedar, D.; Oelker, E.; Robinson, J.M.; Bromley, S.L.; Tew, W.; Ye, J.; Kennedy, C.J. JILA Srl optical lattice clock with uncertainty of 2.0 × 10⁻¹⁸. Metrologia 2019, 56, 065004. [Google Scholar] [CrossRef]
  15. McGrew, W.F.; Zhang, X.; Fasano, R.J.; Schäffer, S.A.; Beloy, K.; Nicolodi, D.; Brown, R.C.; Hinkley, N.; Milani, G.; Schioppo, M.; et al. Atomic clock performance enabling geodesy below the centimetre level. Nature 2018, 564, 87–90. [Google Scholar] [CrossRef] [PubMed]
  16. Xue, W.; Zhao, W.; Quan, H.; Xing, Y.; Zhang, S. Cascaded microwave transfer over 300-km fiber link with instability at the 10−18 level. Remote Sens. 2021, 13, 2182. [Google Scholar] [CrossRef]
  17. Schioppo, M.; Kronjager, J.; Silva, A.; Ilieva, R.; Paterson, J.W.; Baynham, C.F.A.; Bowden, W.; Hill, I.R.; Hobson, R.; Vianello, A.; et al. Comparing ultrastable lasers at 7 × 10⁻¹⁷ fractional frequency instability through a 2220 km optical fibre network. Nat. Commun. 2022, 13, 212. [Google Scholar] [CrossRef] [PubMed]
  18. Li, Z.; Gui, S.; Wu, H.; Guo, Z.; Zhao, J. Remote Residual Instability Evaluation of Comb-Based Precise Frequency Transmission for Optical Clock. Photonics 2023, 10, 1188. [Google Scholar] [CrossRef]
  19. Matei, D.G.; Legero, T.; Häfner, S.; Grebing, C.; Weyrich, R.; Zhang, W.; Sonderhouse, L.; Robinson, J.M.; Ye, J.; Riehle, F.; et al. 1.5 μm lasers with sub-10 mHz linewidth. Phys. Rev. Lett. 2017, 118, 263202. [Google Scholar] [CrossRef]
  20. Xie, X.; Bouchand, R.; Nicolodi, D.; Giunta, M.; Hänsel, W.; Lezius, M.; Joshi, A.; Datta, S.; Alexandre, C.; Lours, M.; et al. Photonic microwave signals with zeptosecond-level absolute timing noise. Nat. Photonics 2017, 11, 44–47. [Google Scholar] [CrossRef]
  21. Fortier, T.M.; Rolland, A.; Quinlan, F.; Baynes, F.N.; Metcalf, A.J.; Hati, A.; Ludlow, A.D.; Hinkley, N.; Shimizu, M.; Ishibashi, T.; et al. Optically referenced broadband electronic synthesizer with 15 digits of resolution. Laser Photonics Rev. 2016, 10, 780–790. [Google Scholar] [CrossRef]
  22. Yan, L.; Zhao, W.; Zhang, Y.; Tai, Z.; Zhang, P.; Rao, B.; Ning, K.; Zhang, X.; Guo, W.; Zhang, S.; et al. Photonic generation of RF and microwave signal with relative frequency instability of 10−15. Chin. Phys. B 2018, 27, 0330601. [Google Scholar] [CrossRef]
  23. Drever, R.W.P.; Hall, J.L.; Kowalski, F.V.; Hough, J.; Ford, G.M.; Munley, A.J.; Ward, H. Laser phase and frequency stabilization using an optical resonator. Appl. Phys. B 1983, 31, 97–105. [Google Scholar] [CrossRef]
  24. Tai, Z.; Yan, L.; Zhang, Y.; Zhang, X.; Guo, W.; Zhang, S.; Jiang, H. Transportable 1555-nm ultra-stable laser with sub-0.185-Hz linewidth. Chin. Phys. Lett. 2017, 34, 090602. [Google Scholar] [CrossRef]
  25. Tai, Z.; Yan, L.; Zhang, Y.; Zhang, X.; Guo, W.; Zhang, S.; Jiang, H. Electro-optic modulator with ultra-low residual amplitude modulation for frequency modulation and laser stabilization. Opt. Lett. 2016, 41, 5584–5587. [Google Scholar] [CrossRef] [PubMed]
  26. Donley, E.A.; Heavner, T.P.; Levi, F.; Tataw, M.O.; Jefferts, S.R. Double-pass acousto-optic modulator system. Rev. Sci. Instrum. 2005, 76, 063112. [Google Scholar] [CrossRef]
  27. Ma, L.; Jungner, P.; Ye, J.; Hall, J.L. Delivering the same optical frequency at two places: Accurate cancellation of phase noise introduced by an optical fiber or other time-varying path. Opt. Lett. 1994, 19, 1777–1779. [Google Scholar] [CrossRef]
  28. Yan, L.; Zhang, Y.; Zhang, L.; Fan, S.; Zhang, X.; Guo, W.; Zhang, S.; Jiang, H. Attosecond-resolution Er:Fiber-based optical frequency comb. Chin. Phys. Lett. 2015, 32, 104207. [Google Scholar] [CrossRef]
  29. Zhang, P.; Zhang, Y.; Li, M.; Rao, B.; Yan, L.; Chen, F.; Zhang, X.; Chen, Q.; Jiang, H.; Zhang, S. All polarization-maintaining Er:fiber-based optical frequency comb for frequency comparison of optical clocks. Chin. Phys. B 2022, 31, 054210. [Google Scholar] [CrossRef]
  30. Edelmann, M.; Hua, Y.; Şafak, K.; Kärtner, F.X. Intrinsic amplitude-noise suppression in fiber lasers mode-locked with nonlinear amplifying loop mirrors. Opt. Lett. 2021, 46, 1752–1755. [Google Scholar] [CrossRef] [PubMed]
  31. Ivanov, E.N.; Hollberg, L.; Diddams, S.A. Analysis of noise mechanisms limiting the frequency stability of microwave signals generated with a femtosecond laser. IEEE J. Sel. Topics Quantum Electron. 2003, 9, 1059–1065. [Google Scholar] [CrossRef]
  32. Ivanov, E.N.; Diddams, S.A.; Hollberg, L. Study of the excess noise associated with demodulation of ultra-short infrared pulses. IEEE Trans. Ultrason. Ferroelectr. Freq. Control 2005, 52, 1068–1074. [Google Scholar] [CrossRef] [PubMed]
  33. Haboucha, A.; Zhang, W.; Li, T.; Lours, M.; Luiten, A.N.; Le Coq, Y.; Santarelli, G. Optical-fiber pulse rate multiplier for ultralow phase-noise signal generation. Opt. Lett. 2011, 36, 3654–3656. [Google Scholar] [CrossRef]
  34. Kim, J.; Kartner, F.X. Femtosecond synchronization of radio frequency signals with optical pulse trains. Opt. Lett. 2004, 29, 2076–2078. [Google Scholar] [CrossRef]
  35. Jung, K.; Kim, J. Subfemtosecond synchronization of microwave oscillators with mode-locked Er-fiber lasers. Opt. Lett. 2012, 37, 2958–2960. [Google Scholar] [CrossRef]
  36. Jung, K.; Shin, J.; Kang, J.; Hunziker, S.; Min, C.; Kim, J. Frequency comb-based microwave transfer over fiber with 7 × 10⁻¹⁹ instability using fiber-loop optical-microwave phase detectors. Opt. Lett. 2014, 39, 1577–1580. [Google Scholar] [CrossRef] [PubMed]
  37. Dennis, M.L.; Duling, I.N.; Burns, W.K. Inherently bias drift free amplitude modulator. Electron. Lett. 1996, 32, 547–548. [Google Scholar] [CrossRef]
  38. Gopalakrishnan, G.K.; Burns, W.K.; McElhanon, R.W.; Bulmer, C.H.; Greenblatt, A.S. Performance and modeling of broadband LiNbO3 traveling wave optical intensity modulators. J. Light. Technol. 1994, 12, 1807–1819. [Google Scholar] [CrossRef]
  39. Taylor, J.; Datta, S.; Hati, A.; Nelson, C.; Quinlan, F.; Joshi, A.; Diddams, S.A. Characterization of power-to-phase conversion in high-speed P-I-N photodiodes. IEEE Photonics J. 2011, 3, 140–151. [Google Scholar] [CrossRef]
  40. Jiang, H.; Taylor, J.; Quinlan, F.; Diddams, S. Noise floor reduction of an Er:fiber laser-based photonic microwave generation. IEEE Photonics J. 2011, 3, 1004–1012. [Google Scholar] [CrossRef]
Figure 1. The experimental setup of the photonic microwave source, including the ultrastable laser, Er-doped fiber-based OFC, and optic-to-electronic converter.
Photonics 12 00153 g001
Figure 2. Experimental setup of the ultrastable laser. The red lines indicate the free space optical path, the green lines indicate the fiber optical path, and the black dash lines represent the electric path. PM: polarization-maintaining fiber; CO: collimator; λ /2: half-wave plate; λ /4: quarter-wave plate; AOM: acousto-optic modulator; DDS: direct digital synthesizer; SM: single-mode fiber; PC: physical contact; APC: angled physical contact; PD: photodiode; APD: avalanche photodiode; M: mirror.
Photonics 12 00153 g002
Figure 3. Schematic diagram of the Er:fiber femtosecond laser frequency comb and the frequency detection/control system for f c e o and f r . (a) Scheme of the OFC. (b) Scheme of the f c e o detection unit. (c) Scheme of the frequency stabilization system for f c e o . (d) Scheme of the frequency stabilization system for f b e a t . The blue lines represent the single-mode PM fibers, the red lines represent the optical paths, the pink lines represent the single-mode fibers, and the black lines represent the electrical paths. CO: collimator; λ /2: half-wave plate; PBS: polarizing beam splitter; FR: Faraday rotator; M: reflector mirror; TWDM: wavelength division multiplexer; HNLF: highly nonlinear fiber; LF: loop filter; BPF: band-pass filter; HVA: high-voltage amplifier; PD: photodetector; ÷n: n times frequency divider; ÷n*: 20 times frequency divider in OFC1 and 40 times in OFC2; A: amplifier; PS: power splitter.
Photonics 12 00153 g003
Figure 4. Schematic diagram of the microwave regeneration system. The gray dotted box is the optical-to-microwave phase detector, and f r is the pulse-repetition rate. The red lines represent the optical fiber paths. The black lines represent the electrical paths. FR: Faraday rotator; QWP: quarter waveplate; CO: coupler; f r : pulse repetition rate.
Photonics 12 00153 g004
Figure 5. Relative frequency instability and phase noise of the ultrastable laser. (a) Frequency instability of the ultrastable laser. Blue dash line: thermal-noise-limited frequency instability. (b) Phase noise power spectral density of the ultrastable laser. Black line: phase noise of the ultrastable laser. Blue line: thermal noise limit.
Photonics 12 00153 g005
Figure 6. Relative frequency instability and frequency fluctuations of the OFC. (a) In-loop relative frequency instability of f c e o and f b e a t . (b) Frequency fluctuations and bandwidths of the phase-locked f c e o and f b e a t . Red lines represent f c e o . Black lines represent f b e a t .
Photonics 12 00153 g006
Figure 7. Experimental setup for evaluating frequency instability and additional phase noise of the photonic microwave generator. The red lines represent the optical paths, and the black lines represent the electrical paths. DRO: dielectric resonator oscillator; LF: loop filter; PS: power splitter; AMP: amplifier.
Photonics 12 00153 g007
Figure 8. Frequency instability and phase noise of the optic-to-electronic converter. (a) Frequency instability curve. (b) Single sideband (SSB) phase noise power spectral density curve.
Photonics 12 00153 g008
Figure 9. Frequency instability and phase noise of the OFC and optic-to-electronic converter. (a) Frequency instability curve. (b) SSB phase noise power spectral density curve.
Photonics 12 00153 g009
Figure 10. The frequency instability of the photonic microwave generator. The red curve is the frequency instability of the 9.6 GHz microwave signal. The green curve is the frequency instability of the optical divider from the OFC to the 9.6 GHz microwave signal. The blue curve is the frequency instability of the ultrastable laser. The black dotted curve represents the frequency instability of the previously generated 9.54 GHz signal by the photonic microwave generator.
Photonics 12 00153 g010
Disclaimer/Publisher’s Note: The statements, opinions and data contained in all publications are solely those of the individual author(s) and contributor(s) and not of MDPI and/or the editor(s). MDPI and/or the editor(s) disclaim responsibility for any injury to people or property resulting from any ideas, methods, instructions or products referred to in the content.

