1. Introduction
Water is essential for life on Earth, and it is crucial that it remains free from contaminants, safe, and clean. Both governmental and non-governmental organizations are actively promoting the consumption of clean water, while various companies are offering different methods for water purification [
1,
2]. The provision of safe drinking water remains one of the most pressing global challenges of the 21st century. Despite significant progress, a staggering one-quarter of the world’s population, amounting to 2.1 billion people, still lacks access to safely managed drinking water, forcing hundreds of millions to rely on untreated and contaminated surface water sources [
3]. This crisis is exacerbated by the pervasive and often invisible threat of chemical contamination, particularly from heavy metals such as lead (Pb), cadmium (Cd), and arsenic (As) [
4,
5]. These elements are exceptionally pernicious due to their non-biodegradable nature, allowing them to persist in the environment and bioaccumulate within the food chain, where their concentrations are magnified at each trophic level [
6]. The bioaccumulation of these heavy metals poses severe health risks, including neurological disorders, kidney damage, and carcinogenic effects, disproportionately affecting vulnerable populations in developing countries [
7]. To combat this insidious threat, innovative detection technologies are imperative, particularly those capable of rapid, sensitive, and non-invasive identification of contaminants at trace levels [
8]. In response to this pressing need, traditional analytical techniques such as atomic absorption spectroscopy, gas chromatography, and mass spectrometry have long been the gold standard for detecting water contaminants [
9]. While these methods offer high precision, they are inherently limited by significant drawbacks, including complex sample preparation, reliance on bulky and expensive laboratory equipment, and lengthy processing times. These factors render them unsuitable for the real-time, and continuous monitoring required for effective public health protection and environmental management. Consequently, there is a compelling impetus to develop alternative sensing paradigms that are rapid, cost-effective, highly sensitive, and field-deployable [
10,
11,
12].
Among the emerging technologies, Terahertz (THz) wave-based sensing has garnered significant attention as a powerful and non-invasive analytical tool [
13]. Situated between the microwave and infrared regions of the electromagnetic spectrum (0.1–10 THz), THz radiation possesses unique properties ideal for sensing; it can penetrate many non-polar materials and, more importantly, many chemical and biological molecules exhibit distinct absorption peaks and spectral “fingerprints” in this range, enabling label-free identification [
14,
15]. Photonic Crystal Fibers (PCFs) have emerged as an exceptional waveguide platform to effectively guide and utilize THz waves for high-sensitivity applications [
16]. The micro-structured arrangement of air holes in PCFs allows for unparalleled design flexibility and superior control over light-guiding properties, facilitating strong light-matter interaction within a hollow or porous core [
17]. For THz applications, Zeonex, a cyclic olefin copolymer, stands out as an excellent background material due to its remarkably low material absorption loss, flat refractive index profile, and high chemical stability [
18].
The field has witnessed numerous advancements in PCF sensor design for chemical and biological detection. Initial designs, often featuring simple hexagonal or circular lattice claddings, demonstrated the feasibility of the approach but were typically limited to moderate relative sensitivities (in the range of 50–70%) and suffered from significant confinement losses [
19]. To enhance performance, subsequent research explored more intricate geometries, including porous-core structures and complex cladding arrangements, which successfully pushed sensitivities beyond 85%. However, these improvements often came at the expense of increased fabrication complexity or other compromised optical properties. A critical challenge, therefore, remains in the conception of a sensor that simultaneously achieves ultra-high sensitivity approaching unity, negligible confinement loss, and a design that remains feasible for fabrication [
20].
Recent studies have increasingly emphasized the transformative potential of Terahertz photonic crystal fibers (THz-PCFs) in real-time and ultra-sensitive water quality monitoring. For instance, Kundu et al. (2025) demonstrated an optimized PCF architecture capable of detecting aquatic pathogens such as Vibrio cholerae, Escherichia coli, and Bacillus anthracis with exceptionally high sensitivities exceeding 96% at 3.2 THz, while simultaneously achieving ultra-low confinement losses on the order of 10
−13 dB/cm. These results highlight the feasibility of THz-PCFs for pathogen-specific water surveillance under field-deployable conditions [
21]. In parallel, Wang et al. (2024) developed a dual-parameter PCF sensor employing graphene-coated microgrooves that simultaneously measures refractive index and temperature with high accuracy, thereby underscoring the versatility of THz-PCFs in multi-parameter water monitoring applications [
22]. Complementary review efforts further emphasize that beyond pollutant detection, recent PCF research trends are converging toward hybrid designs that balance high sensitivity, ultra-low confinement loss, and fabrication feasibility, suggesting a clear trajectory toward practical deployment [
23].
Moreover, recent reviews of THz-based water detection techniques have systematically documented the unique interaction of THz waves with liquid water, highlighting the challenges and opportunities arising from the strong absorptive nature of aqueous media [
24]. Furthermore, the versatility of THz-PCF structures extends beyond direct sensing to specialized waveguiding, such as the development of ring-core fibers for transmitting orbital angular momentum (OAM) modes without phase distortion [
25]. In parallel, other advanced sensing platforms, such as those combining PCF with surface plasmon resonance (SPR), have demonstrated high-sensitivity detection of parameters like magnetic field and temperature [
26]. While these fields represent significant advancements, our work remains focused on the specific challenge of achieving ultra-high sensitivity specifically for aqueous analyte fingerprinting within the core, which is the focus of this work. These insights underline the necessity of carefully engineered fiber structures and material platforms, such as Zeonex and other low-loss polymers, to minimize propagation losses while maximizing the analyte-field overlap. Importantly, this growing body of work indicates that THz-PCF sensors are transitioning from theoretical design concepts to viable platforms for integrated chemical and biological water monitoring. For example, in Ref [
23], multi-core and hybrid cladding structures were identified as promising future directions, enabling the simultaneous detection of chemical pollutants and microbial contaminants with unprecedented precision. Collectively, these developments reinforce the urgency and feasibility of advancing THz-PCF sensors as next-generation technologies for global water quality assurance.
To address this gap, this paper introduces a novel Zeonex-based PCF sensor meticulously designed for identifying the THz fingerprints of water pollutants. While the proposed architecture is necessarily complex (as shown in
Figure 1), it features a rectangular core for analyte infiltration, strategically surrounded by a unique cladding composed of four inner rectangular air holes and an outer ring of elliptical air holes. This hybrid configuration, combining inner rectangular holes for mode-shaping and outer elliptical holes for enhanced confinement, is strategically engineered to overcome the performance limitations of simpler, conventional designs. It is precisely this intentional complexity that enables the sensor to simultaneously maximize the modal field overlap with the analyte (achieving near-unity sensitivity) and ensure robust light confinement (achieving ultra-low loss), as will be demonstrated in the subsequent sections. The subsequent sections of this paper detail the design methodology for the sensor, present a comprehensive analysis of its guiding properties, and discuss the implications of the findings.
3. Numerical Formalism and Performance Metrics
To comprehensively evaluate the performance of the proposed PCF sensor, its wave-guiding characteristics have been numerically investigated using FEM within the COMSOL Multiphysics software environment. This computational technique enables highly accurate analysis of electromagnetic wave propagation by discretizing the fiber cross-section into a fine triangular mesh and solving Maxwell’s equations for the fundamental guided mode. A Perfectly Matched Layer (PML) boundary condition, configured with a thickness of 10% of the fiber diameter, has been implemented at the outermost boundary to emulate an open, non-reflecting space, thereby ensuring precise calculation of propagation losses. The sensor performance has been quantitatively assessed through several key parameters, including relative sensitivity, confinement loss, effective area, and numerical aperture. These figures of merit collectively provide a comprehensive understanding of the light–matter interaction, the confinement capability of the sensor, its light-gathering efficiency, and its overall potential for practical applications. The theoretical formulation of each metric is outlined below.
Relative sensitivity (R) represents one of the most critical figures of merit for a PCF-based sensor, as it directly quantifies the effectiveness of interaction between the guided light and the target analyte. A higher value of relative sensitivity indicates that a larger portion of the electromagnetic field overlaps with the analyte, resulting in a more pronounced and measurable response.
It is defined as the ratio of the analyte refractive index to the real part of the effective refractive index of the guided mode, weighted by the core power fraction [
30]:
where
is the refractive index of the analyte (either pure or polluted water), and
is the real part of the effective refractive index of the fundamental guided mode. The term
represents the power fraction, which is the percentage of the total optical power confined within the analyte-filled core region. This is calculated by integrating the Poynting vector (
) over the core area and normalizing it by the integral over the entire fiber cross-section, as given by [
31]:
Here
and are the transverse components of the electric and magnetic fields of the guided mode.
Confinement Loss (
) is a measure of the unavoidable leakage of optical power from the core into the cladding region, which arises from the inherently imperfect confinement provided by the finite microstructure of the PCF. For a high-performance sensor, this loss must be minimized to negligible levels (ideally several orders of magnitude lower than other loss sources) to ensure a strong signal-to-noise ratio over practical fiber lengths. This parameter is directly proportional to the imaginary part of the effective refractive index and is calculated using the following standard formula [
32]:
where
is the operating frequency in Hertz,
is the speed of light in a vacuum (
m/s), and
is the imaginary part of the effective refractive index. An extremely low value of
is a testament to the effectiveness of the cladding design in trapping the light within the core.
The effective area (
) characterizes the spatial extent of the guided mode intensity distribution within the fiber transverse plane. It is considered a crucial parameter for evaluating the power density and the potential for nonlinear optical effects. In the context of sensing, a smaller effective area is advantageous, as it confines the optical field more tightly, thereby enhancing the light–matter interaction. It can be expressed by the following integral relation [
33]:
where
represents the transverse electric field distribution of the fundamental mode across the entire fiber cross-section.
The Numerical Aperture (
) is a dimensionless quantity that characterizes the range of angles over which the fiber can accept or emit light. A higher
indicates a wider acceptance cone, which is crucial for efficiently coupling light from a source into the fiber and for collecting the transmitted signal. In the context of PCF sensors,
is also related to the fiber’s ability to confine light. It can be determined from the effective area (
) and operating frequency using the following relationship [
34]:
where
is the operating frequency,
is the speed of light in vacuum, and
is the effective area calculated from Equation (4). This parameter is vital for assessing the practical usability of the sensor, as it directly impacts the design and alignment tolerances of the experimental setup required for real-world measurements.
4. Numerical Result and Discussion
The performance characteristics of the proposed Zeonex-based PCF sensor have been systematically investigated across the terahertz (THz) frequency range of 0.5–3 THz. Numerical simulations, carried out using the FEM in COMSOL Multiphysics, were performed for two distinct analytes: pure water (refractive index, = 1.33) and polluted water ( = 1.41). The numerical analysis was performed using a non-uniform, physics-controlled meshing strategy to optimize computational accuracy. The simulation domain was discretized using triangular elements with densities strategically varied according to the physical domain. A highly refined mesh was applied to the analyte-filled core, the region of primary light-matter interaction, using an ‘Extremely fine’ setting (maximum element size: 56 µm; minimum: 0.072 µm). The adjacent inner cladding, which is critical for mode shaping, was discretized with a ‘Finer’ mesh (maximum element size: 191 µm). Finally, a ‘Normal’ mesh (maximum element size: 241 µm) was employed for the outer cladding and PML regions, where the modal field intensity is negligible. This graduated discretization scheme was implemented to ensure maximum resolution in the critical guiding regions of the sensor.
This section provides a detailed analysis of the sensor fundamental mode-field distribution and key performance metrics—including relative sensitivity, confinement loss, effective area, and numerical aperture—to highlight the strong capability of the sensor in differentiating water quality.
The primary requirement for an effective hollow-core PCF sensor is the strong confinement of guided light within the analyte-filled core region.
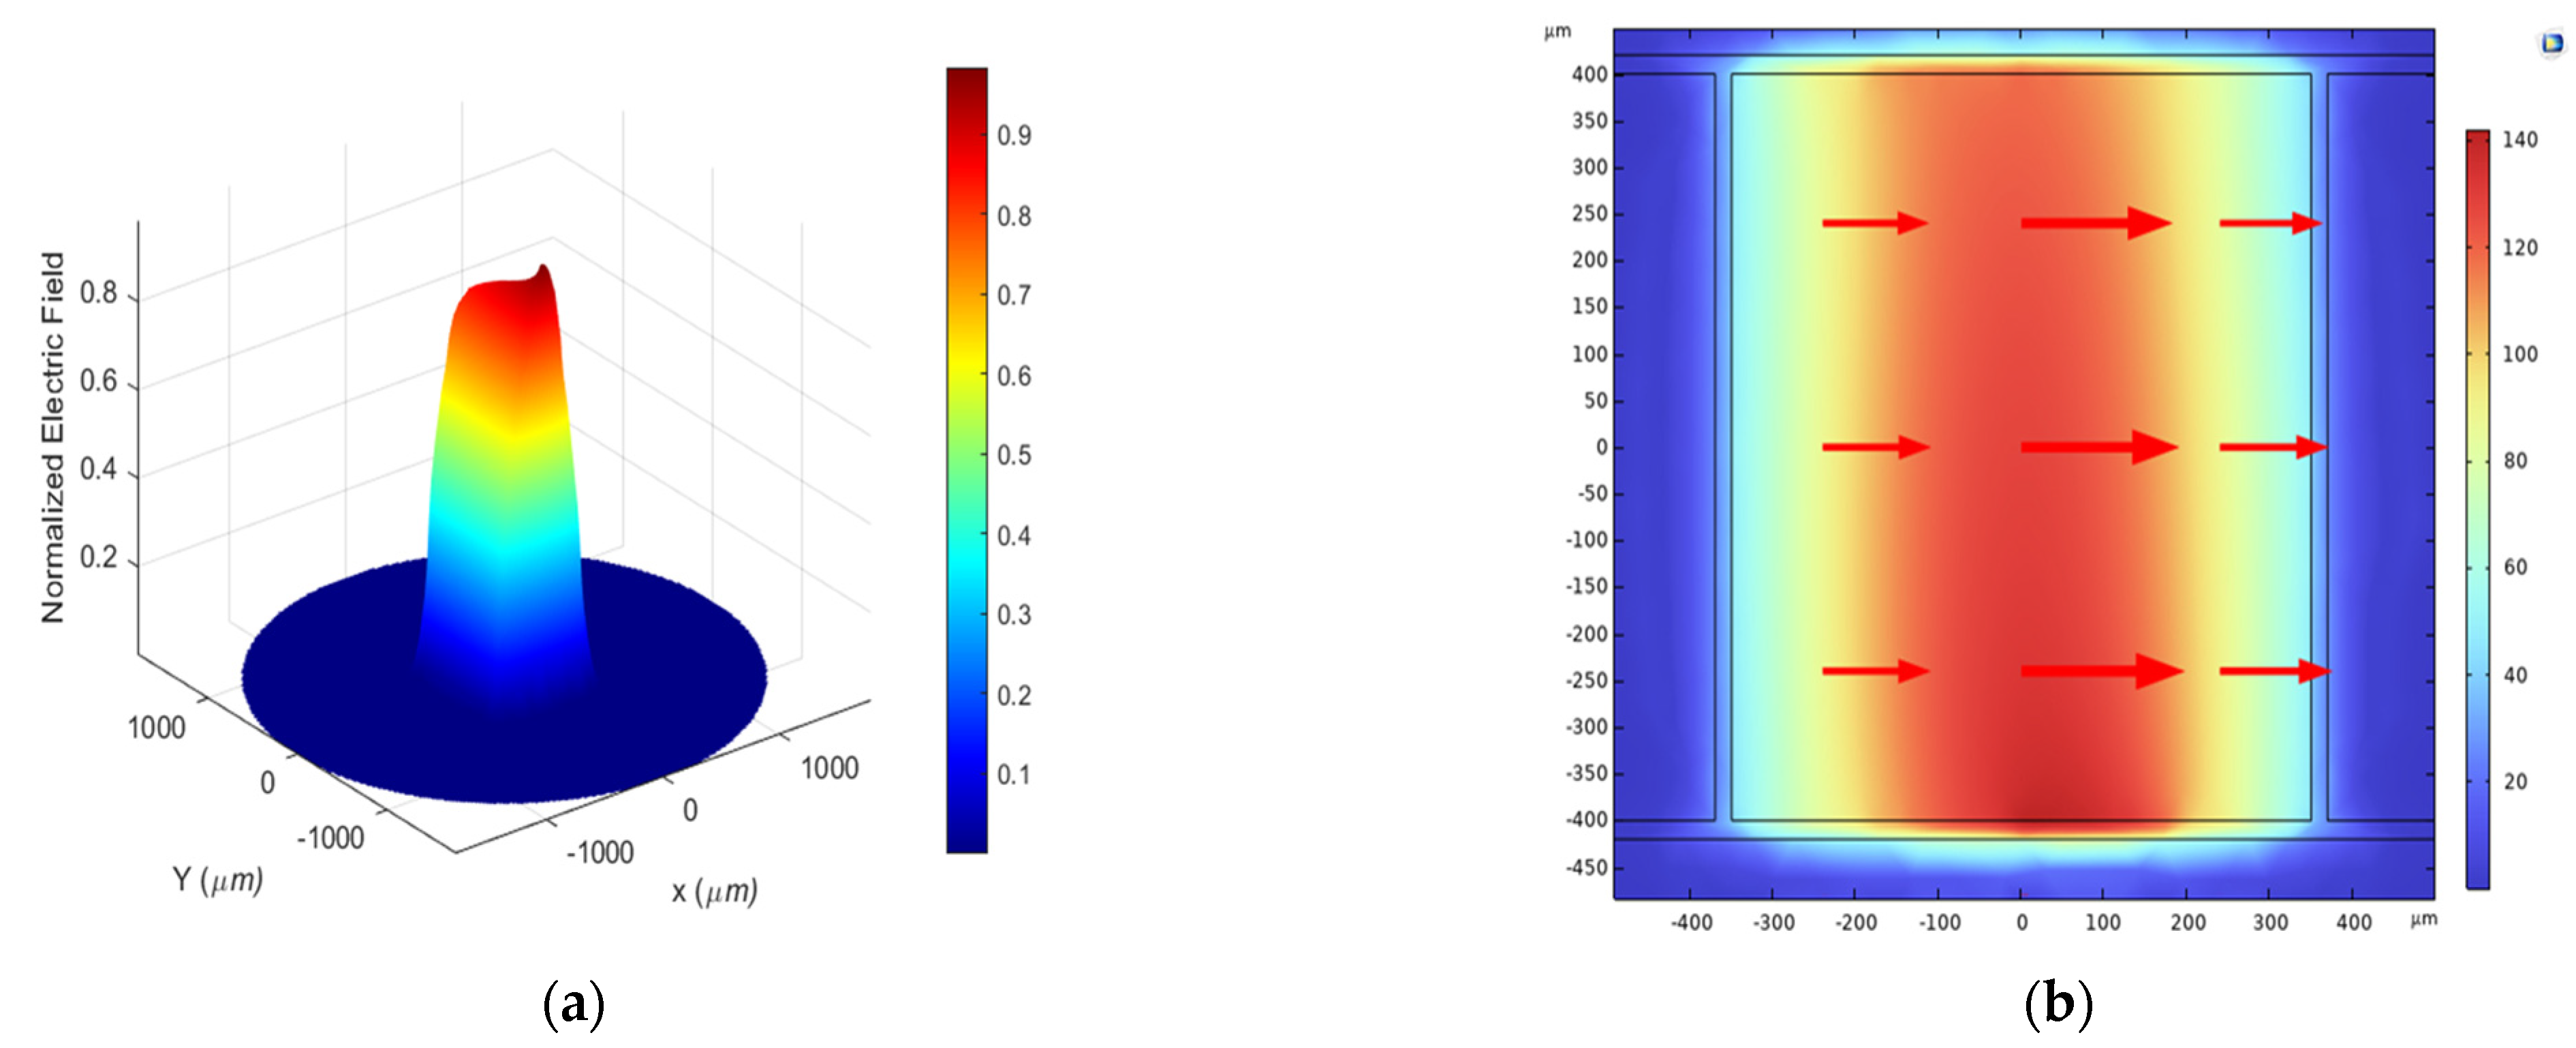
Figure 2 and
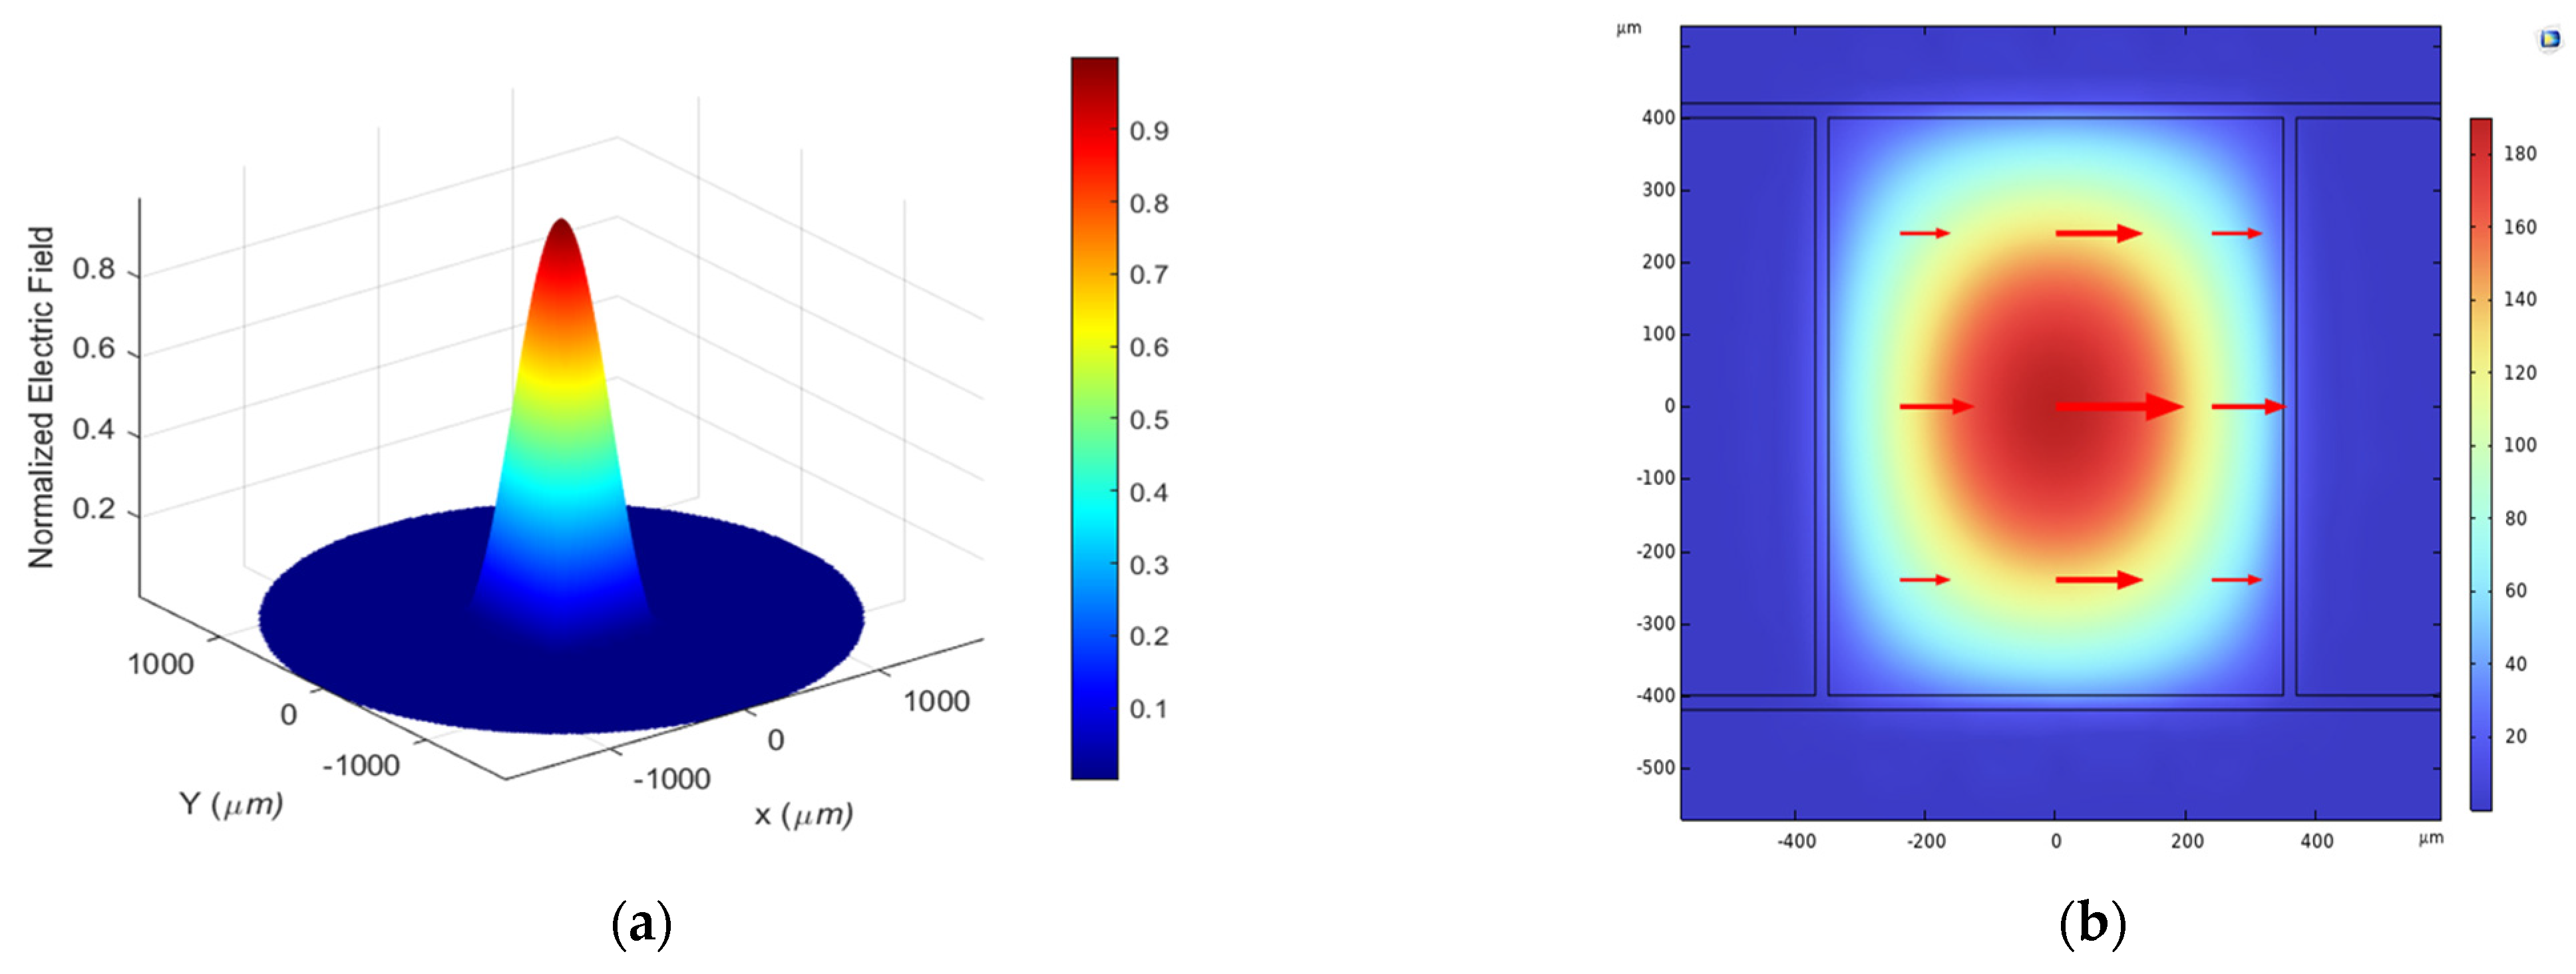
Figure 3 illustrate the electric-field distribution of the fundamental guided mode at the optimal operating frequency of 3 THz.
Figure 2 corresponds to the pure-water analyte, whereas
Figure 3 presents the results for polluted water. The two-dimensional cross-sectional views (
Figure 2b and
Figure 3b) and their corresponding three-dimensional surface plots (
Figure 2a and
Figure 3a) clearly demonstrate that the majority of the modal power is tightly confined within the central rectangular core for both cases.
A crucial observation is the difference in mode confinement between the two analytes. For polluted water, which has a higher refractive index, the mode field is more tightly confined within the core boundaries, as indicated by the sharper peak and narrower spatial distribution shown in
Figure 3. In contrast, the mode field for pure water (
Figure 2) is slightly more expanded. This phenomenon can be attributed to the smaller refractive-index contrast between the polluted-water core (n = 1.41) and the Zeonex background (n = 1.53) compared with that of the pure-water core (n = 1.33). The stronger index-guiding mechanism observed in polluted water results in a more pronounced light–matter interaction, which forms the fundamental basis for achieving higher sensitivity.
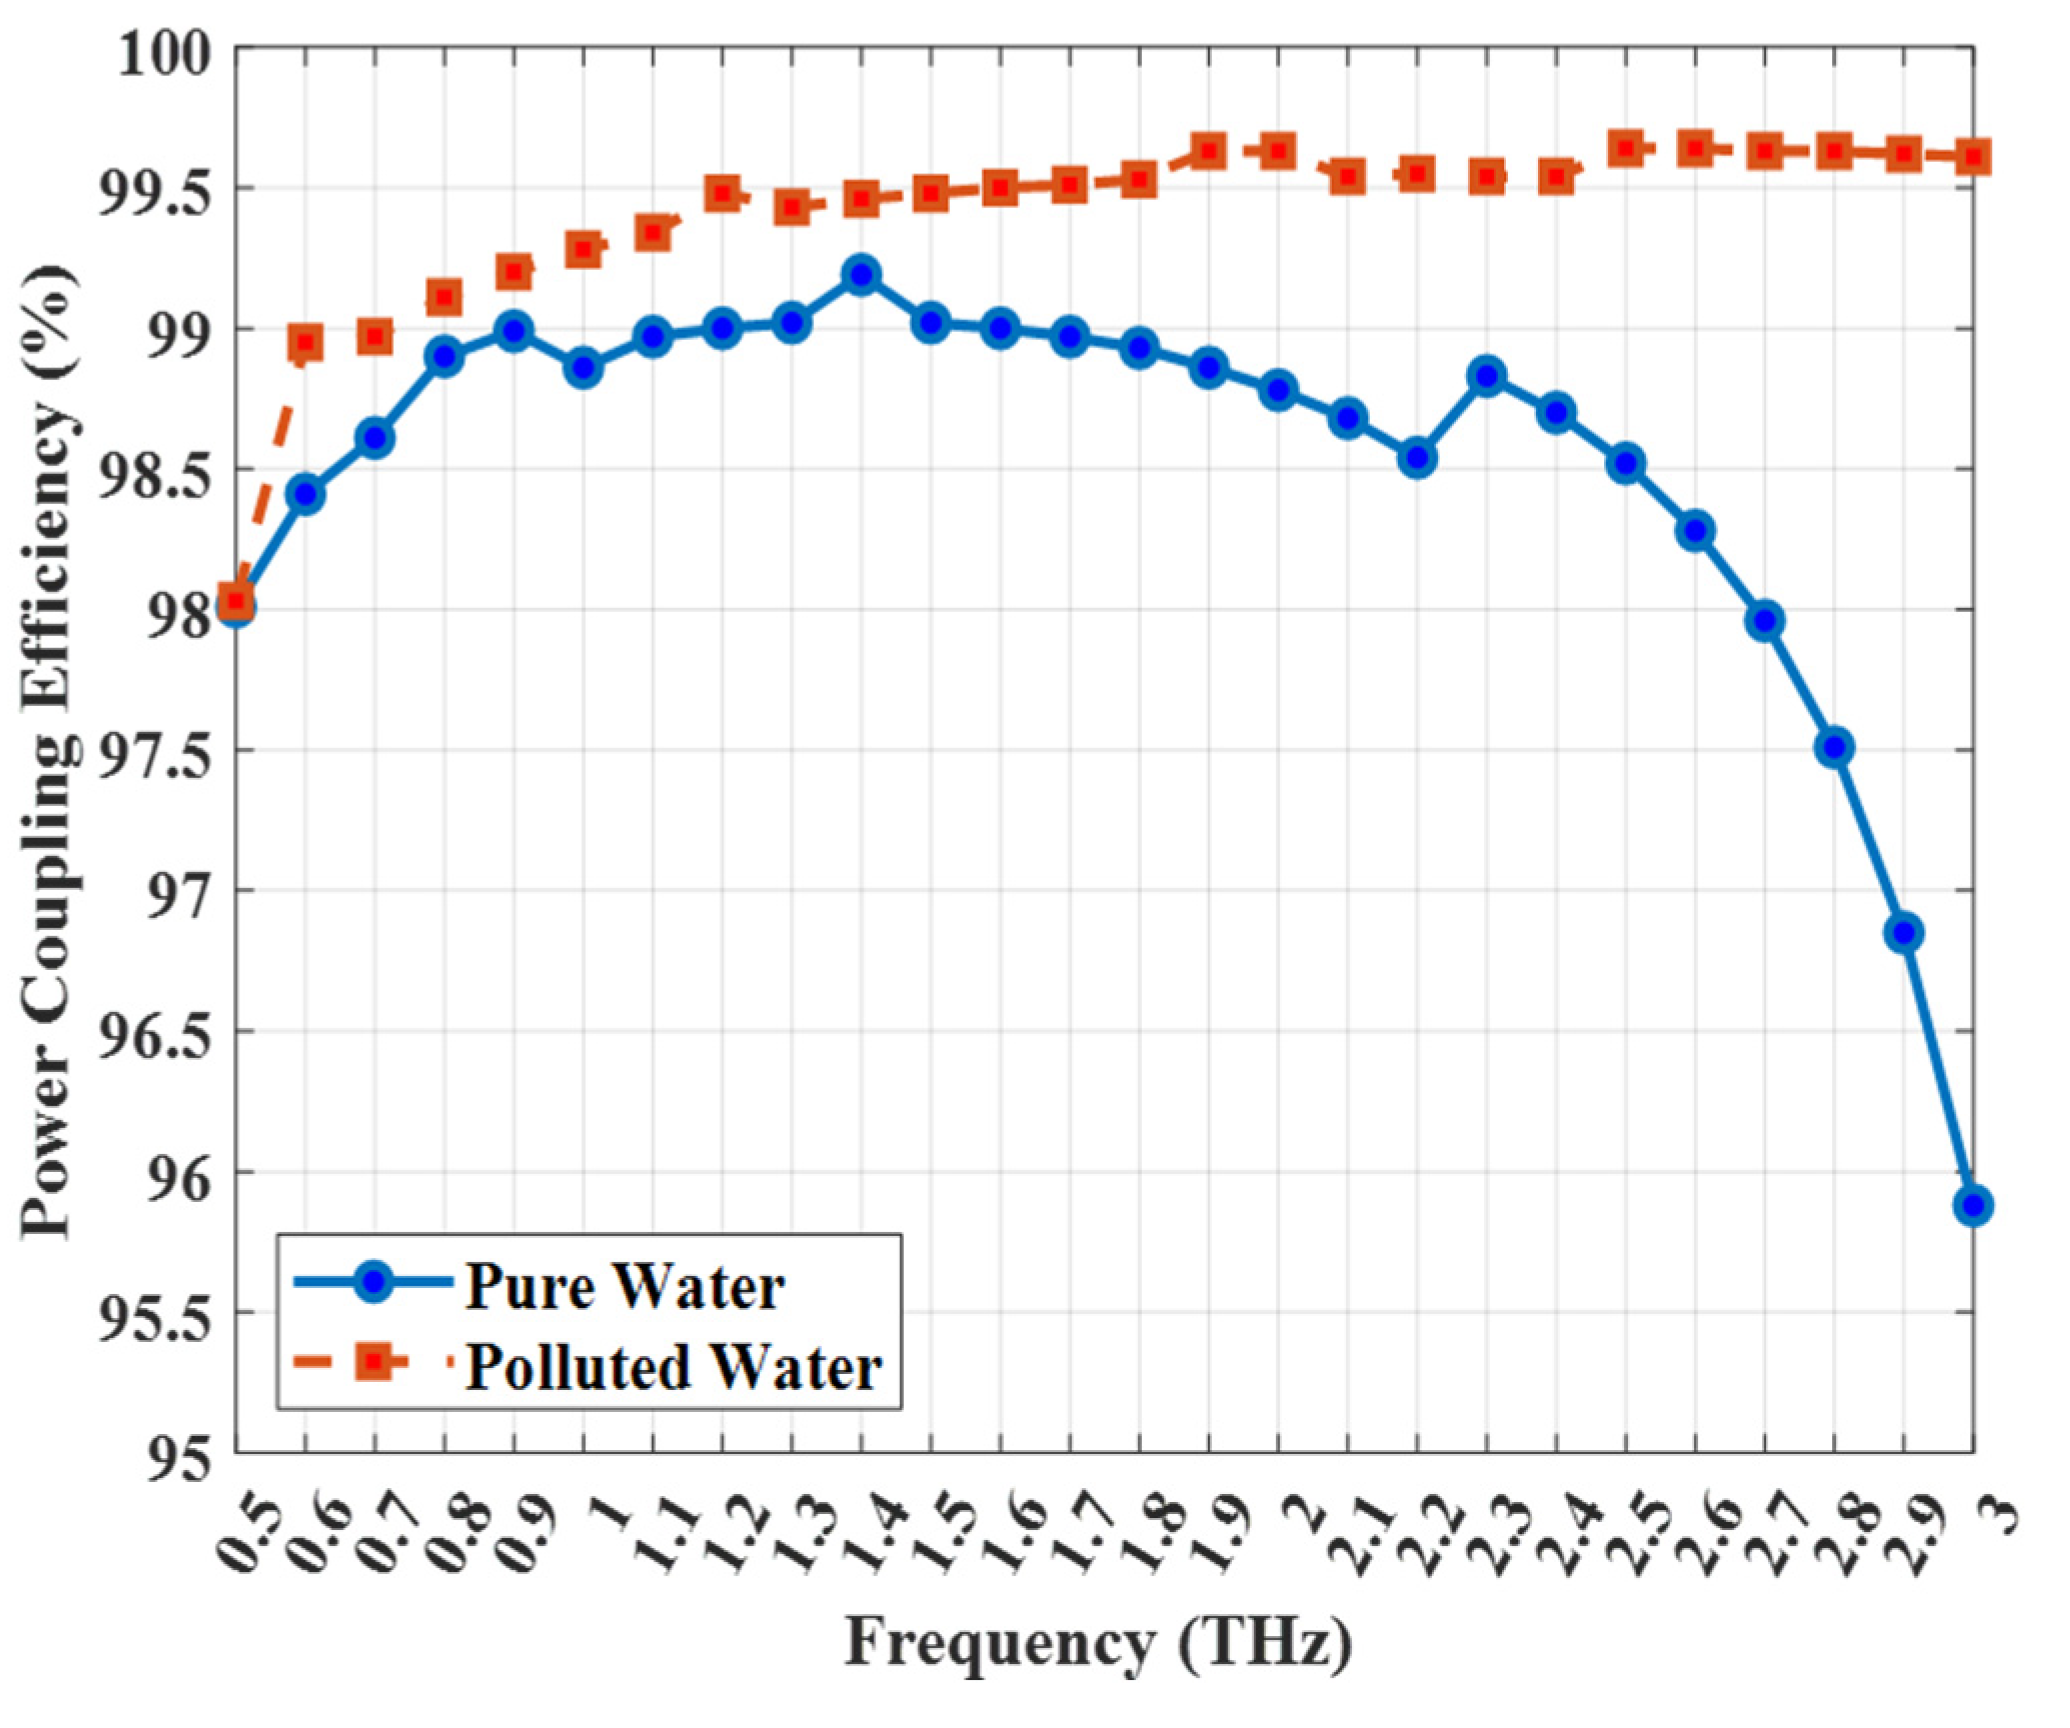
The efficiency of light–matter interaction is primarily determined by the power coupling efficiency (evaluated using Equation (2)), which is plotted as a function of frequency in
Figure 4 for both pure and polluted water. The results exhibit a clear difference in behavior. For polluted water (n = 1.41), the efficiency shows a stable, monotonically increasing trend, reaching an exceptional 99.6% at 3 THz. This is due to the smaller index contrast with the background, which provides stable guiding.
However, for pure water (n = 1.33), the efficiency peaks at approximately 1.4 THz (99.2%) before clearly decreasing. This drop is a key physical phenomenon and a known trade-off in index-guiding THz fibers. At higher frequencies, the modal field begins to contract. Due to the very large refractive index contrast between the pure water core (n = 1.33) and the high-index Zeonex background (n = 1.53), the guided mode is increasingly ‘pulled’ or ‘squeezed’ out of the low-index core and begins to propagate in the high-index Zeonex material of the cladding. This ‘squeeze-out’ effect reduces the core power fraction, causing the observed drop in efficiency. This effect is suppressed for the polluted water, as its higher refractive index (n = 1.41) creates a smaller, more stable index contrast with the background.
Relative sensitivity serves as the ultimate benchmark for evaluating the performance of the sensor.
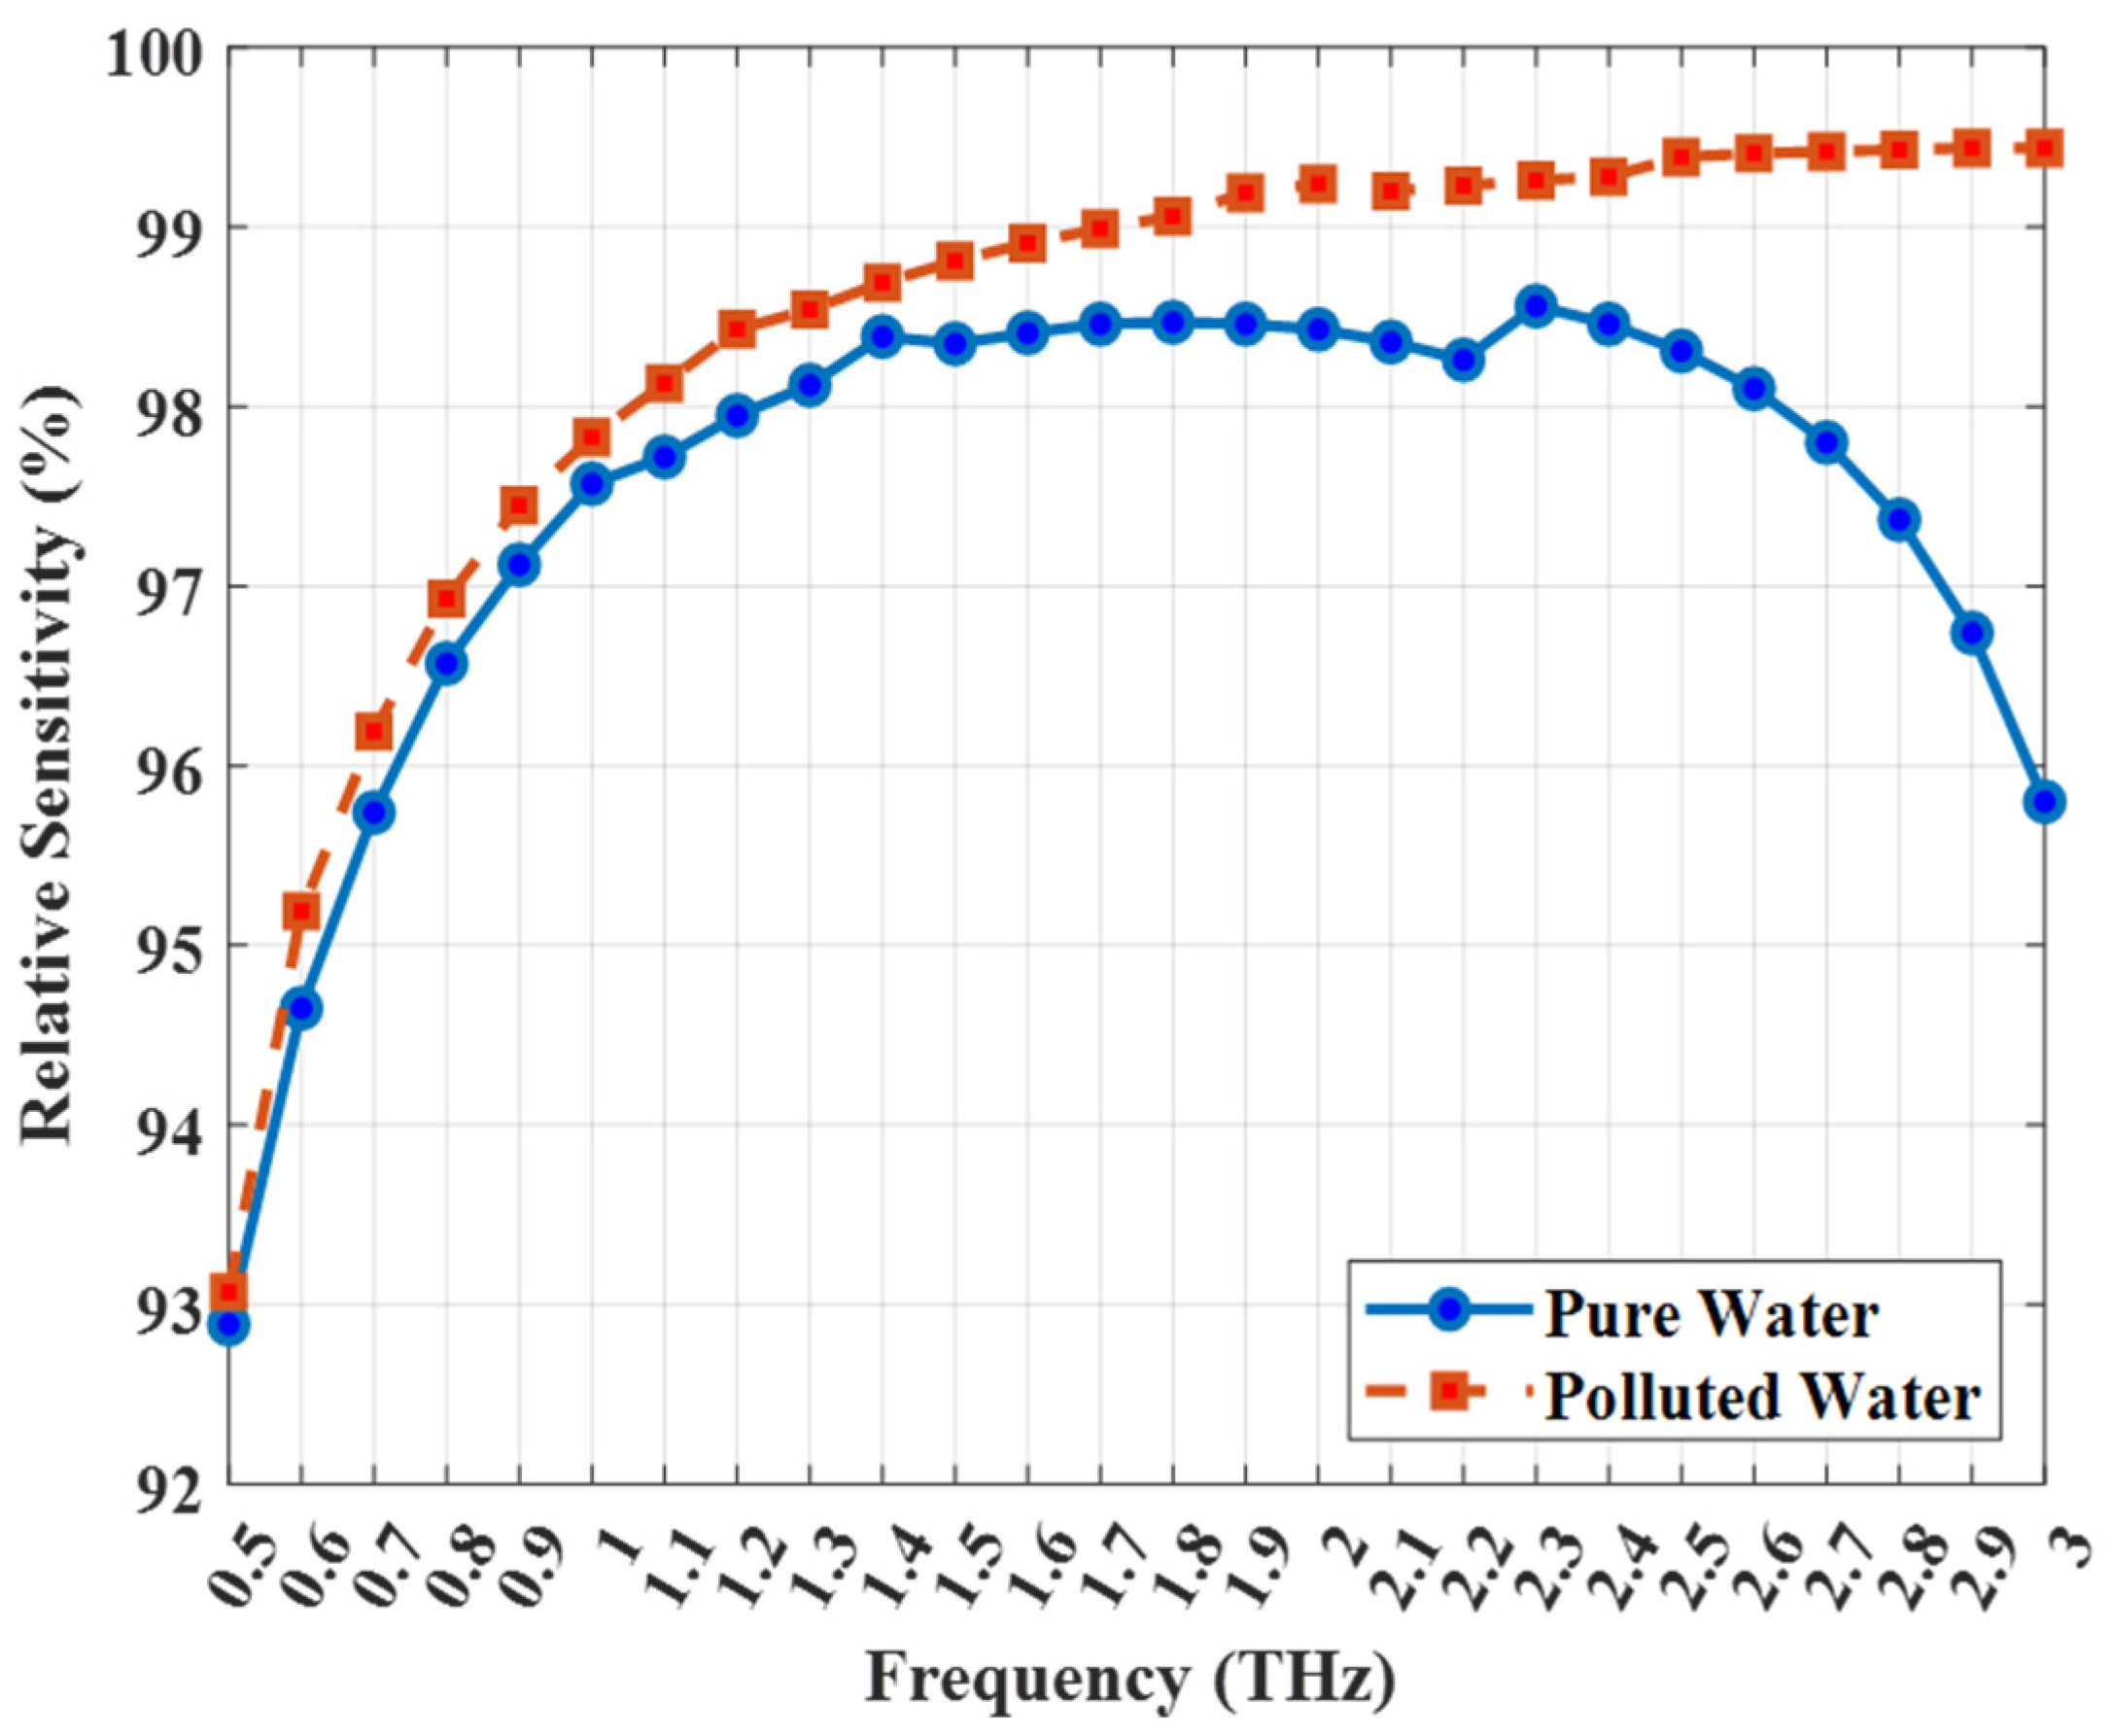
Figure 5 presents the calculated relative sensitivity for both pure and polluted water analytes over the frequency range of 0.5–3 THz. The graph reveals two key observations: first, the sensor achieves exceptionally high sensitivity values for both analytes; and second, there exists a distinct and significant difference in the sensitivity response between them, which is essential for effective differentiation. For polluted water (n = 1.41) the relative sensitivity increases sharply with frequency, reaching an outstanding plateau and an ultra-high value of 99.6% at 3 THz. This ultra-high value, approaching the theoretical maximum, highlights the effectiveness of the design in maximizing the light–analyte interaction and represents a substantial improvement compared with many previously reported THz PCF sensors.
For pure water (n = 1.33), the sensitivity also exhibits this trade-off, peaking at 2.3 THz (98.5%) before decreasing to 95.8% at 3 THz. The detailed physical mechanism is the same as that described for
Figure 4: as the frequency surpasses 2.3 THz, the mode field contraction becomes dominant. The large index contrast (1.53 vs. 1.33) causes the mode to be ‘squeezed’ out of the analyte core and into the Zeonex background. This migration of the field reduces the core power fraction (P), which is a critical component of the relative sensitivity formula (Equation (1)). This reduction in core power is the dominant factor that causes the relative sensitivity to drop. In contrast, for polluted water (n = 1.41), the smaller, more stable index contrast prevents this ‘squeeze-out’ effect, allowing the sensitivity to maintain its high plateau.
Most importantly, the ability of the sensor to distinguish between the two water qualities is clearly demonstrated in the figure. At the optimal operating frequency of 3 THz, a significant sensitivity difference of 3.8% (99.6% for polluted water and 95.8% for pure water) is observed. This pronounced contrast, coupled with the distinct spectral profiles of the sensitivity curves, provides a unique terahertz fingerprint for each analyte. This strong differentiation capability confirms that the proposed sensor is not only highly sensitive but also highly selective, establishing it as a promising candidate for practical water-quality monitoring applications.
For any practical sensing application, the confinement loss (CL) must be minimized. CL represents the fundamental leakage of optical power from the core, which directly attenuates the signal as it propagates. While the overall signal-to-noise ratio (SNR) depends on multiple factors (including material absorption, scattering losses, and detector noise), minimizing CL is a critical design requirement. It ensures that a sufficiently strong optical signal reaches the detector, thereby maximizing the system’s dynamic range and detection sensitivity over practical fiber lengths.
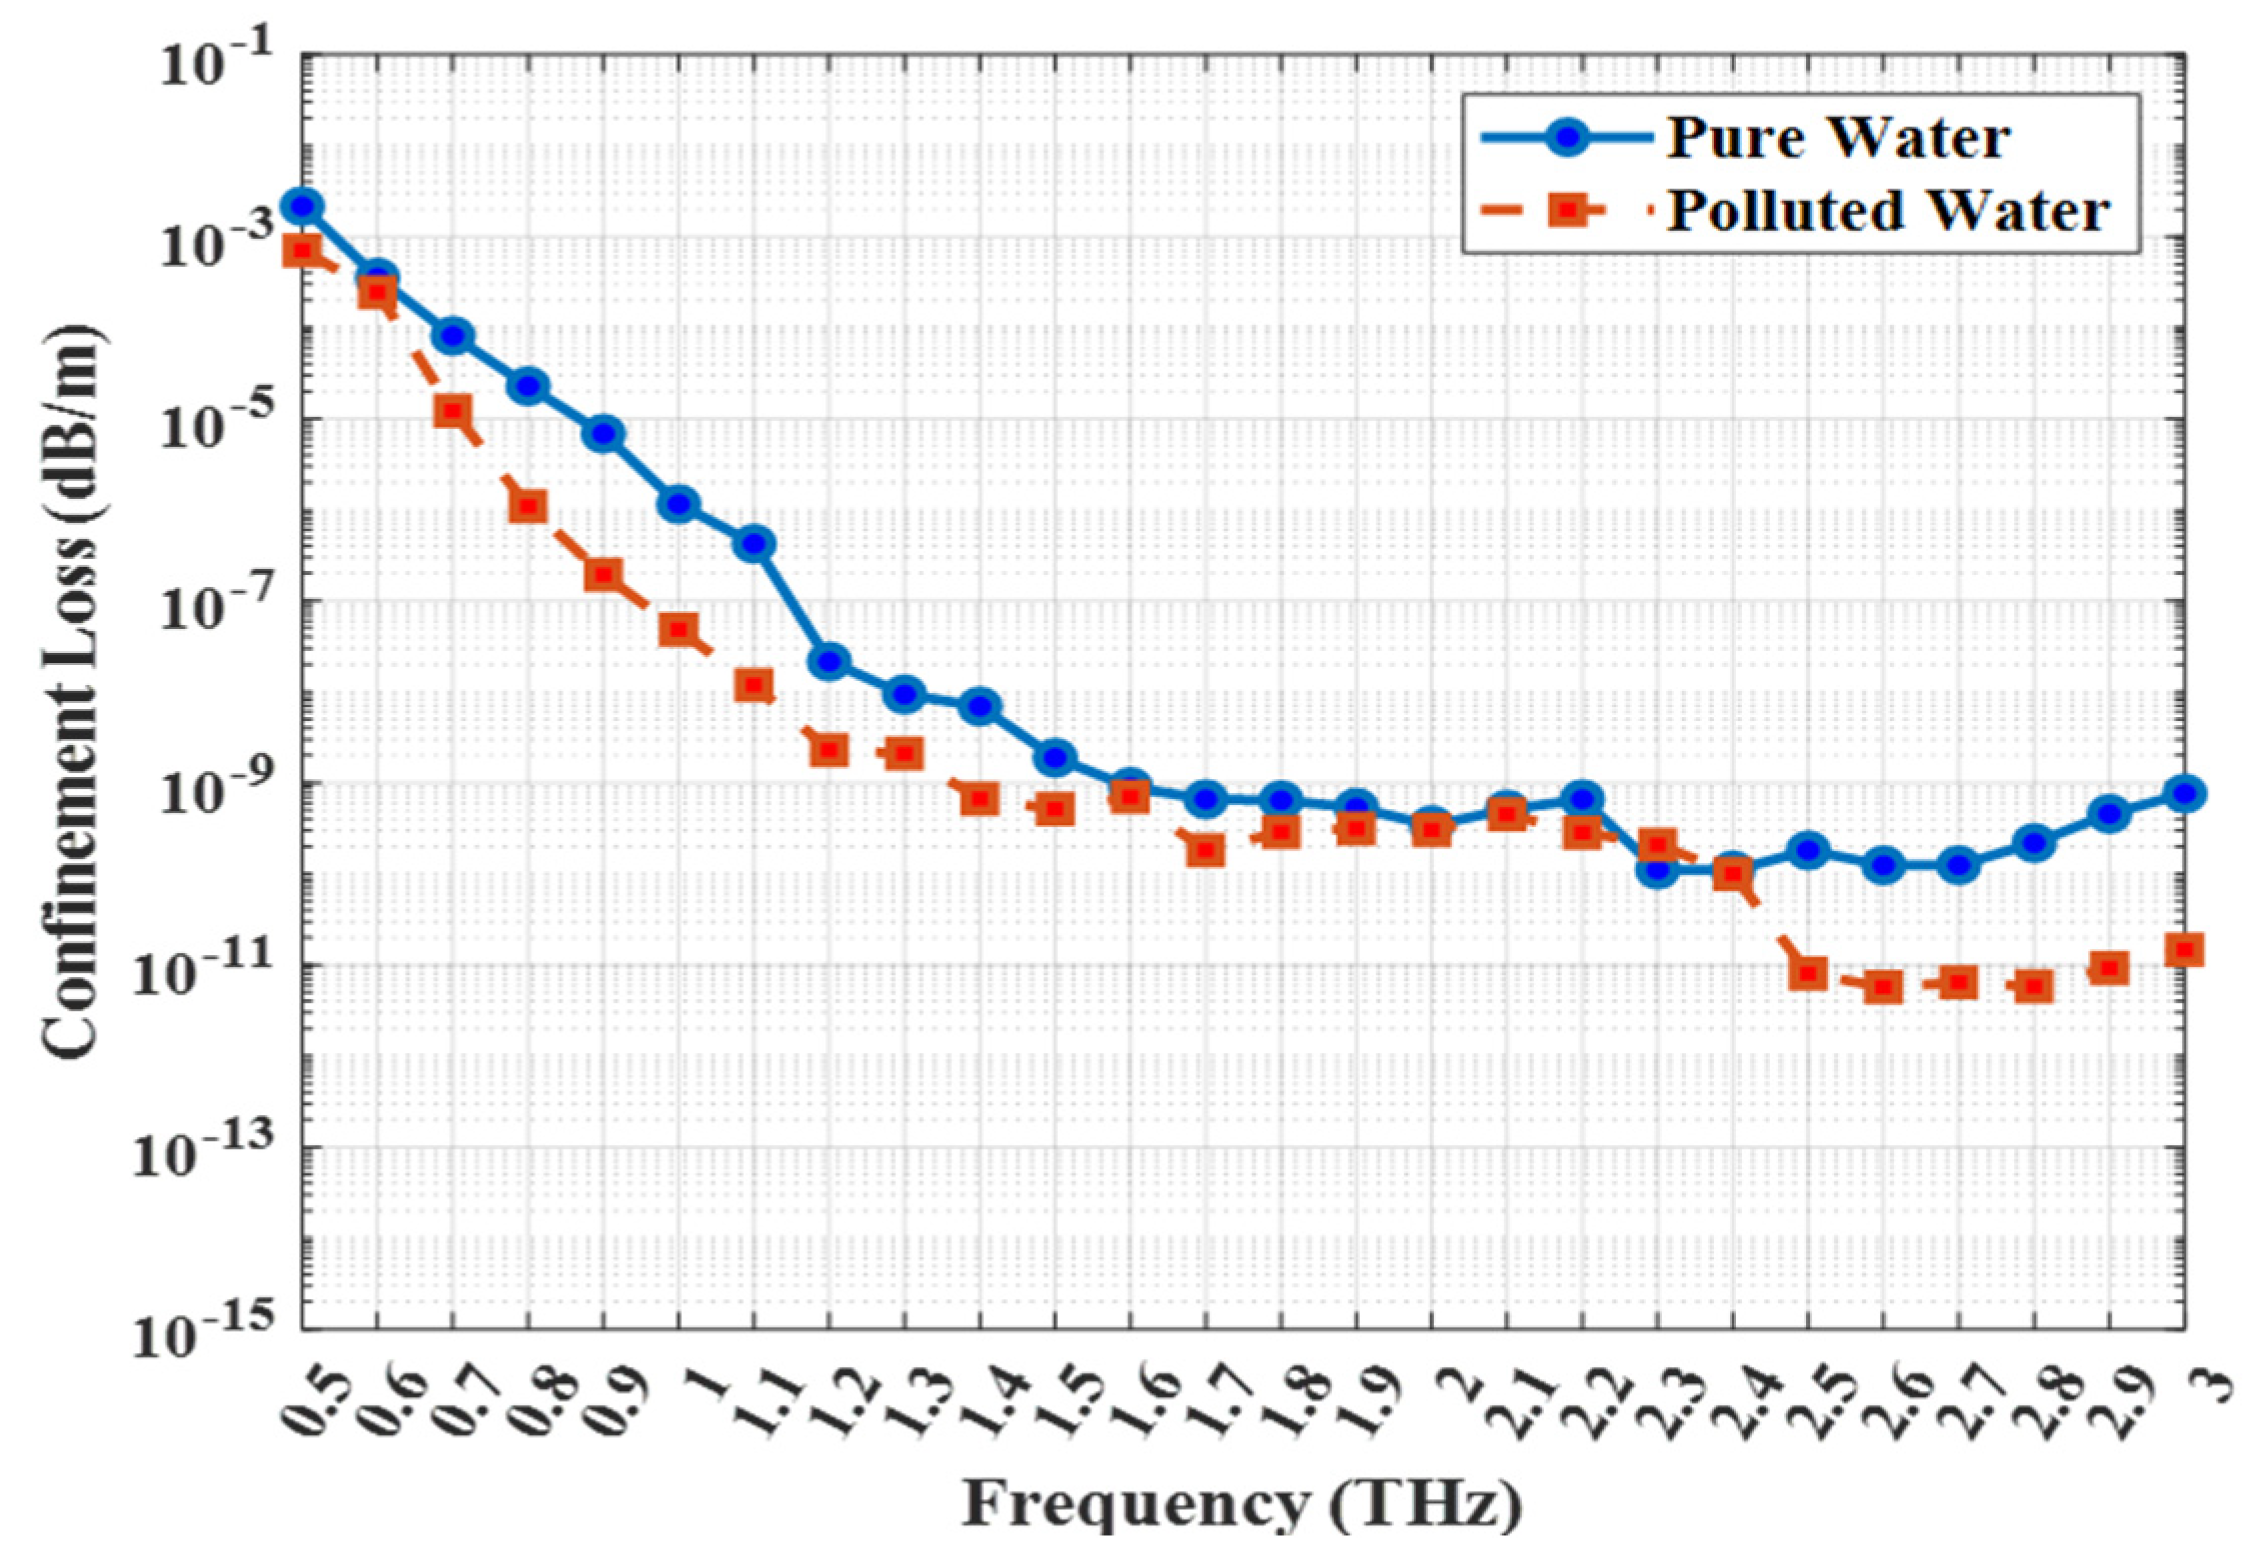
Figure 6 presents the variation in
CL as a function of frequency for both pure and polluted water analytes. The vertical axis is plotted on a logarithmic scale to clearly visualize the extremely low loss values obtained by the sensor, particularly at higher frequencies.
As shown in the figure, the confinement loss for both analytes exhibits a general decreasing trend with increasing frequency. This behavior is typical of index-guiding PCFs, where higher frequencies are more effectively confined within the core, resulting in an exponential reduction in power leakage through the cladding. The sophisticated dual-ring cladding structure of the proposed sensor has proven to be highly effective in this respect, reducing the confinement loss to negligible levels.
A significant distinction can be observed between the two analytes. The confinement loss for polluted water remains several orders of magnitude lower than that for pure water across the entire frequency range. This demonstrates significantly better confinement (and thus lower loss) for the analyte with the higher refractive index. For example, at 3 THz, the CL for polluted water reaches an exceptionally low value of 1.4 × 10⁻¹¹ dB/m, whereas for pure water it is 9.4 × 10⁻⁹ dB/m. This difference of more than two orders of magnitude is directly associated with the stronger mode confinement in the higher-index polluted water, as discussed earlier.
The extremely low CL observed for polluted water enhances the practical applicability of the sensor, as it enables longer interaction lengths without significant signal degradation, thereby improving the overall detection limit. These results confirm that the proposed sensor design provides excellent light confinement—a critical prerequisite for achieving high-performance terahertz sensing.
The physical mechanisms behind the trends in
Figure 6 are twofold. First, the general decrease in CL with increasing frequency is a fundamental property of index-guiding fibers. As frequency increases (and wavelength decreases), the cladding’s air hole structure becomes a more effective barrier relative to the mode’s wavelength, preventing the evanescent field from penetrating deeply and thus exponentially reducing power leakage. Second, the significant difference in CL between the two analytes is governed by the refractive index contrast (
between the Zeonex background (n = 1.53) and the analyte core. For pure water (n = 1.33), the contrast is large (
) while for polluted water (n = 1.41), the contrast is smaller (
). In this guiding regime, the smaller index contrast of the polluted water results in a more stable guiding mechanism and a mode field that is more tightly bound to the core-cladding interface. This stronger binding minimizes leakage, resulting in a CL that is orders of magnitude lower than that for pure water.
The effective area () provides valuable insight into the spatial distribution of the optical power and the degree of field confinement within the core. It serves as a critical parameter for assessing nonlinear optical effects and determining the efficiency of light–matter interaction in photonic crystal fiber–based sensors. A smaller effective area is generally advantageous, as it indicates tighter confinement of the electromagnetic field, thereby enhancing the overlap between the guided mode and the analyte.
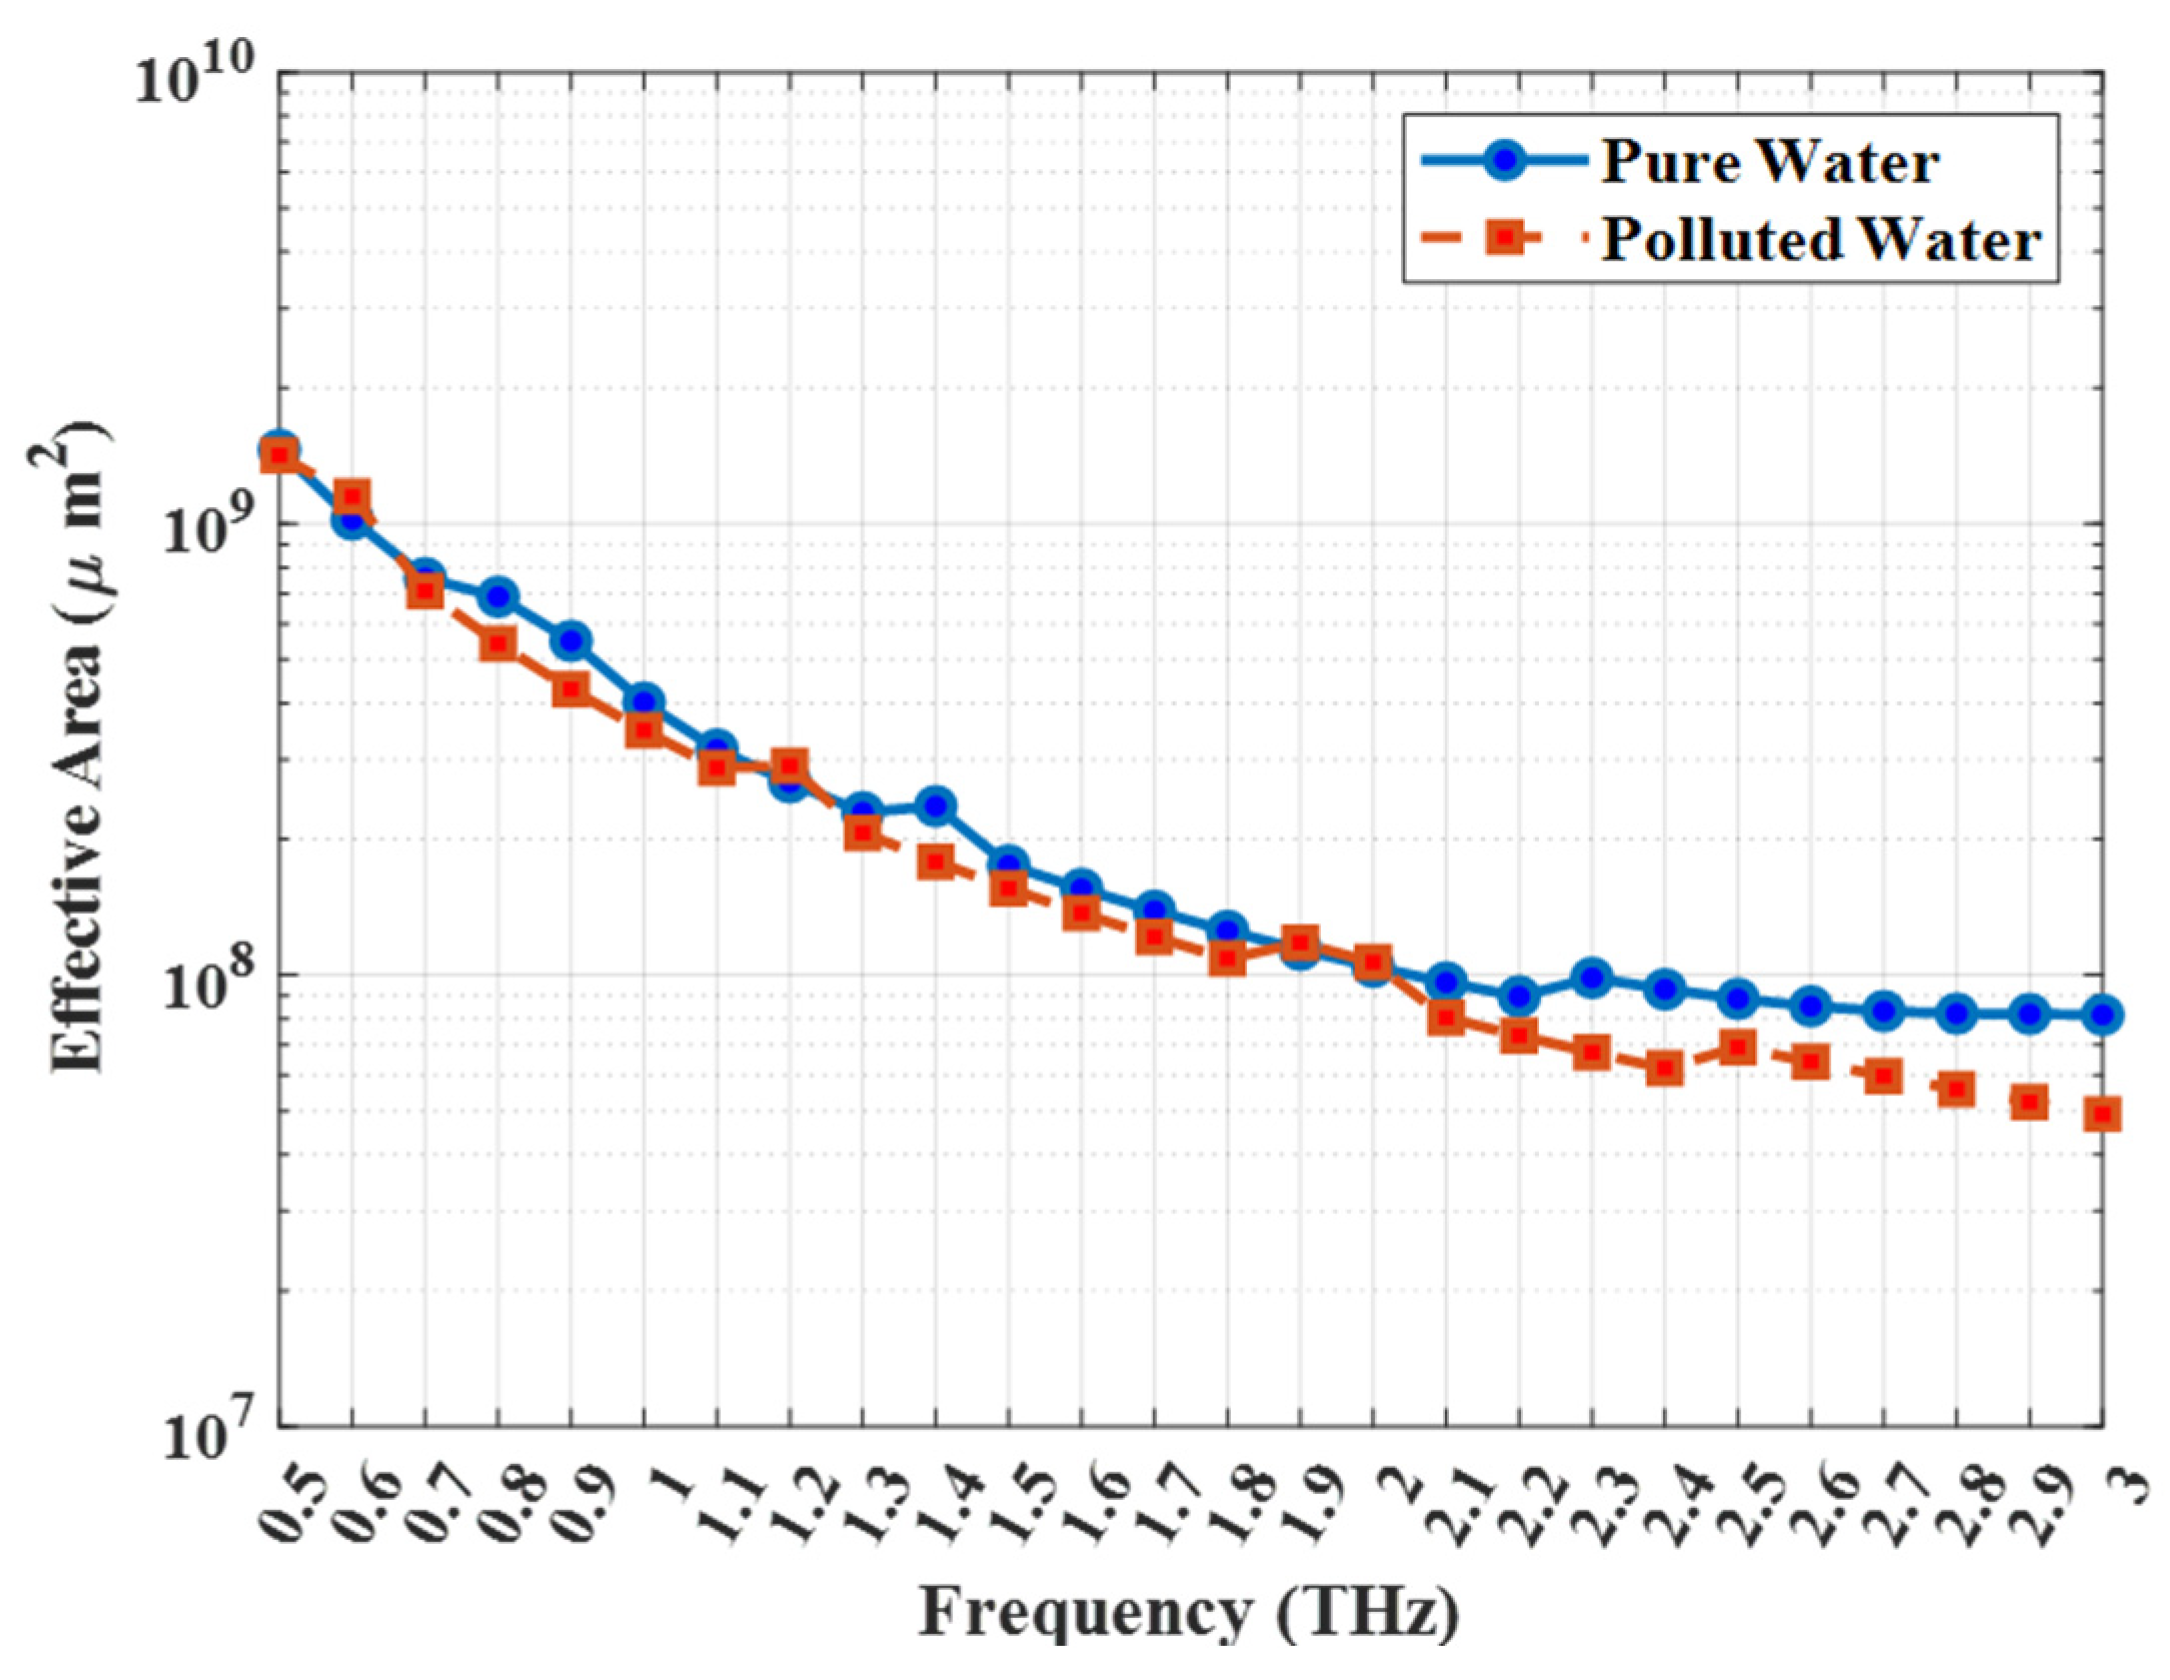
Figure 7 presents the variation of (
) with frequency for both pure and polluted water analytes. As illustrated, (
) decreases progressively with increasing frequency, which corresponds to the stronger confinement of the THz mode at higher frequencies. This reduction is more pronounced for polluted water due to its higher refractive index, which leads to a stronger guiding mechanism and greater localization of the field within the analyte region. At 3 THz, the proposed sensor achieves (
) = 4.9 × 10
7 µm
2, for polluted water and (
) = 8.1 × 10
7 µm
2. for pure water. These low values confirm that the optical mode is tightly confined in the sensing core, which is highly beneficial for achieving strong light–analyte interaction. Consequently, the small effective area, combined with the extremely low confinement loss, demonstrates the ability of the sensor design to efficiently guide and interact with terahertz waves, making it well-suited for high-sensitivity detection of water pollutants.
The physical origins of the trends observed in
Figure 7 are directly linked to the guiding mechanisms previously discussed. The decrease in
with increasing frequency is expected, as the modal field naturally becomes more contracted and localized at higher frequencies. Furthermore, the difference in
between the analytes confirms the confinement behavior. As established for
Figure 6, the polluted water (n = 1.41) benefits from a more stable guiding mechanism due to its smaller
with the Zeonex background. This stronger guiding results in a modal field that is more tightly concentrated within the core boundaries, yielding a smaller effective area. Conversely, the larger
for pure water (n = 1.33) leads to a slightly more expanded mode (as visualized in
Figure 2 compared to
Figure 3), which directly corresponds to its larger
To comprehensively evaluate the versatility and potential of the proposed sensor beyond water-quality monitoring, a detailed parametric analysis has been conducted by varying the analyte refractive index (
) from 1.33 to 1.46 with an incremental step of 0.01. This refractive-index range is of particular importance, as it covers the values corresponding to numerous environmentally relevant aqueous mixtures and pollutants, including solutions containing varying concentrations of glucose, alcohol, and a variety of industrial or agricultural chemicals. Such a range effectively represents real-world conditions in which trace contaminants or solute variations alter the refractive index of water, thereby influencing its terahertz (THz) optical response. By demonstrating stable and high performance across this entire range, the proposed sensor has proven to be highly robust and applicable as a versatile platform for diverse domains such as environmental monitoring, food-safety inspection, and chemical process control. All simulations were performed at the optimal operating frequency of 3 THz.
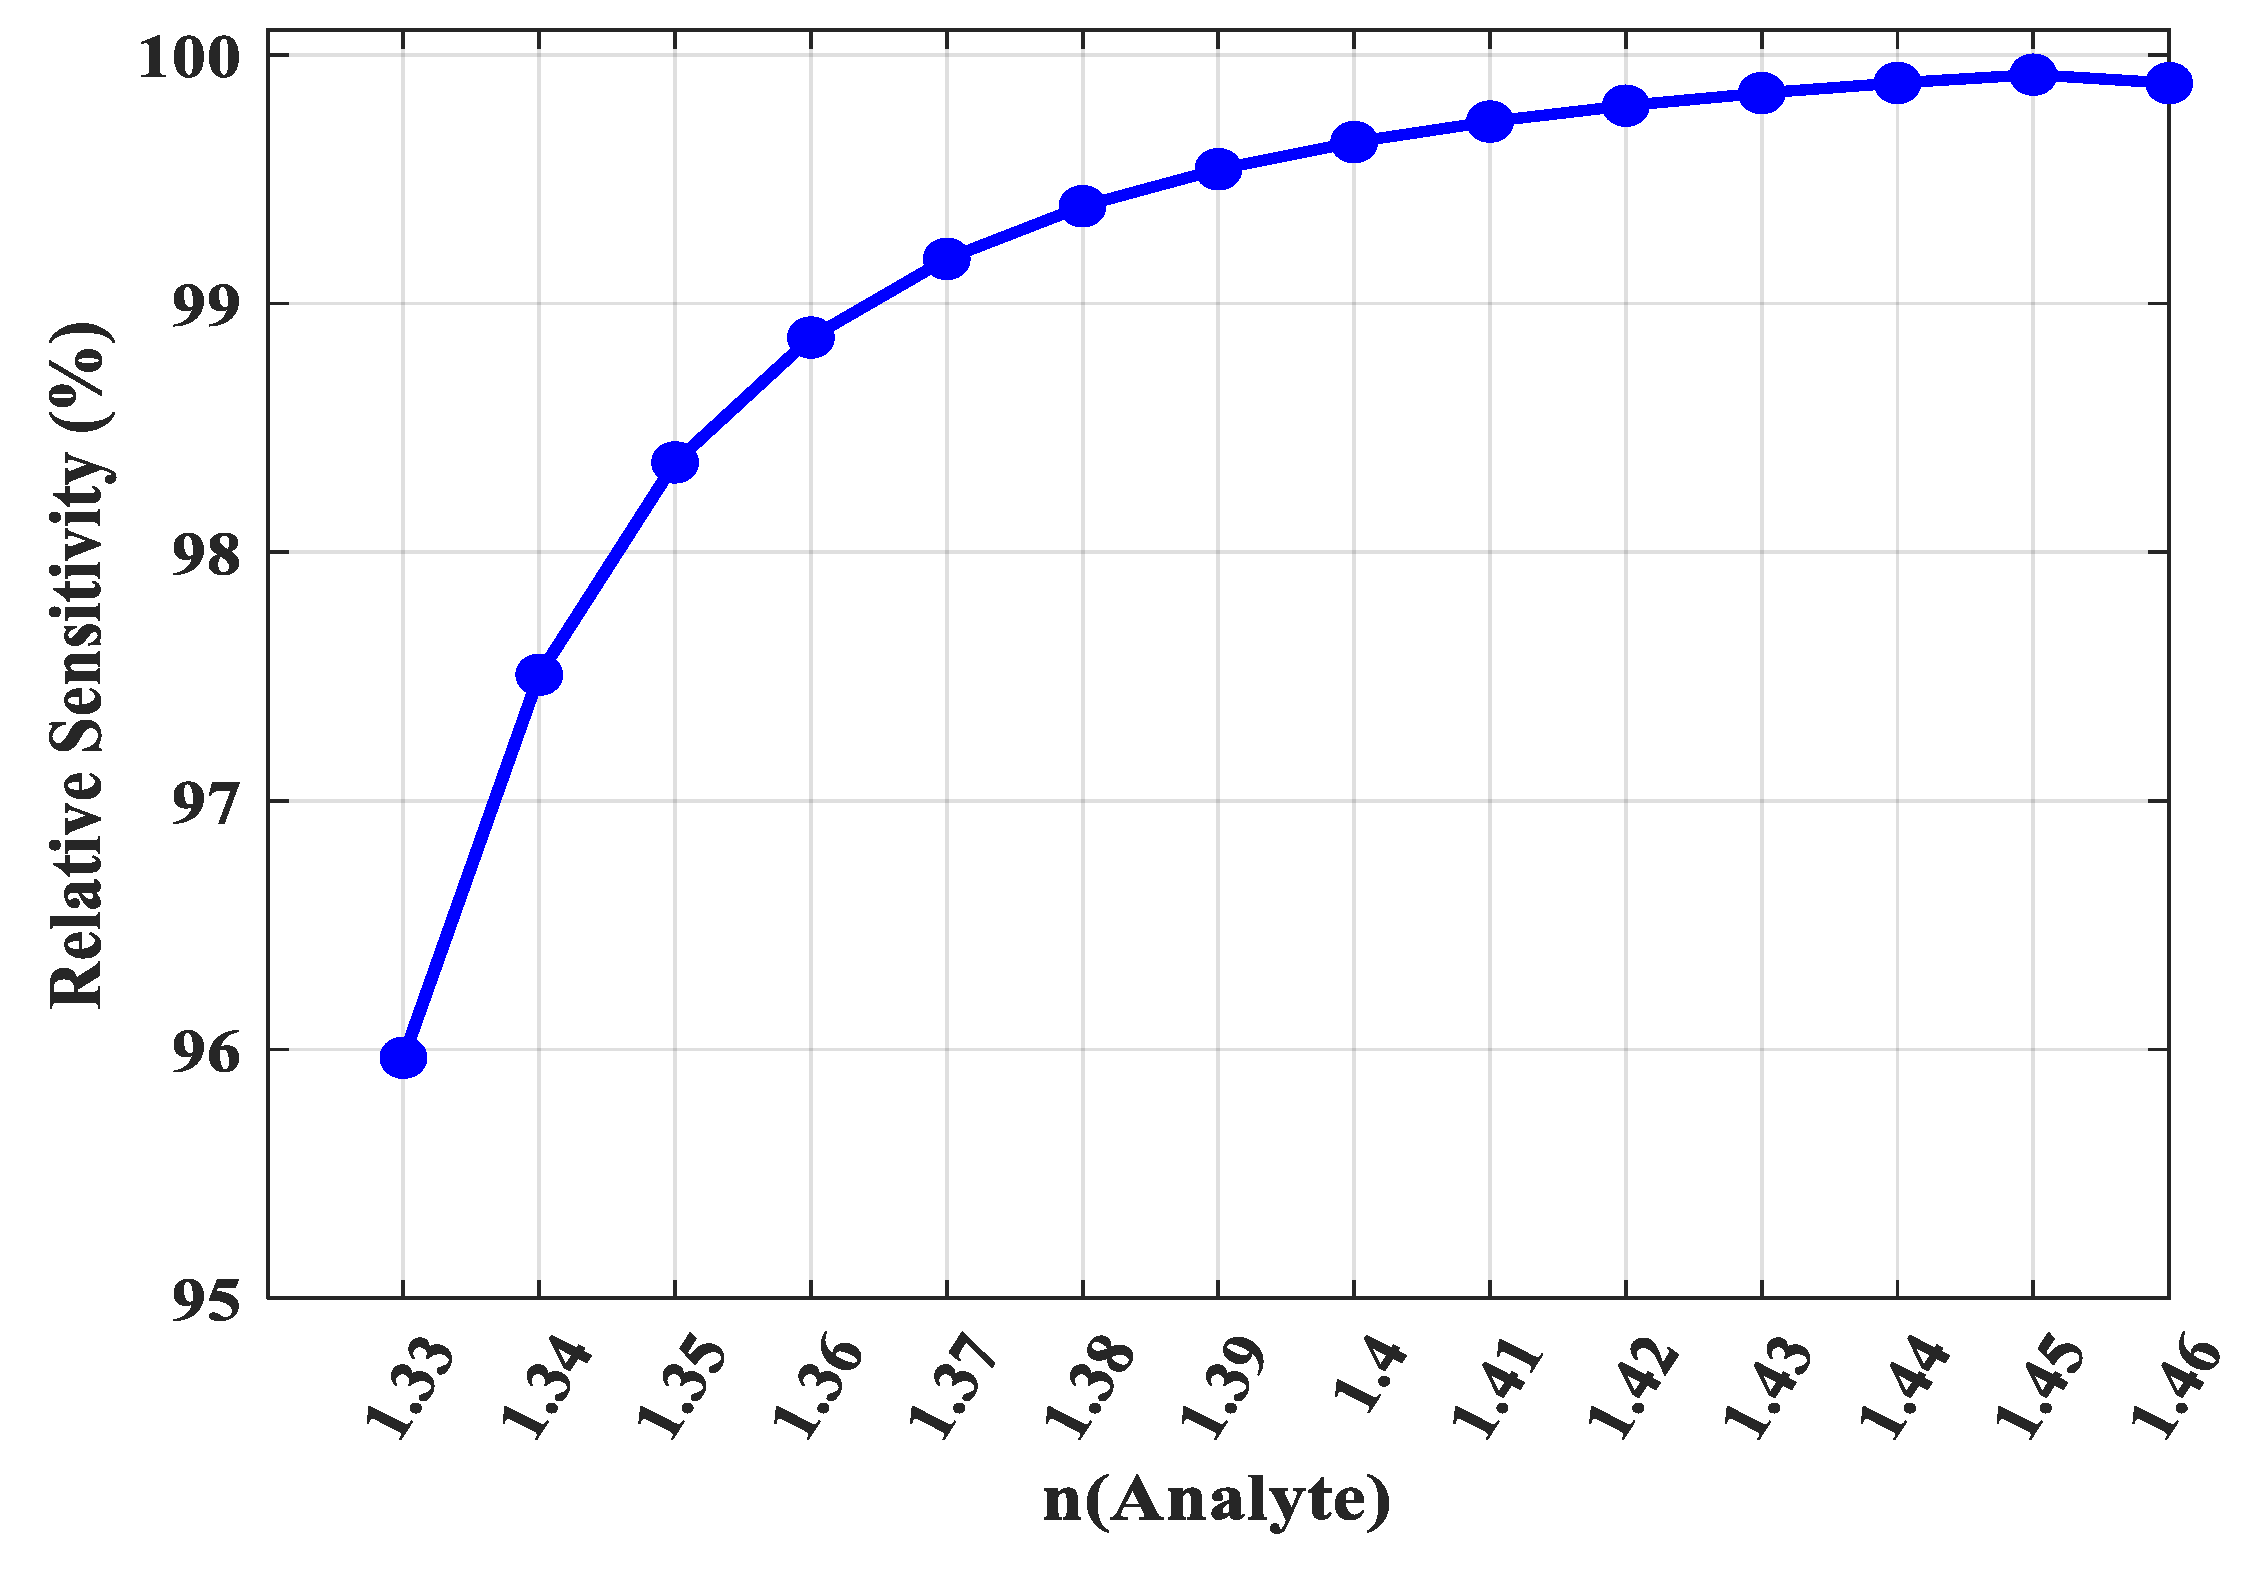
Figure 8 presents the sensitivity as a function of the analyte refractive index. The results reveal a clear and strong positive correlation: as the refractive index of the analyte increases, the relative sensitivity of the sensor rises significantly. The sensitivity starts at approximately 96% for an analyte with n = 1.33 and rapidly exceeds 99% for analytes with n ≥ 1.37, asymptotically approaching the theoretical upper limit of 100%. This behavior is governed by the fundamental principle of index guiding. As the refractive index of the analyte approaches that of the Zeonex background (n = 1.53), the refractive-index contrast at the core–cladding interface is reduced, which enhances the ability of the fiber core to confine the mode more effectively, resulting in a stronger overlap between the THz field and the analyte.
To validate this interpretation,
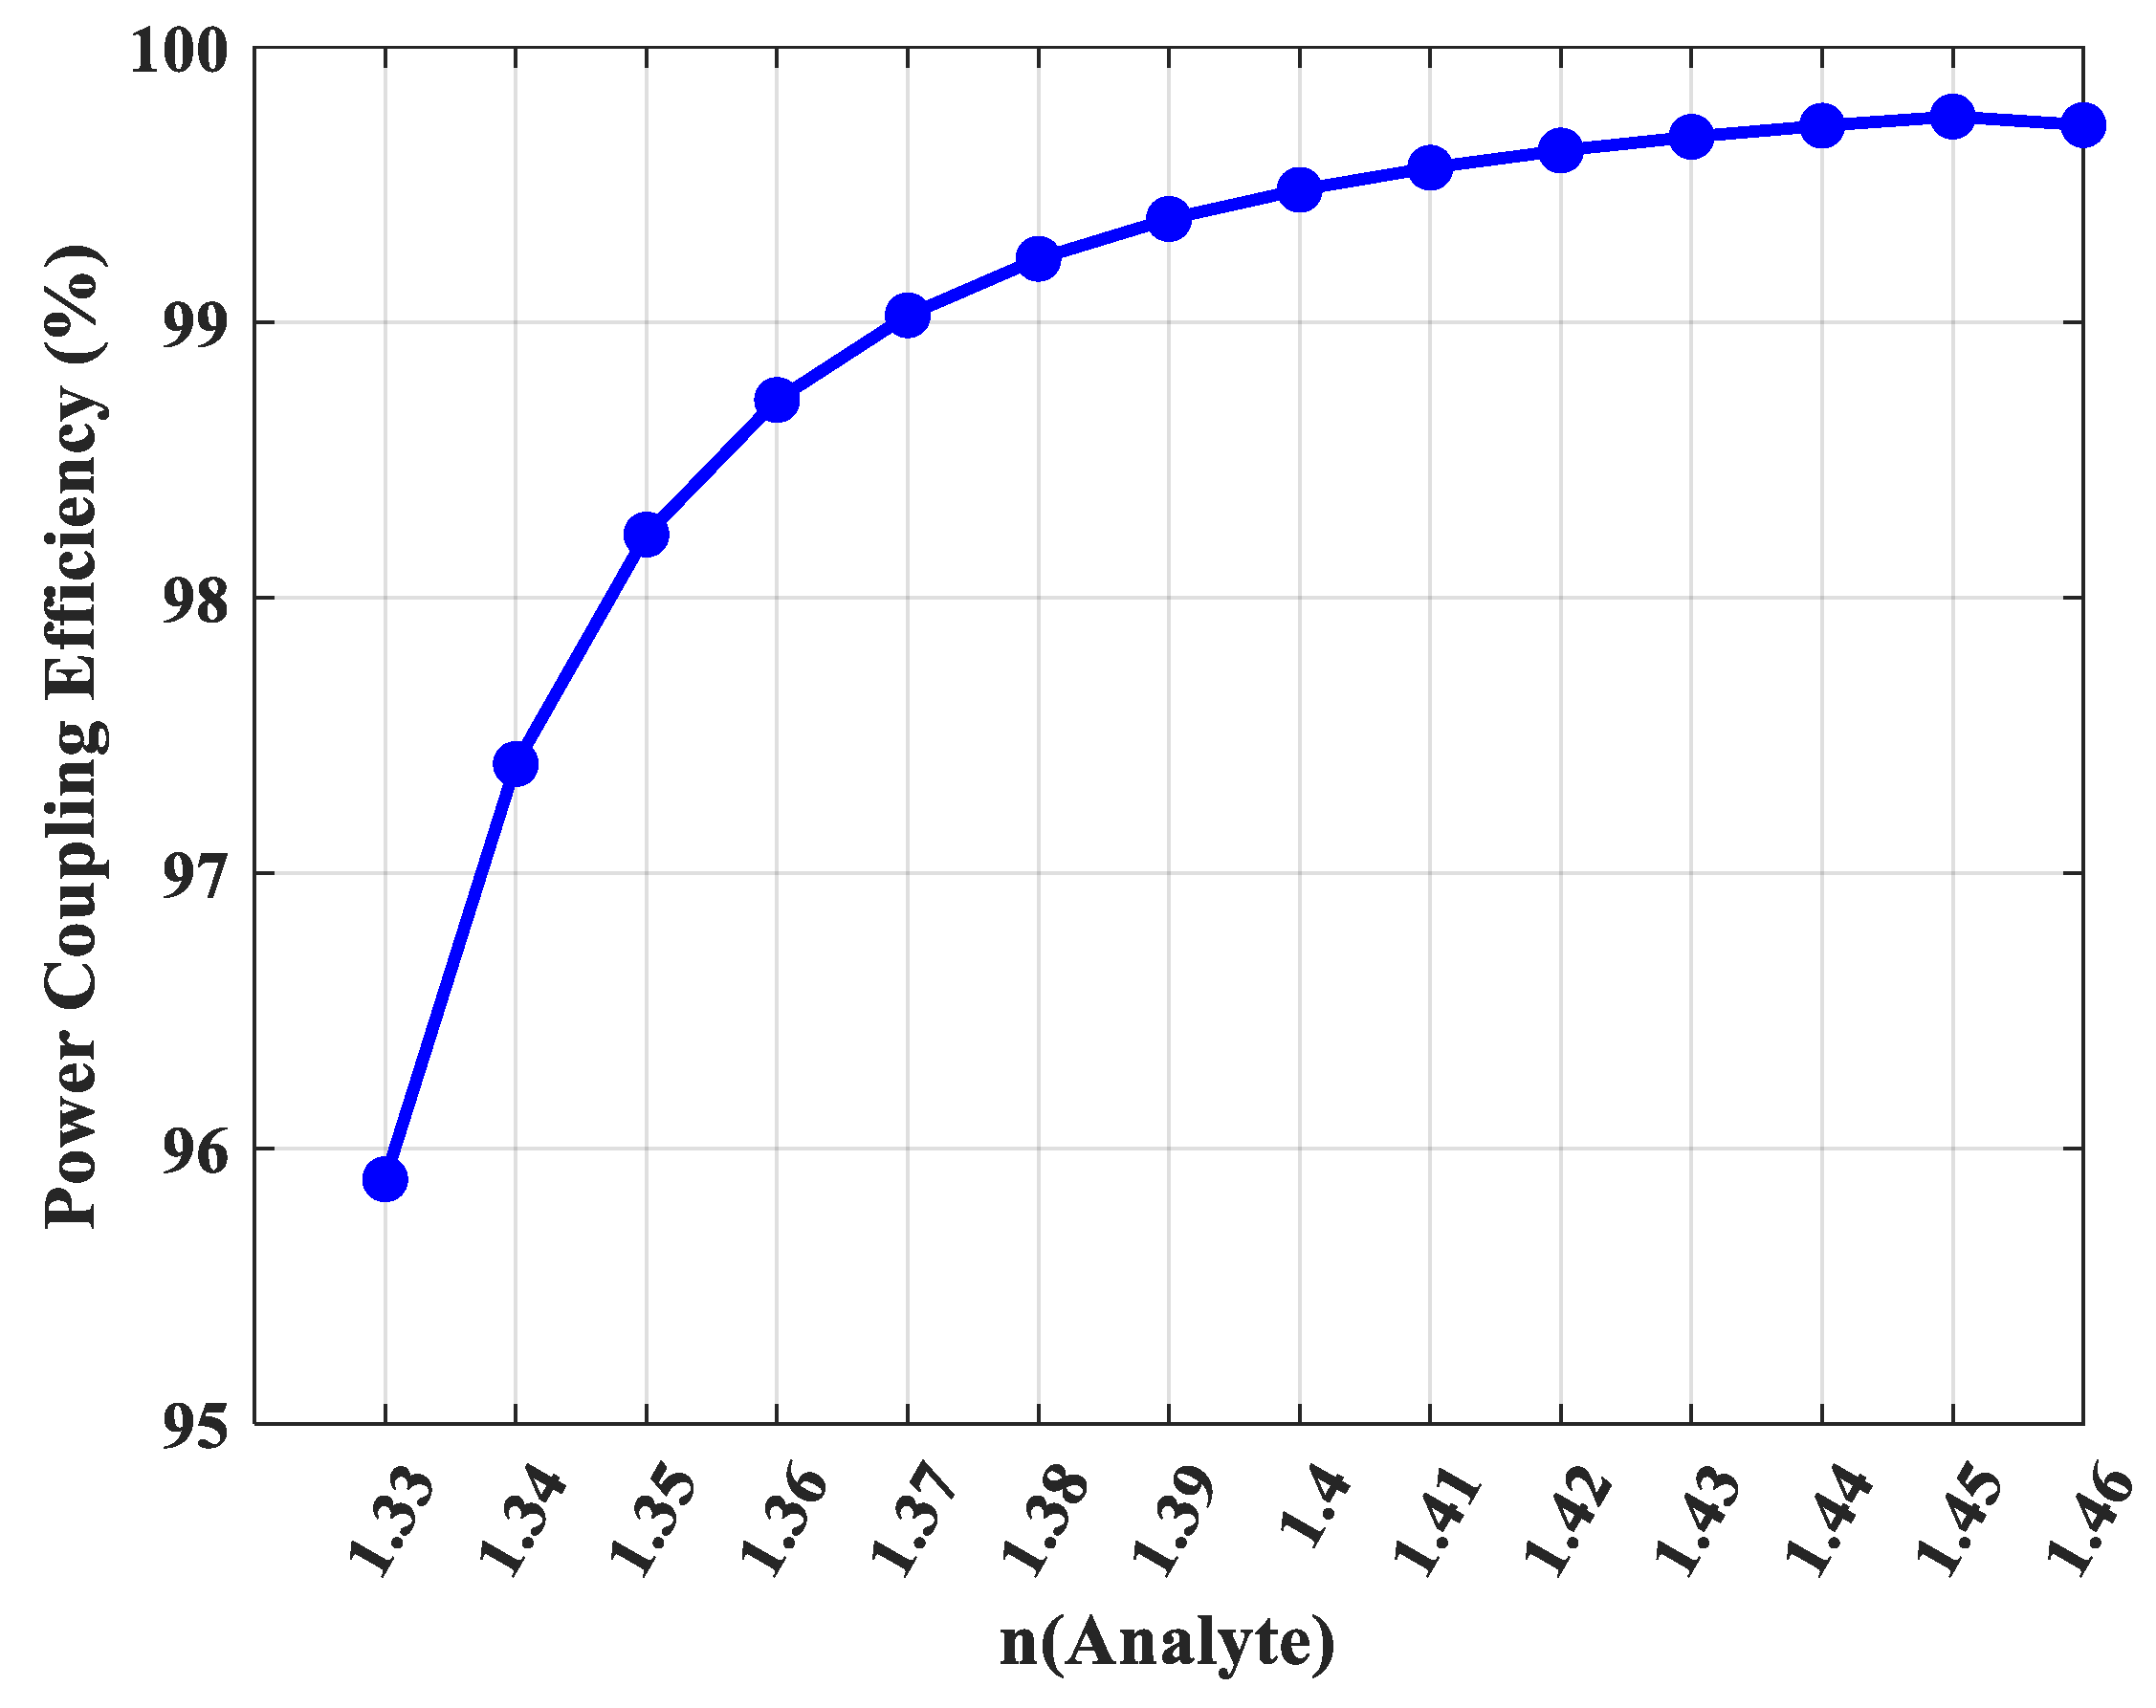
Figure 9 shows the power coupling efficiency across the same range of refractive indices. The trend observed in this graph perfectly mirrors the relative sensitivity curve confirming that higher analyte indices lead to enhanced power confinement within the core. The power coupling efficiency, which represents the percentage of light confined within the core, increases from 95.9% at n = 1.33 to an exceptional 99.8% at n = 1.46. This directly confirms that the remarkable increase in sensitivity is driven by the enhanced power confinement at higher analyte refractive indices. The near-perfect power coupling efficiency for analytes with n > 1.40 indicates that virtually the entire guided mode is interacting with the substance under test, which is the hallmark of an optimally designed sensor. This robust and predictable performance across a broad RI range makes the proposed sensor a highly reliable and powerful tool for a multitude of advanced sensing applications.
Further complementing this analysis, the guiding properties of the sensor were investigated across the same refractive index range.
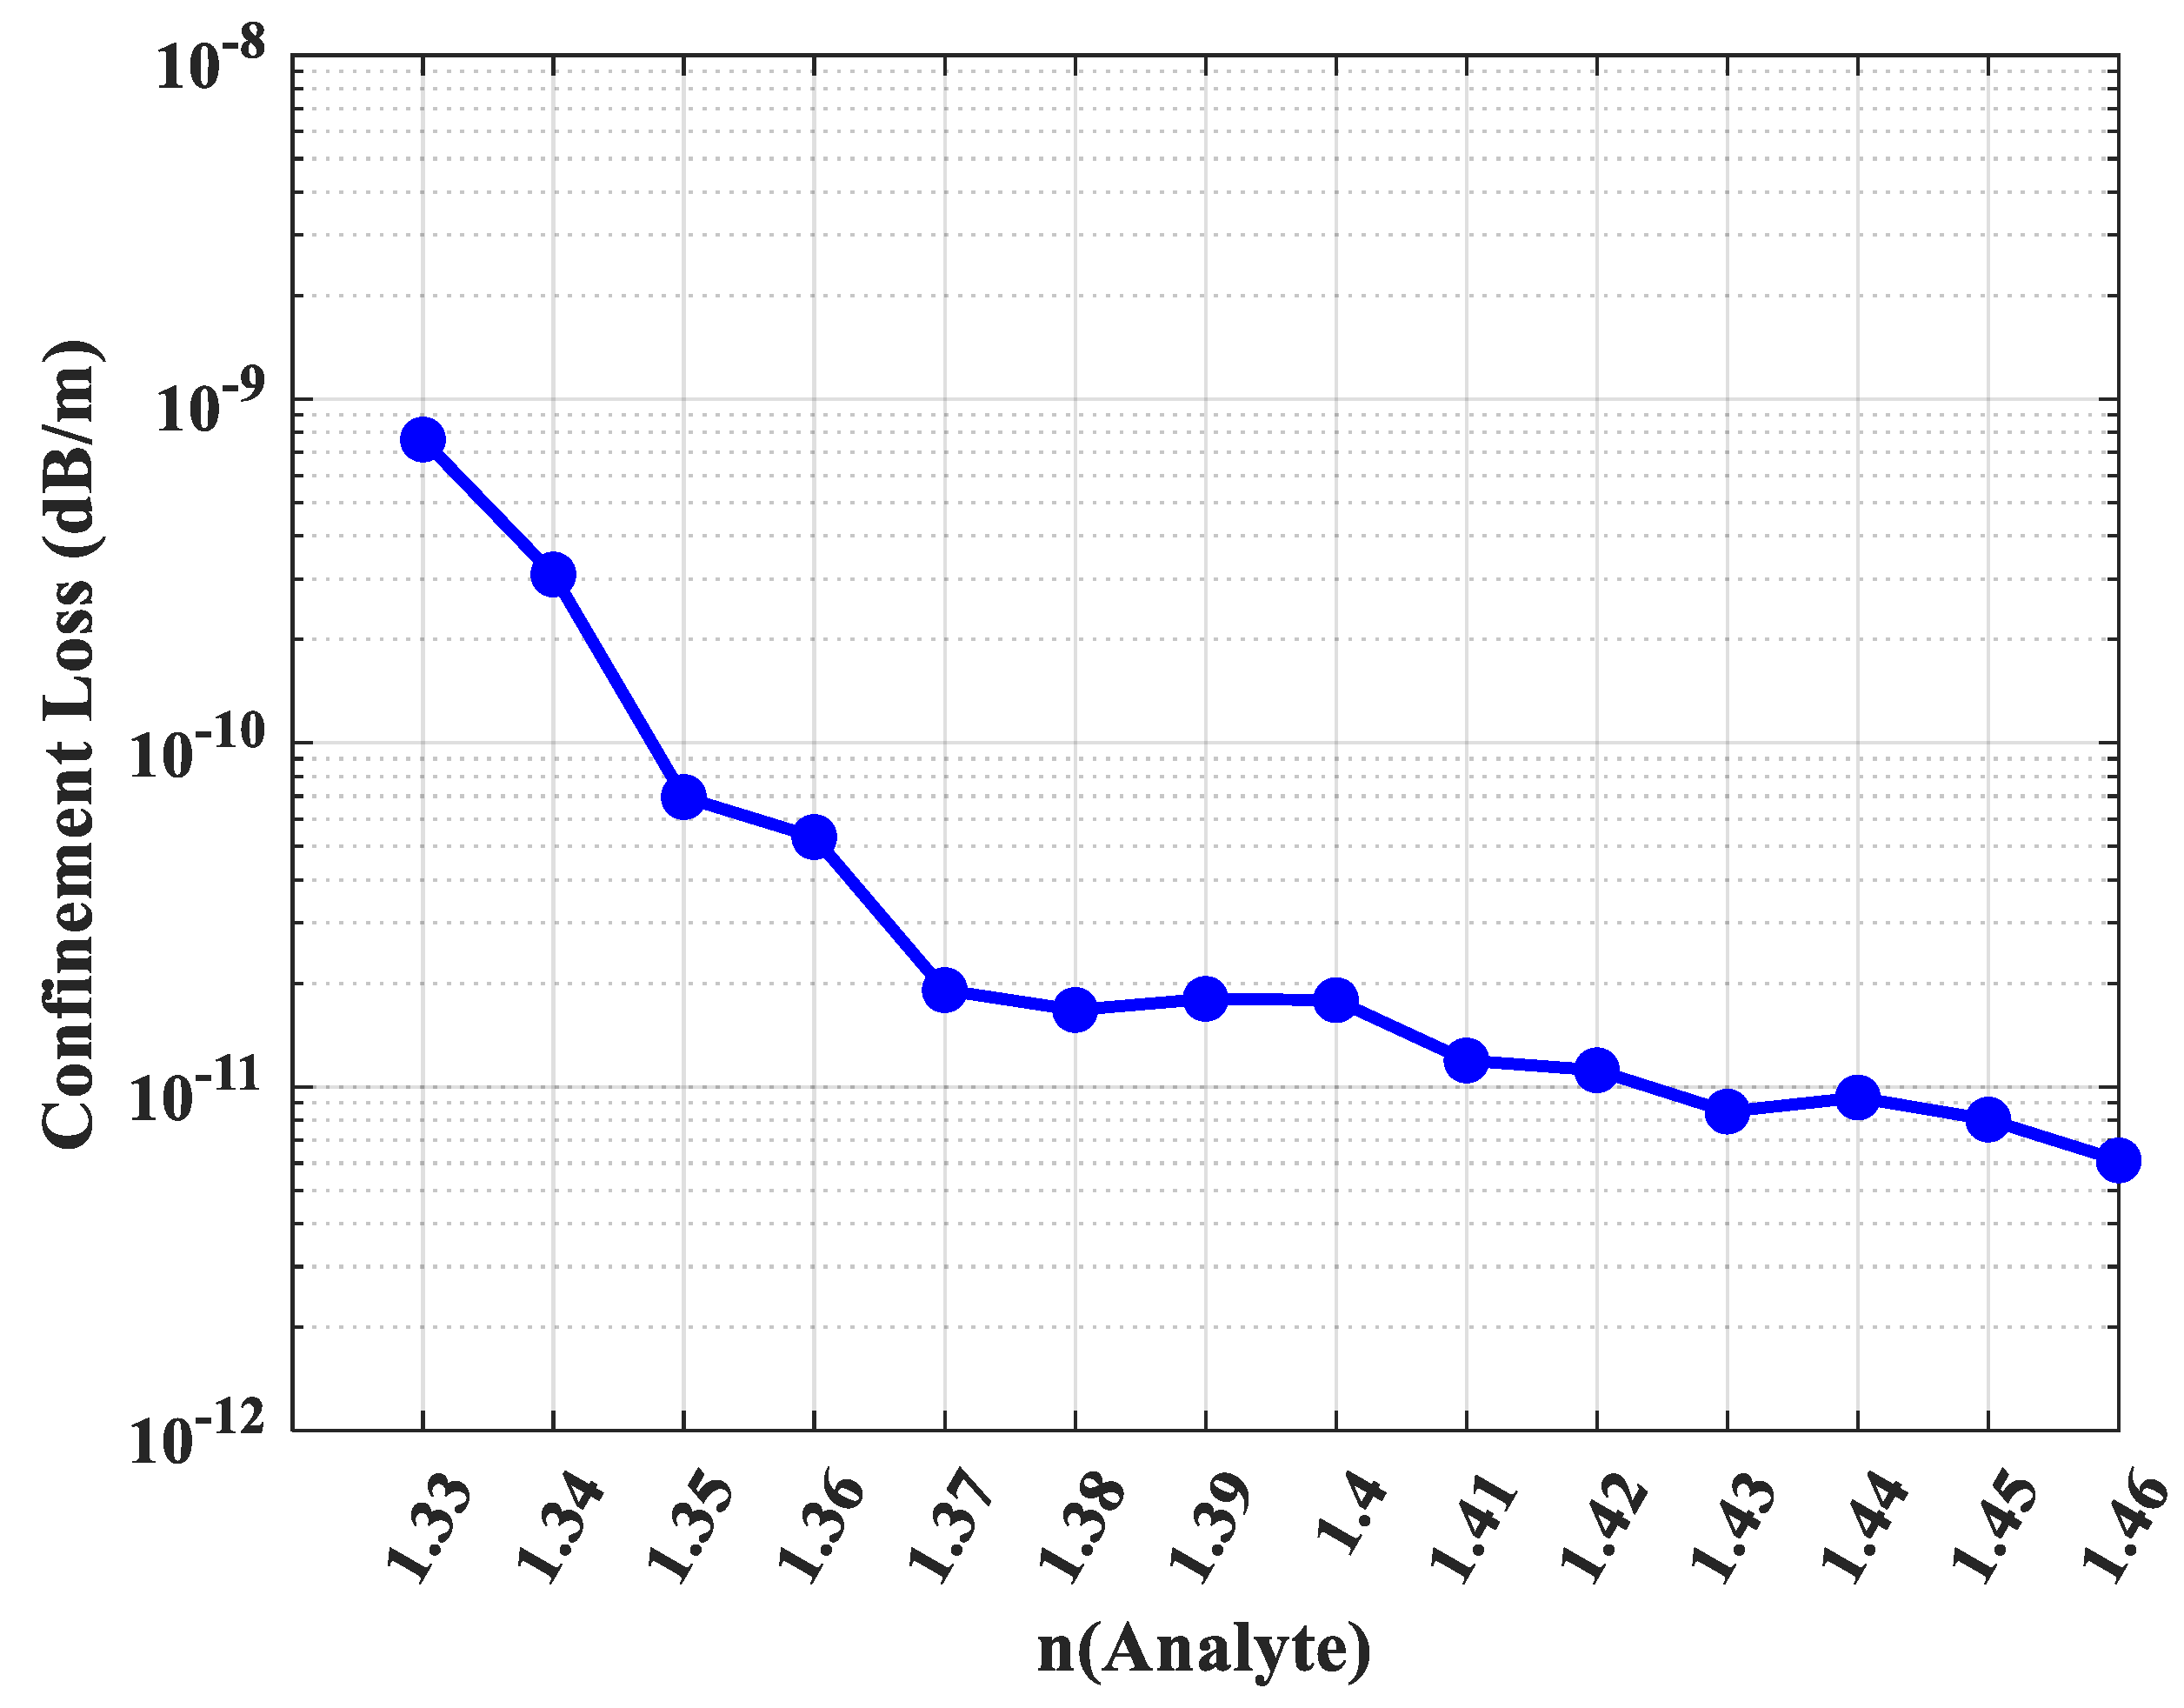
Figure 10 plots the confinement loss as a function of the analyte’s refractive index. A dramatic and highly beneficial trend is observed: the confinement loss decreases by several orders of magnitude as the analyte’s refractive index increases. Specifically, the loss drops from 8.9 × 10
−10 dB/m for an analyte with n = 1.33 to an exceptionally low 7.9 × 10
−12 dB/m for n = 1.46. This exponential reduction is a direct testament to the enhanced mode confinement. As the analyte’s refractive index approaches closer to that of the Zeonex background, the index-guiding mechanism becomes more robust, effectively creating a stronger barrier that prevents the THz wave from leaking out of the core. This characteristic is particularly advantageous, as it ensures that the sensor operates with the highest signal integrity precisely when detecting substances with higher refractive indices, which often correlate with higher concentrations or different biological materials.
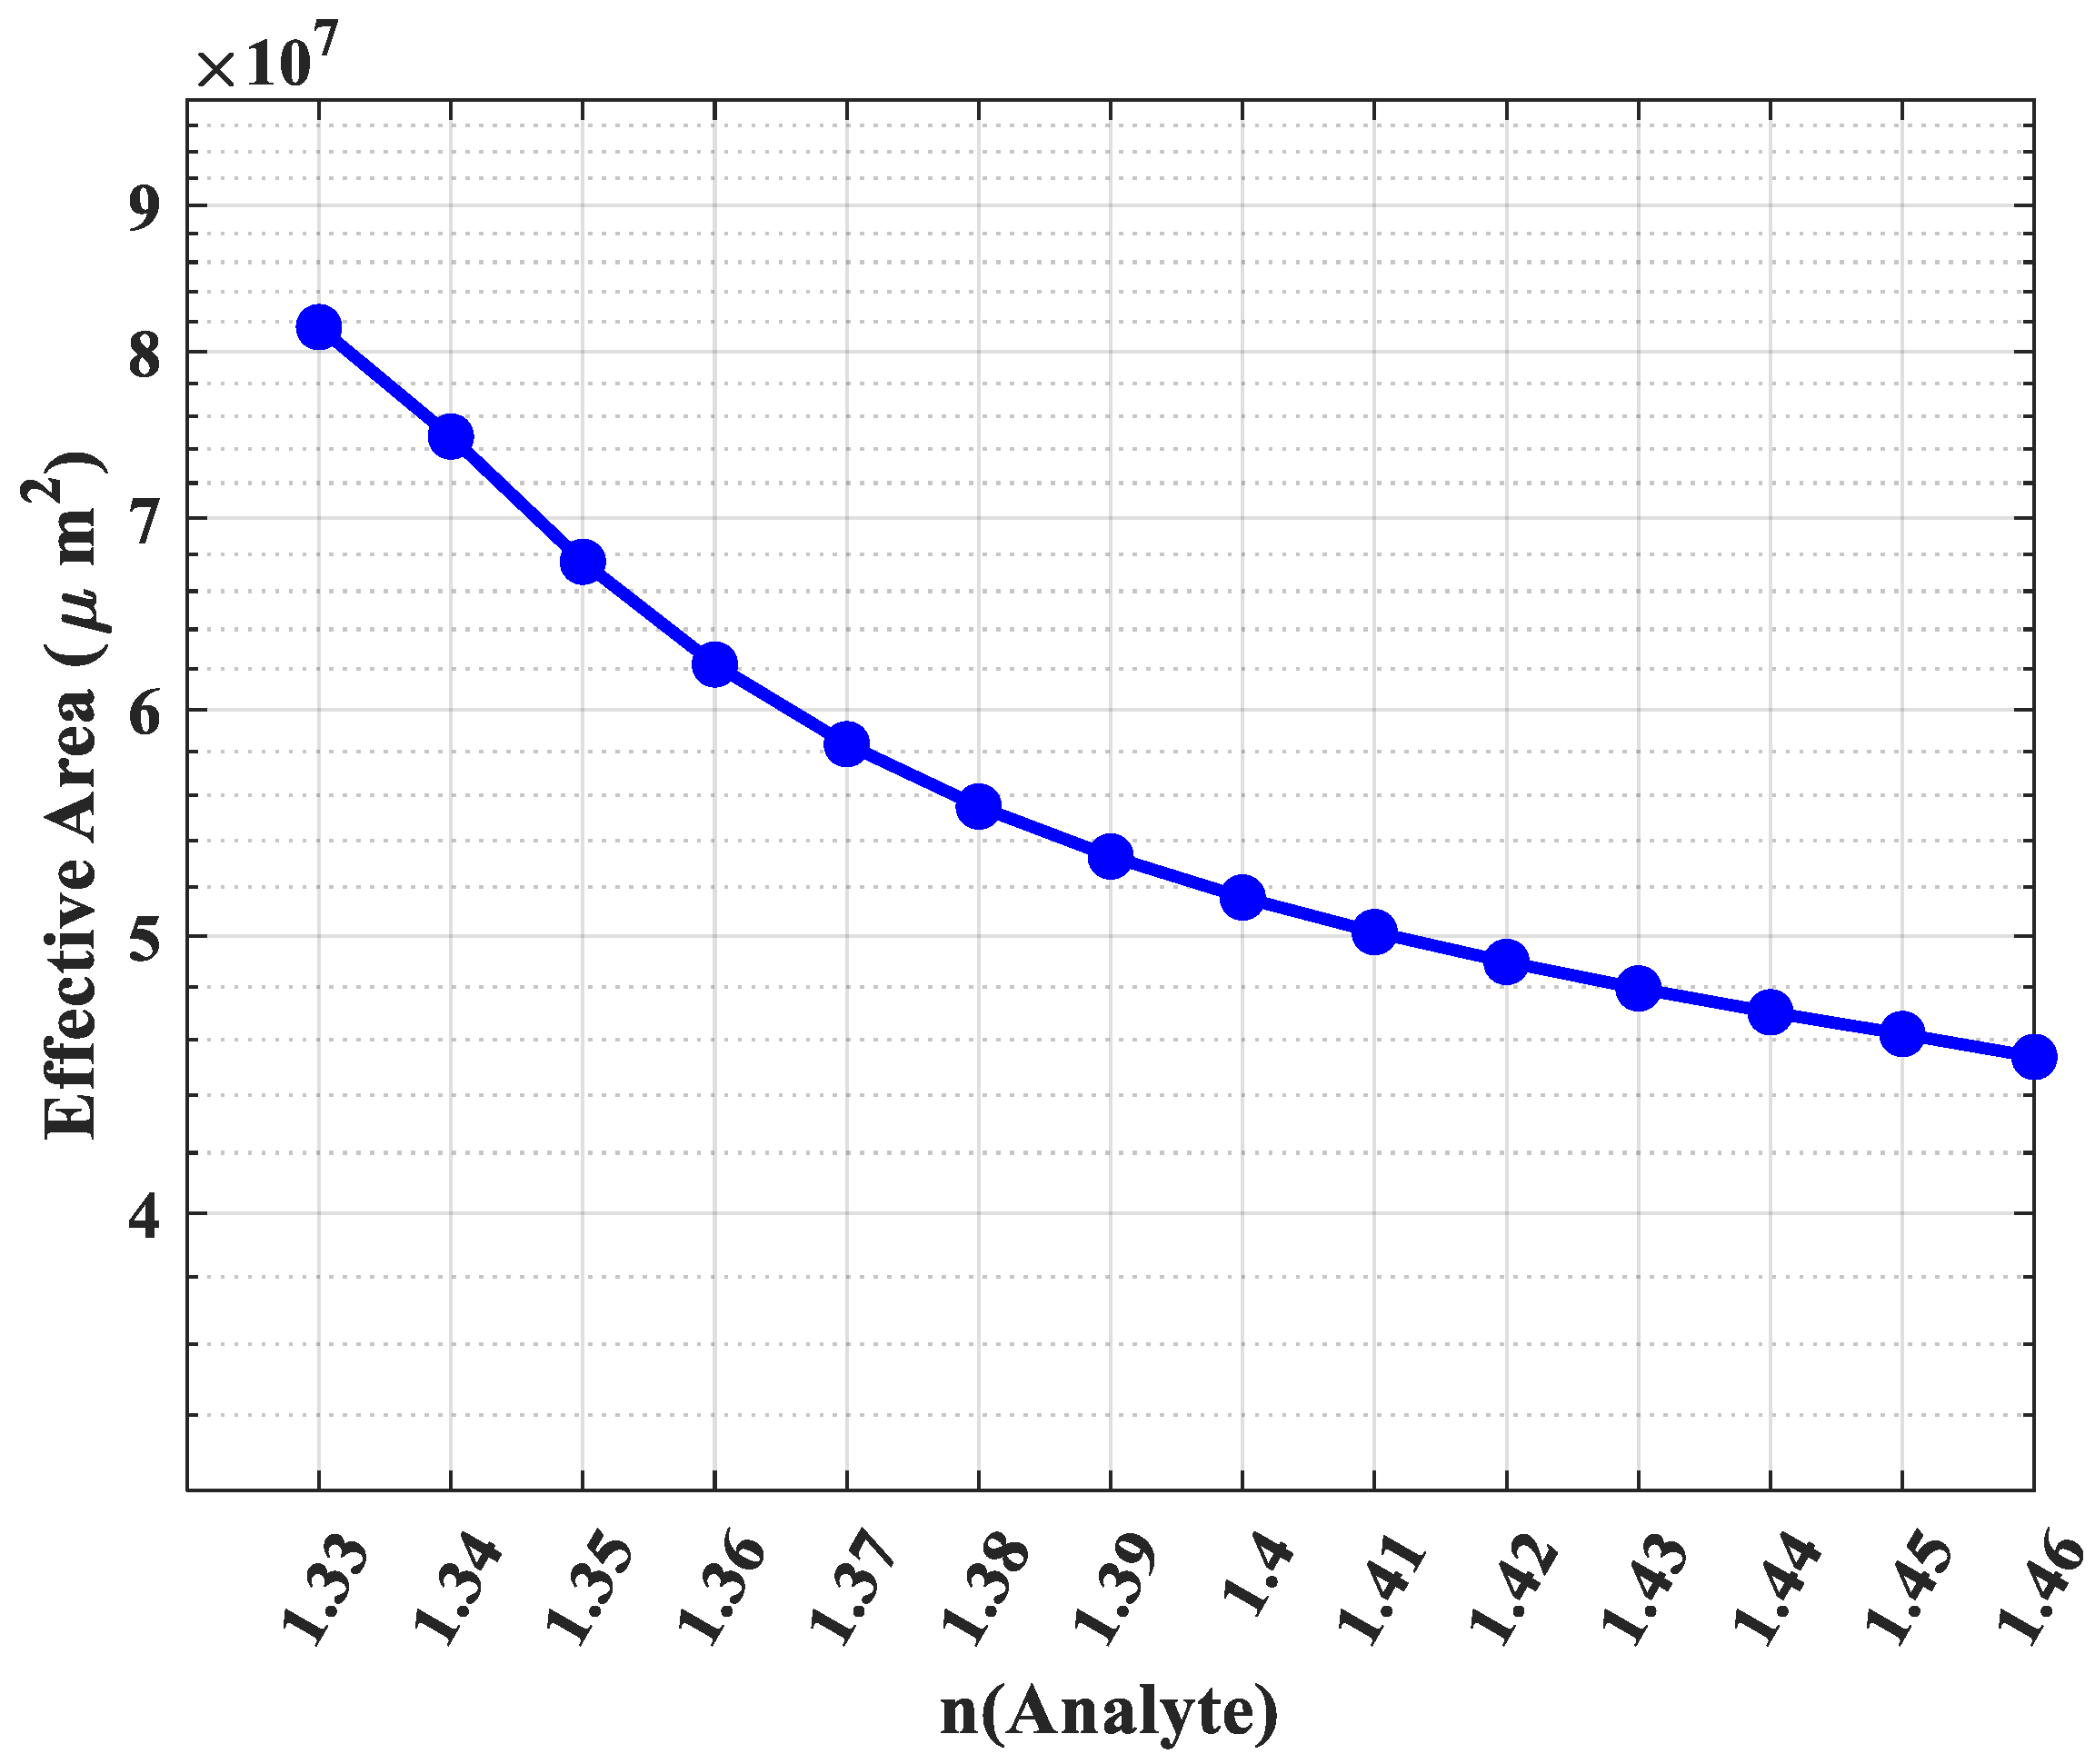
This enhanced confinement is also reflected in the effective area (
) and numerical aperture (NA), as shown in
Figure 11 and
Figure 12, respectively.
Figure 11 reveals that the effective area steadily decreases with an increasing analyte refractive index, from 8.1 × 10
7 µm
2 at n = 1.33 down to 4.5 × 10
7 µm
2 at n = 1.46. This reduction signifies that the modal power is becoming more tightly concentrated within the core for higher-index analytes, indicating a more focused mode field. This concentration of power not only contributes to the enhanced sensitivity but also confirms the stronger guiding effect.
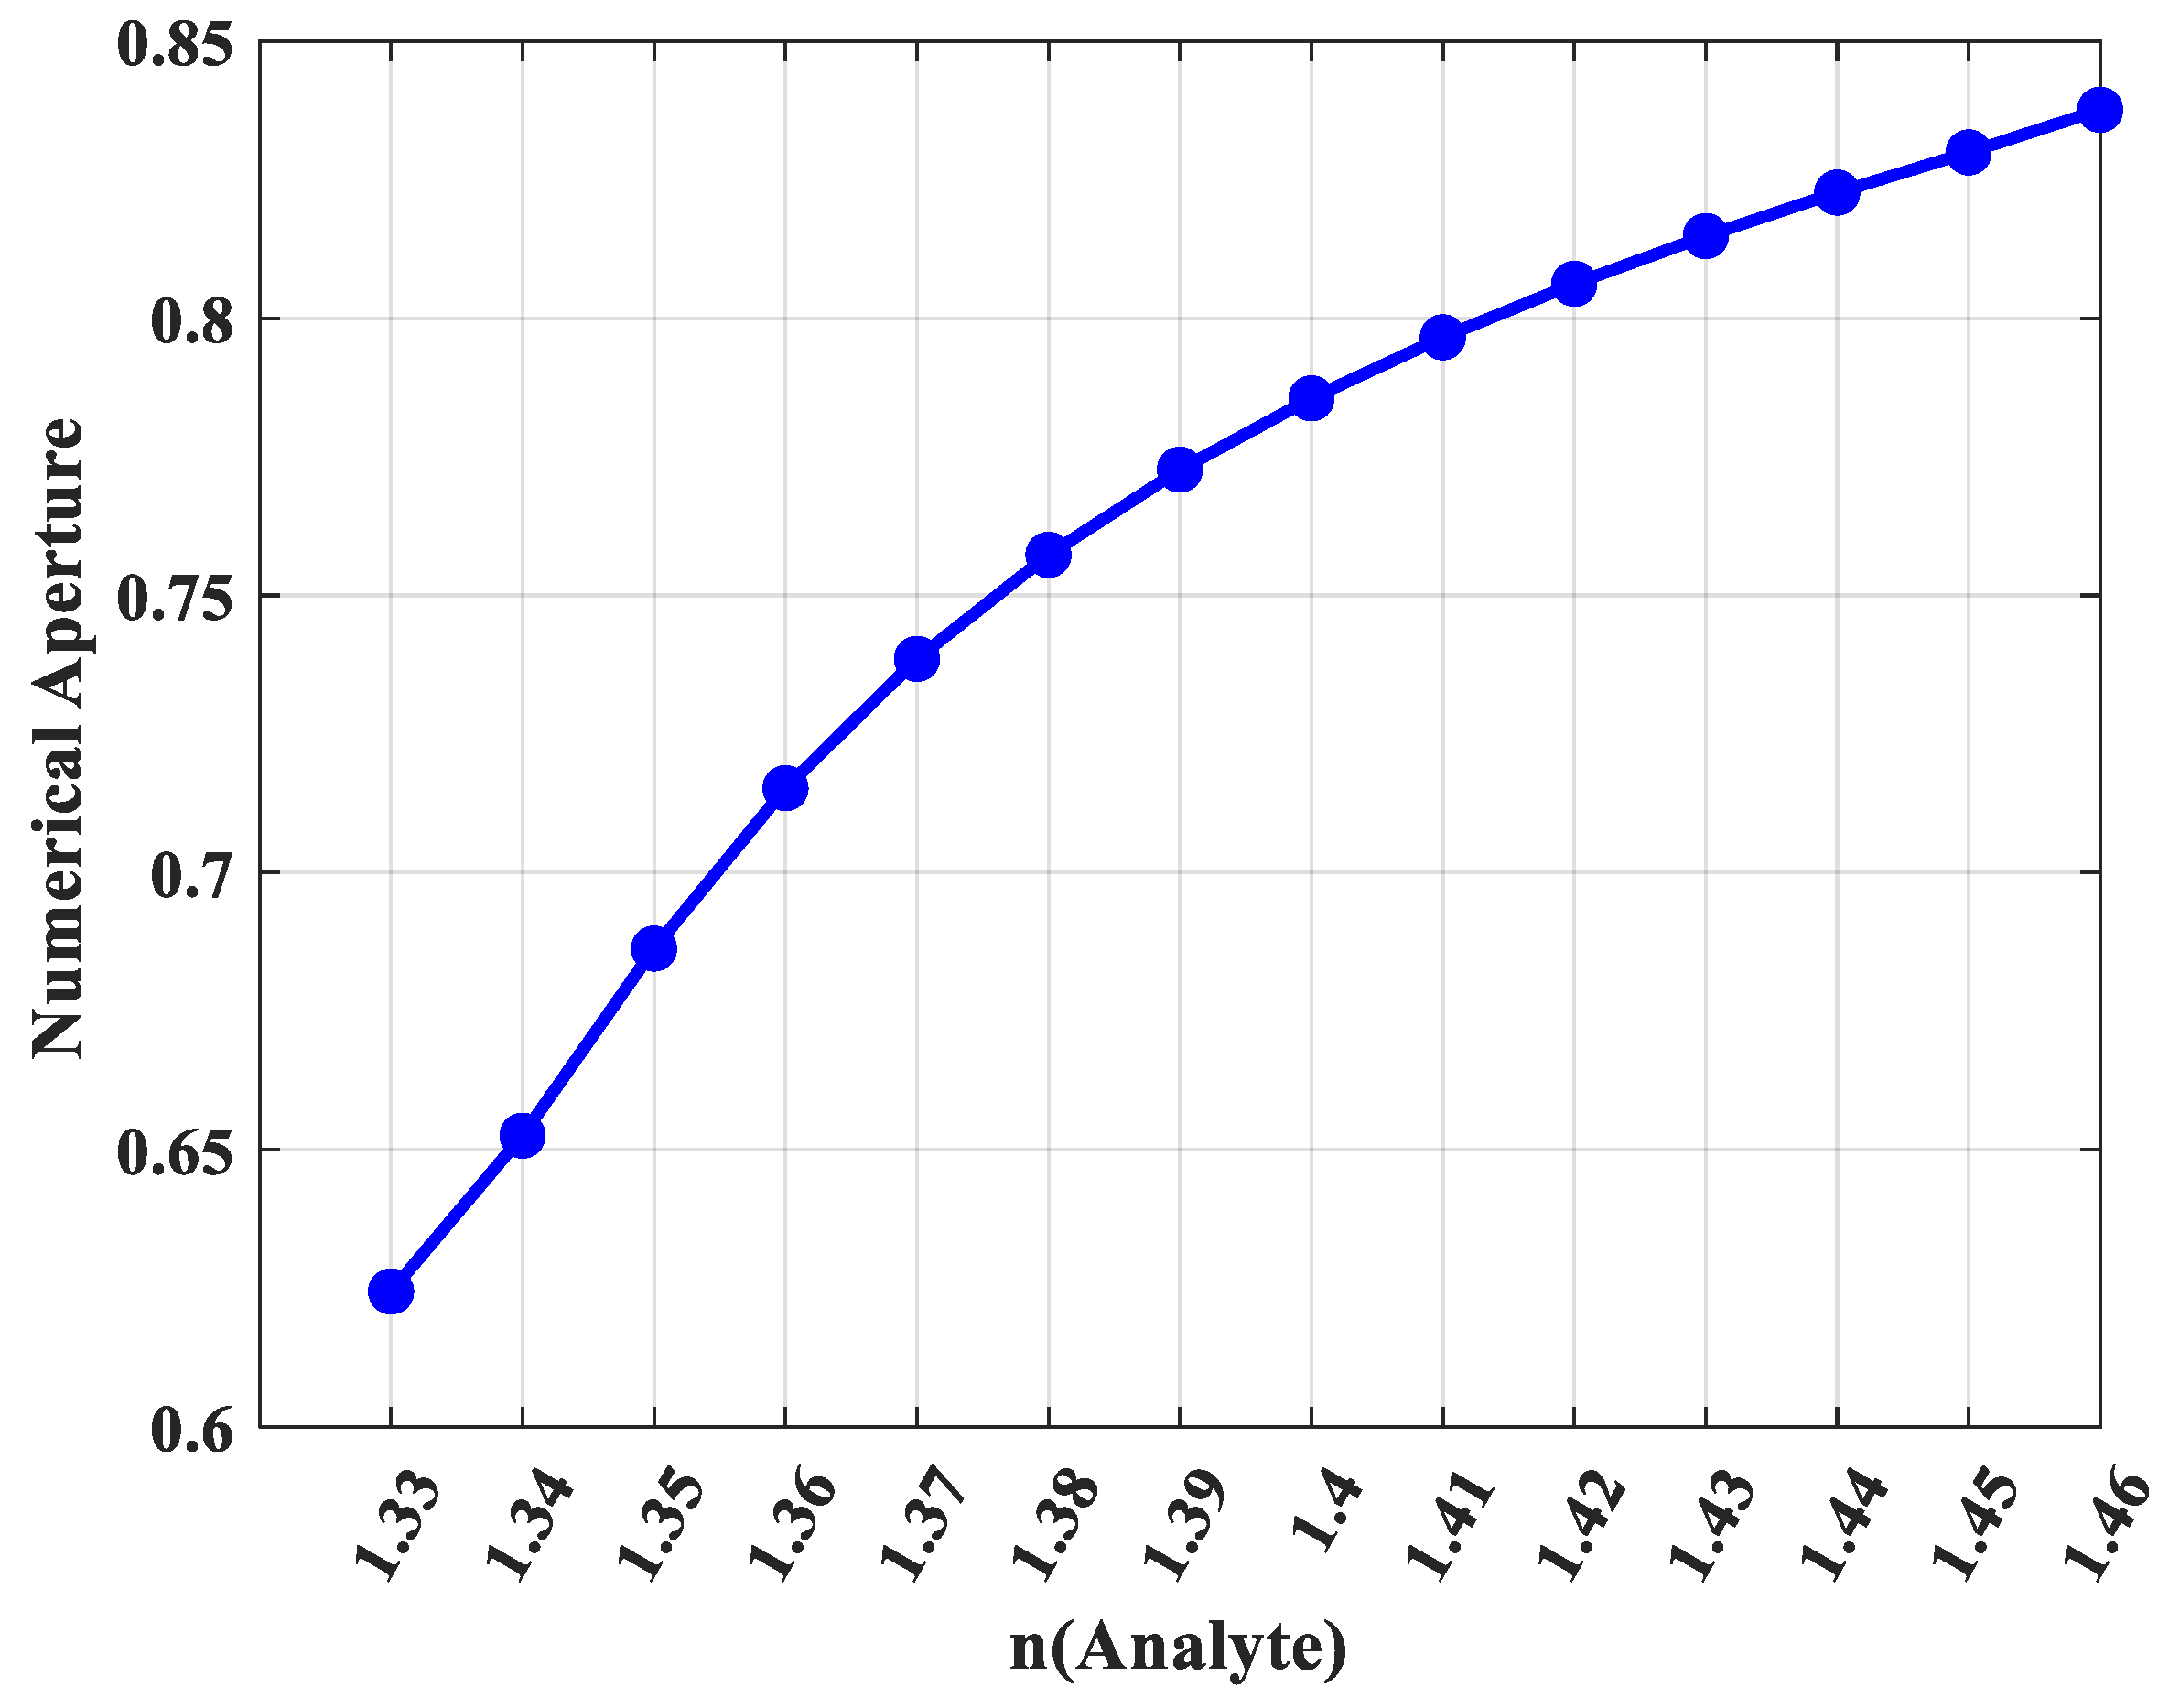
Conversely, the numerical aperture, a measure of the fiber’s light-gathering capability, shows a strong positive correlation with the analyte’s refractive index (
Figure 12). The NA increases from 0.62 for n = 1.33 to a high value of 0.84 for n = 1.46. This is a practically significant result, as a higher NA implies a wider acceptance angle, which simplifies the process of coupling light from a THz source into the fiber. This makes the sensor more robust and tolerant to alignment variations in a real-world experimental setup, proving advantageous for efficient light coupling in practical applications. The consistent and predictable behavior of all performance metrics across this broad refractive index range firmly establishes the proposed PCF design as a versatile, reliable, and high-performance platform for a wide spectrum of THz sensing applications.
In a practical scenario, different pollutants or varying concentrations will create a mixture with a unique, effective bulk refractive index. Our results demonstrate that the sensor is highly selective to these subtle changes. For instance, as shown in
Figure 8, a small RI change from 1.39 to 1.40 results in a clear change in sensitivity. More dramatically,
Figure 10 reveals that this same 0.01 RIU change induces a nearly order-of-magnitude shift in
CL (from 1.9 × 10
−11 dB/m to 1.4 × 10
−11 dB/m). This high-resolution response, where small RI changes yield large, measurable changes in output parameters (especially CL), confirms the sensor’s capability to differentiate between various mixtures or concentrations, thus evaluating its feasibility for practical applications. To contextualize the performance of the proposed sensor and underscore its advancements, a comparative analysis against recently published, state-of-the-art terahertz PCF sensors is presented in
Table 2. The selected works represent some of the highest performing sensors in the literature for various chemical and biological sensing applications. The comparison is based on key figures of merit, including maximum relative sensitivity and minimum confinement loss.
As the data in the table clearly indicates, the sensor proposed in this work stands at the forefront of current technology. With a relative sensitivity of 99.6%, it is among the highest reported values, demonstrating a near-perfect interaction between the guided mode and the analyte. Furthermore, its CL of 1.40 × 10⁻¹¹ dB/m is exceptionally low, ensuring high signal integrity for practical applications.
5. Fabrication Tolerance Analysis
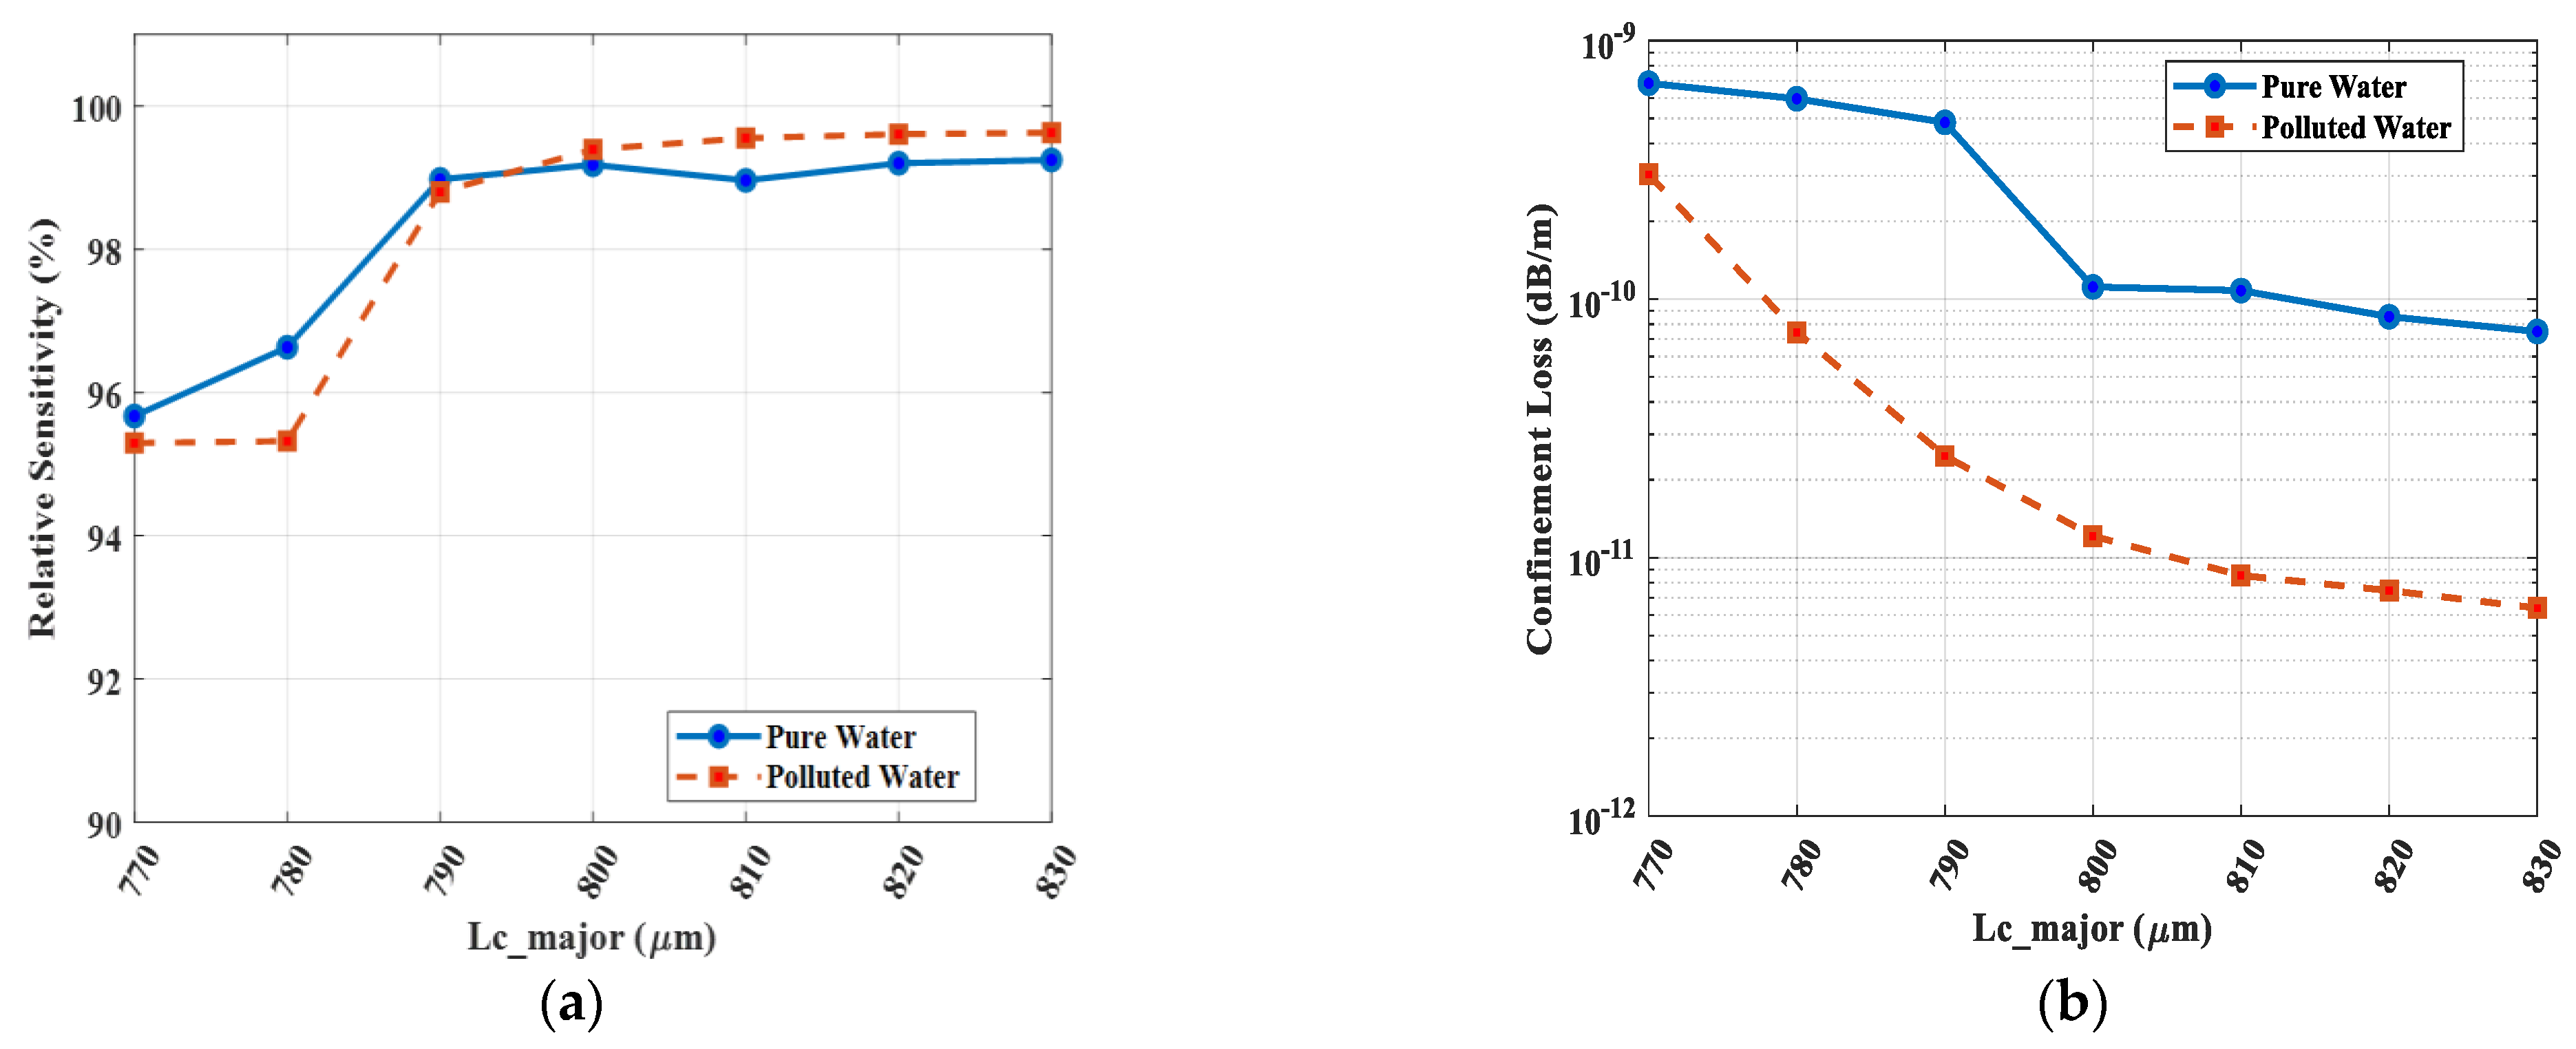
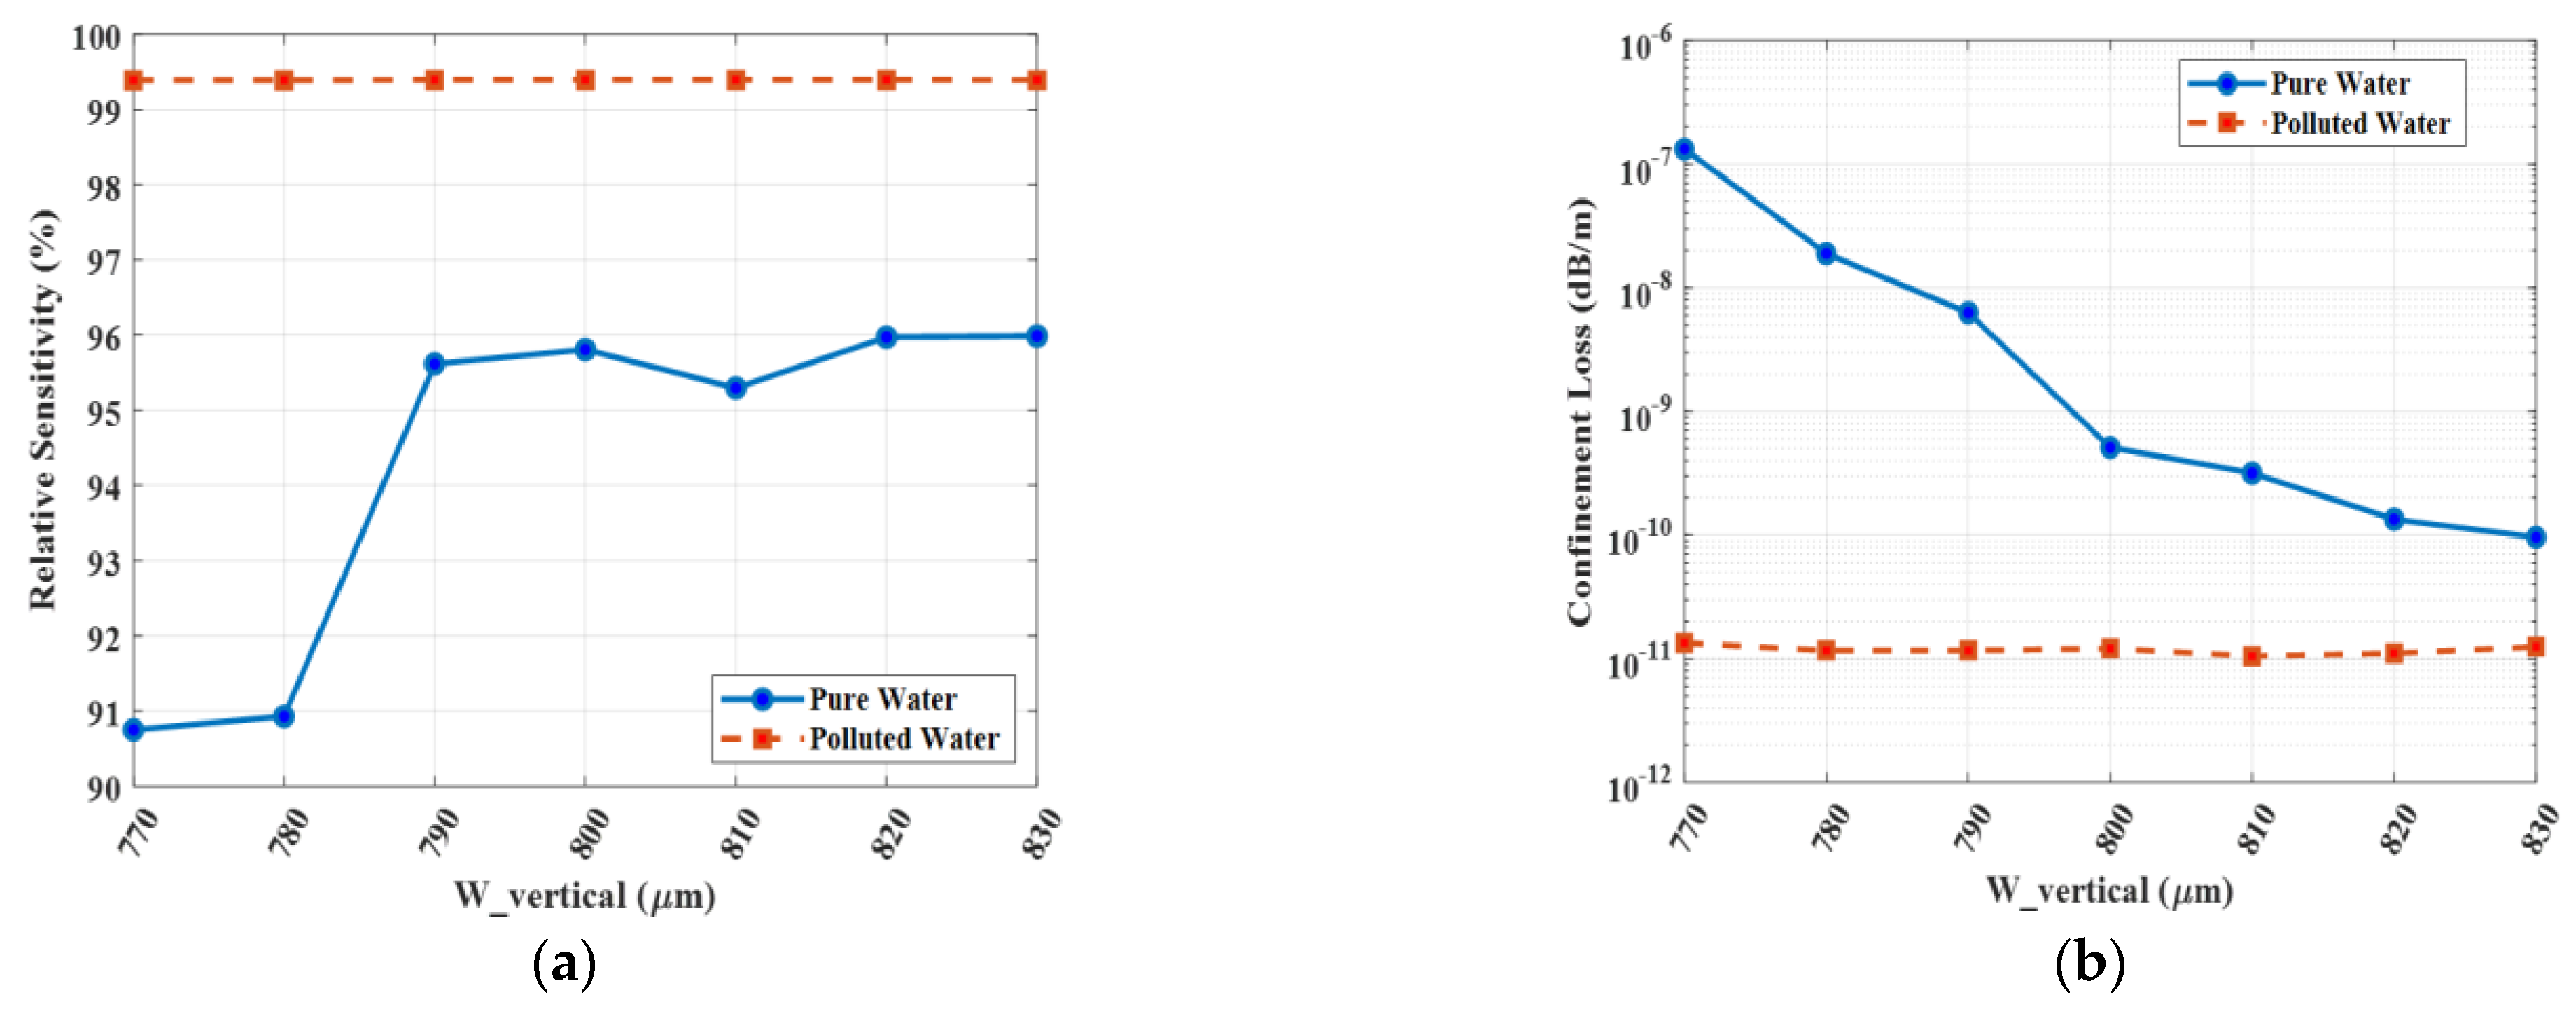
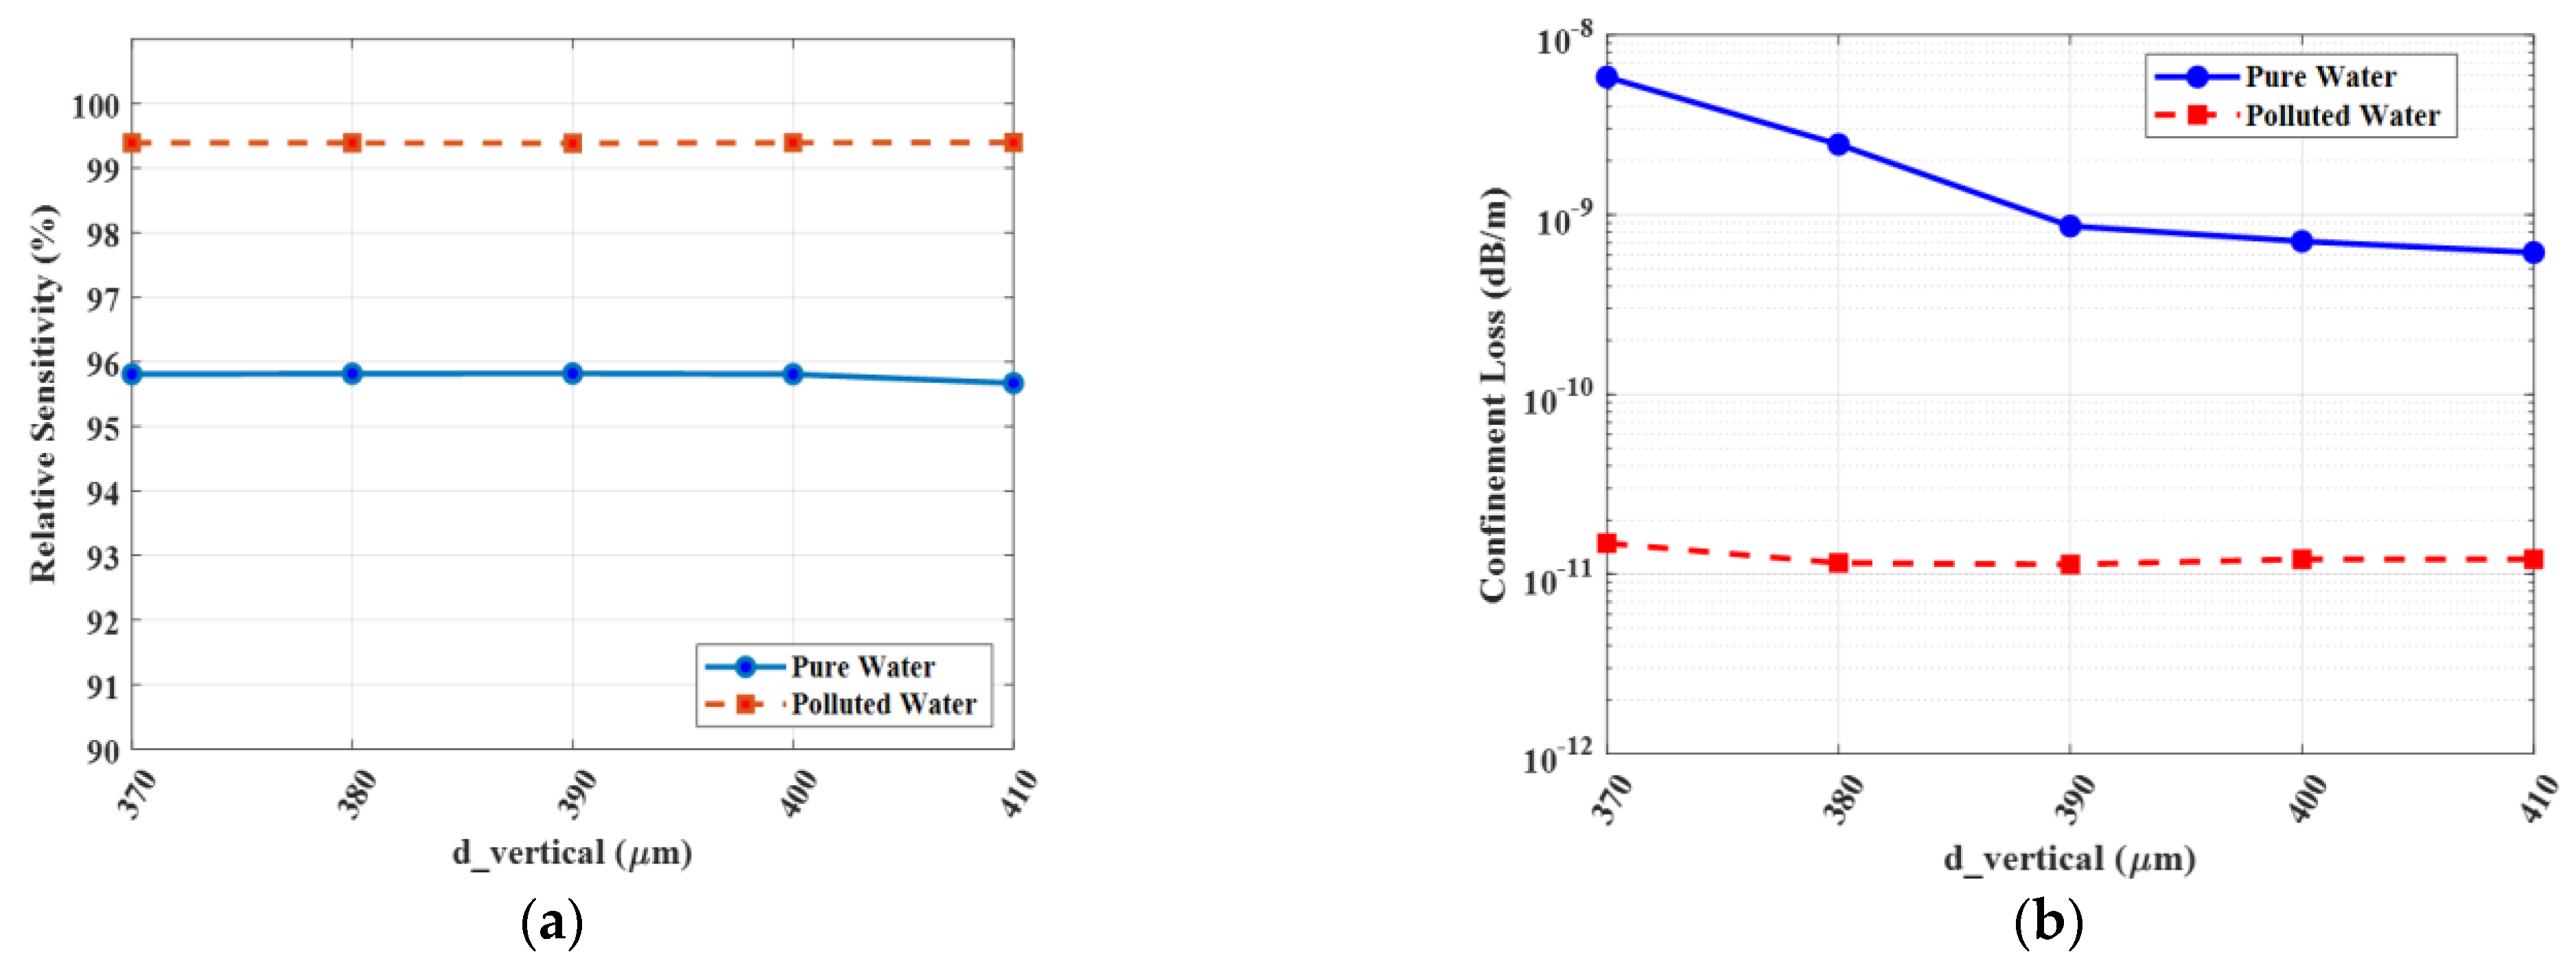
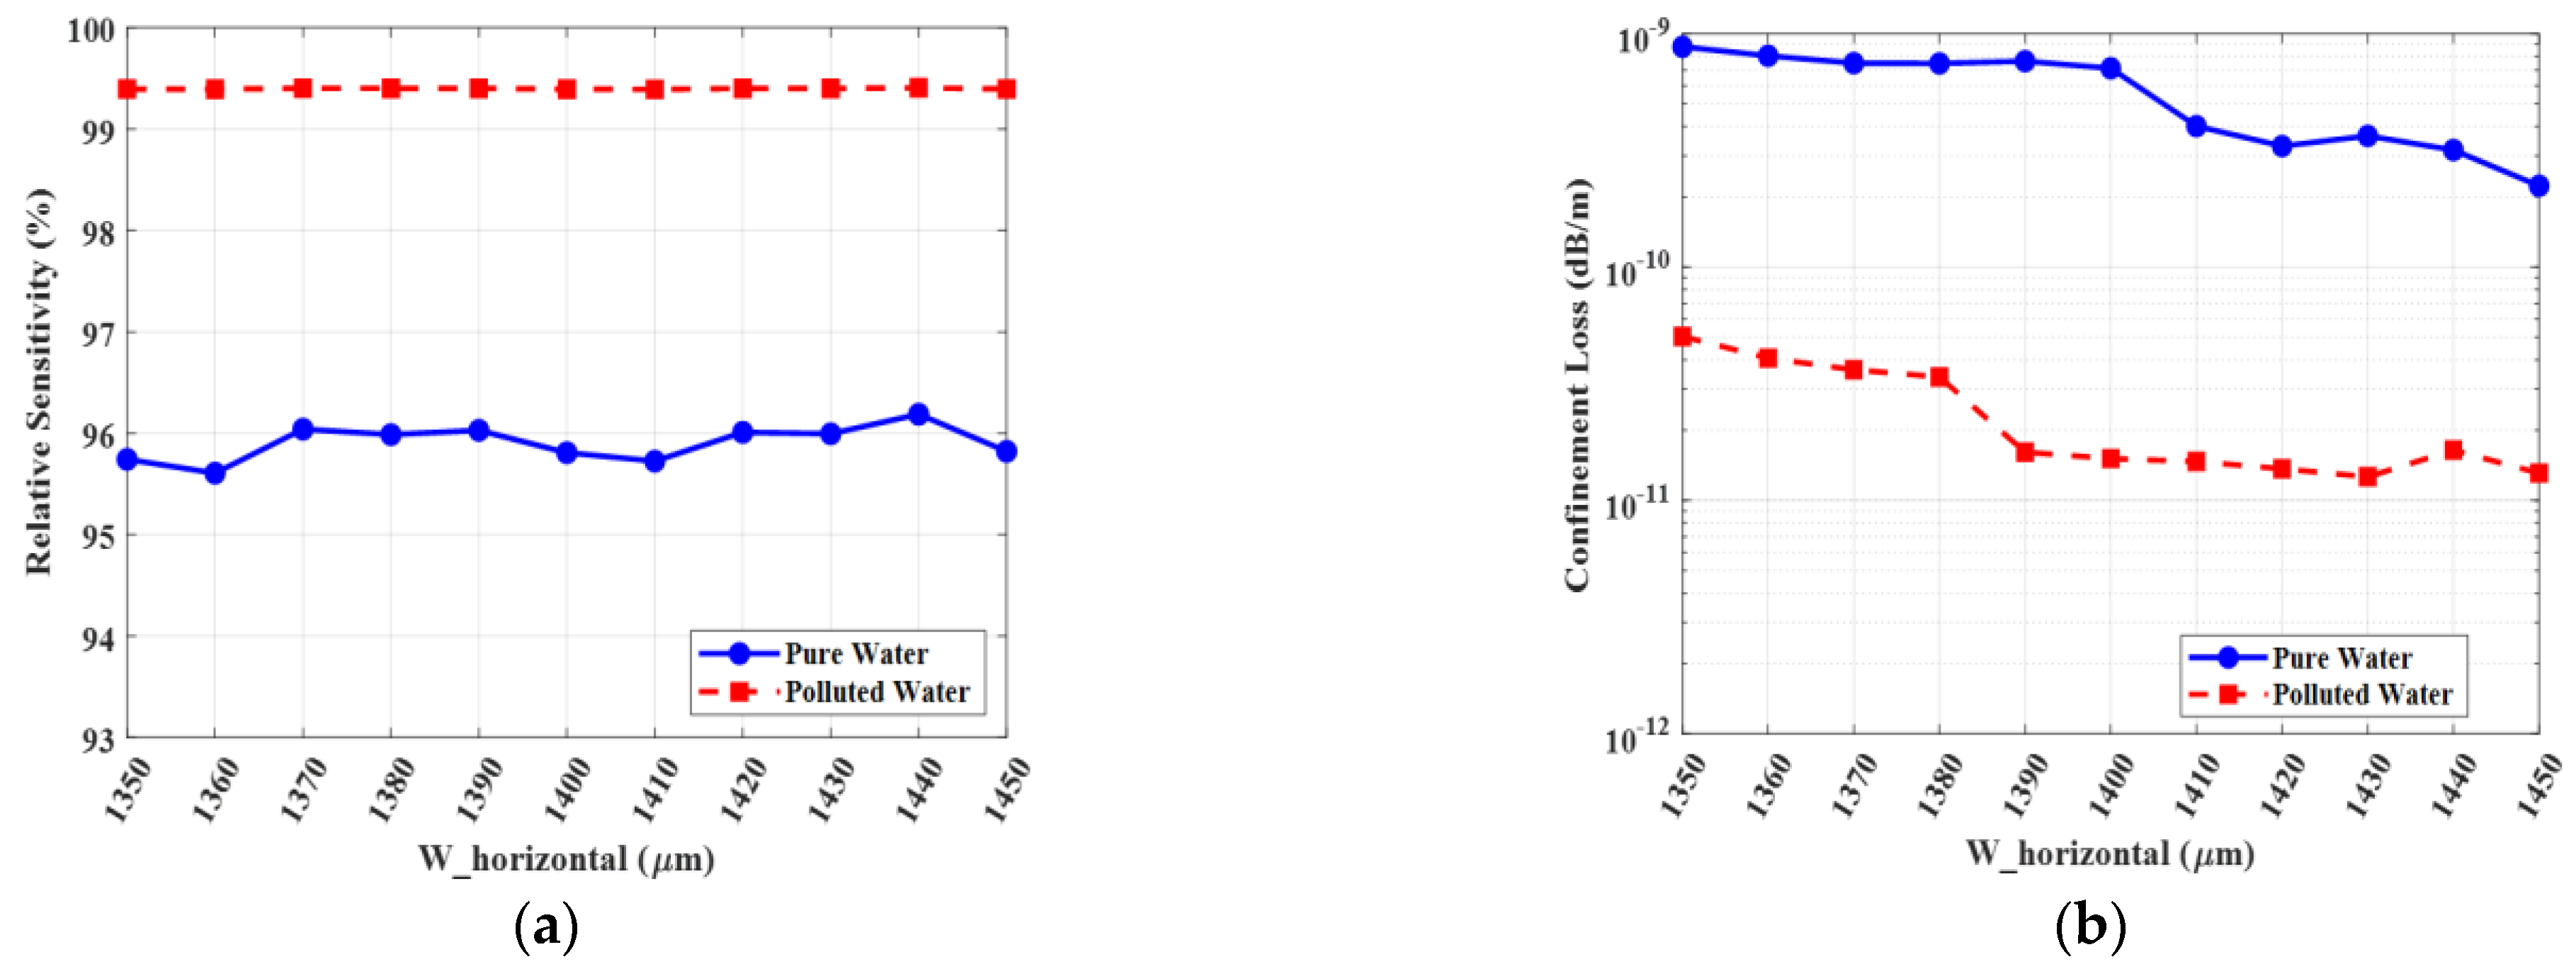
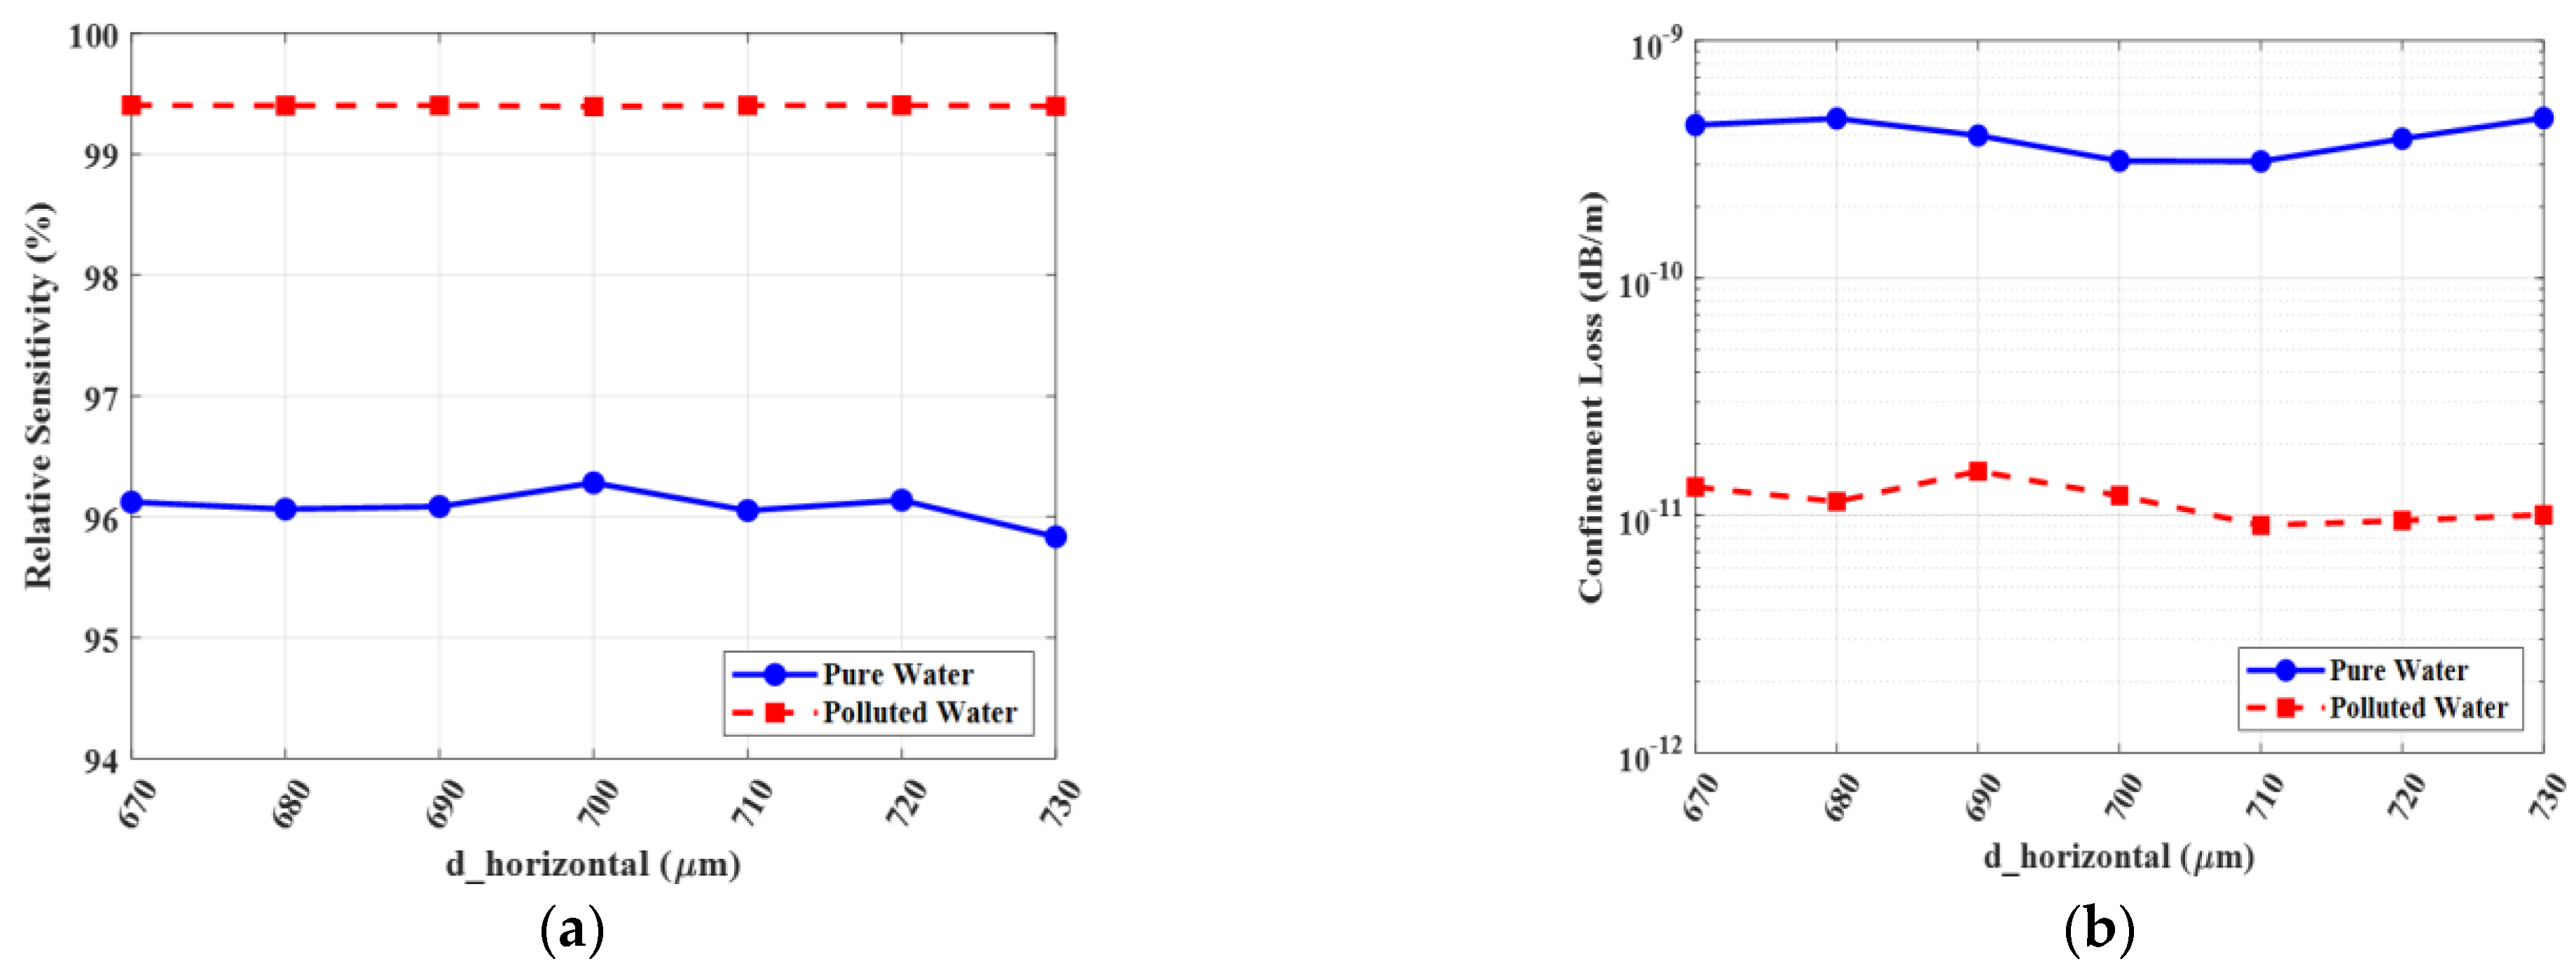
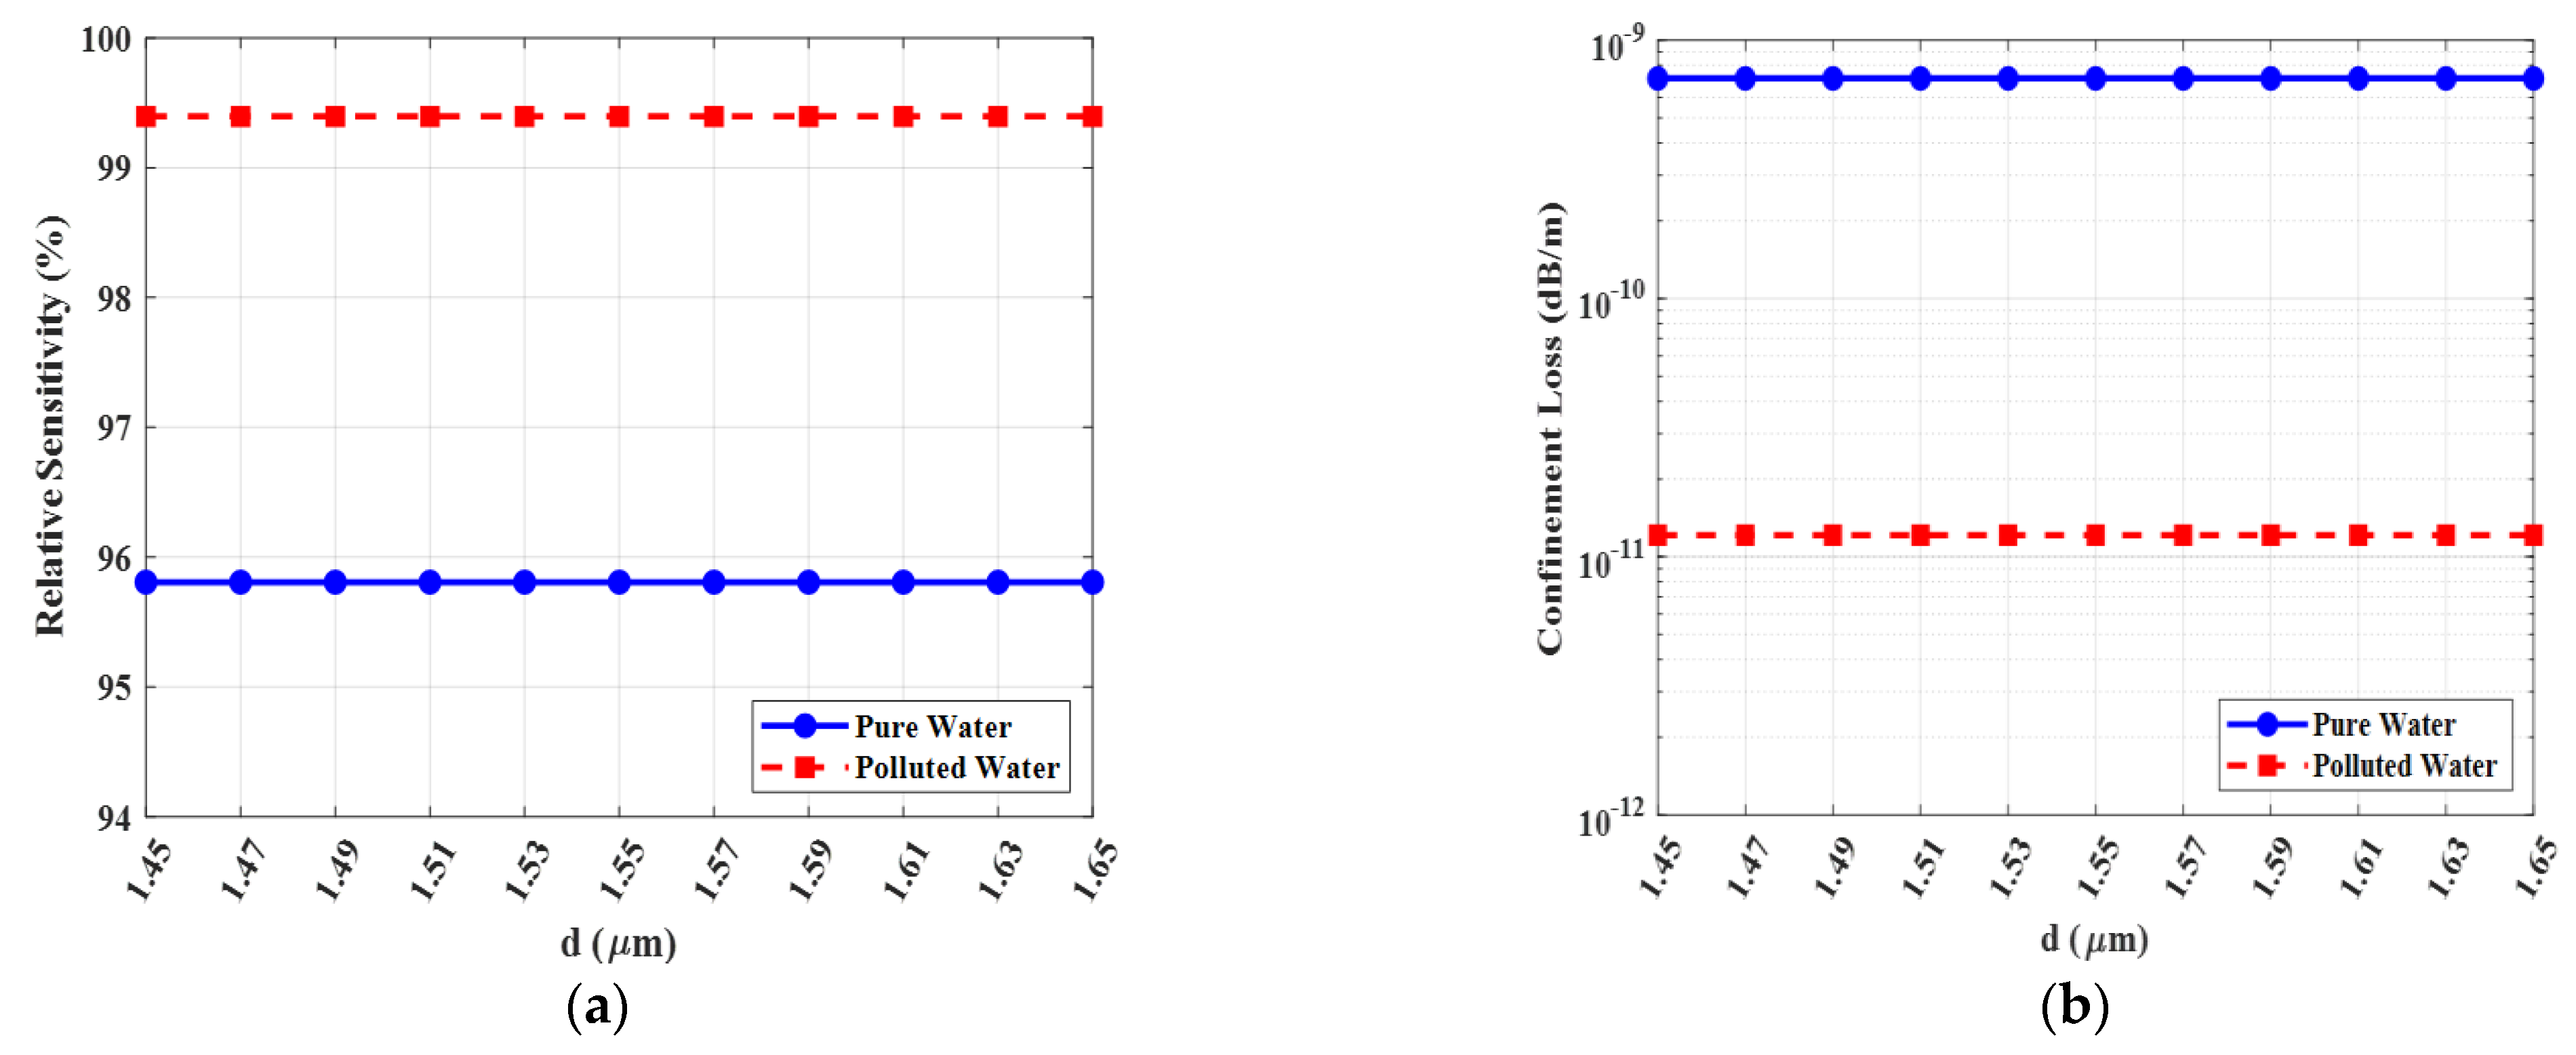
To thoroughly assess the practical feasibility and manufacturing robustness of the proposed sensor, a comprehensive fabrication tolerance analysis was conducted. In any practical fabrication process, minor dimensional deviations from the optimized design parameters are inevitable. Consequently, we systematically investigated the sensor’s performance sensitivity to these potential imperfections. The analysis was performed by varying seven key structural parameters by ±1% and ±2% from their optimal values, while all other parameters were held constant. Subsequently, the sensor’s relative sensitivity and confinement loss were simulated for both the polluted water analyte (n = 1.41) and the pure water analyte (n = 1.33) across the operational frequency spectrum (3 THz). The results of this comprehensive investigation are presented in
Figure 13,
Figure 14,
Figure 15,
Figure 16,
Figure 17,
Figure 18 and
Figure 19.
A detailed examination of
Figure 13,
Figure 14,
Figure 15,
Figure 16,
Figure 17,
Figure 18 and
Figure 19 reveals the exceptional structural integrity of the proposed design. For both pure and polluted analytes, the performance curves corresponding to the ±1% and ±2% deviations are shown to be tightly clustered around their respective optimal design curves. This demonstrates that the sensor’s high-performance characteristics are not a critical function of achieving perfect, idealized dimensions, but rather an intrinsic property of the chosen topology.
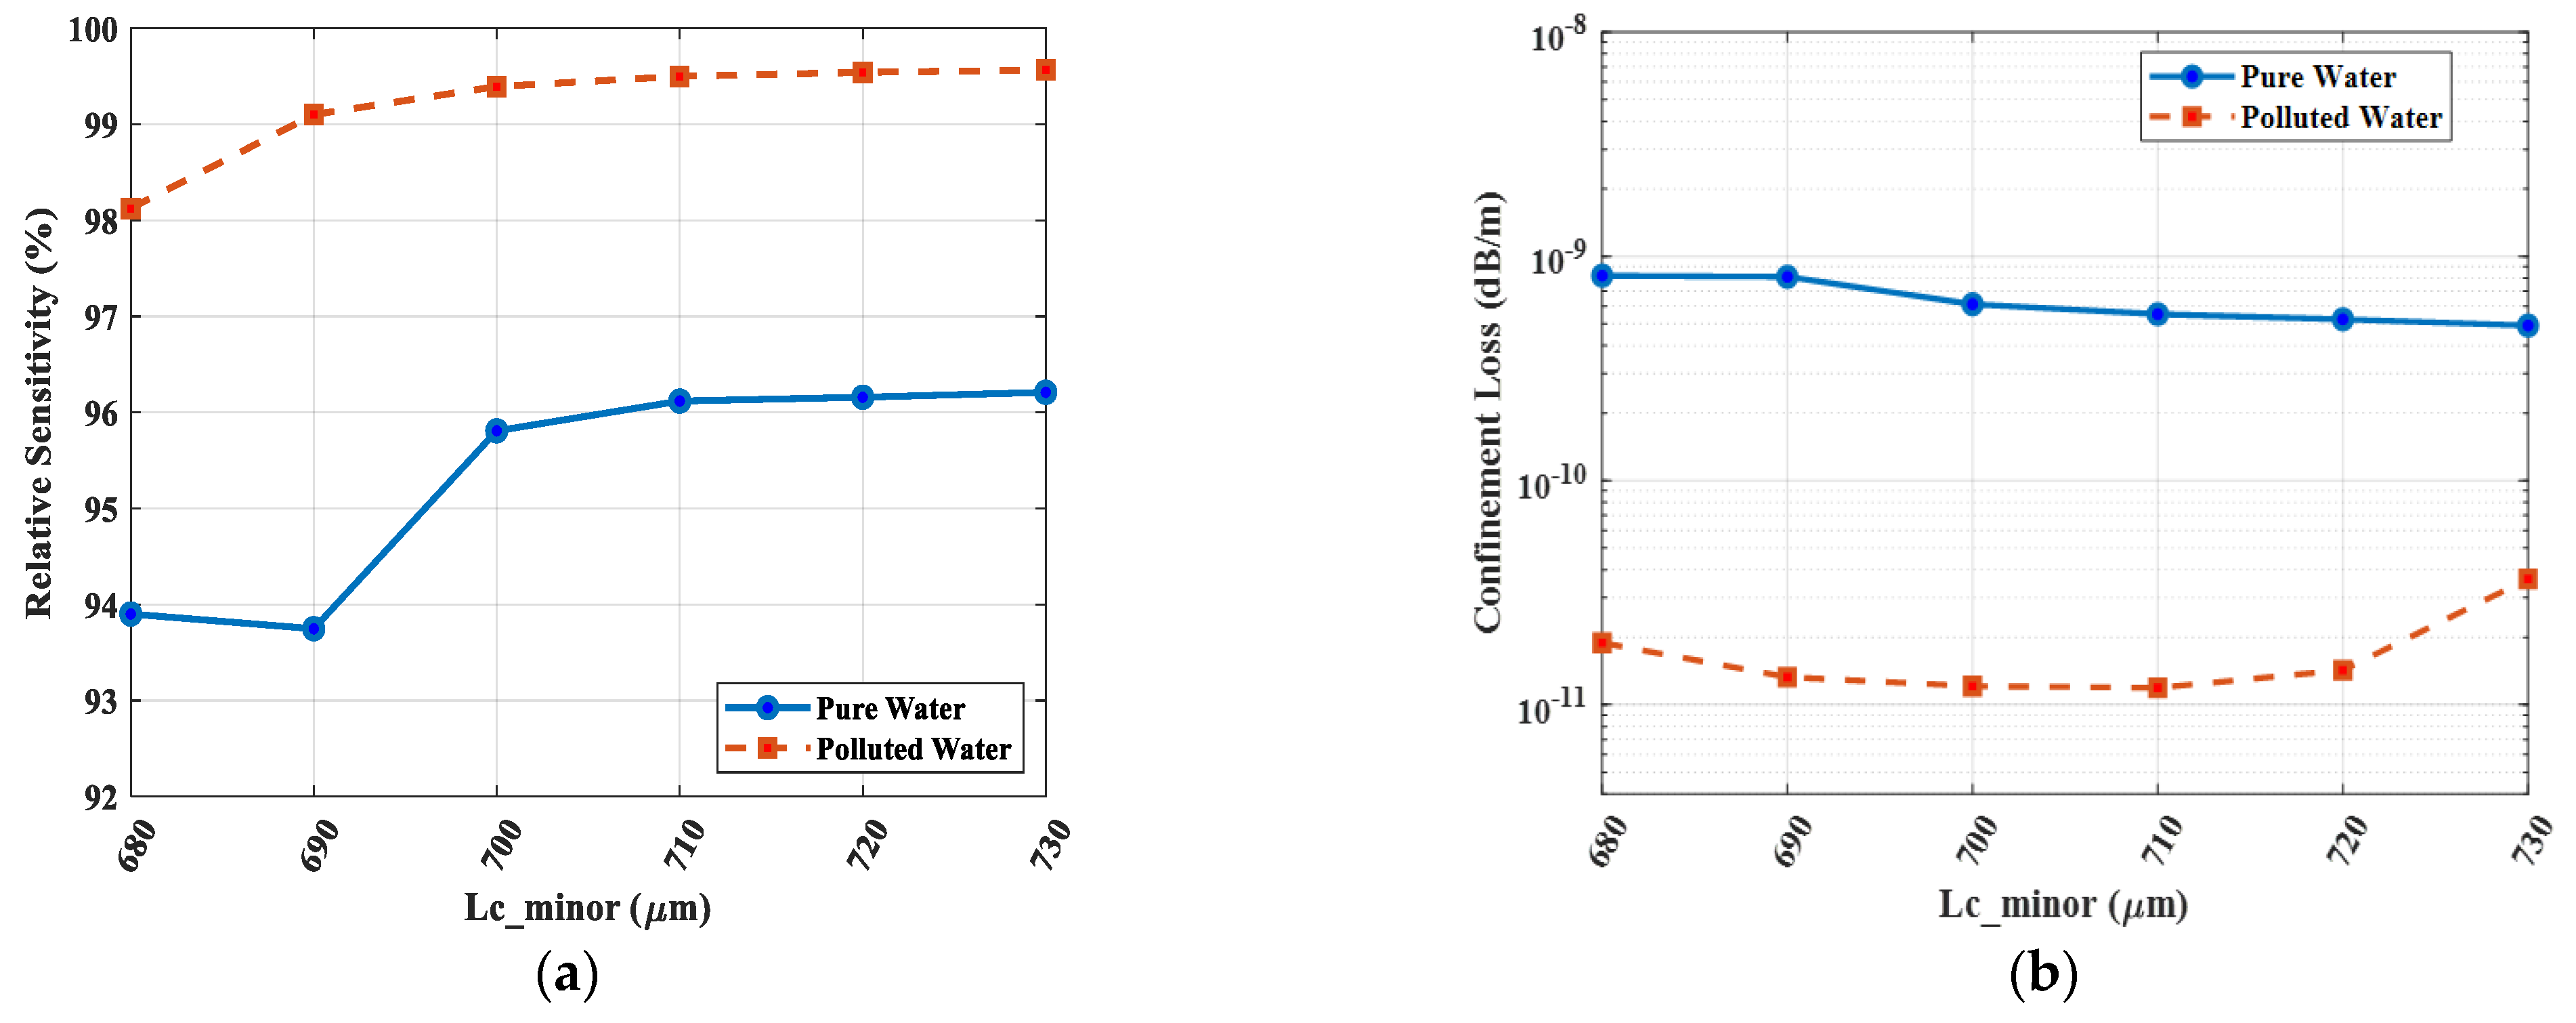
The core dimensions (
800 µm and
µm) were determined through an iterative optimization process to achieve a maximized core power fraction, which simultaneously yields the highest relative sensitivity and the lowest confinement loss.
Figure 13 and
Figure 14 now validate the stability of this optimum choice.
As depicted in
Figure 13a and
Figure 14a for the polluted water analyte (n = 1.41), the relative sensitivity curves for ±1% and ±2% variations are tightly clustered around the optimal 99.6% value at 3 THz. For instance, a ±2% change in the core minor axis (
) results in a sensitivity fluctuation of less than 0.03%, a negligible deviation. More importantly,
Figure 13b and
Figure 14b demonstrate that while confinement loss is highly sensitive to the core geometry, the optimal 800 × 700 µm configuration operates at a distinct minimum (1.4 × 10
−11 dB/m). Any deviation from these optimal dimensions, even by 1–2%, causes the loss to increase.
A focused analysis of the inner cladding’s hybrid structures provides critical insight into the sensor’s optimization. The vertical structures, defined by
= 800 µm and
= 400 µm, serve a dual purpose: they shape the modal field vertically while maintaining a precise distance from the core. The tolerance analysis in
Figure 15 and
Figure 16 confirms the stability of this choice. As shown, these parameters operate in a stable, low-loss region for both pure (n = 1.33) and polluted (n = 1.41) analytes. Any deviation, such as a decrease in these widths, would bring the low-index air holes closer to the core, which could disrupt the mode field and compromise modal confinement, leading to higher losses. The tight clustering of the performance curves confirms that the optimal values are robust against manufacturing variations.
Similarly, the horizontal structures, defined by
= 1400 µm and
= 700 µm, are optimized to provide a wide barrier that prevents lateral mode leakage.
Figure 17 and
Figure 18 validate this optimization, demonstrating that these values are centered in a stable region of minimized confinement loss. A decrease in
, for example, would thin this barrier, creating a potential leakage path and increasing loss. Conversely, a significant increase would alter the mode shape and reduce the effectiveness of the inner barrier. Thus, the selected values are confirmed as the optimal choice, maintaining a stable, low-loss performance even when subjected to manufacturing tolerances.
Figure 19 presents the tolerance analysis for the ellipticity of the outer cladding holes, defined by the aspect ratio
. The results are highly significant as they demonstrate an exceptional level of structural robustness. As shown in
Figure 19a, the relative sensitivity for both pure (n = 1.33) and polluted (n = 1.41) analytes remains perfectly constant across the entire simulated range of
(1.45 to 1.65). Similarly,
Figure 19b reveals that the confinement loss is also remarkably insensitive to this parameter, maintaining a stable, ultra-low value (e.g.,
dB/m for polluted water) across the same range. This analysis confirms that the sensor’s performance is not dependent on a critically precise ellipticity. Our chosen optimal value of
(310 µm/200 µm) is therefore validated not as a narrow optimum, but as a robust setpoint located in the center of a wide, high-performance operational plateau. This insensitivity is a significant practical advantage, as it relaxes the manufacturing tolerances required for the outer cladding, further strengthening the sensor’s feasibility.

