Article

Watt-Level Tunable Mid-Infrared Laser Emission at 2.8 μm Generated by Stimulated Raman Scattering of Methane Molecules in Hollow-Core Fibers

1
College of Advanced Interdisciplinary Studies, National University of Defense Technology, Changsha 410073, China
2
Nanhu Laser Laboratory, National University of Defense Technology, Changsha 410073, China
*
Authors to whom correspondence should be addressed.
Photonics 2025, 12(11), 1137; https://doi.org/10.3390/photonics12111137
Submission received: 9 September 2025 / Revised: 4 November 2025 / Accepted: 14 November 2025 / Published: 18 November 2025

Abstract

Fiber lasers operating at 2.8 μm have important applications in fields such as polymer material processing and medical surgery. Fiber gas lasers (FGLs) based on stimulated Raman scattering (SRS) in hollow-core fibers (HCFs) provide a superior approach to generating tunable, high-power laser at 2.8 μm. Here, we demonstrated a watt-level mid-infrared FGL with a tuning range from 2812 nm to 2862 nm by the SRS of methane molecules in a 26.7 m long HCF. By pumping with a tunable pulsed fiber amplifier at 1.5 μm, an average output power of approximately 1 W was obtained, with a low Raman threshold peak power of 1.7 kW. Additionally, we observed transverse mode instability (TMI) in the HCFs, which has rarely been reported previously, and propose that the TMI was caused by the thermal effect generated when methane molecules absorbed the pump laser. This work achieved both the wavelength flexibility and watt-level power of FGLs based on methane-filled HCFs in the 2.8 μm waveband. It also found that the TMI was a key factor limiting further improvement in output power. This work provides important experimental basis and optimization directions for the future realization of higher-power tunable fiber lasers in the 2.8 μm waveband.

1. Introduction

Mid-infrared (mid-IR) lasers represent one of the research hotspots and have important applications in the fields of defense, medical surgery, atmosphere monitoring, and remote sensing [1,2]. Mid-IR lasers can be achieved through various technologies, including gas lasers, solid-state lasers, quantum cascade lasers, and fiber lasers. Among these, fiber lasers offer distinct advantages, such as high beam quality, compact structure, and excellent thermal management [1]. As silicate-based fibers exhibit high absorption beyond 2.2 μm, mid-IR fiber lasers are typically realized using fluoride and chalcogenide soft glass fibers [3]. Fluoride glass fiber lasers achieved a power output of 1.7 W at 3.92 μm [4], which represents the current longest output wavelength and highest power level of fluoride glass fiber lasers. Chalcogenide glass demonstrates greater advantages in wavelength extension due to its lower phonon energy. At present, praseodymium-ion-doped chalcogenide glass fiber lasers have realized mid-IR laser output at 5.83 μm at room temperature, but the maximum output power at this wavelength is only 17 mW [5]. However, the problems of poor chemical stability and low damage threshold of soft glass fibers cannot be ignored, especially in the aspect of high-power mid-IR lasers.
Gas lasers have been proven to be an effective approach to achieving mid-IR laser emission. However, constrained by traditional gas cells, the laser–gas interaction length is considerably short, which places extremely high demands on the output power of the pump source [6]. Since the first report of stimulated Raman scattering (SRS) in hydrogen-filled hollow-core fibers (HCFs) in 2002 [7], a new type of lasers named fiber gas lasers has come into people’s view. HCFs can effectively confine and propagate laser within a micron-scale core region, providing an excellent platform for laser–gas interactions, thereby significantly increasing the laser–gas interaction length. Through reasonable design of cladding microstructure, silicate-based HCFs support mid-IR transmission based on the principle of anti-resonant reflection [8], which has considerably advanced the development of mid-IR fiber gas lasers. At present, the working principles of fiber gas lasers are based on population inversion and SRS [6]. A significant advantage of fiber gas Raman lasers lies in their unprecedented wavelength tunability, achieved through pump wavelength modulation in the SRS process. So far, hydrogen molecules [9], methane molecules [10], and deuterium molecules [11] have been filled into the HCFs to achieve mid-IR laser output. The 2.8 μm mid-IR laser has attracted extensive attention due to its significant application value derived from unique spectral characteristics. This wavelength lies at the strong absorption peak of water molecules, and since biological tissues are rich in water, the 2.8 μm laser can be efficiently absorbed by biological tissues, making it suitable for medical surgery [12]. In addition, atmospheric components such as carbon dioxide and nitrogen dioxide exhibit strong absorption lines at 2.8 μm, endowing this laser band with application potential in remote sensing [1] and communication fields [13]. Since the Raman shift coefficient of methane molecules is 2917 cm−1, a 2.8 μm laser output can be achieved by using a pump source with a wavelength of 1.5 μm or a 1 μm pump source can be used to achieve a 2.8 μm laser output by cascaded pumping. In 2018, a 2.8 μm cascade Raman laser with average power of 113 mW was demonstrated in a 3 m HCF filled with 1.8 MPa methane molecules. The pump source was a diode-pumped Nd:YAG laser at 1.064 μm, and the quantum efficiency from the pump laser to the second-order Raman laser was 40% [10]. In the same year, a cascade Raman laser source operating at 2.8 μm by two stages of methane-filled HCFs pumped by a commercial 1.064 μm laser was reported [14]. The total quantum efficiency from 1.064 μm to 2.809 μm was 65%. In 2019, a tunable mid-IR fiber gas Raman laser in a methane-filled HCF pumped by a modulated and amplified tunable distributed feedback (DFB) laser was demonstrated [15]. The tunable wavelength range was 2796 to 2863 nm. However, the output power was only a few tens of milliwatts, limited by the peak power of the pump source. In the next year, the average power of the 2.8 μm fiber gas Raman laser increased to 0.56 W by using a 2 ns pulsed Er3+-doped fiber laser as a pump source [16]. In 2022, Zhang et al. demonstrated cascaded Raman laser output at 2807 nm with an average power of 4 W by pumping a 1.2 m long methane-filled HCF using a commercial 1064 nm pulsed laser [17]. In 2025, a second-order Raman laser operating at a central wavelength of 2807 nm with a maximum average power of 10.3 W was reported, which was achieved by pumping a 3.2 m long HCF filled with methane molecules using a solid-state pulsed laser operating at 1064 nm [18]. The research progress on fiber methane Raman lasers operating in the 2.8 μm band is summarized in Table 1. It can be observed that such lasers have not yet simultaneously achieved high-power output and wavelength tunability.
Here, we reported a tunable fiber gas Raman laser that delivered an average power of approximately 1 W from a methane-filled HCF, pumped with customized EDFAs seeded by a modulated DFB laser. A tunable wavelength range of 2812 nm to 2862 nm was achieved by adjusting the wavelength of the DFB laser from 1545 nm to 1560 nm. The use of a long HCF with a length of 26.7 m greatly reduced the Raman threshold to 1.7 kW. Detailed measurement and analysis were conducted on the characteristics of the fiber methane Raman laser, including its output spectra, output power, and Raman threshold. This work successfully increased the average power of the 2.8 μm tunable fiber methane Raman laser to the watt level, which is tens of times higher than the power reported in previous works. Furthermore, we observed the emergence of transverse mode instability (TMI) during the transmission of a 1.5 μm pump laser in the HCF. which limited any further power scaling of the fiber methane Raman laser. Like TMI in solid-core fibers [19,20], which limits power scaling and degrades beam quality, TMI in HCFs not only restricts any further power scaling of the fiber methane Raman laser but also makes it difficult to maintain a good fundamental-mode beam profile.

2. Experimental Setup

The schematic of the fiber methane Raman laser is shown in Figure 1. The pump source consists of a tunable DFB diode laser (ID Photonics GmbH, Neubiberg, Germany, Cobrite, tunable range of 1537 nm to 1567 nm), an electro-optic modulator (EOM), and customized high-power erbium-doped fiber amplifiers (EDFAs). The EDFAs integrate three-stage amplifiers, with a tunable filter connected in series between the first- and second-stage amplifiers to suppress the amplified spontaneous emission (ASE) generated during the amplification process. The laser filtered by the tunable filter is sequentially amplified by the second- and third-stage amplifiers. The EDFAs are equipped with optical feedback protection. They will automatically cut off the power supply once weak reflected laser is detected. To avoid the interference of reflected laser on the normal operation of the EDFAs, we fusion-spliced their output pigtails (PLMA-25/300) with a fiber end cap coated with anti-reflective coating for the 1.5 μm band. The pump laser was coupled into the HCF through a lens system consisting of two planoconvex lenses coated with anti-reflection films, with a coupling efficiency of approximately 80%. The input end of the HCF is sealed in a gas cell (named gas cell I) by potting with silicone. The output end of the HCF is sealed in another gas cell (named gas cell II) through a rubber ring. Specifically, the input window is mounted on gas cell I and the output window on gas cell II, both inclined at an angle of 8 degrees so as to inhibit reflected light. The two gas cells are connected to pipelines, which are connected to a vacuum pump, a methane gas cylinder, and two pressure gauges for monitoring the pressure of the two gas cells. A vacuum pump is used to remove the gas from the HCF and gas cells. Then gas cell II is filled with methane gas, which gradually leaks into gas cell I, until the readings on the two pressure gauges are the same. The output laser from the HCF is collimated through a CaF2 lens and then separated by a dichroic mirror (DM; >99% reflectance at 1.5 μm and >99% transmittance at 2.8 μm). The mid-IR laser around 2.8 μm will pass through the DM, and the near-IR around 1.55 μm will be reflected. The separated two beams will be measured by detection equipment such as a power meter (Thorlabs, Newton, NJ, USA, S322C), a photodetector (Thorlabs, Newton, NJ, USA, APD410C), and an infrared camera (Xenics, Leuven, Belgium, XEVA-T2SL6890).
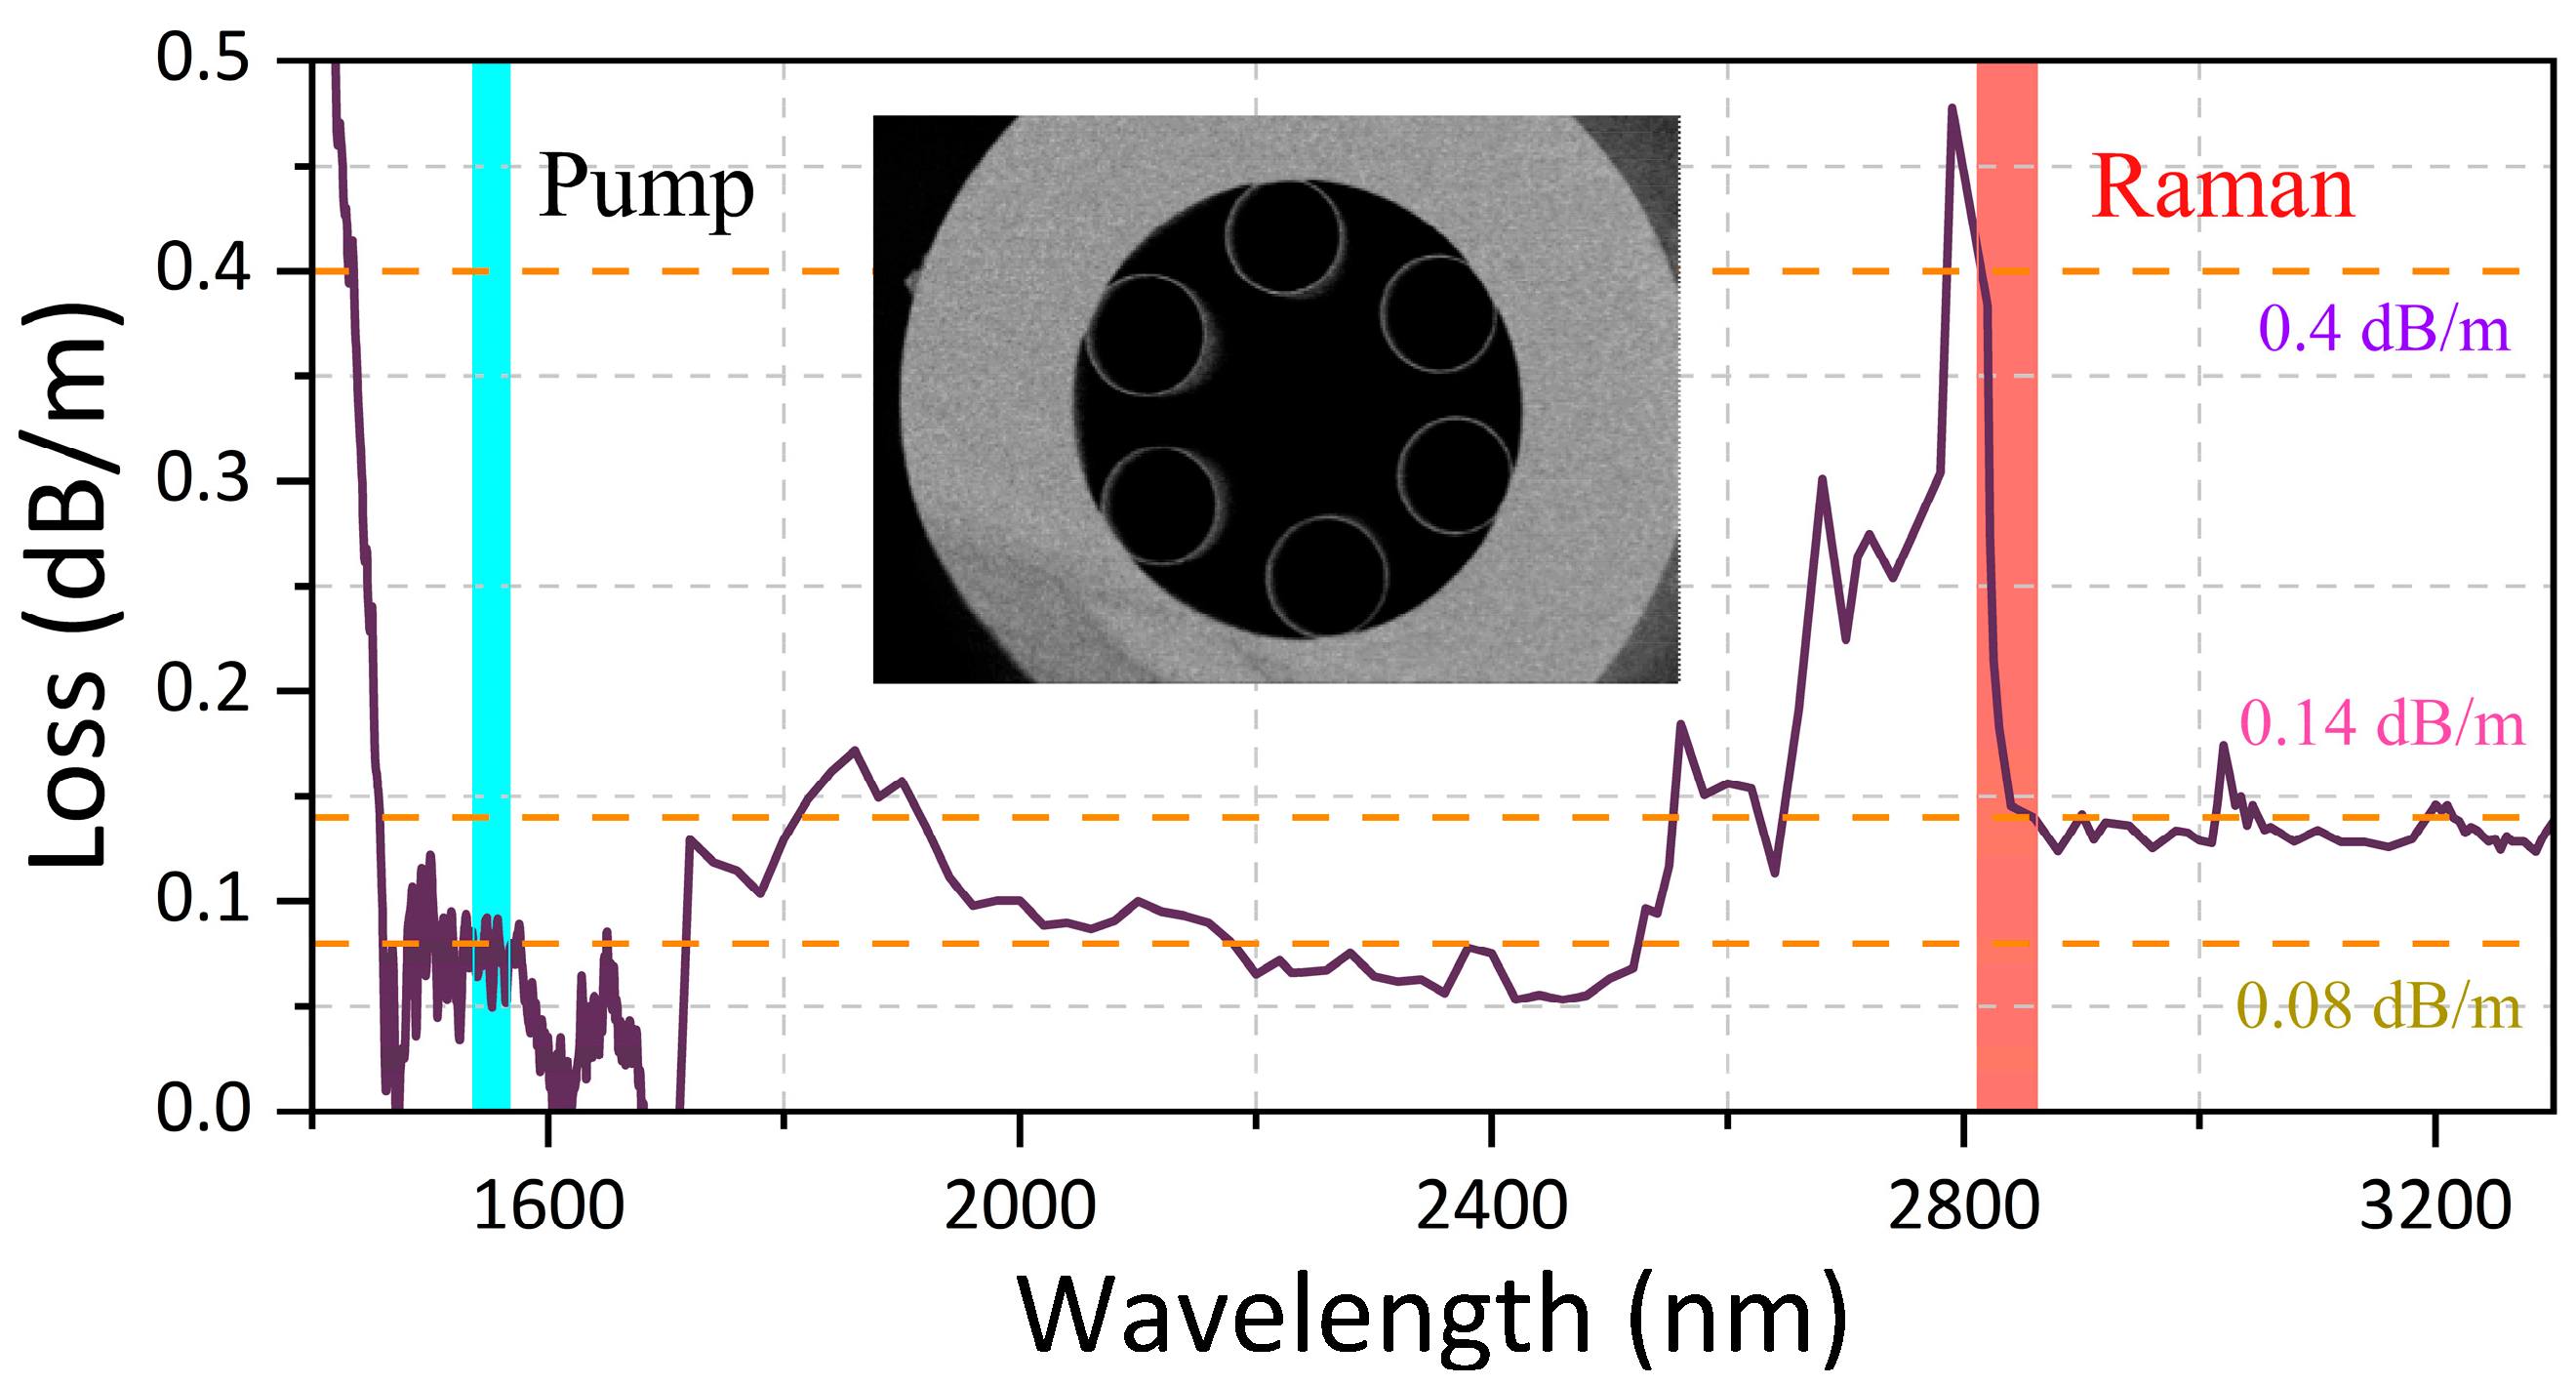
The HCF used in this work is a nodeless anti-resonant hollow-core fiber (AR-HCF) with broad transmission range in the mid-IR. The core diameter is around 70 μm, and the cladding diameter is around 250 μm. We measured the transmission loss spectrum of this HCF by means of the cut-back method, as shown in Figure 2. The inset in Figure 2 is the scanning electron micrograph (SEM) image of this HCF. From Figure 2, we can know that the fiber losses are ~0.08 dB/m at 1.5 μm, ~0.4 dB/m at 2.86 μm, and ~0.14 dB/m at 2.81 μm. The high loss at 2.79 μm is due to water absorption [21].
The threshold equation of SRS can be expressed as Equation (1) [22], where g represents the Raman gain coefficient, which can be derived from Equation (2) [23]; A e f f is the effective mode field area; α p and α s are the fiber losses at the pump and Stokes laser; L is the fiber length; and G is the net gain factor determined by measurement conditions. When the Stokes intensity I s reaches an observable level, the corresponding coupled pump laser power is defined as the Raman threshold, i.e., I s t h   =   I s 0 e G [24], where I s 0   =   Γ / 2 represents the spontaneous Stokes intensity and Γ denotes the full width at half maximum (FWHM) of the Raman linewidth.
P t h = A e f f g α p ( G + α s L ) 1 e x p ( α p L )
In Equation (2), λ s represents the Stokes wavelength, h ν s denotes the photon energy, and Δ N corresponds to the population difference between the initial and final states, which is proportional to the gas pressure. Δ v is the Raman gain profile width, which, for methane, can be expressed as = 8220 + 384p (MHz), where p is the gas pressure [25]. 𝜕 σ / 𝜕 Ω represents the Raman scattering differential cross-section.
g = 2 λ s 2 h ν s Δ N π Δ v 𝜕 σ 𝜕 Ω
According to Equation (1), in order to effectively reduce the threshold of SRS, the length of the HCF should be as great as possible. But an excessively long fiber can lead to increased loss. After consideration, the length of the HCF we selected was 26.7 m, much longer than the HCF in previous reports [10,14,16,17,18]. Further reduction in the Raman threshold can be achieved by utilizing a HCF with a lower loss and increased length.

3. Results and Discussion

3.1. Spectral Characteristics

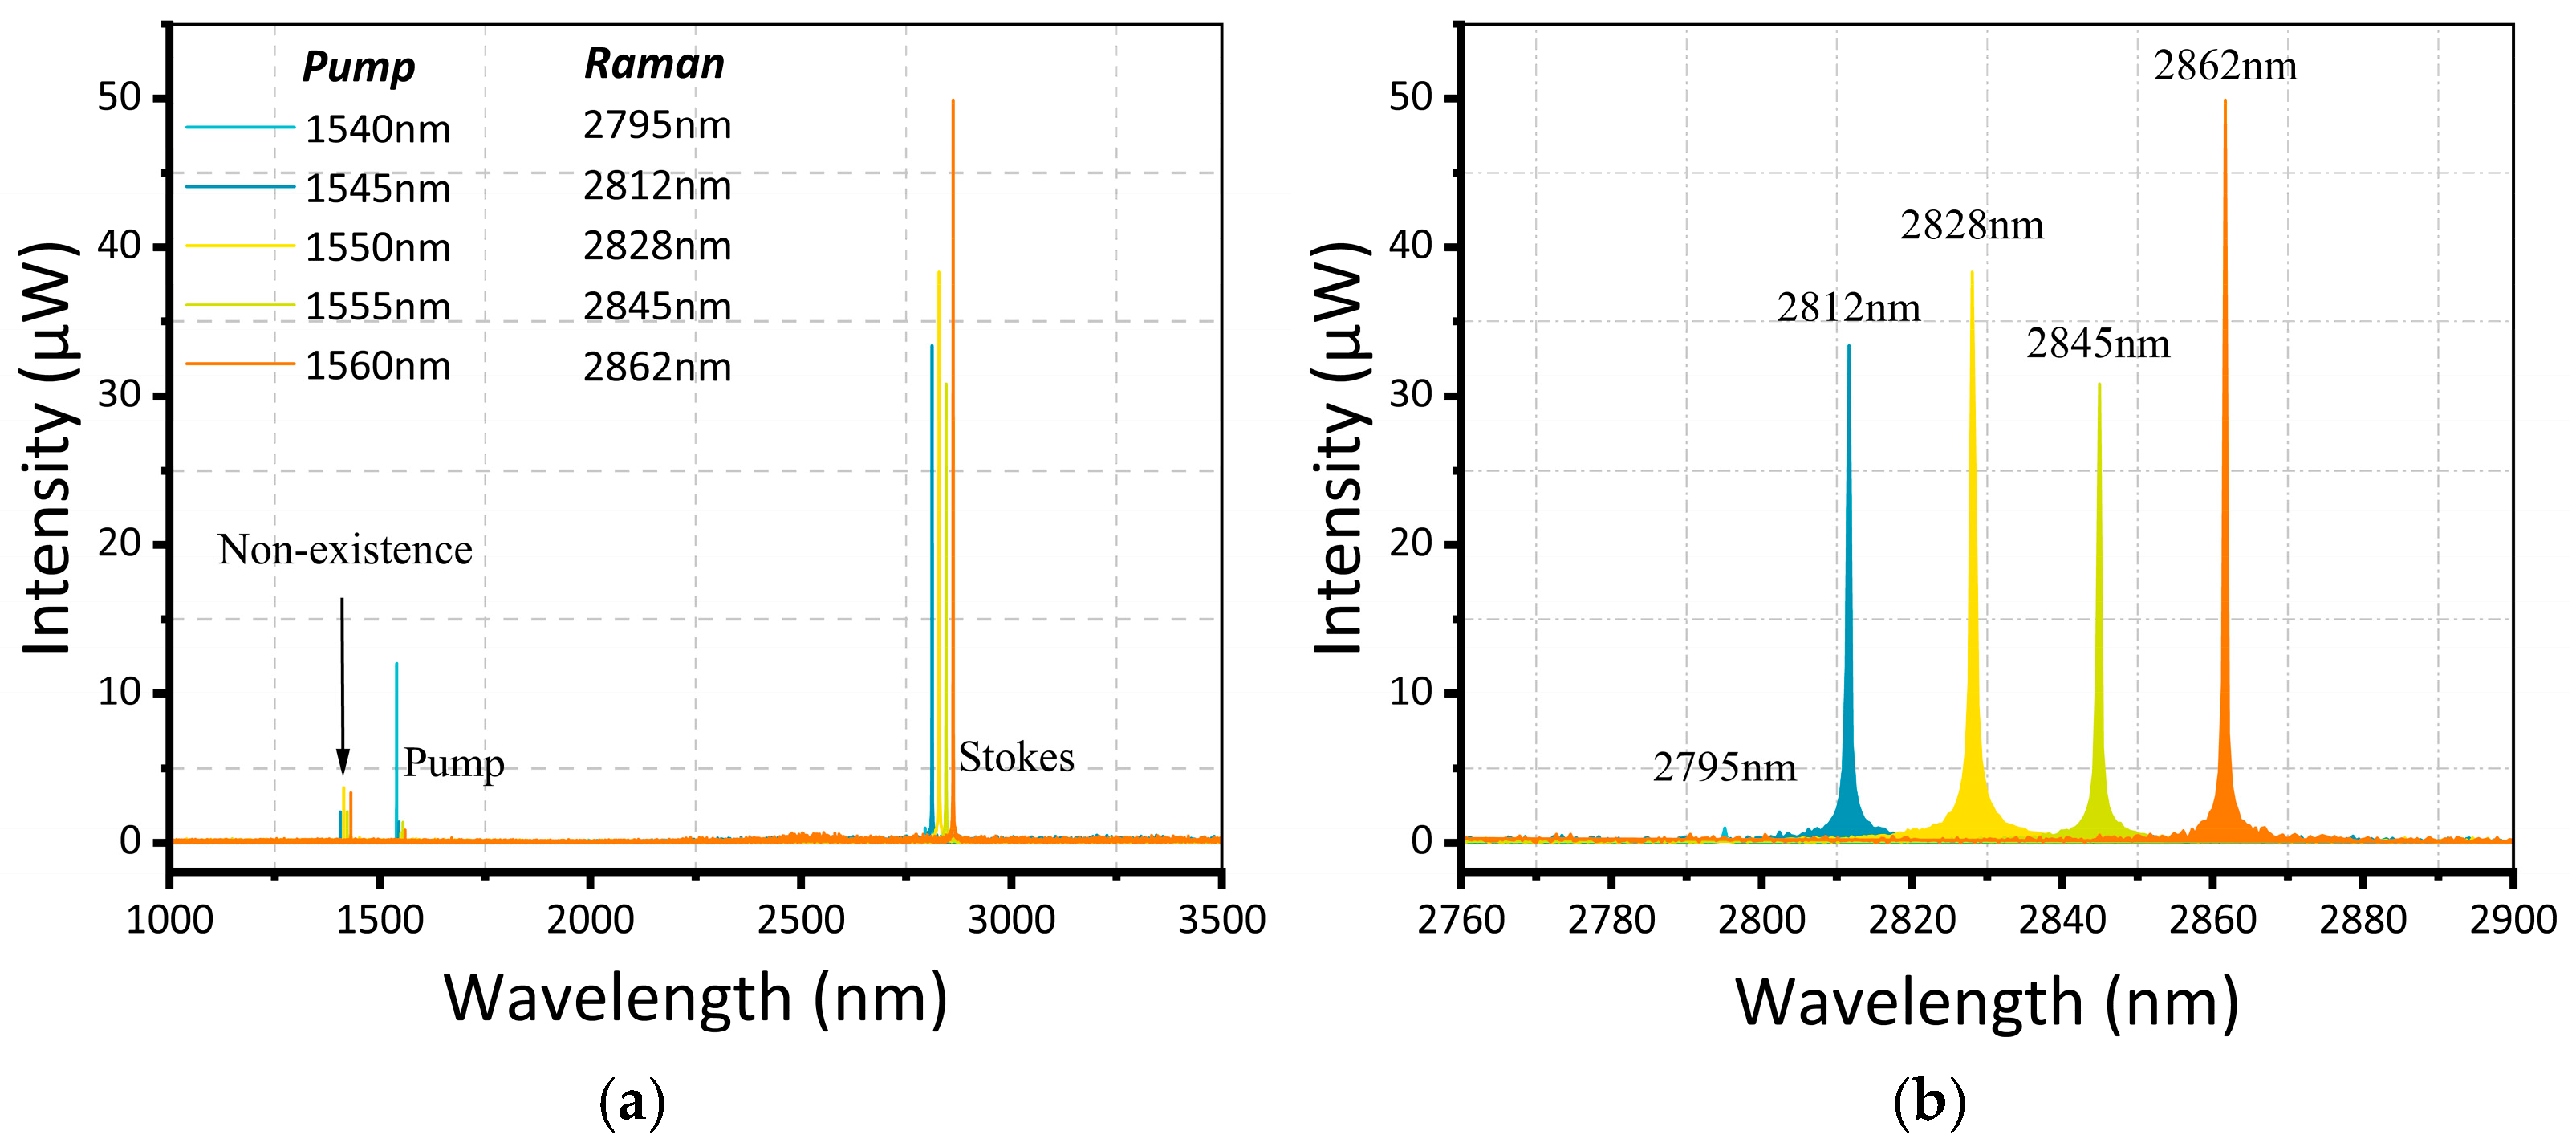
A Fourier transform optical spectrum analyzer (Thorlabs, Newton, NJ, USA, OSA207C; range from 1 μm to 12 μm) was used to measure the spectra of the Raman laser and residual pump laser passing through the first beam splitter (BS I), and the results are shown in Figure 3a,b. When the pump wavelength was tuned from 1540 nm to 1560 nm, the Raman wavelength changed from 2795 nm to 2862 nm, corresponding to a Raman shift of around 2917 cm−1. Since most of the near-IR laser was reflected by the DM, the OSA detected only weak lines in 1.5 μm band.
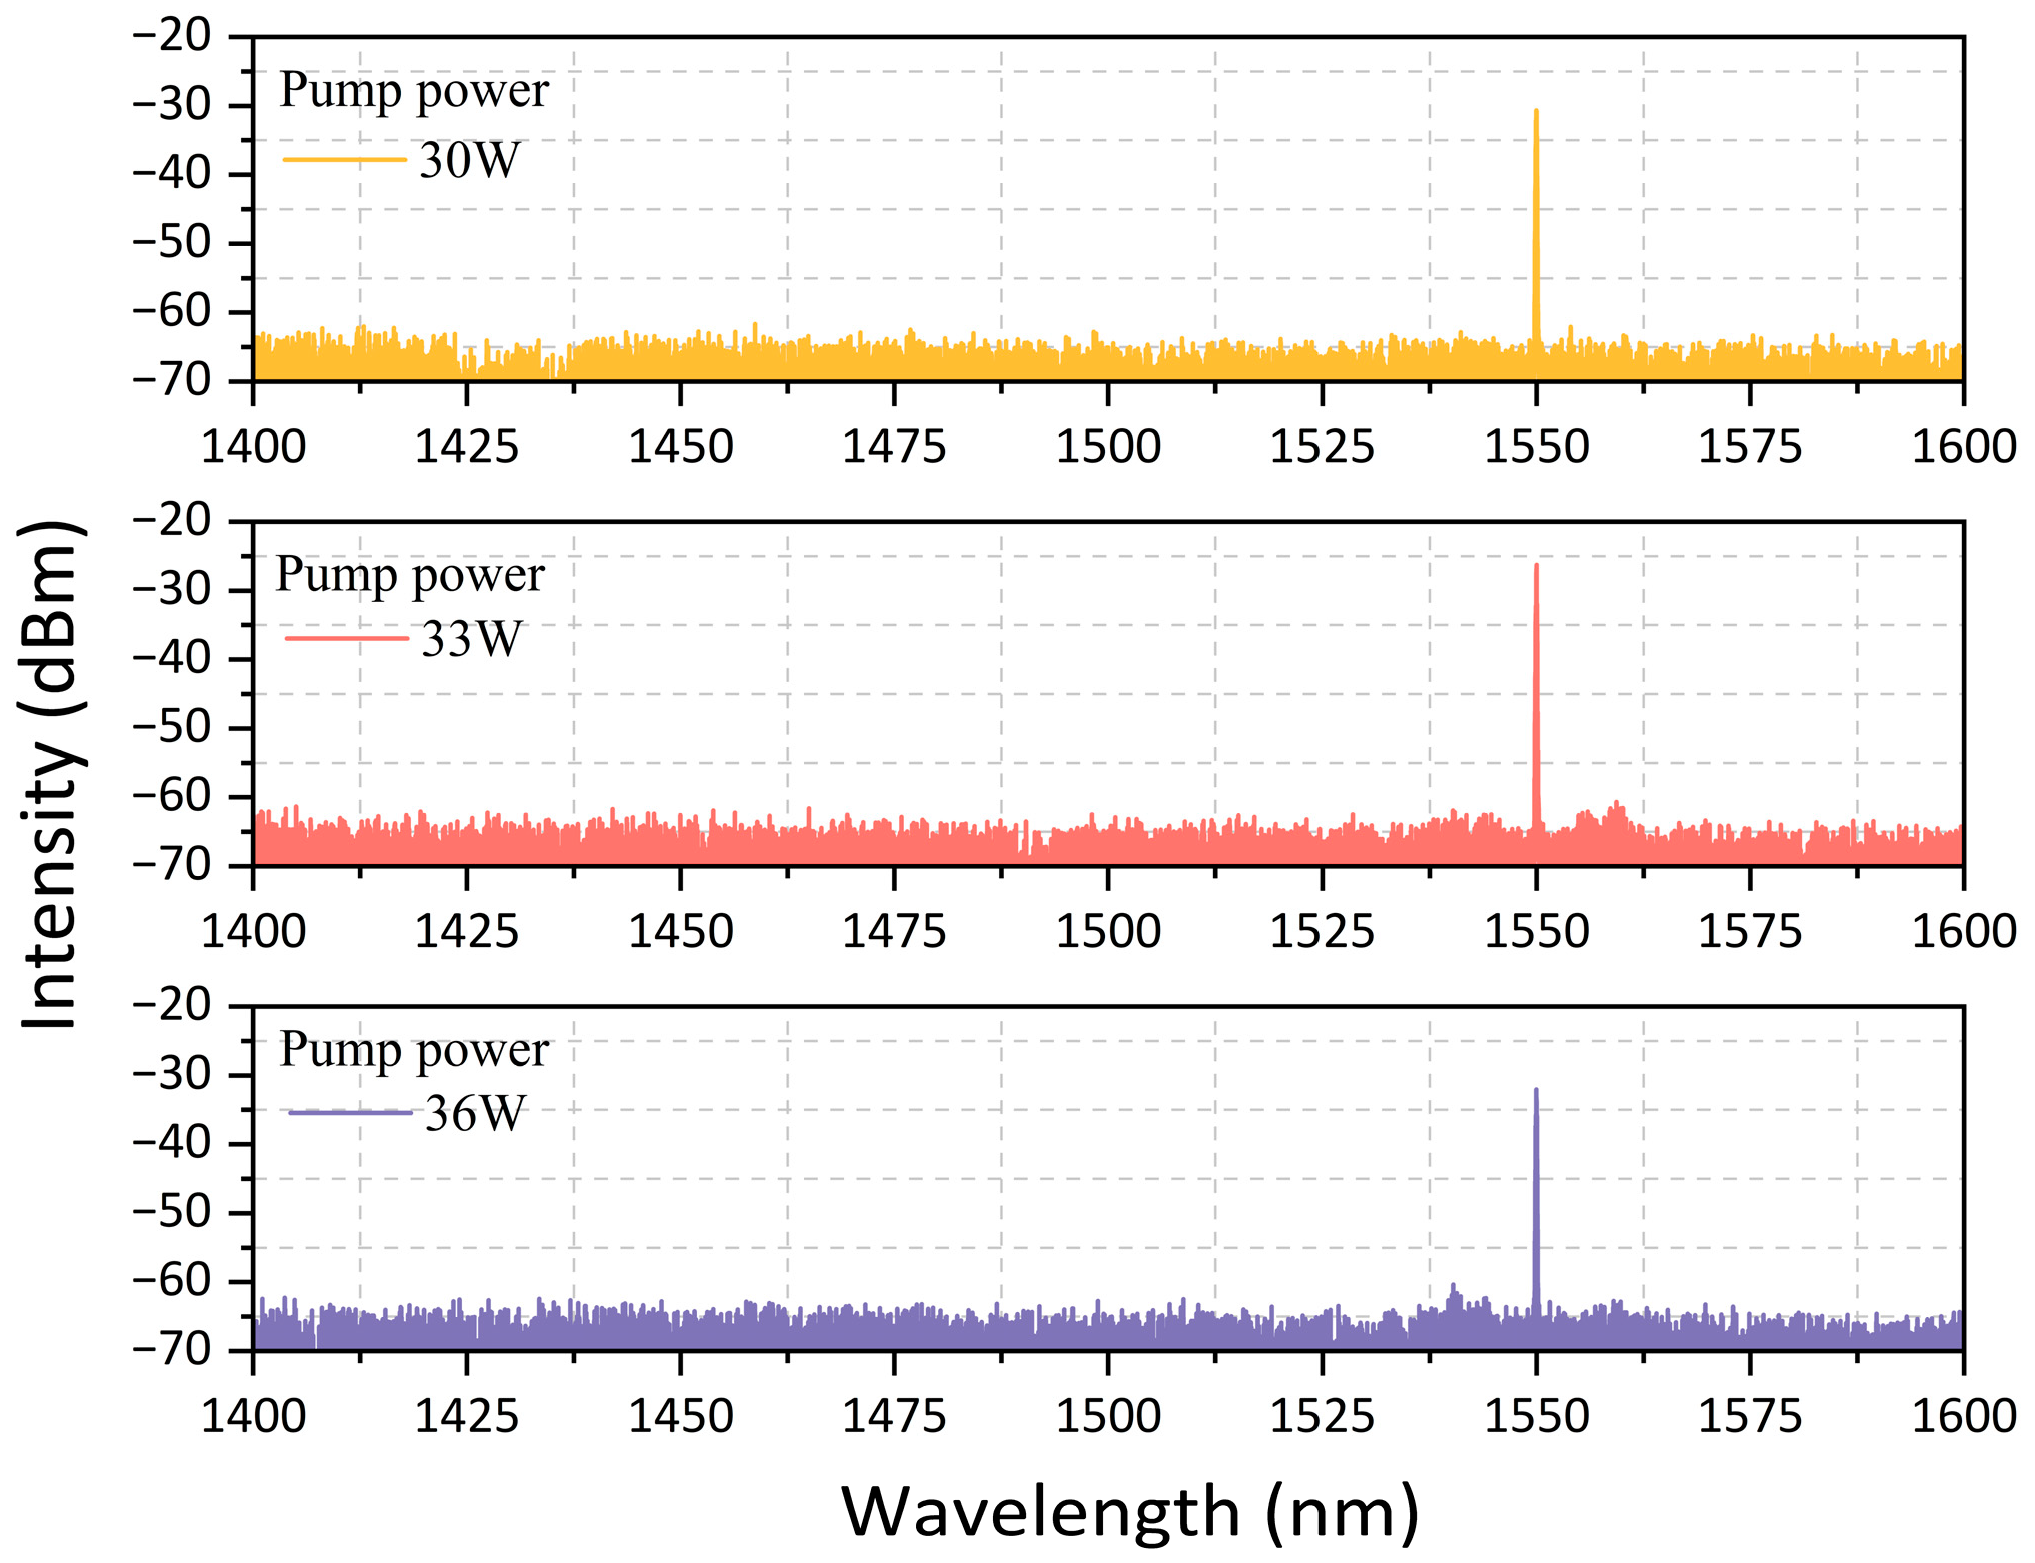
Interestingly, the spectral diagram also shows the 1.4 μm lines. We believe that the spectral lines around 1.4 μm do not actually exist; instead, the Fourier transform optical spectrum analyzer caused the frequency doubling of the 2.8 μm laser during the measurement process, generating the 1.4 μm spectral lines. In order to verify that there was no laser generated in the 1.4 μm band, another spectrum analyzer (Yokogawa, Tokyo, Japan, AQ6375E; range from 1200 nm to 2400 nm) based on diffraction grating was used to measure the residual pump laser, and the results under different power conditions are shown in Figure 4. It can be seen that only spectral lines at 1.5 μm were detected in the residual pump laser, which confirms the non-existence of the 1.4 μm lines. The result show that there was only vibrational SRS generated in the methane-filled HCF.

3.2. Power Characteristics

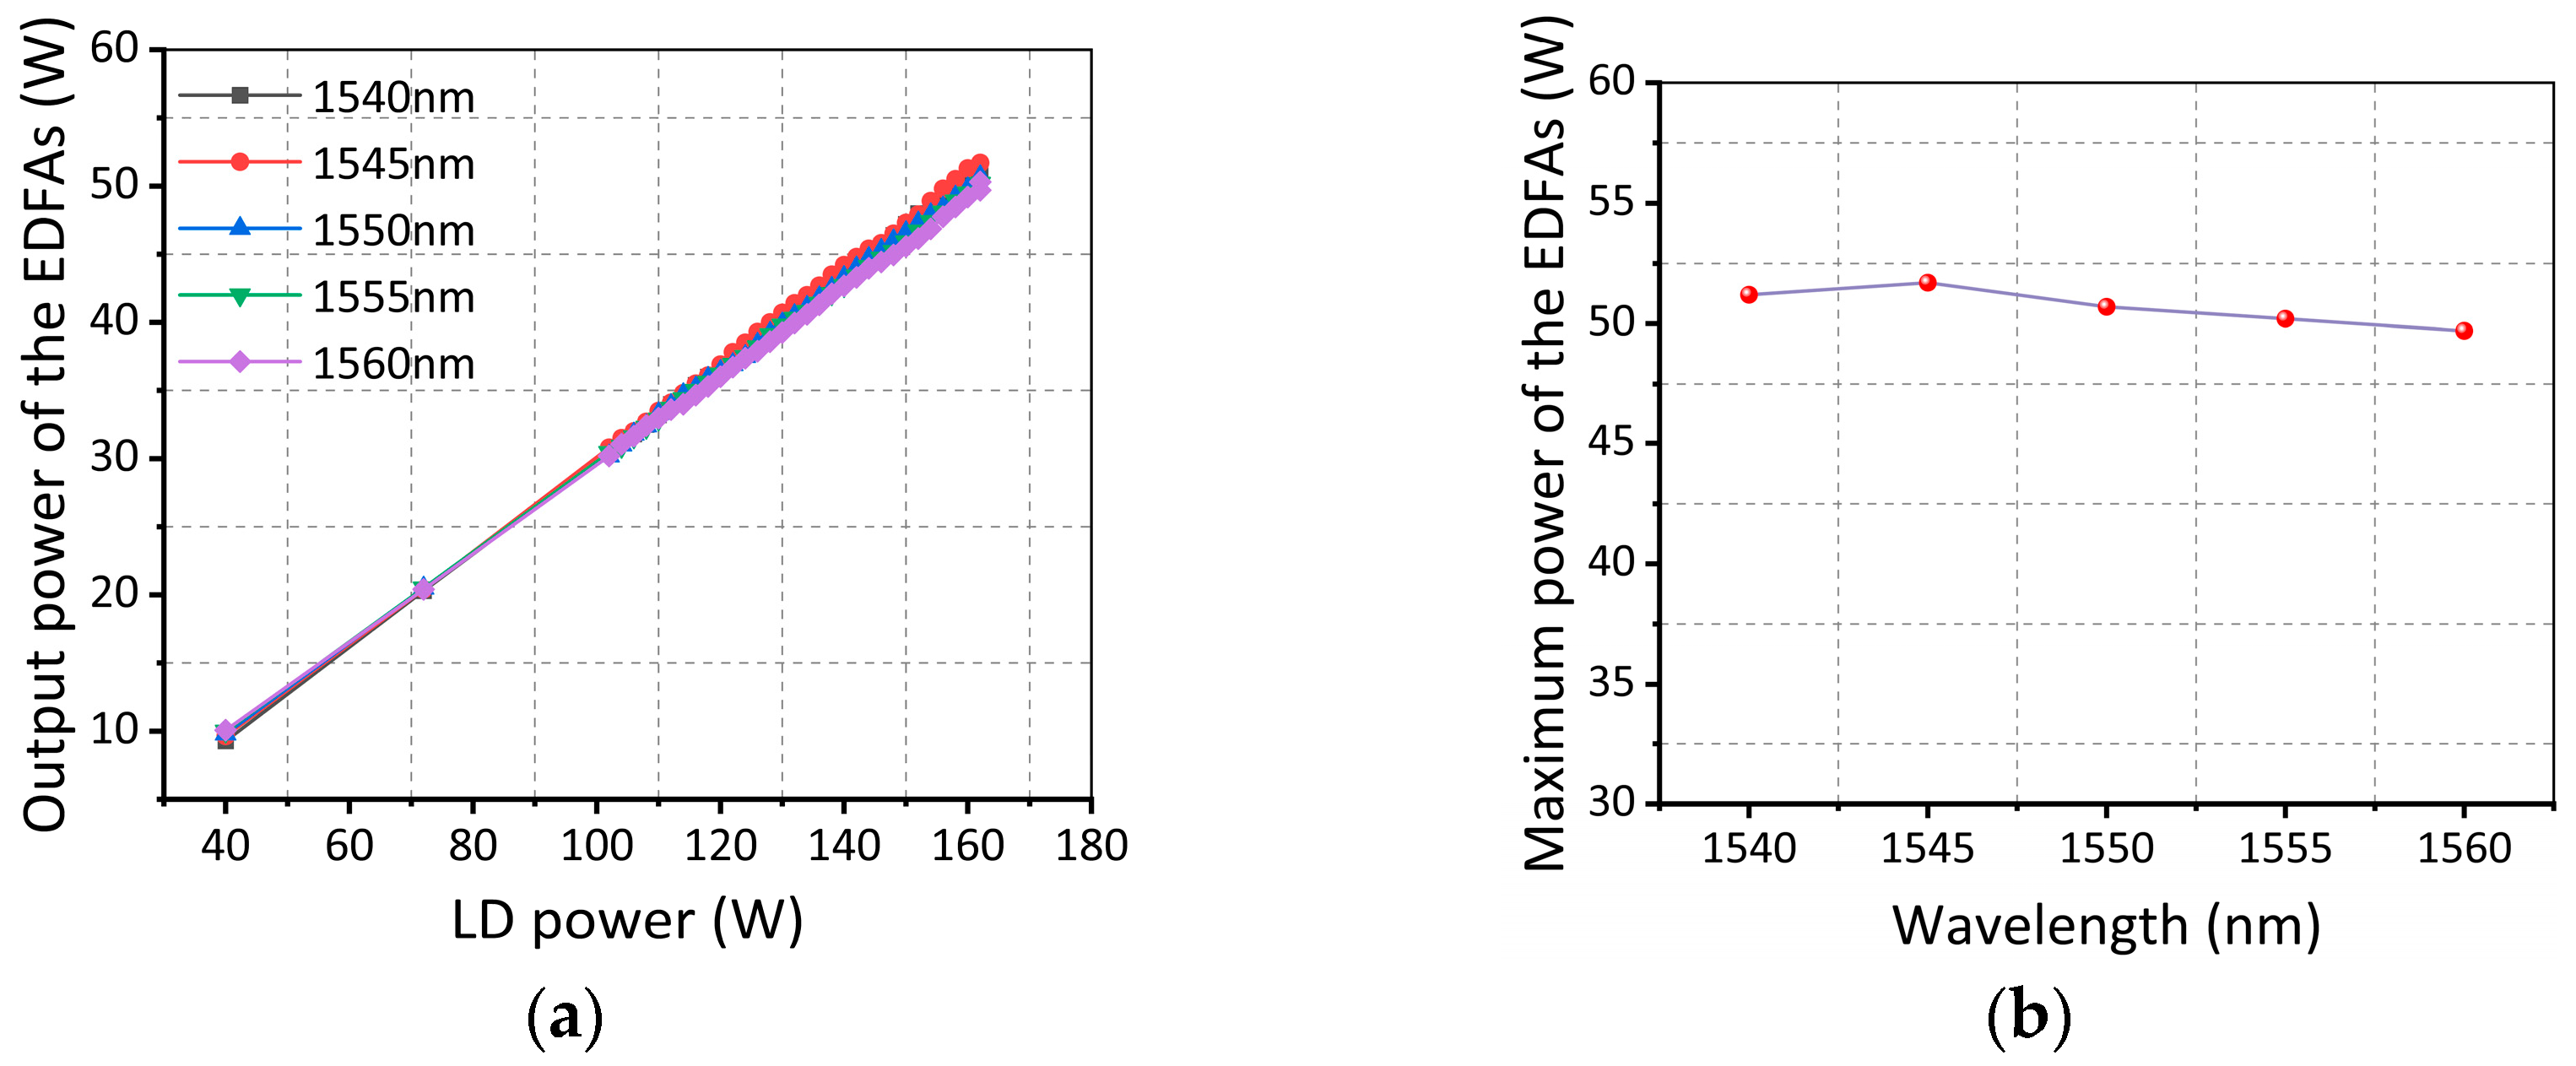
The power characteristics of the EDFAs were measured, as shown in Figure 5. Figure 5a presents the relationship between the output power of the EDFAs and the laser diode (LD) power at different wavelengths. It can be observed that the average output power of the EDFAs exhibits a linear relationship with the LD power. Figure 5b shows the maximum output power of the EDFAs at different wavelengths. There are minor differences in the maximum power at different wavelengths, all of which are around 50 W.
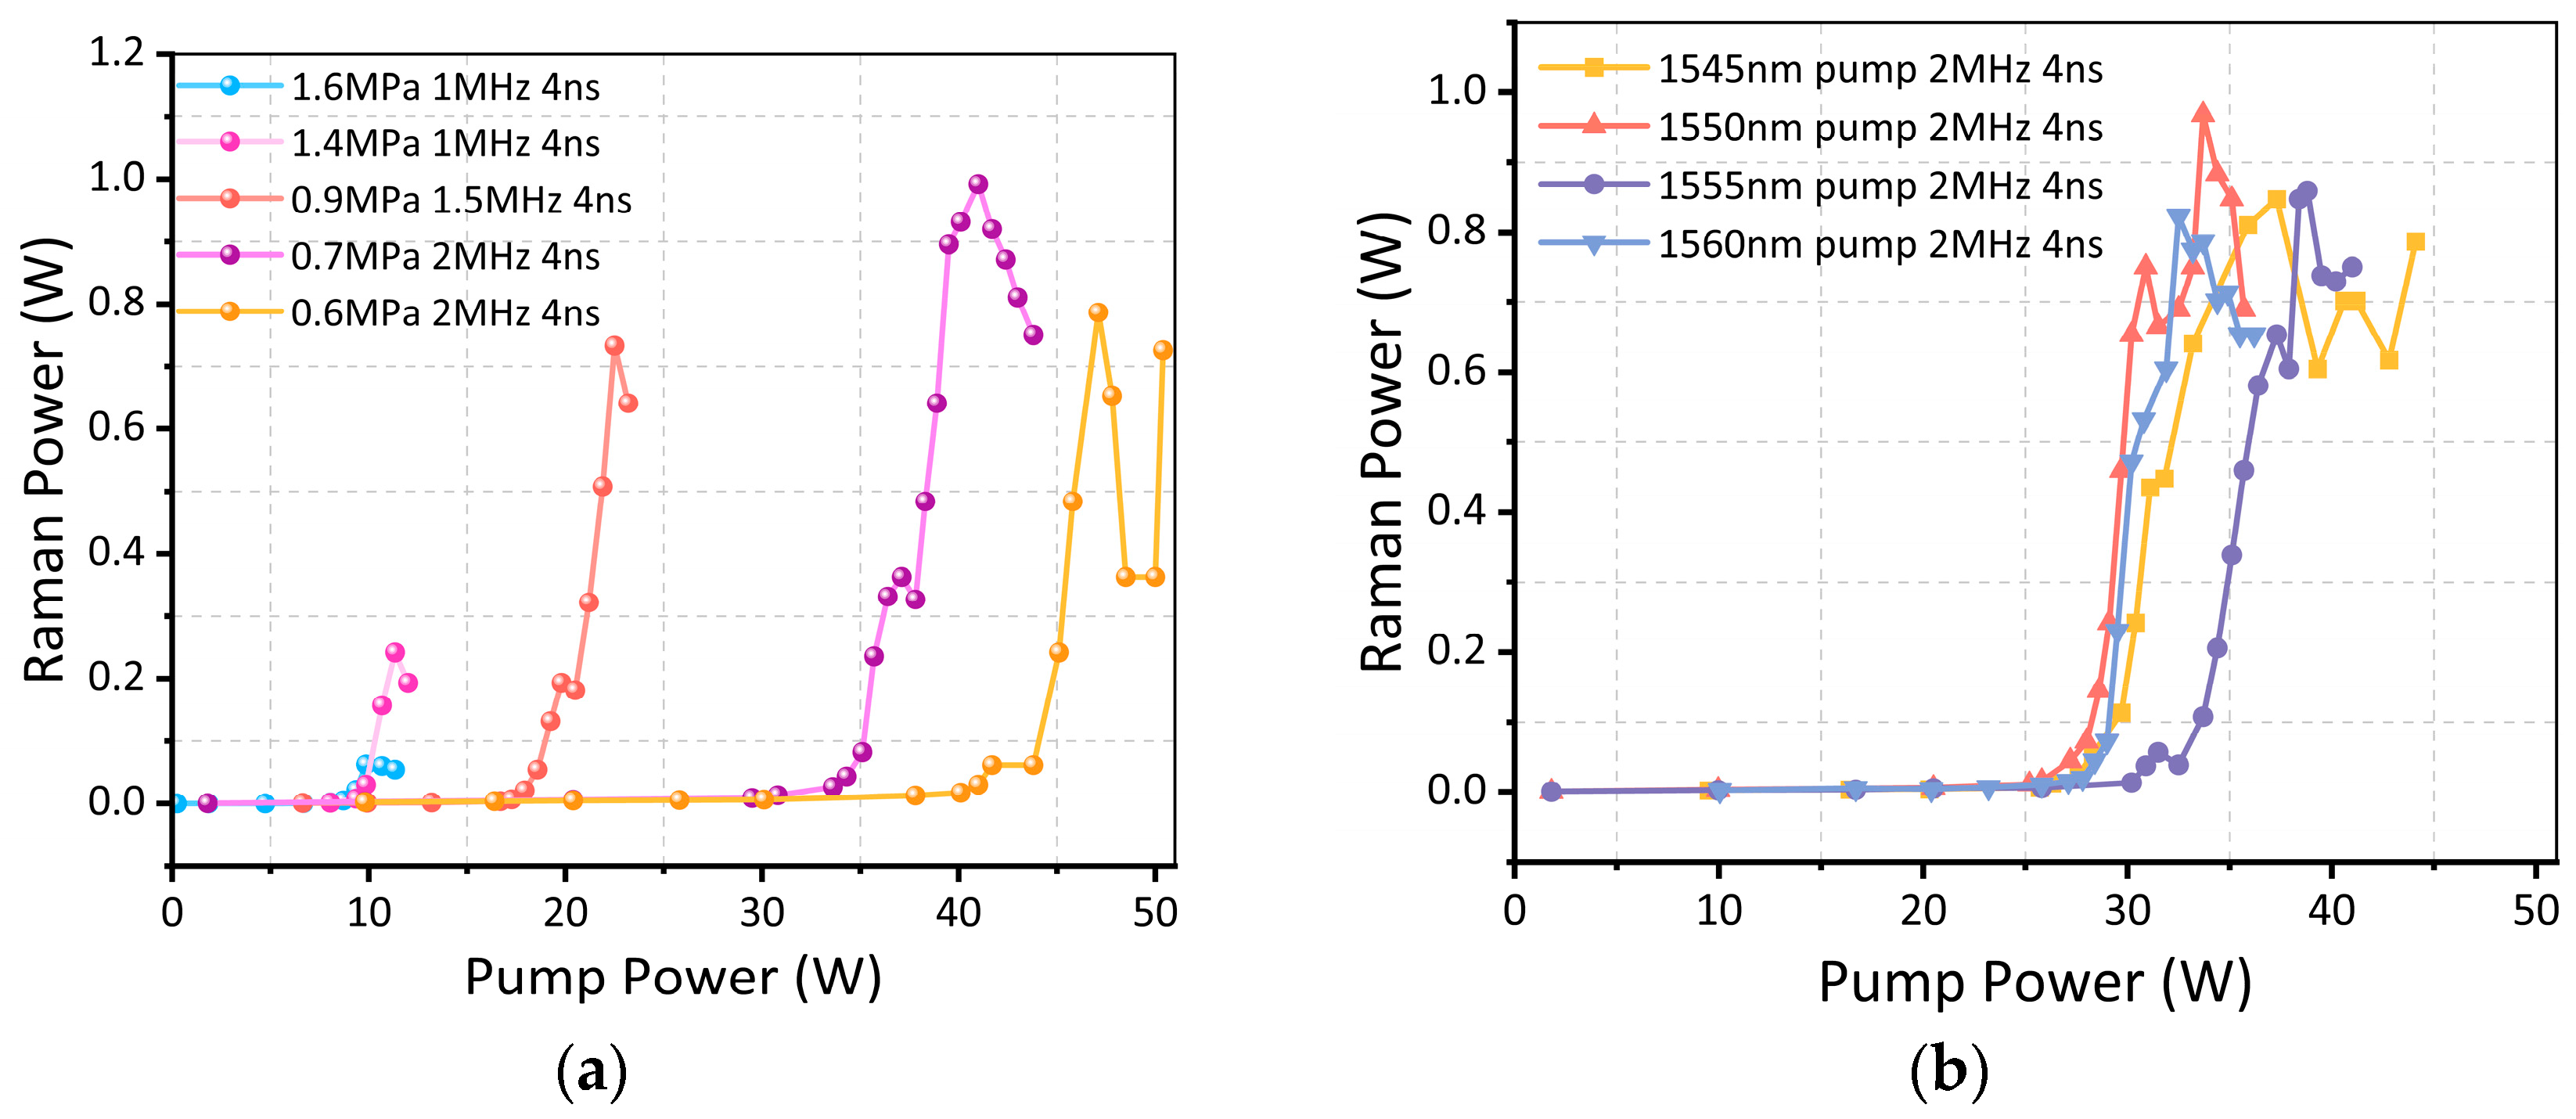
Figure 6 shows the measurement of 2.8 μm Raman power. It should be noted that the power values in the figure were obtained by excluding the losses of optical components such as windows and lenses and that the pump power throughout this paper refers specifically to the output power of the EDFAs. By adjusting the repetition frequency of the modulated signal, we could change the peak power (energy) of each pulse at a certain average power. The Raman power under different pressures and pump pulse repetition frequencies is shown in Figure 6a. It could be observed that the average power threshold of SRS increased with the decrease in methane pressure and the increase in pulse repetition frequency. When the pump power exceeded the threshold, Raman power experienced a rapid increase, reached its peak, and subsequently underwent a sharp decline. The maximum Raman power demonstrated a strong dependence on the gas pressure. For methane at 1.6 MPa, the maximum Raman power was only approximately 63 mW. As the pressure decreased to 1.4 MPa, the maximum Raman power rose significantly to about 240 mW. A further reduction in pressure to 0.7 MPa led to a considerable increase in output, which reached approximately 1 W. However, when the pressure dropped to 0.5 MPa, the maximum Raman power started to decrease. Because the peak power of the pump source was limited, the Raman conversion would decline at lower pressure with a higher threshold. If the peak power of the pump source is improved, a Raman laser with higher average power can be achieved at lower methane pressure. Our results indicate that while the repetition frequency influenced the lasing threshold, it had negligible effect on the maximum Raman power.
Since the maximum Raman power depends on the methane pressure, the methane pressure should be appropriately reduced to enhance the maximum Raman output. However, a decrease in pressure will also increase the Raman threshold. Moreover, limited by the amplification capability of the customized EDFAs, when the repetition frequency is too low, the amplified laser will exhibit spectral broadening. Furthermore, the pulse width affects the conversion efficiency of the fiber methane Raman laser: a smaller pulse width results in lower mid-infrared Raman conversion efficiency, while an excessively large pulse width tends to induce stimulated Brillouin scattering during pump laser amplification. The generated reflected laser will trigger the power-off protection mechanism of the EDFAs. Based on the above analysis, after multiple attempts, we determined the repetition frequency range of the modulated signal to be 1~2.5 MHz and the pulse width to be 4 ns. Figure 6a shows that the Raman output power is the highest when the repetition frequency is 2 MHz. Therefore, 2 MHz is considered the optimal repetition frequency condition for this experiment, and all subsequent tests were conducted with a repetition frequency of 2 MHz and a pulse width of 4 ns.
The evolution of Raman power with pump power under different pump wavelengths is shown in Figure 6b. The highest Raman output power, approximately 1 W, was achieved at a pump wavelength of 1550 nm. The Raman power was slightly different under different pump wavelengths, because the gain of different wavelengths in the EDFAs was different. Therefore, the peak power and the phenomenon of spectrum broadening will be different under the condition of the same average power. For example, when using a modulated and amplified 1540 nm laser as the pump laser, only a very weak spectral line at 2795 nm was observed, as shown in Figure 3b. Simultaneously, we observed that the residual pump power plummeted once the Raman power reached its maximum, as shown in Figure 7a,b. These results explain the decrease in Raman power: the decrease in pump power led to a reduction in Raman conversion, which in turn resulted in the decrease in Raman power.

3.3. Threshold Characteristics

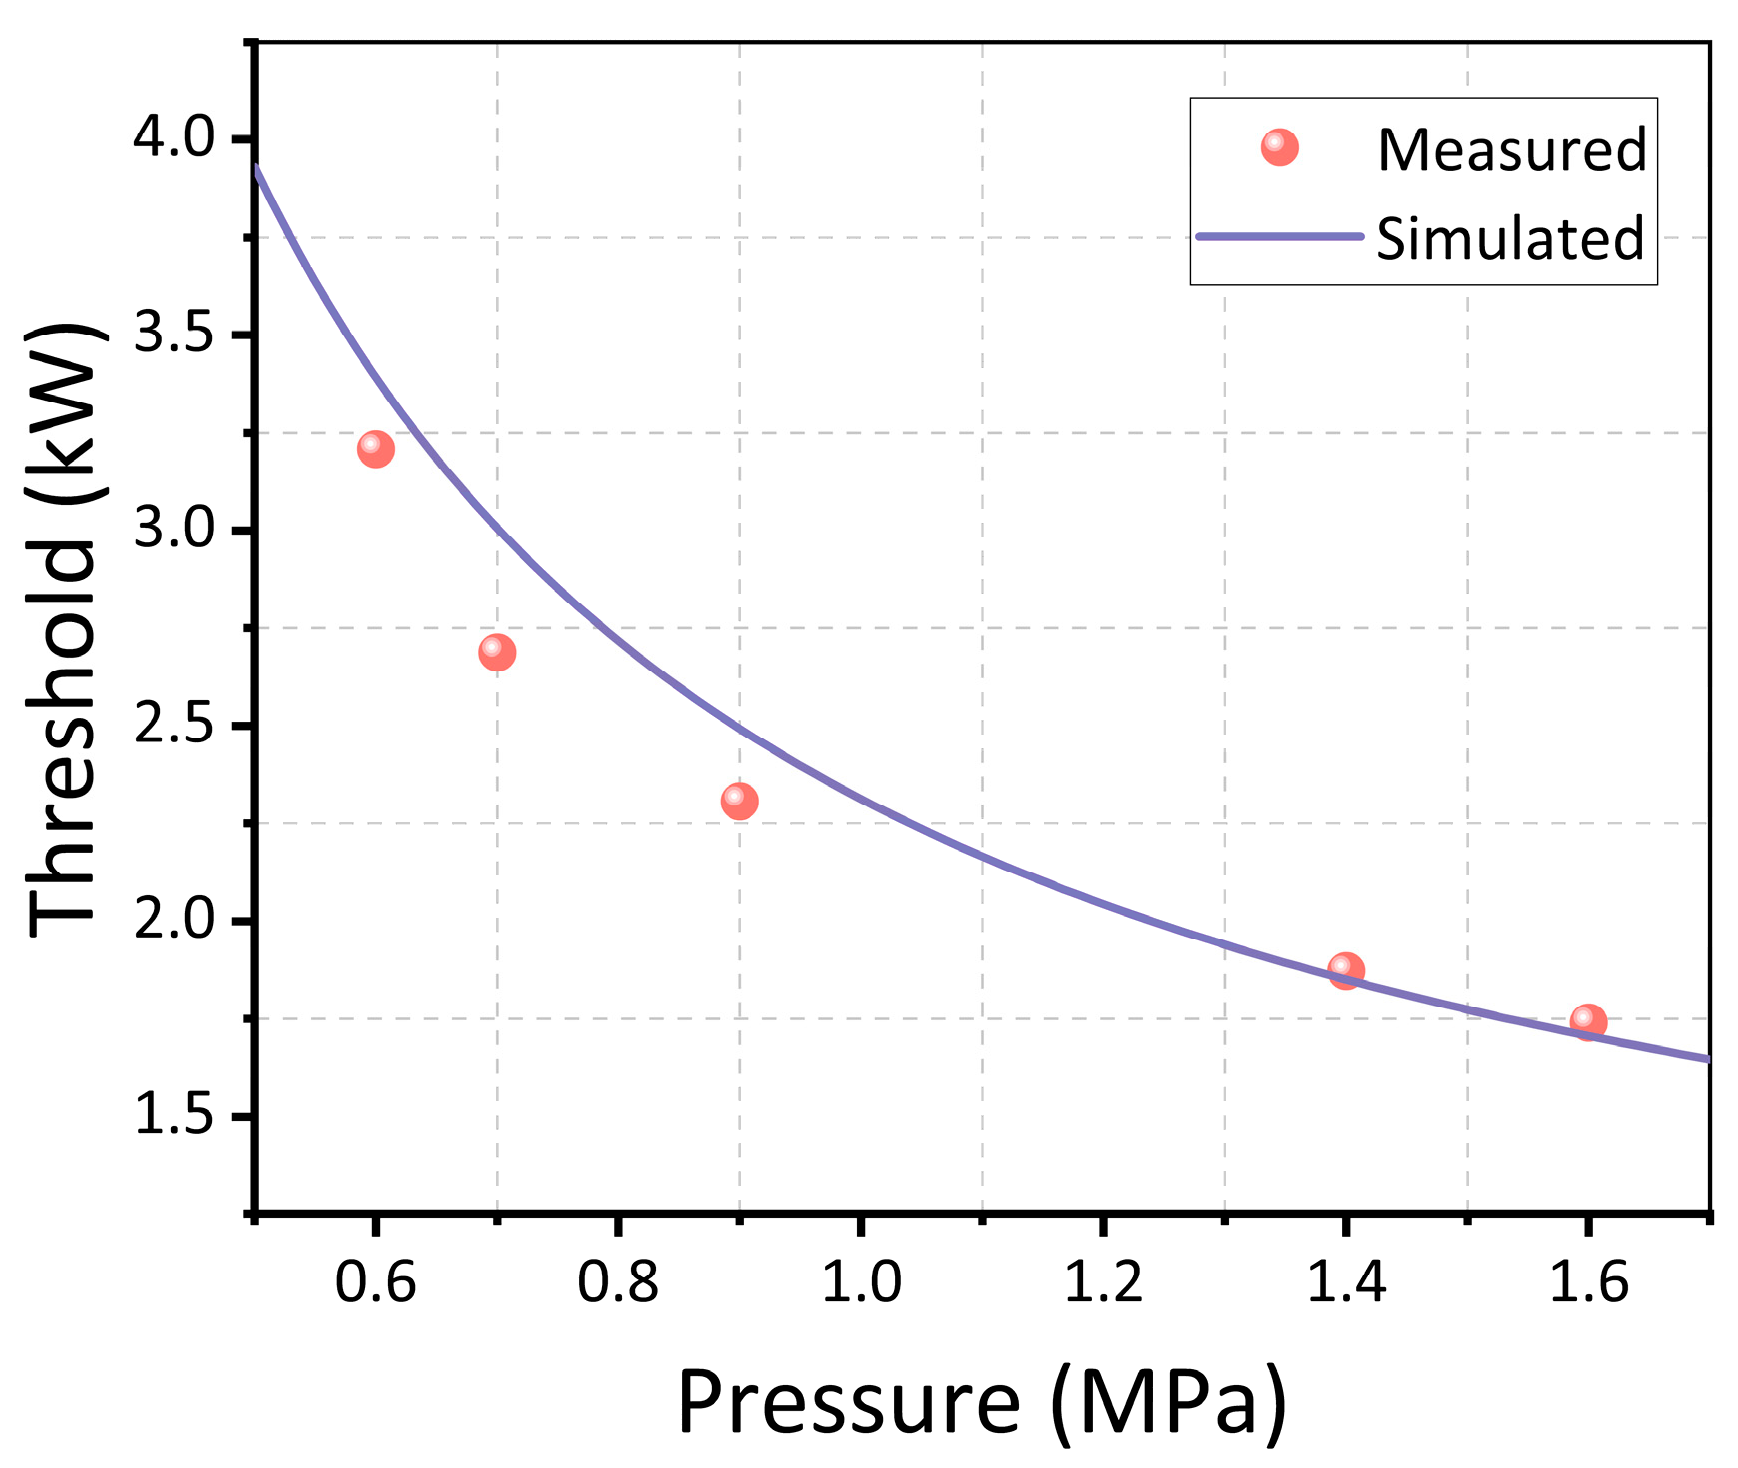
The relationship between the threshold of peak power and methane pressure is plotted in Figure 8. The measured peak power was obtained from the power curves shown in Figure 6a. The measured data show that the threshold decreased as the pressure increased, which reflects the inverse relationship between threshold and pressure. According to the relationship between gain coefficient and pressure [25], combined with Equation (1), we obtained the functional relationship between threshold power and pressure, as shown by the solid line in Figure 8. In the 26.7 m HCF, the Raman threshold could be reduced to 1.7 kW. The measured power showed good agreement with the simulated curve.

3.4. Transverse Mode Instability in Hollow-Core Fibers

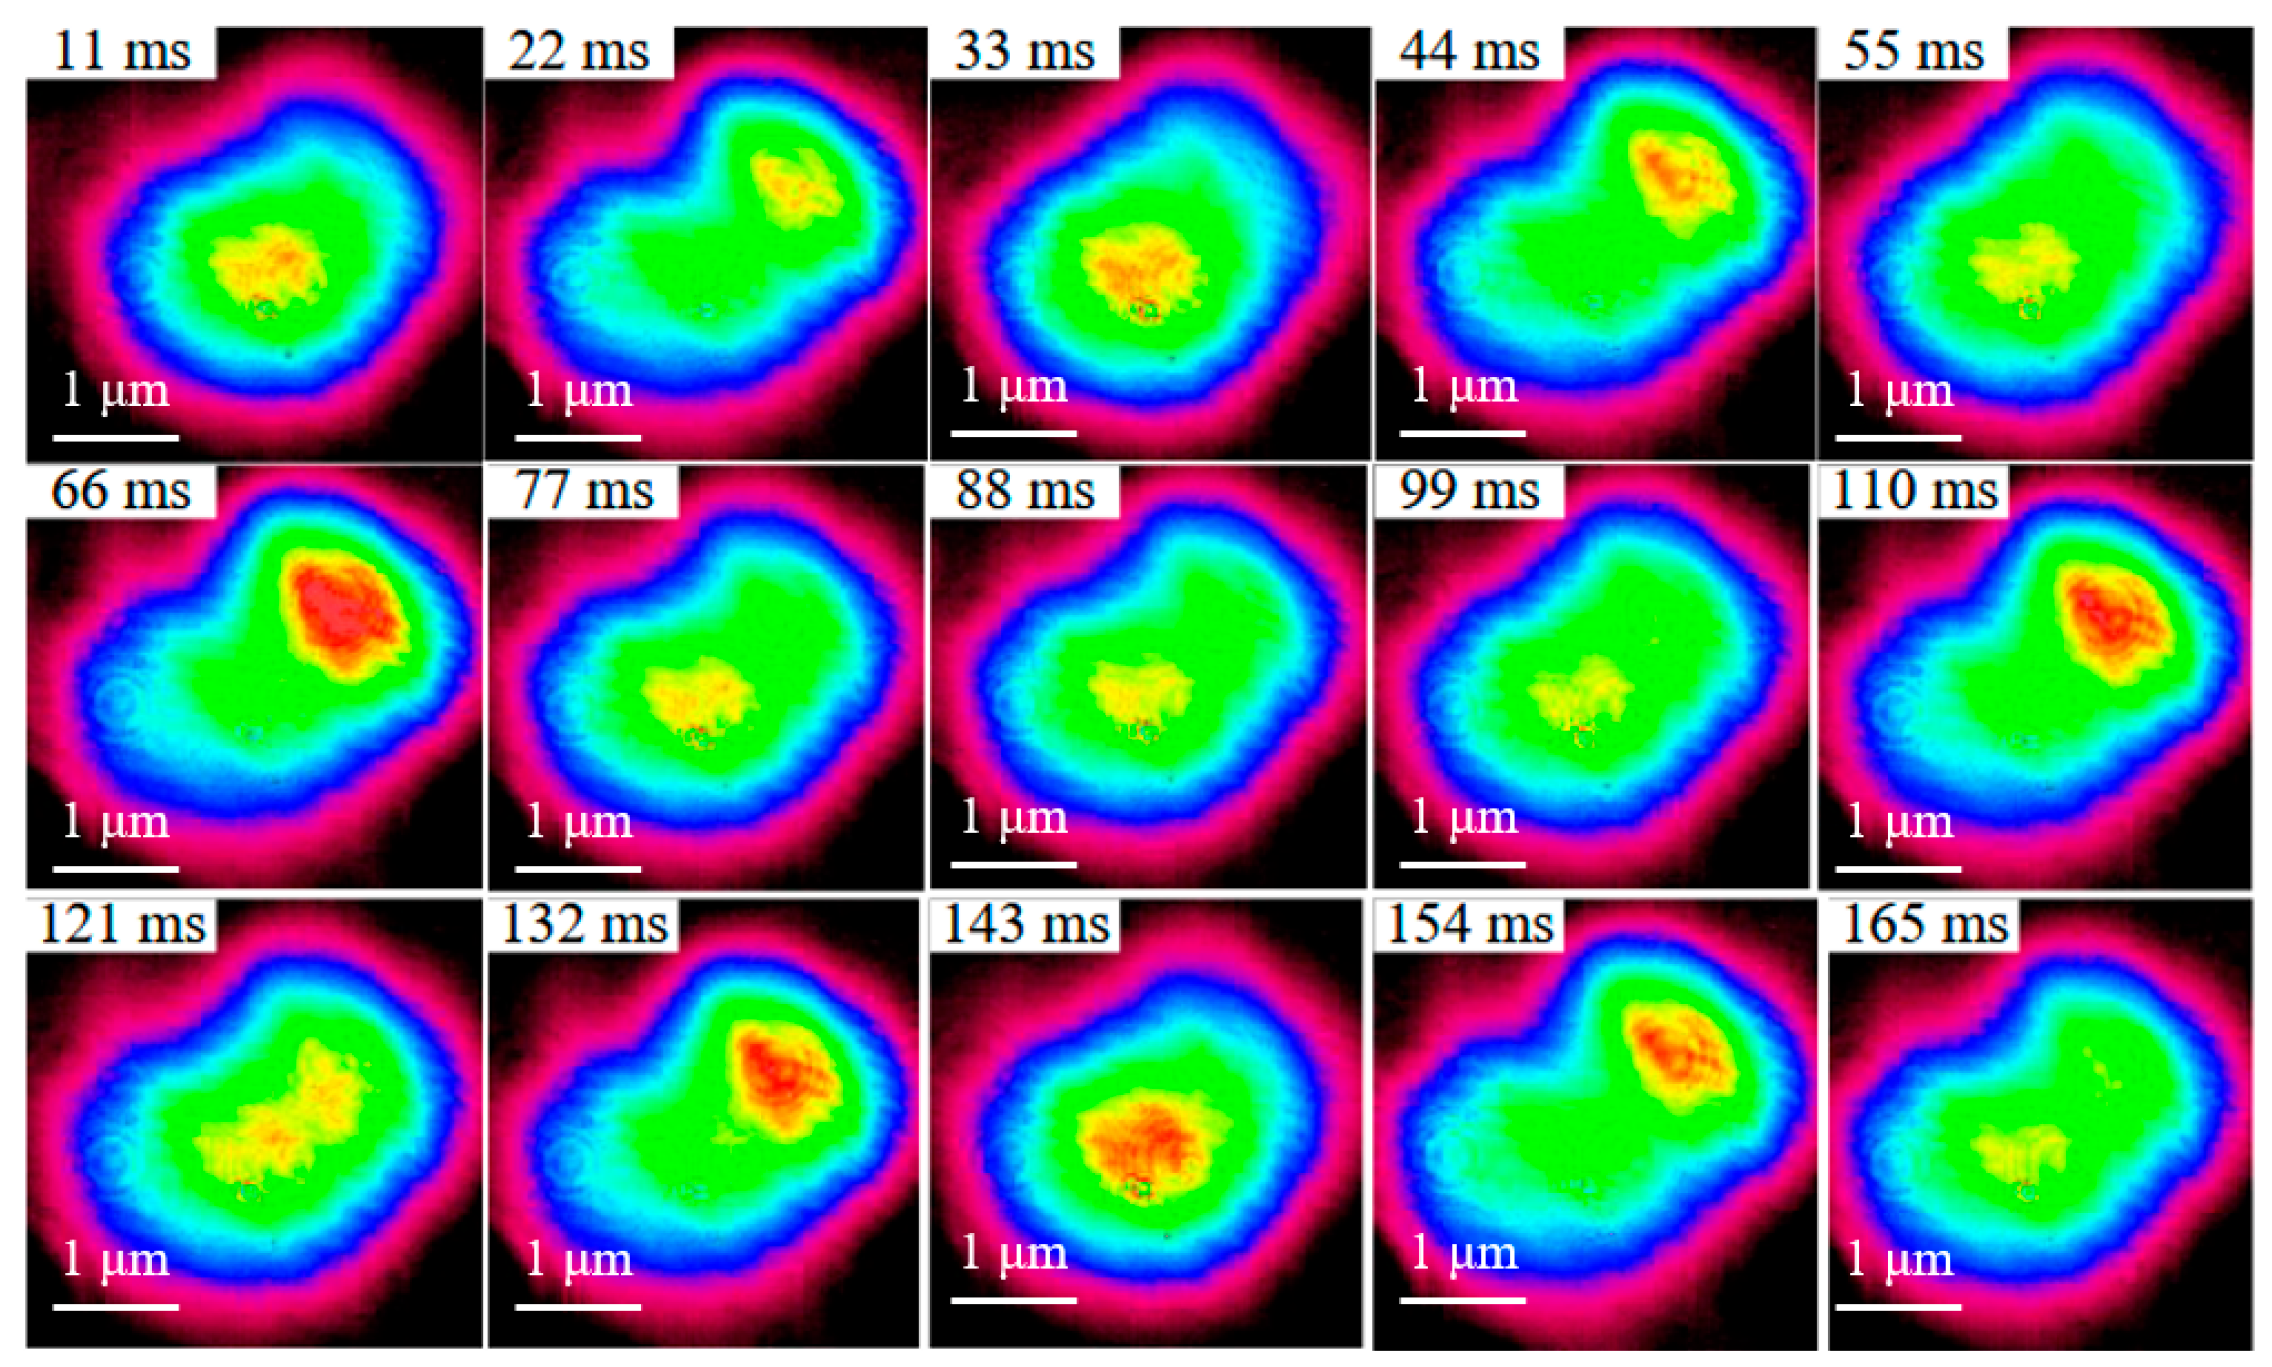
To investigate the cause of the precipitous drop in residual pump power, we conducted detailed measurements of the characteristics of the laser output from the HCF. Near the point of sharp power decline, we observed degradation in the beam quality of the output laser. We configured the pump source for continuous-wave operation to specifically measure the beam profile and temporal signals of the 1.5 μm continuous-wave laser transmitted through the methane-filled HCF. Figure 9 shows the time-evolving beam profiles of the 1.5 μm continuous-wave laser captured by an infrared camera. With a camera frame rate of 91 Hz, the time interval between consecutive frames is approximately 11 ms. The output beam profiles from the HCF exhibited continuous jitter, alternating between a fundamental-mode-like pattern and an LP11-mode-like pattern. Due to the relatively low frame rate, the infrared camera could not fully capture the evolution of these beam profiles changes.
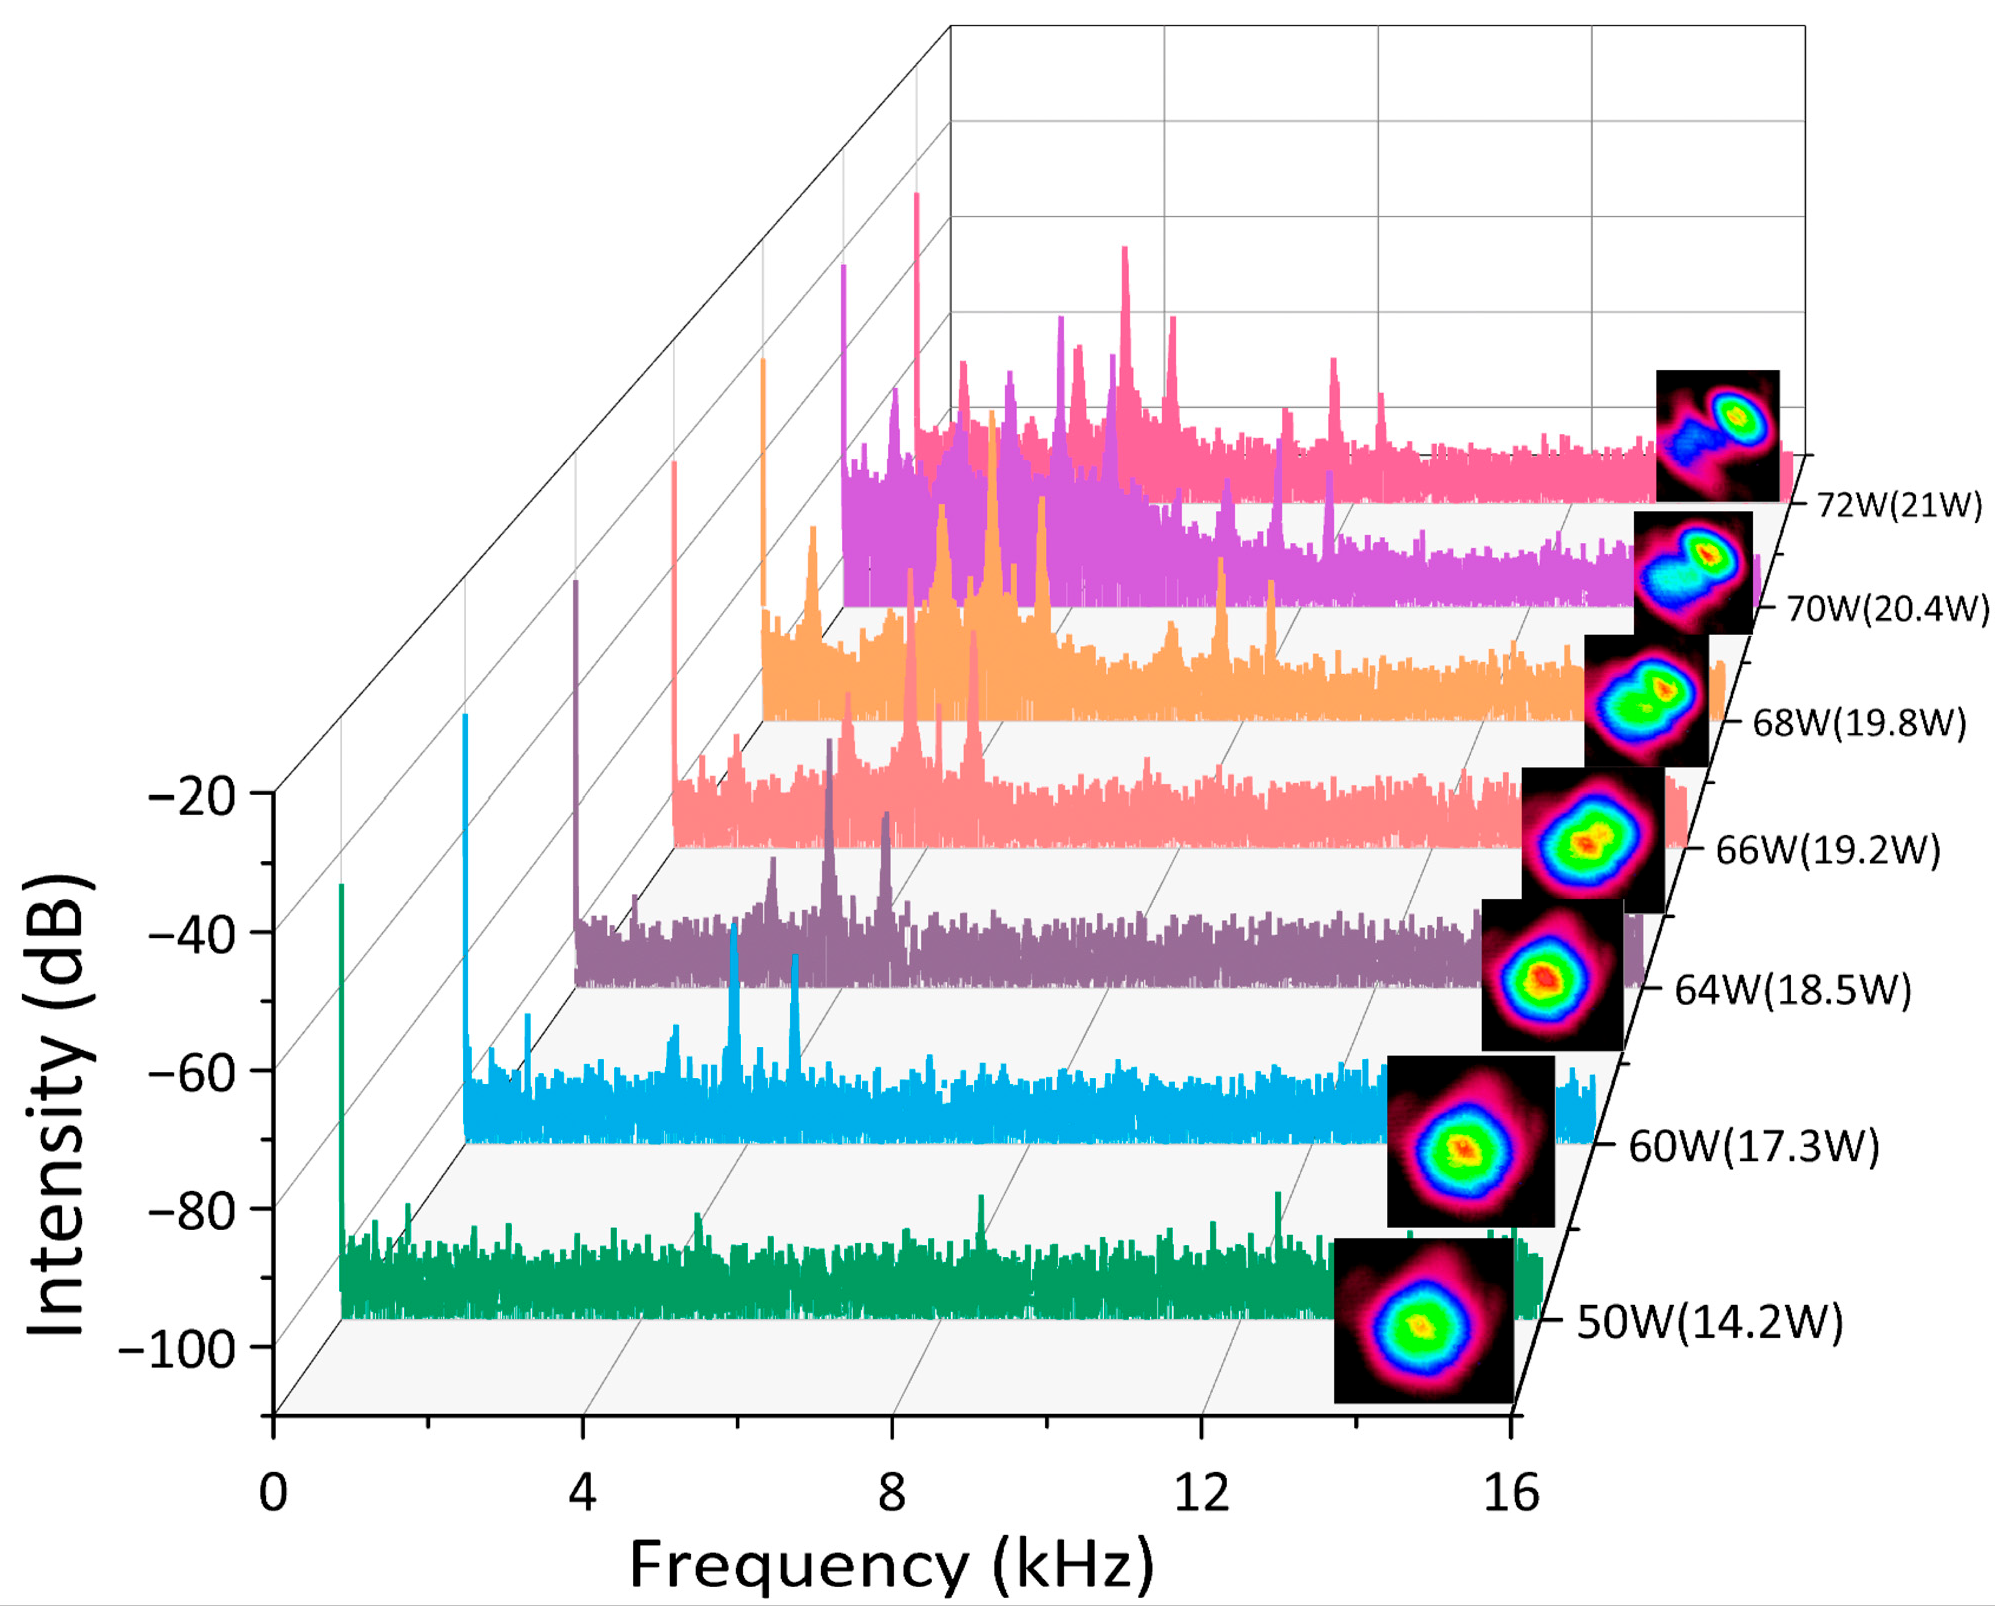
We measured the temporal characteristics of the 1.5 μm transmitted laser with a photodetector. Figure 10 presents the Fourier transform spectra of the temporal signals of the transmitted 1.5 μm laser at different pump power levels, where the numbers in parentheses represent the transmitted power from the HCF. As the injected power increased, the beam quality of the output laser gradually deteriorated. Simultaneously, several spectral components at the kHz level emerged in the Fourier transform spectra. Higher injection power correlated with worse beam quality and more complex frequency-domain characteristics. Since the measured beam profiles and frequency-domain signals closely resemble the laser characteristics observed after the onset of TMI in conventional high-power solid-core fiber lasers [26], we concluded that TMI also occurred in the methane-filled HCF. Unlike conventional high-power solid-core fiber lasers, where the TMI occurs in the signal laser waveband, the TMI observed in the HCF occurred in the pump laser waveband. Due to the high loss of higher-order modes in the HCF, any degradation in beam quality would cause the transmitted laser to leak from the core, resulting in a sudden drop in laser power.
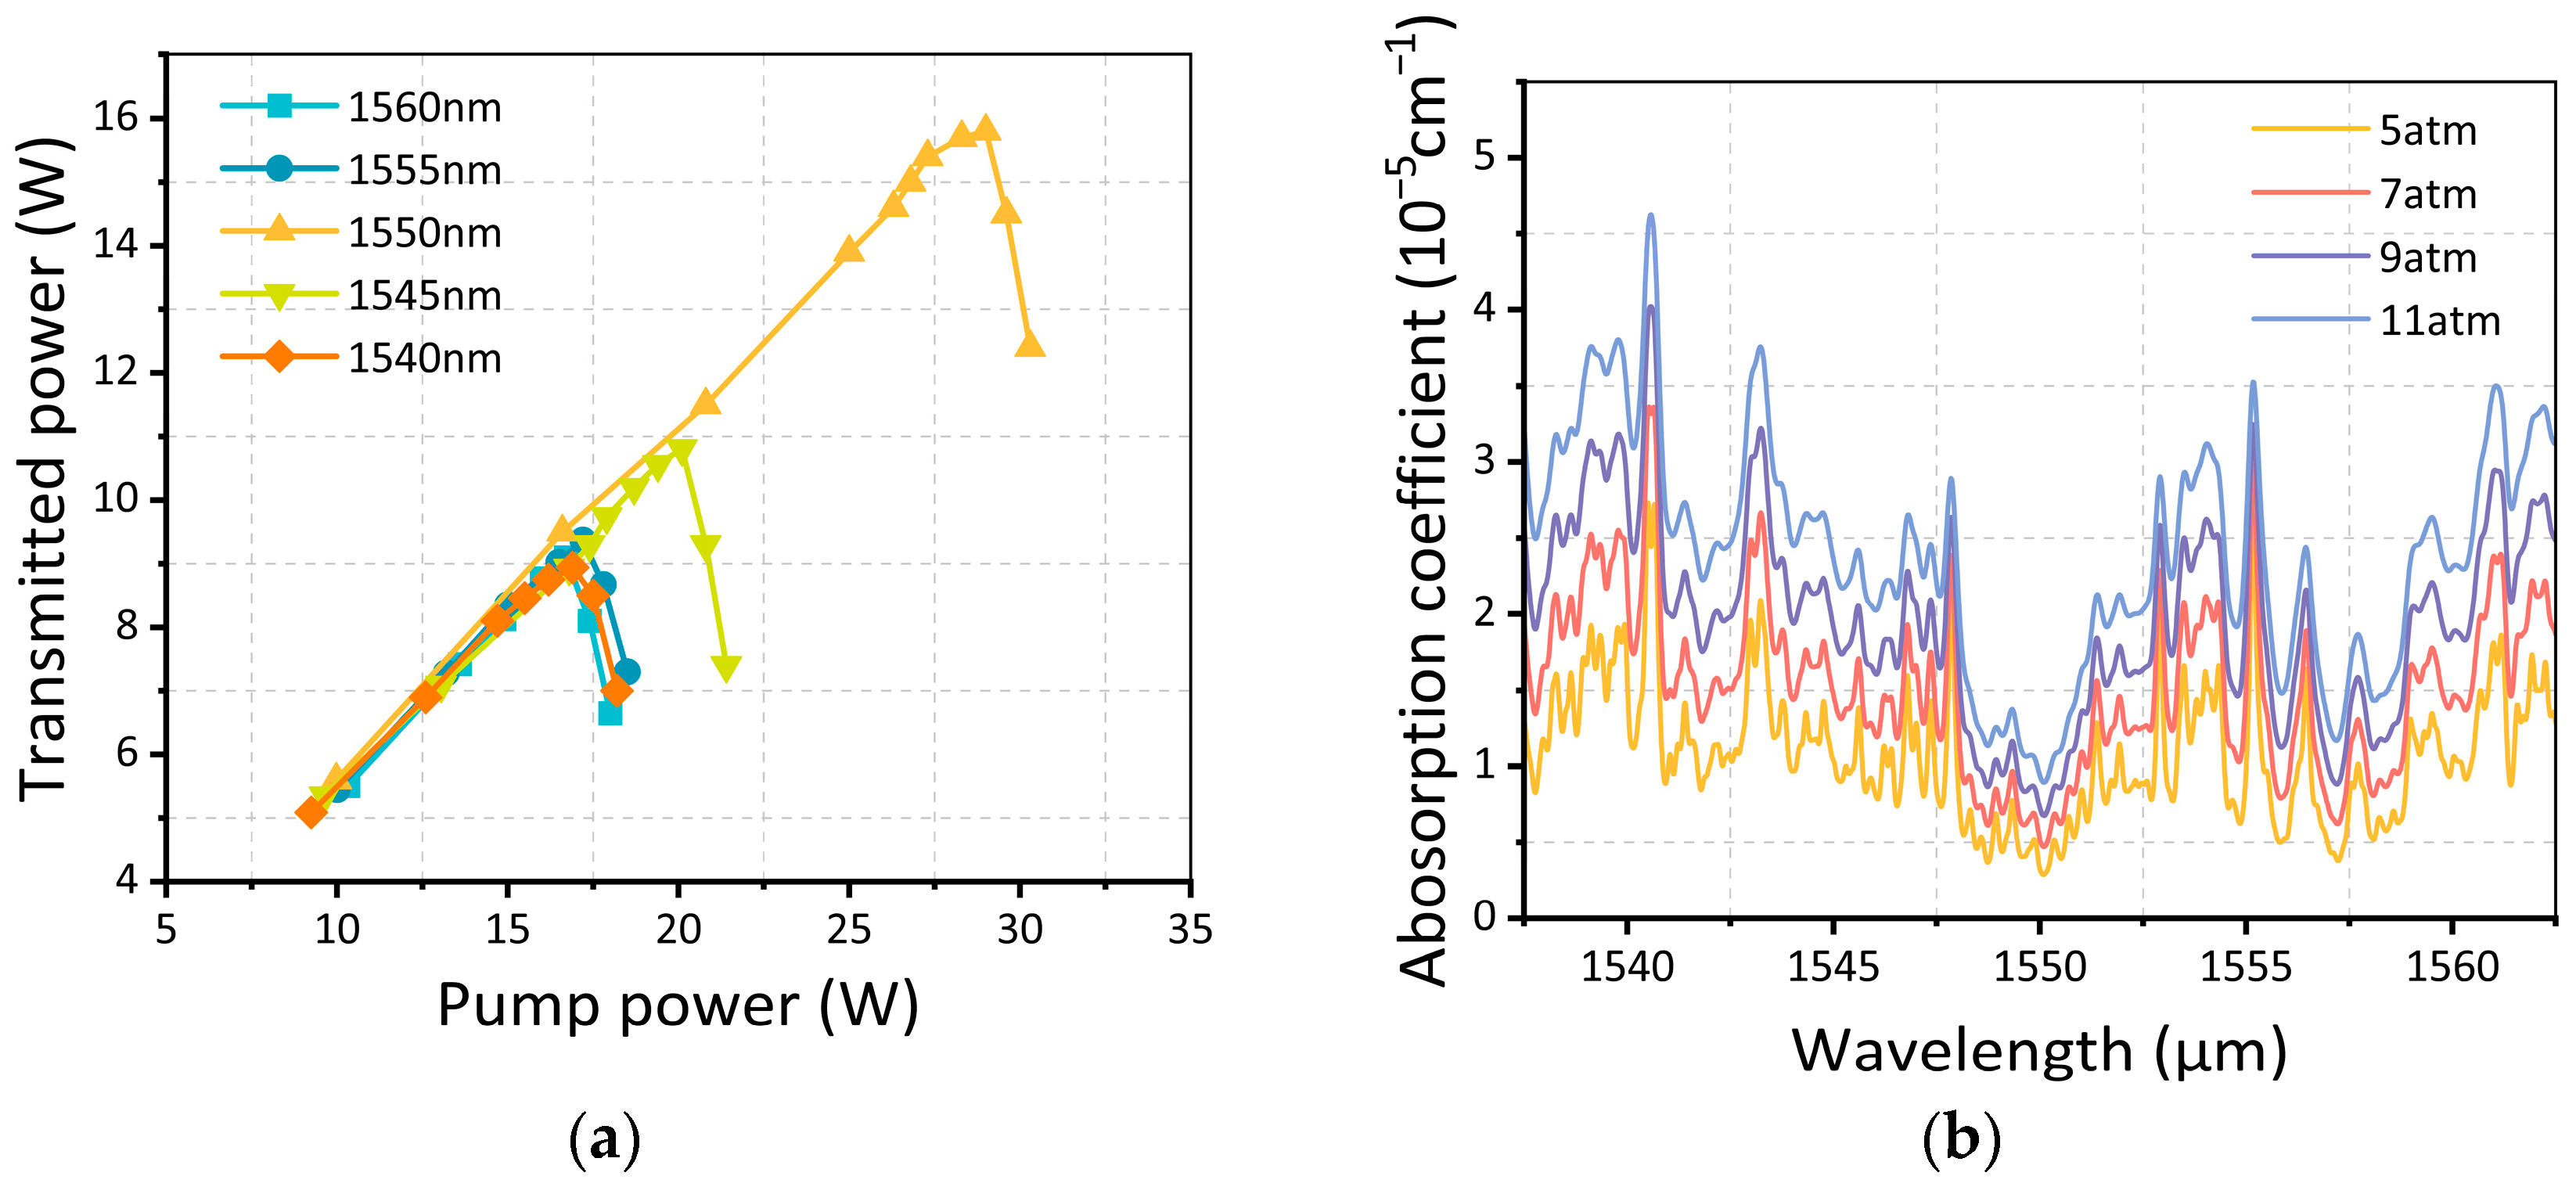
The prevailing explanation for TMI formation involves intermodal interference between the fundamental and higher-order modes, creating periodic refractive index modulation in the fiber [27]. This resulting refractive index grating facilitates energy coupling between the fundamental and higher-order modes, with the thermo-optic effect being the primary mechanism for index modulation [28]. Figure 11a shows the transmitted laser power versus injected pump power at different wavelengths. It can be observed that the threshold of TMI varied under different laser wavelengths. We hypothesized that the observed TMI originated from the thermal effect generated by methane absorption at the pump wavelength. The methane absorption data from the HITRAN database [24] support our hypothesis, as shown in Figure 11b. The weakest absorption correlates well with the highest TMI threshold at 1550 nm. However, the TMI thresholds do not align perfectly with the methane absorption curve at other wavelengths.

4. Conclusions

In summary, we achieved tunable mid-IR fiber laser output from 2812 nm to 2862 nm by pumping a 26.7 m long methane-filled HCF with a wavelength-tunable DFB laser (1545 nm to 1560 nm). We successfully increased the average power of the tunable fiber methane Raman laser operating in the 2.8 μm waveband to the watt level. With a pump pulse repetition frequency of 2 MHz and a pulse width of 4 ns, a maximum average output power of approximately 1 W was obtained in the HCF with a methane gas pressure of 0.7 MPa. Due to the relatively long length of the HCF used, the threshold peak power of SRS was only 1.7 kW. Furthermore, we observed TMI, which has rarely been reported in HCFs before. After analysis, the TMI was caused by the thermal effect generated when methane molecules absorbed the pump laser. Meanwhile, the TMI led to the leakage of the 1.5 μm pump power from the HCF, which limited further improvement in Raman power. This work provides experimental support and optimization approaches for scaling the power of tunable mid-IR fiber gas lasers in the 2.8 μm waveband. It exhibits significant application value in fields such as biomedical engineering and environmental monitoring.

Author Contributions

Conceptualization, Z.W. and P.L.; methodology, P.L.; software, W.P., L.L. and T.L.; validation, Z.W., P.L. and Z.Z.; formal analysis, Z.W. and G.L.; investigation, P.L.; resources, Z.W. and Z.Z.; data curation, Q.C., G.S. and S.W.; writing—original draft preparation, P.L.; writing—review and editing, Z.W.; visualization, P.L.; supervision, Z.W. and Z.Z.; project administration, Z.W. and Z.Z.; funding acquisition, Z.W. and Z.Z. All authors have read and agreed to the published version of the manuscript.

Funding

This work was supported by Science and Technology Innovation Program of Hunan Province (2021RC4027), Youth Independent Innovation Science Fund of National University of Defense Technology (ZK23-23), and National Natural Science Foundation of China (NSFC) (62505371).

Institutional Review Board Statement

Not applicable.

Informed Consent Statement

Not applicable.

Data Availability Statement

The data presented in this study is available upon request from the corresponding authors. The data are not publicly available due to privacy restrictions.

Conflicts of Interest

The authors declare no conflicts of interest.

References

  1. Jackson, S.D. Towards High-Power Mid-Infrared Emission from a Fibre Laser. Nat. Photonics 2012, 6, 423–431. [Google Scholar] [CrossRef]
  2. Jackson, S.D.; Jain, R.K. Fiber-Based Sources of Coherent MIR Radiation: Key Advances and Future Prospects (Invited). Opt. Express 2020, 28, 30964. [Google Scholar] [CrossRef]
  3. Grebnev, K.; Perminov, B.; Fernandez, T.T.; Fuerbach, A.; Chernysheva, M. Fluoride and Chalcogenide Glass Fiber Components for Mid-Infrared Lasers and Amplifiers: Breakthroughs, Challenges, and Future Perspective. APL Photonics 2024, 9, 110901–110921. [Google Scholar] [CrossRef]
  4. Boilard, T.; Fortin, V.; Lemieux-Tanguay, M.; Paradis, P.; Du Teilleul, P.; Carrée, J.-Y.; Vallée, R.; Bernier, M. 1.7 W Holmium-Doped Fluoroindate Fiber Laser at 3920 nm. Opt. Lett. 2024, 49, 2677. [Google Scholar] [CrossRef] [PubMed]
  5. Kotereva, T.V.; Sukhanov, M.V.; Lashmanov, E.N.; Velmuzhov, A.P.; Shiryaev, V.S. Continuous Pr3+-Doped Chalcogenide Glass Fiber Laser Emitting in the 5.60–5.83 μm Range. Opt. Mater. 2025, 168, 117528. [Google Scholar] [CrossRef]
  6. Nampoothiri, A.V.V.; Jones, A.M.; Fourcade-Dutin, C.; Mao, C.; Dadashzadeh, N.; Baumgart, B.; Wang, Y.Y.; Alharbi, M.; Bradley, T.; Campbell, N.; et al. Hollow-Core Optical Fiber Gas Lasers (HOFGLAS): A Review [Invited]. Opt. Mater. Express 2012, 2, 948. [Google Scholar] [CrossRef]
  7. Benabid, F.; Knight, J.C.; Antonopoulos, G.; Russell, P.S.J. Stimulated Raman Scattering in Hydrogen-Filled Hollow-Core Photonic Crystal Fiber. Science 2002, 298, 399–402. [Google Scholar] [CrossRef]
  8. Litchinitser, N.M.; Abeeluck, A.K.; Headley, C.; Eggleton, B.J. Antiresonant Reflecting Photonic Crystal Optical Waveguides. Opt. Lett. 2002, 27, 1592. [Google Scholar] [CrossRef]
  9. Astapovich, M.S.; Gladyshev, A.V.; Khudyakov, M.M.; Kosolapov, A.F.; Likhachev, M.E.; Bufetov, I.A. Watt-Level Nanosecond 4.42- μm Raman Laser Based on Silica Fiber. IEEE Photonics Technol. Lett. 2019, 31, 78–81. [Google Scholar] [CrossRef]
  10. Cao, L.; Gao, S.; Peng, Z.; Wang, X.; Wang, Y.; Wang, P. High Peak Power 2.8 μm Raman Laser in a Methane-Filled Negative-Curvature Fiber. Opt. Express 2018, 26, 5609. [Google Scholar] [CrossRef]
  11. Huang, W.; Wang, Z.; Zhou, Z.; Pei, W.; Cui, Y.; Li, X.; Li, Z.; Chen, J. Tunable Fiber Gas Raman Laser of 6 W at 2.9 μm by Deuterium-Filled Hollow-Core Fiber. IEEE J. Sel. Top. Quantum Electron. 2024, 30, 3292594. [Google Scholar] [CrossRef]
  12. Stübinger, S. Advances in Bone Surgery: The Er:YAG Laser in Oral Surgery and Implant Dentistry. Clin. Cosmet. Investig. Dent. 2010, 2, 47–62. [Google Scholar] [CrossRef]
  13. Wang, Z.; Zhang, B.; Liu, J.; Song, Y.; Zhang, H. Recent Developments in Mid-Infrared Fiber Lasers: Status and Challenges. Opt. Laser Technol. 2020, 132, 106497. [Google Scholar] [CrossRef]
  14. Li, Z.; Huang, W.; Cui, Y.; Wang, Z. Efficient Mid-Infrared Cascade Raman Source in Methane-Filled Hollow-Core Fibers Operating at 2.8 μm. Opt. Lett. 2018, 43, 4671. [Google Scholar] [CrossRef]
  15. Huang, W.; Cui, Y.; Li, Z.; Zhou, Z.; Chen, Y.; Wang, Z. Diode-Pumped Single-Pass Tunable Mid-Infrared Gas Raman Source by Methane-Filled Hollow-Core Fiber. Laser Phys. Lett. 2019, 16, 085107. [Google Scholar] [CrossRef]
  16. Gladyshev, A.V.; Astapovich, M.S.; Yatsenko, Y.P.; Kosolapov, A.F.; Bufetov, I.A. Nanosecond Raman Laser at 2840 nm Based on a Methane-Filled Revolver Fiber. In Proceedings of the 2020 International Conference Laser Optics (ICLO), St. Petersburg, Russia, 2–6 November 2020; p. 1. [Google Scholar]
  17. Zhang, X.; Peng, Z.; Dong, Z.; Yao, P.; Hou, Y.; Wang, P. High-Power Mid-Infrared 2.8-μm Ultrafast Raman Laser Based on Methane-Filled Anti-Resonant Fiber. IEEE Photonics Technol. Lett. 2022, 34, 1007–1010. [Google Scholar] [CrossRef]
  18. Song, W.; Sui, Q.; Zhang, Q.; Zhang, X.; Hong, D.; Qiao, S.; Wang, P. 10 Watt-Level High Energy CH4-Filled Hollow Core Fiber Picosecond Raman Laser at 2.8 μm. J. Light. Technol. 2025, 43, 9375–9381. [Google Scholar] [CrossRef]
  19. Liu, Y.; Li, W.; Wang, C.; Cui, M.; Chen, Z.; Liu, W.; Xiao, H.; Ma, P.; Wang, Z. 1.4 kW 1030 nm All-Fiber Amplifier with ~3.5 GHz Linewidth Assisted by Confined Yb-Doped Active Fiber and Cascaded Phase Modulation Technique. Opt. Express 2025, 33, 32022. [Google Scholar] [CrossRef] [PubMed]
  20. Ma, P.; Yao, T.; Liu, W.; Pan, Z.; Chen, Y.; Yang, H.; Chen, Z.; Wang, Z.; Zhou, P.; Chen, J. A 7-kW Narrow-Linewidth Fiber Amplifier Assisted by Optimizing the Refractive Index of the Large-Mode-Area Active Fiber. High Power Laser Sci. Eng. 2024, 12, e67. [Google Scholar] [CrossRef]
  21. Yu, F.; Song, P.; Wu, D.; Birks, T.; Bird, D.; Knight, J. Attenuation Limit of Silica-Based Hollow-Core Fiber at Mid-IR Wavelengths. APL Photonics 2019, 4, 080803. [Google Scholar] [CrossRef]
  22. Benabid, F.; Bouwmans, G.; Knight, J.C.; Russell, P.S.J.; Couny, F. Ultrahigh Efficiency Laser Wavelength Conversion in a Gas-Filled Hollow Core Photonic Crystal Fiber by Pure Stimulated Rotational Raman Scattering in Molecular Hydrogen. Phys. Rev. Lett. 2004, 93, 123903. [Google Scholar] [CrossRef]
  23. Murray, J.; Goldhar, J.; Eimerl, D.; Szoke, A. Raman Pulse Compression of Excimer Lasers for Application to Laser Fusion. IEEE J. Quantum Electron. 1979, 15, 342–368. [Google Scholar] [CrossRef]
  24. Wang, Z.; Yu, F.; Wadsworth, W.J.; Knight, J.C. Efficient 1.9 μm Emission in H2-Filled Hollow Core Fiber by Pure Stimulated Vibrational Raman Scattering. Laser Phys. Lett. 2014, 11, 105807. [Google Scholar] [CrossRef]
  25. Ottusch, J.J.; Rockwell, D.A. Measurement of Raman Gain Coefficients of Hydrogen, Deuterium, and Methane. IEEE J. Quantum Electron. 1988, 24, 2076–2080. [Google Scholar] [CrossRef]
  26. Eidam, T.; Wirth, C.; Jauregui, C.; Stutzki, F.; Jansen, F.; Otto, H.-J.; Schmidt, O.; Schreiber, T.; Limpert, J.; Tünnermann, A. Experimental Observations of the Threshold-like Onset of Mode Instabilities in High Power Fiber Amplifiers. Opt. Express 2011, 19, 13218. [Google Scholar] [CrossRef] [PubMed]
  27. Jauregui, C.; Eidam, T.; Limpert, J.; Tünnermann, A. Impact of Modal Interference on the Beam Quality of High-Power Fiber Amplifiers. Opt. Express 2011, 19, 3258–3271. [Google Scholar] [CrossRef]
  28. Smith, A.V.; Smith, J.J. Mode Instability in High Power Fiber Amplifiers. Opt. Express 2011, 19, 10180. [Google Scholar] [CrossRef]
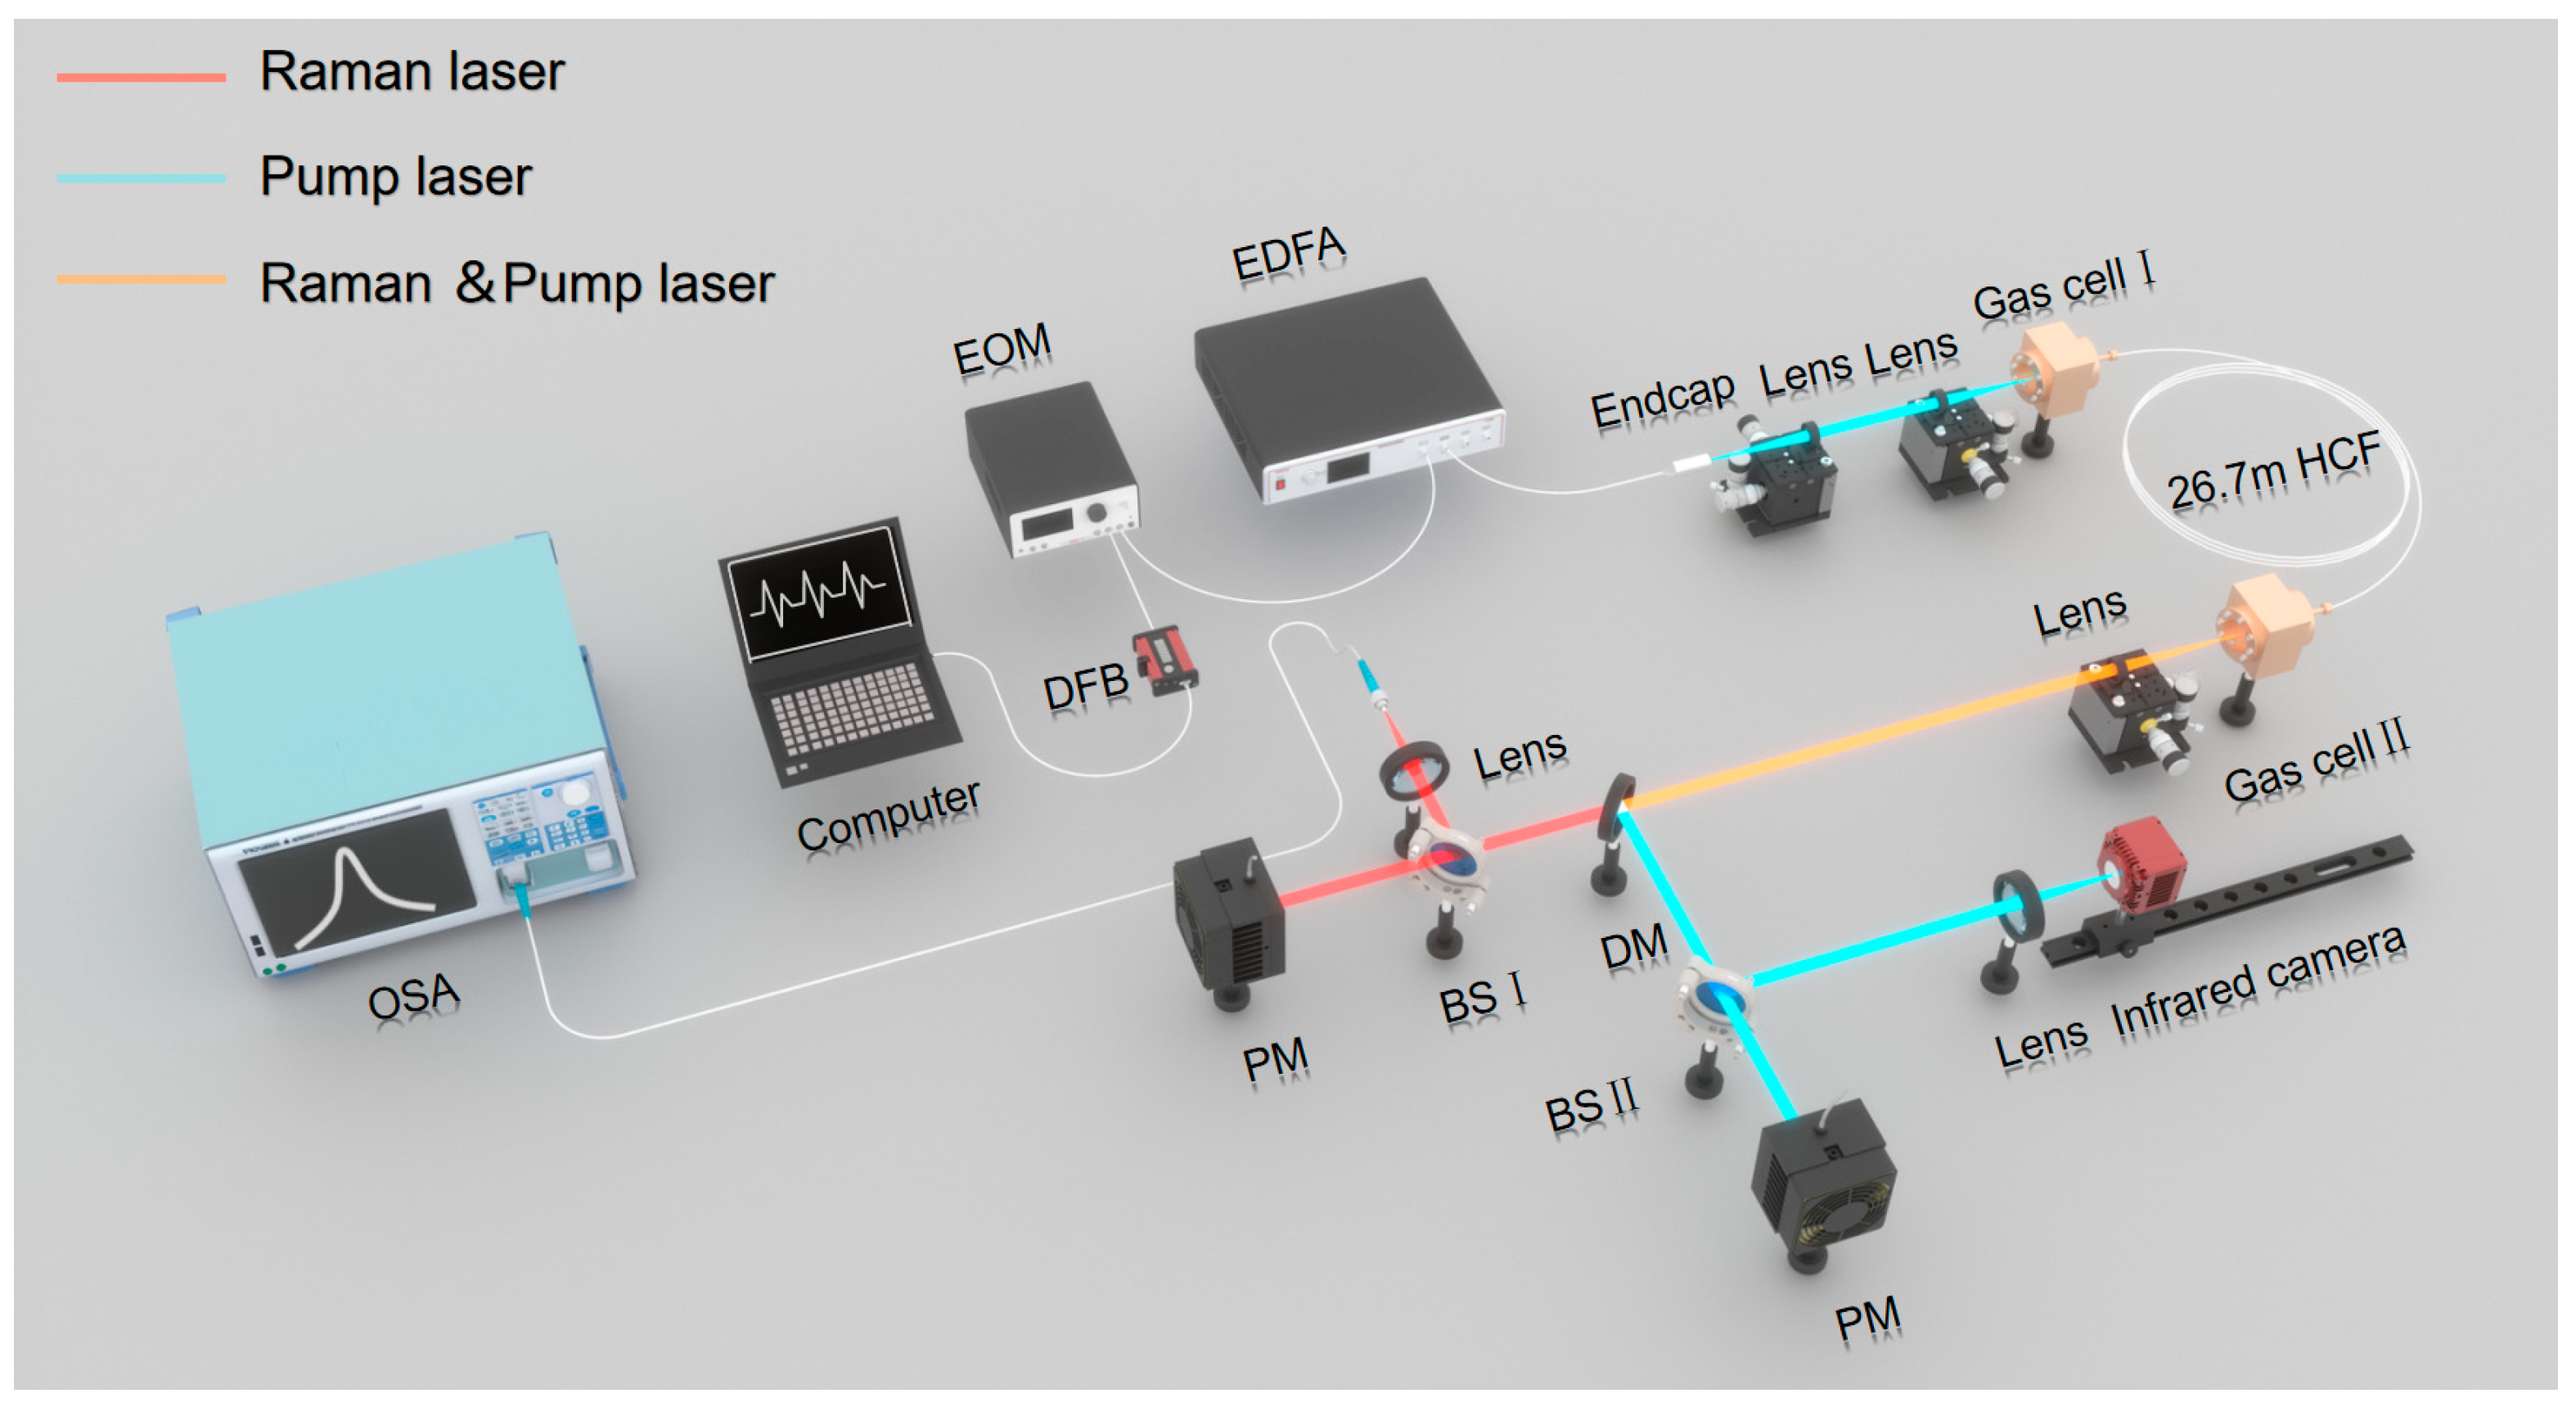
Figure 1. Experimental setup. OSA: optical spectrum analyzer; EOM: electro-optic modulator; EDFA: erbium-doped fiber amplifier; DM: dichroic mirror; BS: beam splitter; PM: power meter.
Photonics 12 01137 g001
Figure 2. Measured transmission spectrum of the HCF. Inset: SEM of the HCF.
Photonics 12 01137 g002
Figure 3. (a) Measured spectra of the Raman laser and residual pump laser at a pressure of 0.7 MPa. (b) Detailed spectra of a Raman laser at a pressure of 0.7 MPa.
Photonics 12 01137 g003
Figure 4. Residual pump spectra at different power levels.
Photonics 12 01137 g004
Figure 5. (a) Evolutions of EDFA output power versus LD power at different wavelengths. (b) Maximum output power of EDFAs at different wavelengths.
Photonics 12 01137 g005
Figure 6. (a) Evolution of Raman power with pump power pumped by 1550 nm laser under different pressures and repetition frequencies. (b) Evolution of Raman power with pump power pumped by different wavelengths under pressure of 0.7 MPa and repetition frequency of 2 MHz.
Photonics 12 01137 g006
Figure 7. (a) Comparison graph of variation trends between Raman power and residual pump power. (b) Evolution of residual pump power with pump power under pressure of 0.7 MPa and repetition frequency of 2 MHz.
Photonics 12 01137 g007
Figure 8. Raman threshold of peak power with methane pressure in a 26.7 m HCF. The discrete points are the measured data. The solid line is calculated from Equation (1).
Photonics 12 01137 g008
Figure 9. Temporal evolution of the profiles of the beam output from the HCF.
Photonics 12 01137 g009
Figure 10. Fourier transform spectra of the temporal signals of the transmitted 1.5 μm laser at different pump power levels. Inset: beam profile of the transmitted power.
Photonics 12 01137 g010
Figure 11. (a) Evolution of transmitted laser power with pump power at different wavelengths. (b) The absorption coefficients of methane at different gas pressures and wavelengths.
Photonics 12 01137 g011
Table 1. The research progress on fiber methane Raman lasers operating in the 2.8 μm band.
TimeWavelength
(μm)
Average Power
(W)
Wavelength
Tunability
Reference
20182.8120.113No[10]
20182.8080.014No[14]
20192.796–2.8630.034Yes[15]
20202.8400.56No[16]
20222.8074No[17]
20252.80710.3No[18]
Disclaimer/Publisher’s Note: The statements, opinions and data contained in all publications are solely those of the individual author(s) and contributor(s) and not of MDPI and/or the editor(s). MDPI and/or the editor(s) disclaim responsibility for any injury to people or property resulting from any ideas, methods, instructions or products referred to in the content.