Abstract
This study adapts Fourier ptychography (FP) for high-resolution imaging in machine vision settings. We replace multi-angle illumination hardware with a single fixed light source and controlled object translation to enable a sequence of slightly shifted low-resolution frames to produce the requisite frequency-domain diversity for FP. The concept is validated in simulation using an embedded pupil function recovery algorithm to reconstruct a high-resolution complex field, recovering both amplitude and phase. For conveyor-belt transport, we introduce a lightweight preprocessing pipeline—background estimation, difference-based foreground detection, and morphological refinement—that yields robust masks and cropped inputs suitable for FP updates. The reconstructed images exhibit sharper fine structures and enhanced contrast relative to native lens imagery, indicating effective pupil synthesis without multi-LED arrays. The approach preserves compatibility with standard industrial optics and conveyor-style acquisition while reducing hardware complexity. We also discuss practical operating considerations, including blur-free capture and synchronization strategies.
1. Introduction
Machine vision technology is a key element in automating production processes and implementing smart factories [1,2,3,4,5]. Machine vision technology can replace or assist human visual judgment in diverse fields such as manufacturing, robotics, and quality inspection. It has contributed to the precise detection and analysis of objects in real time through various image processing methods. Therefore, introducing machine vision systems into production processes can significantly contribute to improving product quality and reducing defect rates, ultimately increasing productivity and profits. However, these traditional machine vision systems still have fundamental limitations due to their dependence on the physical constraints of the optical system itself.
Traditional imaging systems suffer from an inherent tradeoff between resolution and field of view (FOV) [6,7,8]. This tradeoff also applies to machine vision systems, which limits their performance and speed. The field of view (FOV) refers to the observable area that a camera can capture in a single image, determining the extent of the scene the system can analyze at a given moment. Resolution, on the other hand, represents the size of the smallest detail the system can distinguish within an image. High resolution typically requires a high numerical aperture (NA), but this inevitably narrows the observable FOV and reduces the working distance and depth of focus. Therefore, machine vision systems with a high resolution cannot simultaneously observe wide areas, and systems that can measure wide areas must trade off resolution.
To overcome these optical limitations, a new paradigm called computational imaging, which combines optical data acquisition with computational reconstruction, has emerged [9,10,11]. Computational imaging is a revolutionary approach that achieves imaging performance previously impossible with physical optical systems alone. This technology shifts the focus from addressing the physical limitations of expensive, high-performance optical components to designing efficient information recovery algorithms. While traditional machine vision systems rely on high-performance hardware, such as high-precision XY stages and expensive, high-resolution lenses, computational imaging utilizes inexpensive, low-magnification lenses and programmable illumination modules, enabling a software-centric approach that uses algorithms to fill in the missing information. This approach reduces system construction costs and enables high-resolution imaging over large areas without complex mechanical scanning. Fourier ptychography (FP) is a representative example of computational imaging. It successfully overcomes the tradeoff between resolution and field of view, a limitation of traditional optics, by acquiring and computationally fusing multiple low-resolution images [12,13,14,15]. FP acquires a series of low-resolution images sequentially using illumination from multiple angles. These low-resolution images are then synthesized into a single high-resolution image through an iterative phase retrieval process. Therefore, traditional Fourier ptychography (FP) systems require programmable multi-LED arrays [16,17] or aperture scanning methods [18,19,20,21,22] to illuminate the sample from various illumination angles. However, the multi-LED illumination schemes of existing FP systems entail complex hardware configurations and high costs, and implementation limitations are particularly problematic in industrial machine vision environments (Figure 1).
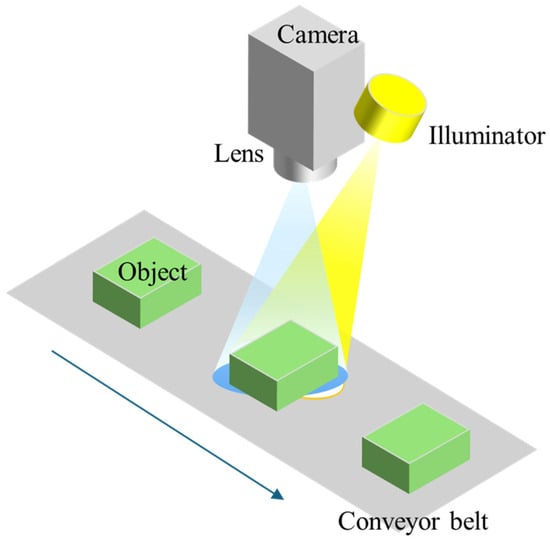
Figure 1.
Schematic illustration of a typical machine vision system integrated with a conveyor belt. Objects are transported on the conveyor, illuminated by an external light source, and captured by a camera through an imaging lens.
2. Essentials of Fourier Ptychography
As mentioned in the previous section, FP is a computational imaging technique designed to simultaneously achieve the wide field of view (FOV) and high resolution of conventional microscopes. FP creates high-resolution images by capturing a series of low-resolution images from various illumination angles and synthesizing them to reconstruct a high-resolution image. FP uniquely combines two key optical technologies: synthetic aperture and phase retrieval [12]. The synthetic aperture principle was originally used in radio telescopes to combine images from multiple small telescopes to mimic a single, massive telescope [23]. FP similarly stitches together multiple low-resolution images acquired with illumination from various angles in Fourier space, creating a virtual, wider “synthetic NA” that overcomes the limitations of low-NA lenses. A typical FP system is configured as shown in Figure 2, in which the FP is similar to a conventional microscope setup, but with the addition of an LED illuminator with multiple light sources to capture a series of low-resolution images illuminated from various angles. The FP imaging process is based on the Fourier transformation and the shift theorem. When an object is illuminated with tilted plane wave illumination, the object’s Fourier spectrum shifts in Fourier space proportional to the angle of illumination. The lens itself performs the Fourier transform, and its finite numerical aperture (NA) acts as a low-pass filter, allowing low-frequency information to pass through in Fourier space. The FP sequentially acquires a series of low-resolution images using multiple angles of illumination, each containing spectral information located in a different region of Fourier space. The FP reconstruction algorithm synthesizes these scattered spectra into a single, high-resolution complex image through an iterative phase retrieval process.
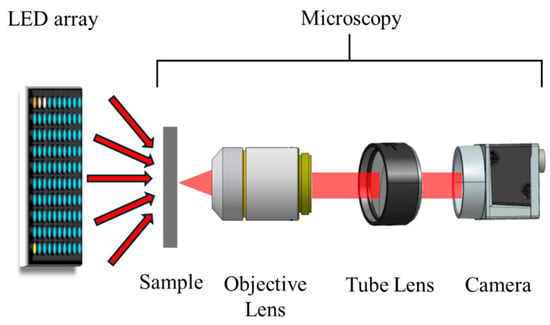
Figure 2.
Schematic diagram of the existing FP system. The red arrows conceptually indicate that the angle of the lighting changes depending on the position of the LED.
3. Workflow of the Proposed Machine Vision System
The proposed system utilizes multiple low-resolution images acquired through multi-image capture utilizing sample movement in a typical single-light-source machine vision system to reconstruct a high-resolution image using the image restoration algorithm of existing FPs. Therefore, as shown in Figure 3, the proposed machine vision system consists of three main stages: the image capture stage, the object extraction stage, and the FP reconstruction algorithm stage.
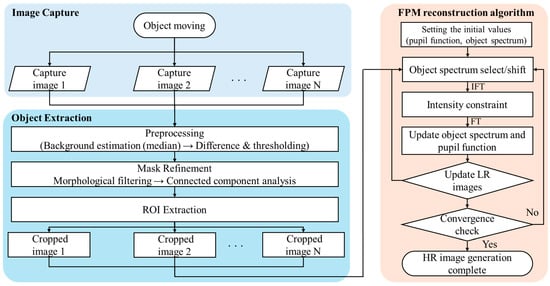
Figure 3.
Workflow of FP based on moving objects for machine vision: A moving object generates multiple images. Preprocessing (background estimation, difference, morphology, and connected components) is performed to crop the region of interest (ROI) into a low-resolution object image. The final HR image of the object is reconstructed through iterative FP updates (spectral shift, IFT/FT, and intensity constraints).
3.1. Image Capture
To verify the performance of the machine vision system proposed in this paper, we generated multiple images, assuming a situation where an arbitrary object is being transported on a conveyor belt, as shown in Figure 4. The generated images were used to optimize the next step, the object extraction algorithm. In the case of images acquired by an actual machine vision system, optical distortion occurs due to the optical system and camera. In optical systems with a wide FOV, optical distortion increases the farther away the image is from the machine vision system’s optical axis. Therefore, to prevent this distortion, it is important to configure the system so that the object is captured as close to the center of the camera as possible. This is a key consideration when configuring the simulation setup in Chapter 4. In addition, the lighting conditions were not taken into consideration for the generated images. Since changes in lighting conditions are a very important parameter for FP high-resolution image reconstruction, they will be discussed separately in Chapter 3.3: FP high-resolution image reconstruction stage.
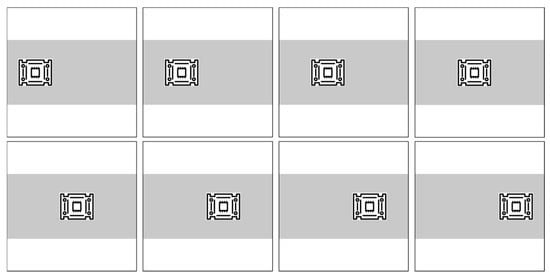
Figure 4.
Example images generated under the assumption of object transport on a conveyor belt for optimization of the ROI extraction algorithm.
3.2. ROI Extraction
In the proposed machine vision system, in the image capture step, N images containing a moving object are captured, as shown in Figure 4. Using the captured raw images, in order to apply the FPM reconstruction algorithm, a process is required to separately extract only the object by designating it as a region of interest (ROI). To this end, background modeling and a difference image-based foreground segmentation technique are combined so that only the object can be independently extracted even in the overlapping area of the before and after images. The ROI extraction step consists of the background estimation step, the foreground candidate detection step, the mask refinement and component analysis step, and the final ROI extraction step. First, in the background estimation step, to estimate the static background from the captured N images, the median is taken for each pixel location () as in Equation (1) [24,25]:
where is a static background image, and is the nth captured image. defined in this way is a static background image with minimal influence from moving objects in the entire image. Based on this, the difference between each image and the background image can be calculated as in Equation (2) to detect foreground candidates.
where represents the intensity value of the image obtained by subtracting the intensity value of the nth image and the intensity value of the static background image. The larger the value of , the higher the probability that the area contains an object. Therefore, by setting an appropriate threshold, T, in , the threshold image, , which distinguishes between the object and background areas, can be calculated as in Equation (3) [26].
The resulting binary image may be noisy, so morphological operations such as opening and closing operations are applied to smooth the outline of the object and preserve its shape [27]. The final binary image can be used as a mask to extract the ROI. In Figure 5, the mask image generated based on the image generated in Figure 4 is shown.
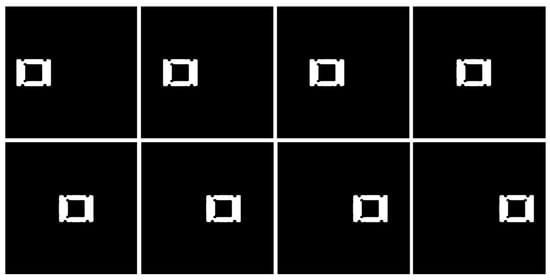
Figure 5.
Foreground mask obtained during the ROI extraction process based on background subtraction. After background estimation, the initial foreground candidates were detected through difference imaging and thresholding, and morphological operations were applied to remove noise and fill holes.
The resulting mask may contain multiple blobs. Connected component analysis (CCA) is used to divide connected pixels into groups, and only the component with the largest area, , is selected. Finally, the object mask is used to calculate the minimum circumscribed rectangle of using the axis-aligned bounding box (AABB) method [28,29]. The AABB method defines the ROI by finding the smallest rectangle parallel to the x and y axes of the image coordinate system, making it simple and fast to calculate. However, AABB has the disadvantage of selecting an unnecessarily large area if the object has an irregular shape or is randomly placed. However, the AABB method is considered suitable for objects moving parallel to the conveyor belt. Repeating this process on the captured image yields a low-resolution image of a series of objects with consistent sizes, as shown in Figure 6. This low-resolution image can be used as a raw image to reconstruct a high-resolution FP image.
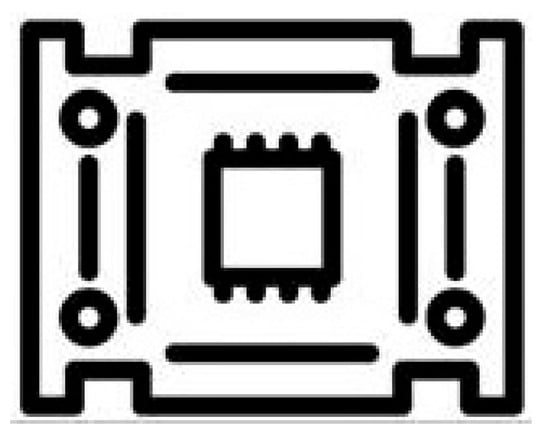
Figure 6.
Final extracted ROI image. The image is a low-resolution rectangular crop, which can be utilized as a raw input for the high-resolution FP reconstructed image.
3.3. FP Reconstruction Algorithm
The FP reconstruction algorithm restores a high-resolution image by applying the embedded pupil function recovery (EPRY) method, which can simultaneously restore the Fourier spectrum of the object and the pupil function of the lens without prior optical aberration correction [30]. The EPRY algorithm is an algorithm that can analyze and correct aberrations across the entire FOV and has low computational complexity, so it is widely used in various FP studies [31,32,33].
The EPRY algorithm starts by first setting up the initial pupil function, , and the object spectrum, . is set to a circular low-pass region in the frequency domain determined by the NA of the lens. is used as an initial estimate by applying the pupil function to the Fourier transform of the cropped low-resolution images and updating the spectrum of the object. The method for creating a predicted image in the m-th iteration can be summarized as follows: In the Fourier transform of the estimated high-resolution image , the shifted region is multiplied by the estimated pupil function to obtain the shifted spectrum in the Fourier plane. Then, in order to utilize the captured intensity image as a constraint, an inverse Fourier transform is performed on to obtain . The formula for applying the intensity constraint to the captured image is shown in Equation (4).
Using the estimated spectrum and the Fourier transform of the image with intensity constraints , the high-resolution spectrum to be used in the next loop is obtained through Equation (5).
where * denotes a conjugate complex number and a is a constant that adjusts the updated step size. In this paper, a = 1 is used. The pupil function is also updated using the equation below. The pupil function is also updated as in Equation (6).
where b is a constant that controls the update size, and the update was performed assuming b = 1. This process is repeated for all images, completing one iteration of EPRY-FP. This iteration for all images is repeated until the image converges, resulting in a high-resolution image.
4. Simulation Setup and Results
To simulate the resolution enhancement effects of a machine vision system, the specifications of the camera and lens used in the system are summarized in Table 1. The camera used in the simulation has a standard 2/3-inch sensor with 2840 × 2840 pixels measuring 2.74 μm.

Table 1.
Camera specifications used in the optical setup for simulation.
The specifications of the lens used in the simulation are shown in Table 2. The lens used in the simulation has an F-number of 8, the distance from the lens surface to the object plane is 100 mm, and the field of view of the lens is 60°. Considering the sensor size and the FOV of the lens, the magnification of the lens is calculated to be 0.0677.

Table 2.
Lens specifications used in the optical setup for simulation.
A schematic diagram of the layout of the major components for the simulation is shown in Figure 7. All simulation conditions were considered along only one axis, which was the conveyor belt’s travel direction. Therefore, the resolution enhancement simulation was also limited to one axis. If resolution enhancement is required across more than two axes, additional mechanical considerations, such as the placement of a rotation stage, are required.
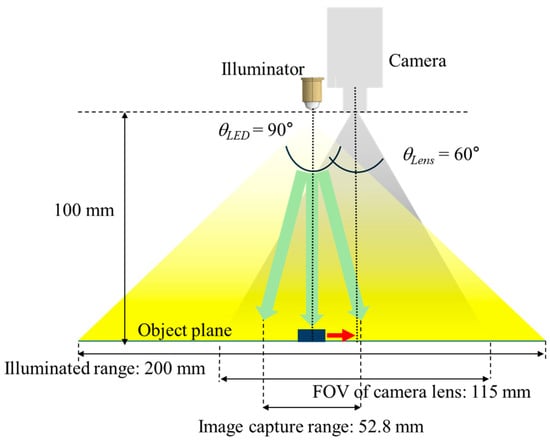
Figure 7.
Schematic diagram of the layout of the main components of the proposed machine vision system for simulation. The green arrows conceptually represent the spread of light from the Illuminator. Therefore, as the object moves, the angle of illumination reaching the object changes.
To avoid interference between the illuminator light source and the camera lens surface, they were assumed to be at the same height, separated by 100 mm from the object’s moving surface. The illuminator’s light emission angle is 90°, and considering the height and angle, it illuminates a 200 mm area on the object plane. The camera’s field of view (FOV) is 60°, so the FOV on the object plane is expected to be 115 mm. Since the low-resolution image required for FP requires an image of an object captured by light incident from different angles, the standard for the position for capturing the low-resolution image must be calculated based on the origin where the illuminator is placed. If the low-resolution image of FP considers a 58.71% overlap, an image is captured every 0.3 mm when moving, and if the FP algorithm is performed through a total of 177 images, the image capture range is ± 26.4 mm, and the secured illumination NA value is 0.25.
Because FP technology is often used in existing microscope systems, the numerical aperture (NA) has been commonly used as a measure to evaluate the resolution of the system. However, the standard for evaluating the resolution of cameras used in machine vision systems is generally the f-number. This difference arises from the different evaluation planes of the two technologies. The NA value directly reflects the angle of light received at the object surface and the refractive index of the medium, allowing for an immediate indication of the object’s resolution. On the other hand, the f-number is defined as the focal length divided by the diameter of the entrance pupil, and is directly related to light collection, diffraction blur, and exposure, accurately reflecting performance at the image plane. Microscopes are configured with high magnifications, so the object plane resolution is key. In contrast, machine vision systems are typically configured with low magnifications, so the blur generated at the sensor side often becomes the resolution limit of the system. Therefore, the optical system used in machine vision systems, unlike the objective lens of a microscope, uses the f-number as a standard for resolution. As is well known, the resolution improvement effect of the FP system is considered in the form of a synthetic NA that combines the NA of the illumination and the NA of the objective lens. Therefore, the f-number used in machine vision systems needs to be referred to as the object plane NA. To this end, the relationship between the f-number in the image plane and the NA in the object plane is first defined. First, the f-number in the image space and the f-number in the object space can be expressed by Equation (7) by considering the magnification of the lens and the pupil magnification.
where is the f-number on the image plane, is the f-number on the object plane, m is the magnification of the system, and γ is the pupil magnification. In a general optical system, γ can be assumed to be 1, and if the approximate formula is used, the relationship between and can be expressed as Equation (8).
Therefore, if the simulation conditions and are substituted, the of the machine vision system is calculated as 0.067, and if this value and the lighting NA value are added, the synthetic NA value of the machine vision system is 0.317.
As mentioned above, the high-resolution image reconstruction simulation of FP proceeded only in one axis, which was the conveyor-belt transport direction. Therefore, the resolution improvement mainly affects the vertical lines in the transport direction, so a resolution chart image was created in the form of increasingly narrow vertical line spacing, as in Figure 8a, and this was used for system verification. When the image in Figure 8a is observed with a lens with an NA of 0.067 of the machine vision system, the vertical lines with high resolution, as in Figure 8b, are not distinguishable. However, when the resolution chart generated with a synthetic NA of 0.317 is restored to a high-resolution image by applying the FP algorithm, it can be confirmed that smaller lines can be observed compared to the image to which FP is not applied, as shown in Figure 8c.
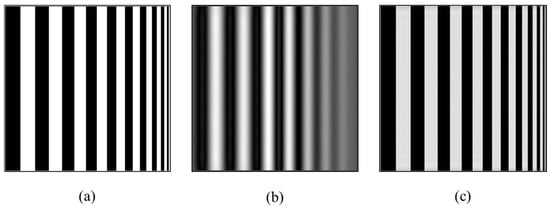
Figure 8.
(a) A generated resolution chart for resolution enhancement simulation to verify the performance of the proposed machine vision system, (b) a simulated image degraded by a lens of a machine vision system with an NA of 0.067, (c) a simulated image restored with a synthetic NA of 0.317 using the FP reconstruction algorithm.
5. Object Transport Speed and Camera Exposure Time
In addition, when photographing a moving object, motion blur occurs due to the object’s movement. This is because the subject changes its image position on the sensor during the exposure time , so the subject’s boundary cannot remain in one pixel but continuously leaves a trace. Therefore, when assuming a situation in which an object continuously moves on a conveyor belt like this system, it is necessary to consider the optimal exposure time that does not cause motion blur and the object’s transport speed on the conveyor belt. The length of the motion blur on the image plane is defined by Equation (9).
where is the object’s movement speed in the image plane, and is the camera’s exposure time. The moving speed of an object in the image plane is the product of the moving speed of the object in the object plane and the multiplication factor. Since the speed of the conveyor belt is equal to the moving speed of the object in the object plane, and the blur length in the image plane are defined as in Equation (10).
where m is the magnification of the optical system, and is the speed of the conveyor belt. In order to avoid blurring in the image, must exist inside the pixel during the exposure time. Assuming that all spots are located at the center of the pixel when the image is formed and that is acceptable at about 0.5 times the pixel size, the final speed of the conveyor belt is as shown in Equation (11).
where p is the pixel size. In general, the fastest exposure time of a machine vision camera is approximately 1 μs, and referring to Table 1 and Table 2 summarized above, the pixel size of the camera used in the simulation and the magnification of the system are 2.74 μm and 0.0677, respectively. Considering this, can have a value of at least 20.24 mm/s. The speed of the conveyor belt that transports small electronic components such as PCBs or SMT varies greatly, but is generally known to be in the range of 8 mm/s to 100 mm/s. Therefore, it is expected that the proposed system can obtain sufficiently high-resolution images without significantly reducing the speed of the inline process.
6. Summary and Conclusions
In this paper, we demonstrate through simulation that high-resolution imaging can be achieved in a low-magnification machine vision environment by generating multiple illumination angles using only a single light source and object transport and applying this to FP’s high-resolution image reconstruction algorithm. The proposed system extracts the region of interest (ROI) of the object to be measured from the multiple images acquired during the transport process into a low-resolution image using an ROI extraction algorithm, and then applies the FP algorithm to the obtained image to improve the resolution. The proposed technology has the advantage of replacing the complex multi-LED array illuminator of the existing FP in terms of hardware, enabling the implementation of an FP system with low system complexity and high compatibility with industrial conveyor/transport lines. The proposed system’s performance was verified through simulation by configuring an appropriate optical system. By replacing the illumination angle scanning with object transport, a total of 177 images were acquired, demonstrating a composite NA of 0.317, representing a resolution improvement of approximately 4.7 times compared to the existing system. Furthermore, by considering the potential motion blur during object transport, design constraints between the exposure time, transport speed, magnification, and pixel size were proposed based on the allowable blur limit. The upper transport speed limit in the implemented system was calculated to be 12.14 mm/s, suggesting practical operation in inline environments through speed control or pulsed illumination within the typical electronic component transport speed range.
The proposed method effectively enhances machine vision resolution using computational imaging techniques without the need for complex lighting equipment. However, this study was validated through simulations based on single-axis transport. For practical application, further research is needed on optimizing machine vision systems with a rotary stage for complex object measurement and on real-time, high-speed image processing methods that consider reconstruction speed and processing delay. In conclusion, this approach, which combines single-light-source transport-based multi-frame capture and FP reconstruction, demonstrates the potential for a lightweight, low-cost solution for achieving high-resolution imaging in low-magnification machine vision systems. Through future expansion to actual line data and generalization to multi-axis lighting, simultaneous improvements in optical resolution and throughput within the process can be expected.
Author Contributions
Conceptualization, J.H. and H.C.; methodology, G.O. and J.H.; validation, G.O. and H.C.; data curation, G.O.; writing—original draft preparation, G.O., J.H. and H.C.; writing—review and editing, G.O. and H.C.; visualization, G.O.; supervision, J.H. and H.C.; project administration, H.C.; funding acquisition, H.C. All authors have read and agreed to the published version of the manuscript.
Funding
This work was supported by a National Research Foundation of Korea (NRF) grant funded by the Korean government (MSIT) [grant number: NRF-2022R1I1A3063410] and the Glocal University 30 Project Fund of Gyeongsang National University in 2025.
Data Availability Statement
All Data are available from the authors upon reasonable request.
Conflicts of Interest
The authors declare no conflicts of interest.
References
- Davies, E.R. Machine Vision: Theory, Algorithms, Practicalities; Morgan Kaufmann: San Francisco, CA, USA, 2004. [Google Scholar]
- Ren, Z.; Fang, F.; Yan, N.; Wu, Y. State of the Art in Defect Detection Based on Machine Vision. Int. J. Precis. Eng. Manuf.-Green. Technol. 2022, 9, 661–691. [Google Scholar] [CrossRef]
- Golnabi, H.; Asadpour, A. Design and Application of Industrial Machine Vision Systems. Robotics Comput.-Integr. Manuf. 2007, 23, 630–637. [Google Scholar] [CrossRef]
- Zhang, M.; Chauhan, V.; Zhou, M. A Machine Vision Based Smart Conveyor System. In Thirteenth International Conference on Machine Vision; SPIE: Rome, Italy, 2021; Volume 11605, pp. 84–92. [Google Scholar] [CrossRef]
- Arsalan, M.; Aziz, A. Low-Cost Machine Vision System for Dimension Measurement of Fast Moving Conveyor Products. In Proceedings of the International Conference on Open Source Systems & Technologies (ICOSST 2012), Lahore, Pakistan, 20–22 December 2012; pp. 22–27. [Google Scholar] [CrossRef]
- Lohmann, A.W. Space–Bandwidth Product of Optical Signals and Systems. J. Opt. Soc. Am. A 1996, 13, 470–473. [Google Scholar] [CrossRef]
- Neifeld, M.A. Information, Resolution, and Space–Bandwidth Product. Opt. Lett. 1998, 23, 1477–1479. [Google Scholar] [CrossRef]
- Park, J.; Brady, D.J.; Zheng, G. Review of Bio-Optical Imaging Systems with a High Space-Bandwidth Product. Adv. Photonics 2021, 3, 044001. [Google Scholar] [CrossRef] [PubMed]
- Mait, J.N.; Euliss, G.W.; Athale, R.A. Computational Imaging. Adv. Opt. Photon. 2018, 10, 409–483. [Google Scholar] [CrossRef]
- Cossairt, O.S.; Miau, D.; Nayar, S.K. Gigapixel Computational Imaging. In 2011 IEEE International Conference on Computational Photography (ICCP); IEEE: Pittsburgh, PA, USA, 2011; pp. 1–8. [Google Scholar] [CrossRef]
- Heide, F.; Rouf, M.; Hullin, M.B.; Labitzke, B.; Heidrich, W.; Kolb, A. High-Quality Computational Imaging through Simple Lenses. ACM Trans. Graph. 2013, 32, 149. [Google Scholar] [CrossRef]
- Zheng, G.; Horstmeyer, R.; Yang, C. Wide-Field, High-Resolution Fourier Ptychographic Microscopy. Nat. Photonics 2013, 7, 739–745. [Google Scholar] [CrossRef]
- Konda, P.C.; Loetgering, L.; Zhou, K.C.; Xu, S.; Harvey, A.R.; Horstmeyer, R. Fourier Ptychography: Current Applications and Future Promises. Opt. Express 2020, 28, 9603–9630. [Google Scholar] [CrossRef]
- Zheng, G.; Shen, C.; Jiang, S.; Song, P.; Yang, C. Concept, Implementations and Applications of Fourier Ptychography. Nat. Rev. Phys. 2021, 3, 207–223. [Google Scholar] [CrossRef]
- Xu, F.; Wu, Z.; Tan, C.; Liao, Y.; Wang, Z.; Chen, K.; Pan, A. Fourier Ptychographic Microscopy 10 Years on: A Review. Cells 2024, 13, 324. [Google Scholar] [CrossRef]
- Tian, L.; Li, X.; Ramchandran, K.; Waller, L. Multiplexed Coded Illumination for Fourier Ptychography with an LED Array Microscope. Biomed. Opt. Express 2014, 5, 2376–2389. [Google Scholar] [CrossRef]
- Dong, S.; Shiradkar, R.; Nanda, P.; Zheng, G. Spectral multiplexing and coherent-state decomposition in Fourier ptychographic imaging. Biomed. Opt. Express 2014, 5, 1757–1767. [Google Scholar] [CrossRef]
- Ou, X.; Zheng, G.; Yang, C. Aperture-Scanning Fourier Ptychographic Microscopy. Biomed. Opt. Express 2016, 7, 3140–3150. [Google Scholar] [CrossRef]
- Choi, G.-J.; Lim, J.; Jeon, S.; Cho, J.; Lim, G.; Park, N.-C.; Park, Y.-P. Dual-Wavelength Fourier Ptychography Using a Single LED. Opt. Lett. 2018, 43, 3526–3529. [Google Scholar] [CrossRef]
- Wang, J.; Wang, C.; Wang, J.; Zhong, J.; Zhang, Y.; Dai, Q. Analysis, Simulations, and Experiments for Far-Field Fourier Ptychography Imaging Using Active Coherent Synthetic-Aperture. Appl. Sci. 2022, 12, 2197. [Google Scholar] [CrossRef]
- Jiang, R.; Shi, D.; Wang, Y. Long-range Fourier ptychographic imaging of the dynamic object with a single camera. Opt. Express. 2023, 31, 33815–33829. [Google Scholar] [CrossRef]
- Holloway, J.; Wu, Y.; Sharma, M.K.; Corssairt, O.; Veeraraghavan, A. SAVI: Synthetic apertures for long-range, subdiffraction-limited visible imaging using Fourier ptychography. Appl. Optics. 2017, 3, 4. [Google Scholar] [CrossRef]
- Swenson, G.W., Jr. Synthetic-Aperture Radio Telescopes. Annu. Rev. Astron. Astrophys. 1969, 7, 59–83. [Google Scholar] [CrossRef]
- McFarlane, N.J.B.; Schofield, C.P. Segmentation and Tracking of Piglets in Images. Mach. Vision. Appl. 1995, 8, 187–193. [Google Scholar] [CrossRef]
- Stauffer, C.; Grimson, W.E.L. Adaptive Background Mixture Models for Real-Time Tracking. In Proceedings of the 1999 IEEE Computer Society Conference on Computer Vision and Pattern Recognition (CVPR), Fort Collins, CO, USA, 23–25 June 1999; Volume 2, pp. 246–252. [Google Scholar] [CrossRef]
- Otsu, N. A Threshold Selection Method from Gray-Level Histograms. IEEE Trans. Syst. Man. Cybern. 1979, 9, 62–66. [Google Scholar] [CrossRef]
- Suzuki, S.; Abe, K. Topological Structural Analysis of Digitized Binary Images by Border Following. Comput. Vis. Graph. Image Process. 1985, 30, 32–46. [Google Scholar] [CrossRef]
- Ullrich, T.; Fünfzig, C.; Fellner, D.W. Two Different Views on Collision Detection. IEEE Potentials 2007, 26, 26–30. [Google Scholar] [CrossRef]
- Wang, C.C.; Wang, M.; Sun, J.; Mojtahedi, M. A Safety Warning Algorithm Based on Axis Aligned Bounding Box Method to Prevent Onsite Accidents of Mobile Construction Machineries. Sensors 2021, 21, 7075. [Google Scholar] [CrossRef]
- Ou, X.; Horstmeyer, R.; Yang, C.; Zheng, G. Embedded Pupil Function Recovery for Fourier Ptychographic Microscopy. Opt. Express 2014, 22, 4960–4972. [Google Scholar] [CrossRef]
- Shu, Y.; Sun, J.; Lyu, J.; Wang, Z.; Zhu, J.; Shao, M.; Zuo, C.; Chen, Q. Adaptive Optical Quantitative Phase Imaging Based on Annular Illumination Fourier Ptychographic Microscopy. PhotoniX 2022, 3, 24. [Google Scholar] [CrossRef]
- Zhang, S.; Wang, A.; Xu, J.; Feng, T.; Zhou, J.; Pan, A. FPM-WSI: Fourier Ptychographic Whole Slide Imaging via Feature-Domain Backdiffraction. Optica 2024, 11, 634–646. [Google Scholar] [CrossRef]
- Oh, G.; Choi, H. Simultaneous Multifocal Plane Fourier Ptychographic Microscopy Utilizing a Standard RGB Camera. Sensors 2024, 24, 4426. [Google Scholar] [CrossRef]
Disclaimer/Publisher’s Note: The statements, opinions and data contained in all publications are solely those of the individual author(s) and contributor(s) and not of MDPI and/or the editor(s). MDPI and/or the editor(s) disclaim responsibility for any injury to people or property resulting from any ideas, methods, instructions or products referred to in the content. |
© 2025 by the authors. Licensee MDPI, Basel, Switzerland. This article is an open access article distributed under the terms and conditions of the Creative Commons Attribution (CC BY) license (https://creativecommons.org/licenses/by/4.0/).