Article

Accuracy Analysis of Measuring Cylindrical Surfaces with Complex Parameters Using Two-Dimensional Pseudo Lateral Shearing Interferometry

1
College of Metrology Measurement and Instrument, China Jiliang University, Hangzhou 310018, China
2
Sichuan Precision and Ultra-Precision Machining Engineering Technology Center, Chengdu 610200, China
*
Authors to whom correspondence should be addressed.
These authors contributed equally to this work.
Photonics 2025, 12(11), 1059; https://doi.org/10.3390/photonics12111059
Submission received: 28 May 2025 / Revised: 10 October 2025 / Accepted: 15 October 2025 / Published: 27 October 2025

Abstract

Cylindrical surfaces with complex parameters (CSCP), including off-axis, aspheric, and other properties, constitute fundamental components within complex optical systems. Two-dimensional pseudo lateral shearing interferometry (2DPLSI) is a non-null and generalized method for CSCP. It can eliminate wavefront error of components within systematic and retrace error, thereby achieving high-precision measurement. However, the accuracy of measurement is influenced by factors such as the parameters of the measurement system, rendering the analysis of measurement precision of 2DPLSI to be important. The sources of error in 2DPLSI are discussed in this paper; their effects are simulated using the Monte Carlo (MC) method. Furthermore, a wavefront construction method based on power spectral density (PSD) is proposed, which simulates actual wavefronts more effectively. In addition, experiments are conducted to validate the optimized measurement system parameters derived from the simulation results. Experimental results show that the optimized measurement system parameters effectively improve measurement accuracy, retain low-mid spatial frequency information of wavefront, and eliminate the influence of gridding artifacts.

1. Introduction

Cylindrical optical components have curvature in a single direction, which can realize the uniaxial transformation of a light beam while maintaining the original shape of the light beam in the non-curvature direction. They are widely used in fields such as beam shaping [1], imaging systems [2] and laser systems [3]. With the development of optical systems towards miniaturization, lightweight, and high performance, cylindrical optical components are widely used in cutting-edge research fields such as metamaterials [4], biomedicine [5], and optical microfabrication [6]. The manufacturing quality of cylindrical optical components relies heavily on the metrology precision, which places high requirements on metrology tools. At present, high-precision measurement methods for cylindrical optical components include the null test (such as compensation lens (CL) [7,8,9,10,11], computer-generated holograms (CGH) [12,13,14,15,16]), non-null test (such as tilt-carrier engineering interferometry [17], and the surface figure reconstruction method combining CGH and sub-aperture stitching technology [18], etc.), which can effectively improve the measurement accuracy of cylindrical optical components. A null test requires specially designed and manufactured optics for different parameters. This specificity limits it universality. The non-null test is limited by retrace error due to its principle.
The 2DPLSI [19] we proposed can solve the above problems very well. 2DPLSI translates CSCP in orthogonal directions, respectively, eliminates the influence of retrace error and reflected wavefront error by subtracting the adjacent figure, and obtains the partial derivative of differential wavefront in orthogonal directions. After integration, CSCP wavefront error is reconstructed.
Pseudo lateral shearing interferometry (PLSI) realizes the shearing process through moving the CSCP in orthogonal directions, and its figure error can be reconstructed similarly to lateral shearing interferometry (LSI) [20]. Peng et al. analyzed the measurement error of PLSI for measuring complex spatio-temporal couplings [21]. But 2DPLSI realizes the shearing process by moving CSCP. This introduces errors such as mid-spatial-frequency (MSF) modulation error, shear error, additional adjustment error, and reconstruction algorithm error. These errors will inevitably affect the accuracy of 2DPLSI. Zhu et al. analyzed the range of orthogonal angle error and shear distance error [22]. They concluded that shear distance error is difficult to avoid experimentally but can be compensated by algorithm. The coma aberration introduced by shearing between two spherical wavefronts can be eliminated by using a collimating lens to convert the four spherical wavefronts into four plane wavefronts [23]. Peng et al. analyzed the source of the reconstruction error and its relationship with the shear ratio [24]. The result shows that more spectral information will be lost if the shear ratio increases, which leads to more significant reconstruction errors. RHEE H-G et al. proposed a correction algorithm to solve the rotation error introduced during shearing [25]. In summary, measurement errors are difficult to inevitable in experimental measurements. The analysis of errors in simulation heavily relies on wavefront construction methods. What is more, existing methods cannot effectively describe mid-spatial-frequency error. Thus, it is necessary to develop a novel wavefront construction method to effectively resolve this.
This paper analyzes various error sources in 2DPLSI measurement and designs a simulation based on system hardware to investigate the impact of MSF modulation error, shear error, additional adjustment error, and reconstruction algorithm error. In addition, a wavefront construction method is proposed based on PSD for simulation. The simulation results guided the selection of measurement system parameters for experimental validation, and experimental results were consistent with simulation results. Additionally, experimental results show that the optimized measurement system parameters effectively improve the accuracy of measurement. In Section 2, the principle of 2DPLSI is described. Section 3 describes the principle of error simulation and proposes a wavefront construction method. Section 4 analyzes errors source and influence on 2DPLSI. Section 5 determines the parameter selection scheme of the measurement system, conducts experimental verification, and analyzes the experimental results. The conclusion of this paper is shown in Section 6.

2. Analysis of 2DPLSI Measurement Error

The non-null interferometric system of 2DPLSI for CSCP is shown in Figure 1. The interferometer emits parallel light, a portion of which is reflected by the reference flat as reference light, while the remaining portion passes through and is reflected by the CSCP. The rays then are incident on the CL. Subsequently, they are reflected by a plane reflector and approximately travel back along their original path, interfering with the reference light. The interferometer with a 600 mm aperture is utilized in the system, offering selectable resolutions of 0.193 mm/pixel and 0.386 mm/pixel. The CSCP is an off-axis aspherical cylinder. The CL is a spherical cylinder, which only compensates for part of the wavefront aberrations and approximately constitutes a beam expander with the CSCP. In addition, the displacement device has 6 degrees of freedom, with minimum moving units of 1 μm along the x-axis and 5 μm along the y-axis.
The measuring procedure is detailed in ref. [19], and a brief description is provided here. The measurement result W(x, y) obtained from the 2DPLSI system is as follows:
W x , y = W CSC P x , y + W CL x , y + W RE x , y + W SE x , y ,
where WCSCP(x, y) represents the reflection wavefront error of the CSCP. WCL(x, y) represents the reflection wavefront error of the CL. WRE(x, y) represents the retrace error. WSE(x, y) represents the systematic error, mainly including error due to the internal optical paths of the interferometer and the figure error of the reference flat and the plane reflector. The CSCP translates along two orthogonal directions perpendicular to the optical axis by tiny distances dx and dy, while the reference flat, the CL, and the plane reflector remain stationary. Notably, the movement of CSCP induces variations in its reflected beam, leading to subsequent fluctuations in the retrace error. These variations are influenced not only by the nominal test geometry but also the slopes of the CL and the reflector. However, given that the experiment described in this paper involves the surface error test with a low numerical aperture (NA), the effect caused by the variations could be negligible. Three sets of measurement results can be obtained, as represented by the following equation:
W 1 x , y = W CSC P x , y + W CL x , y + W RE x , y + W SE x , y W 2 x , y = W CSC P x + d x , y + W CL x , y + W RE x , y + W SE x , y W 3 x , y = W CSC P x + d x , y + d y + W CL x , y + W RE x , y + W SE x , y .
By subtracting the measurement results before and after the orthogonal displacement, we can eliminate the wavefront error of the CL, the retrace error, and the systematic error. Thus, we obtain the differential wavefronts in the orthogonal directions of the CSCP:
Δ W x x , y = W 2 x , y W 1 x , y = W CSC P x + d x , y W CSC P x , y Δ W y x , y = W 3 x , y W 2 x , y = W CSC P x + d x , y + d y W CSC P x + d x , y .
The differential wavefronts can be approximated as the gradients of wavefront when the orthogonal displacement is sufficiently small. The wavefront information of the CSCP can be recovered by the Hudgin model method [26,27].
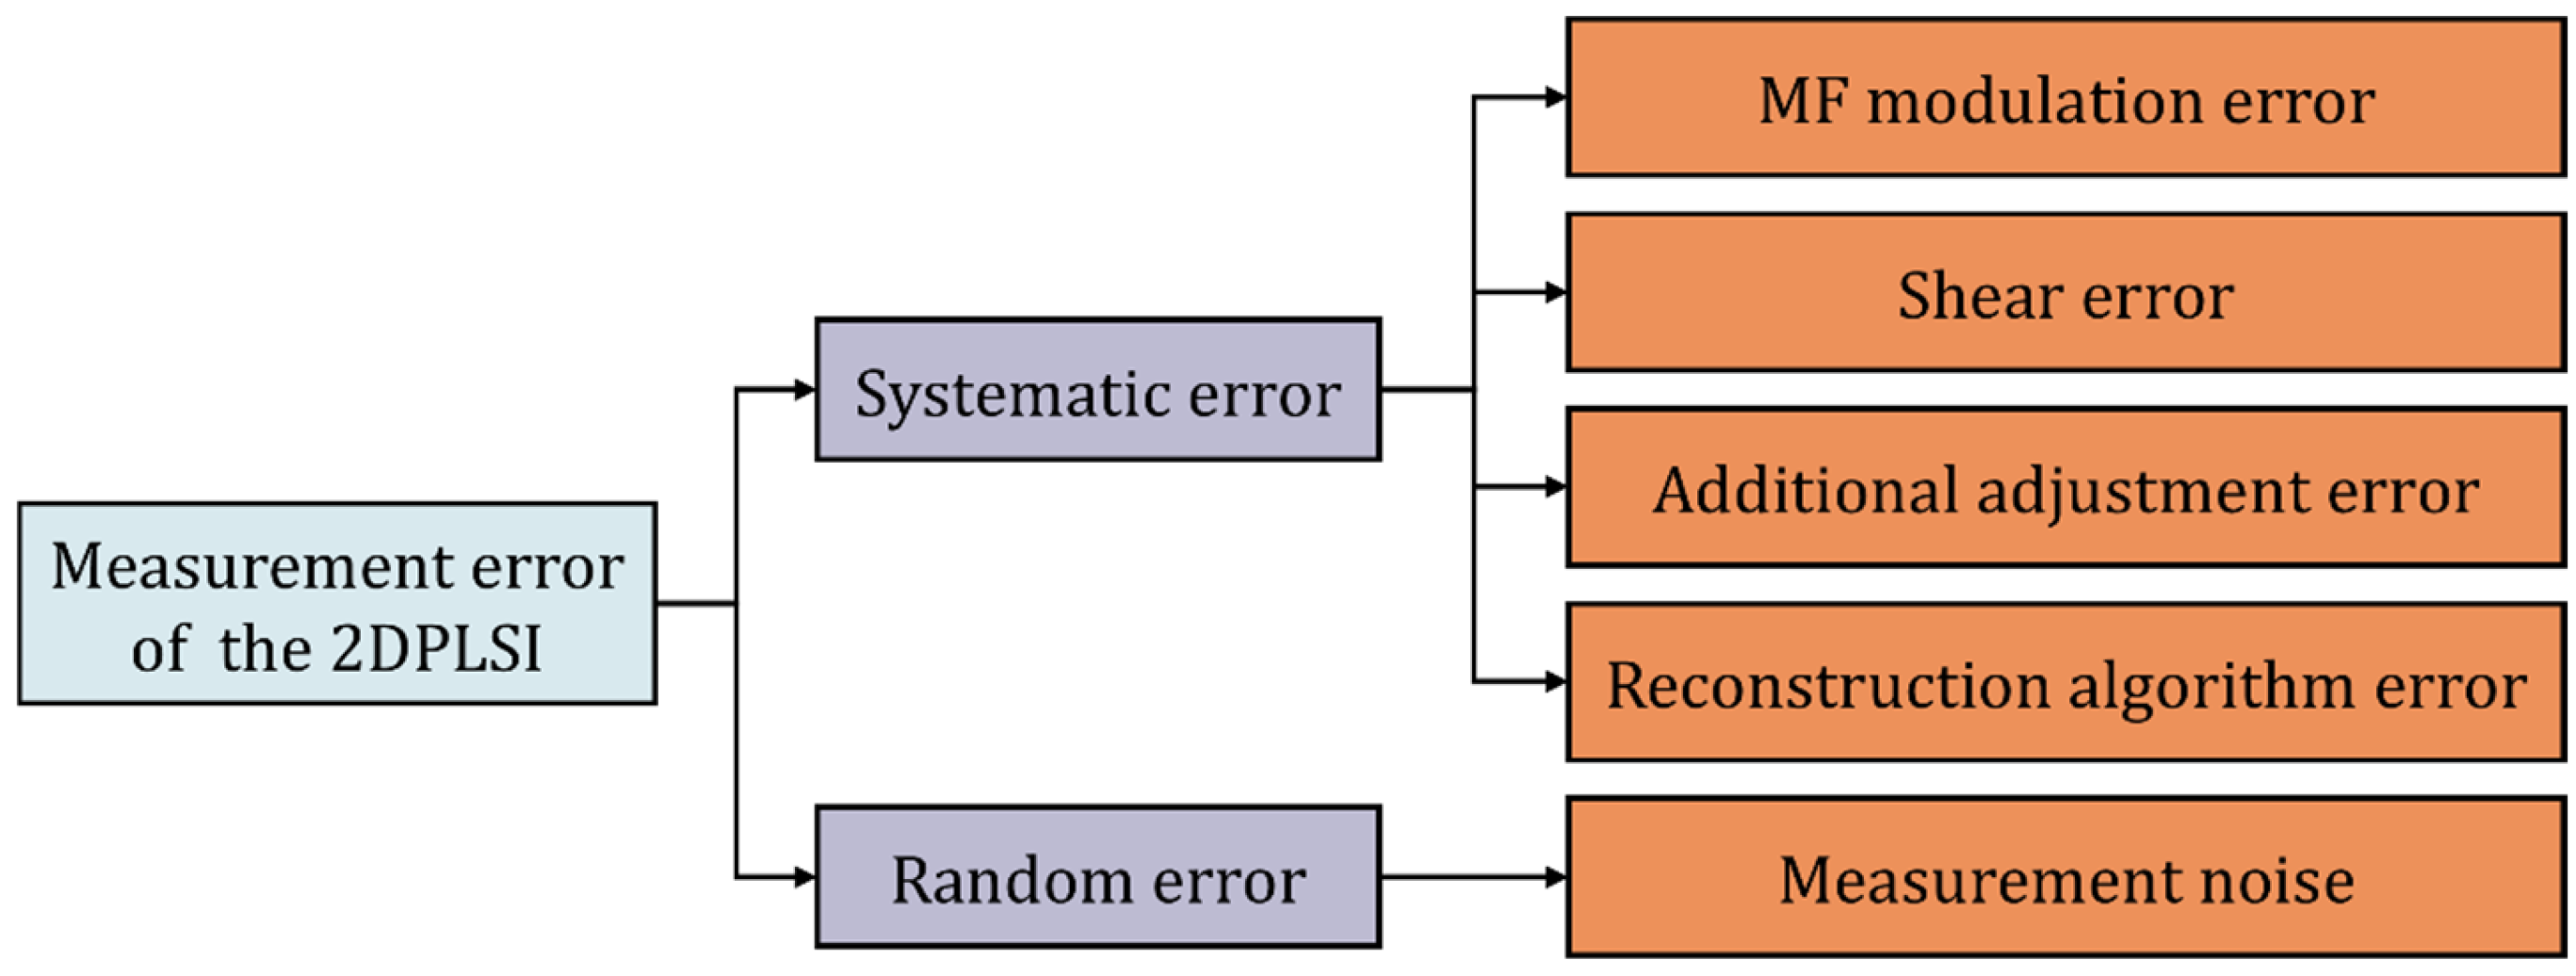
In measurements, the accuracy of 2DPLSI inevitably compromises systematic error and random error. Systematic errors include MSF modulation error caused by intensity modulation due to MSF error, shear error and additional adjustment error resulting from non-ideal orthogonal displacement device, and reconstruction algorithm error introduced by the Hudgin model method (see Figure 2).

3. Error Simulation Method

3.1. Wavefront Construction Method

In rectangular wavefront fitting, Zernike are not completely orthogonal in the rectangular domain, while Legendre effectively analyze and describe rectangular wavefront. This paper utilizes 2D Legendre to construct low-spatial-frequency (LSF) information of wavefront, and its expression can be formed by the dot product of 1D Legendre:
W LSF x , y = i = 1 N a i P n x P m y   ,
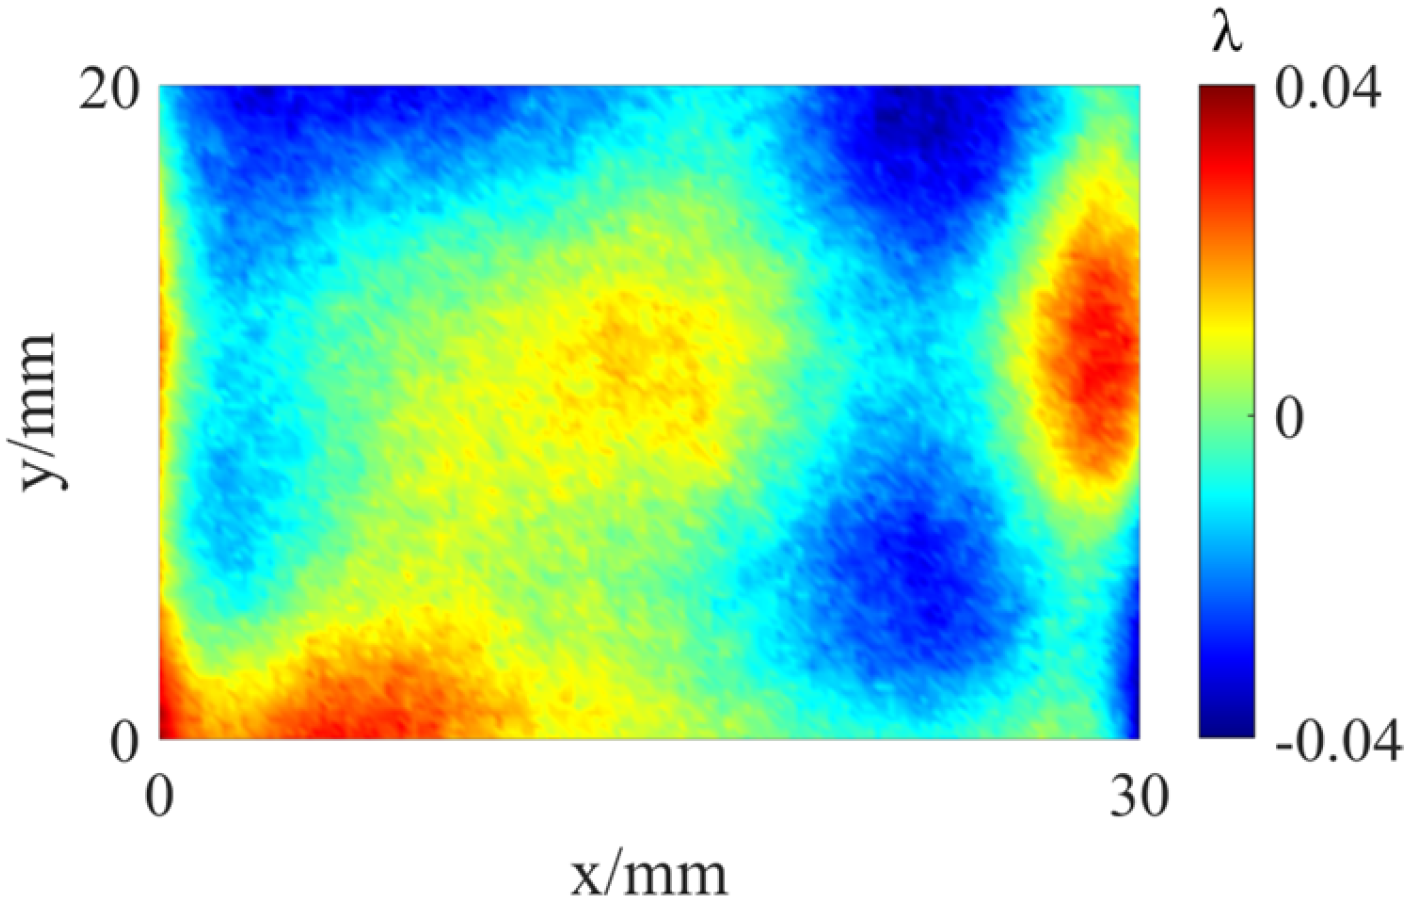
where WLSF(x, y) represents the constructed LSF information of wavefront. N represents the number of polynomials. ai represents the coefficients of 2D Legendre. n and m represent the orders of 1D Legendre. Pn(x) and Pm(y) represent 1D orthogonal Legendre. The LSF information of wavefront is shown in Figure 3.
Except for LSF information, wavefront also includes MSF and high-spatial-frequency (HSF) information. HSF information contains noise, details, etc. Two-dimensional PSD can be used to characterize the MSF and HSF components of the surface height errors of an optical surface [28]. Therefore, we report a method based on PSD for constructing wavefront. The 1D PSD of the optically polished glass is as follows:
P S D 1 D = A f B   ,
where f represents spatial frequency. A represents the smoothness coefficient of optical glass, which is 1.05. B represents the exponent, which is 1.55. In this paper, 2D PSD is calculated from 1D PSD, where frequency information is transformed into a circular region centered at the origin. The frequency is as follows:
f r = r + 1 Δ f   ,
where r represents radius. ∆f represents the frequency interval. Then 2D PSD is as follows:
P S D 2 D = r a n d o m ( 1 , 1 ) A f r B   .
It can be seen from Equation (7) that each radius value corresponds to a PSD value. Each PSD value is multiplied by a random number to introduce randomness, but the trend along radius direction still satisfies Equation (5).
The obtained PSD2D contains information from all frequency bands, and filtering is required to extract MSF. The definition of MSF in the National Ignition Facility (NIF) [29] is the following: spatial period from 0.12 to 33 mm, corresponding to spatial frequency range of 0.03 to 8.3 (mm)−1. Therefore, band-pass filtering is carried out through multiplying PSD2D with a window function; the value within the above frequency range can be obtained. The PSD2D after band-pass filtering is as follows:
P S D 2 D = P S D 2 D 0.5 1 e r f 20 R f 1 1 + 0.5 1 e r f 20 R f 2 1 e r f ( x ) = 2 π 0 x e t 2 d t ,
where R represents frequency distance. f1 and f2 represent the LSF and HSF boundaries of the band-pass filter, respectively. PSD2D represents the frequency information, which needs to be converted to phase information. The constructed MSF information of wavefront WMSF(x, y) is as follows:
W MSF x , y = 1 Δ x Δ y F 1 e i ϕ M Δ x N Δ y P S D 2 D ,
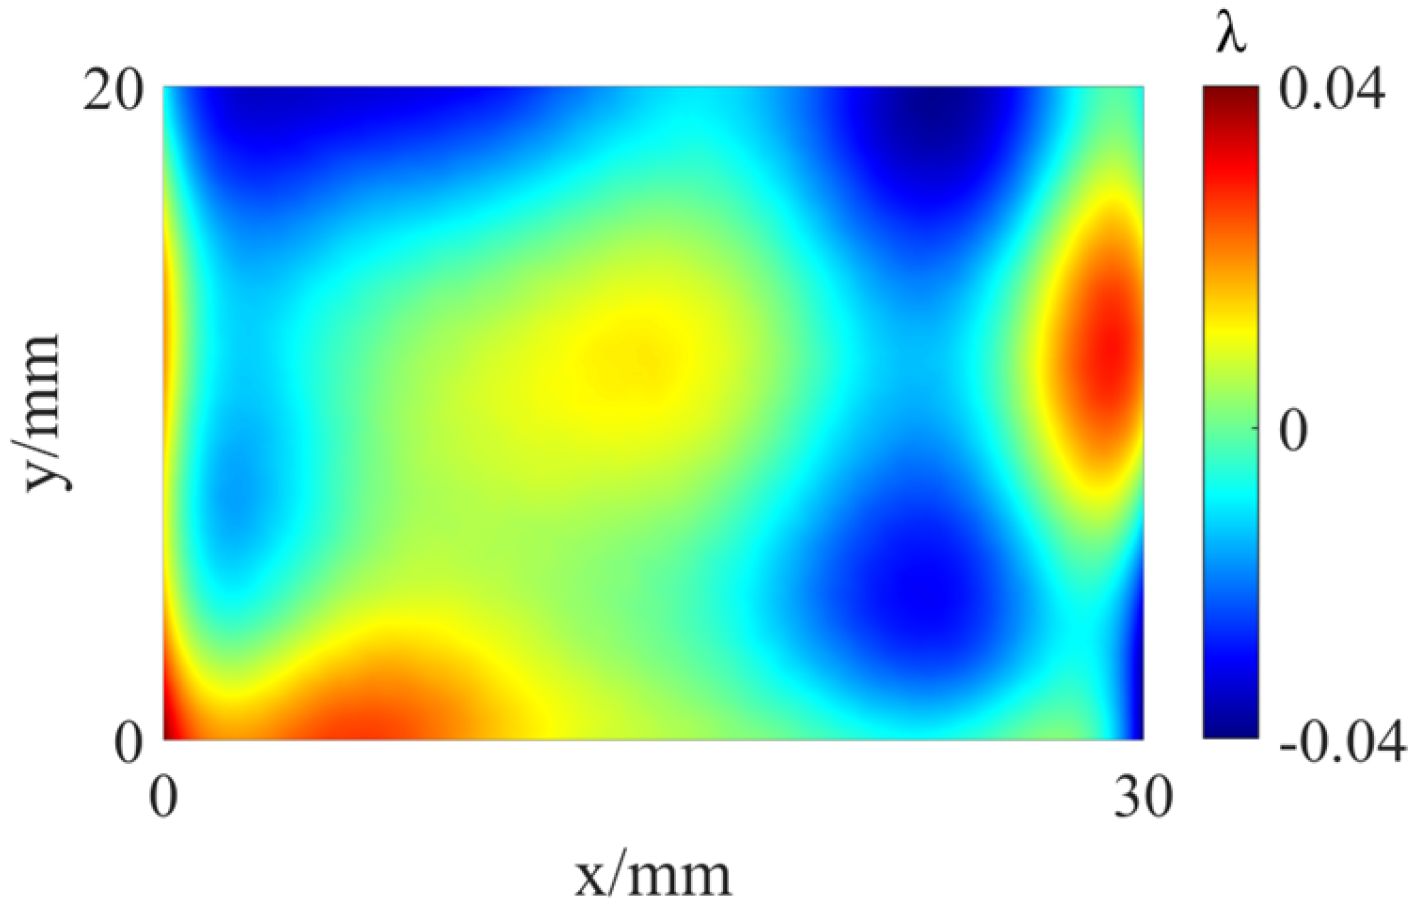
where ϕ represents a random matrix with uniform or Gaussian distribution in the range [−π, π]. M × N represents the size of wavefront. ∆x and ∆y represent the actual size of a pixel. The MSF information of wavefront is shown in Figure 4.
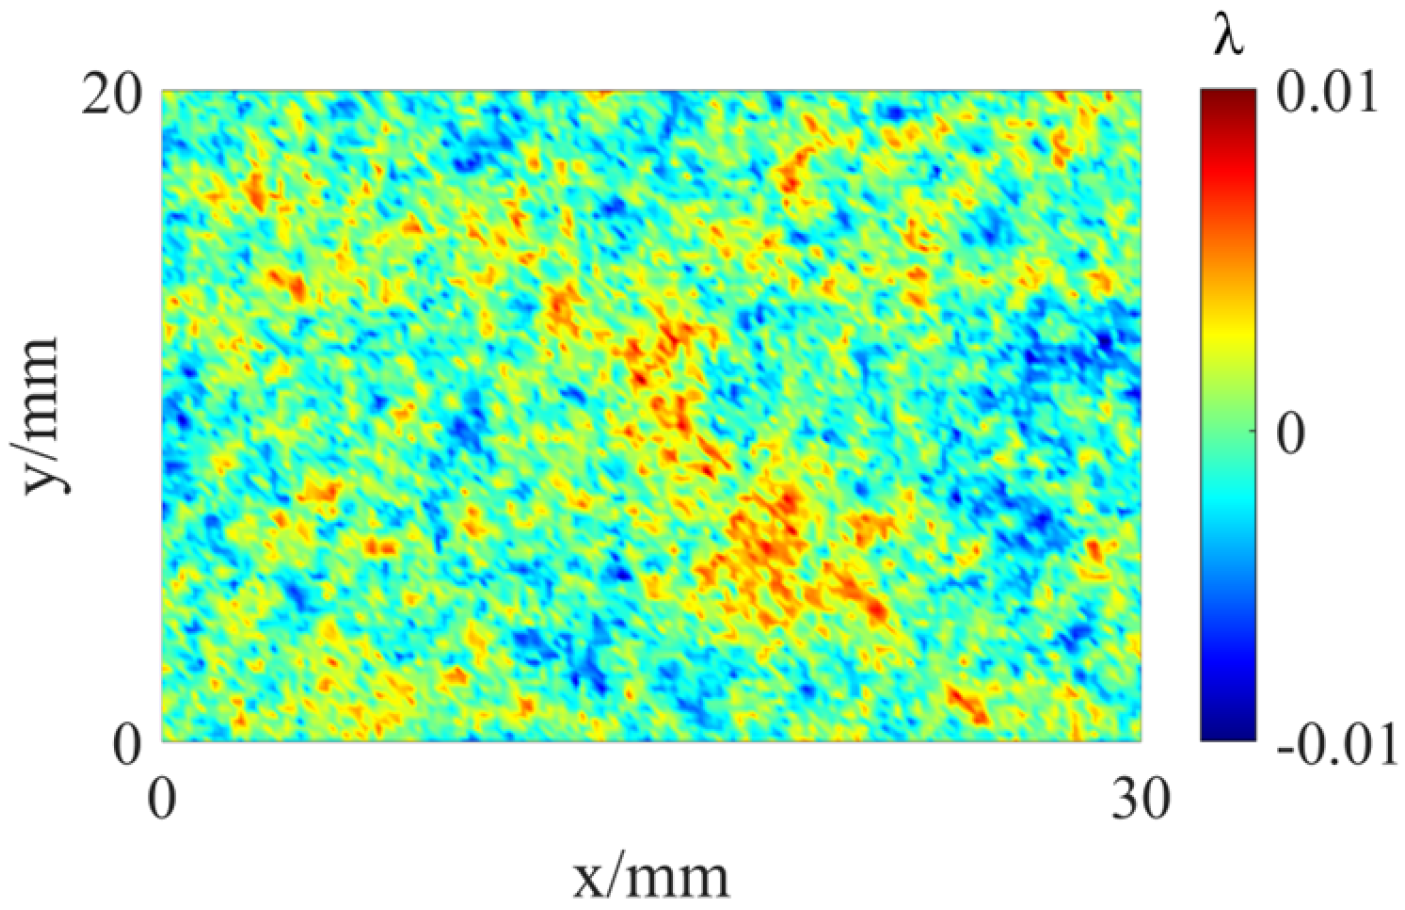
Wavefront is obtained by adding LSF information and HSF information. As shown in Figure 5, its PV value is 0.08 λ, which is highly similar to the measured figure in the error distribution and spectrum characteristics and is suitable for simulation.

3.2. Principles

Although the measurement system parameters have been determined, they can be adjusted according to the existing device, including modifications to shear amounts, as well as changes in resolution through algorithm processing. However, there are inherent limitations in adjusting the resolution. Specifically, increasing the resolution implies a greater number of sampling points, yet the data corresponding to these additional sampling points cannot be generated. In measurement, a high resolution is usually required in the interferometer to ensure the accuracy of results. Accordingly, this paper can only perform simulation of different resolutions by reducing sampling points. In this simulation, downsampling is achieved by averaging the values of merged pixel blocks, allowing the analysis of effects under different resolution conditions.
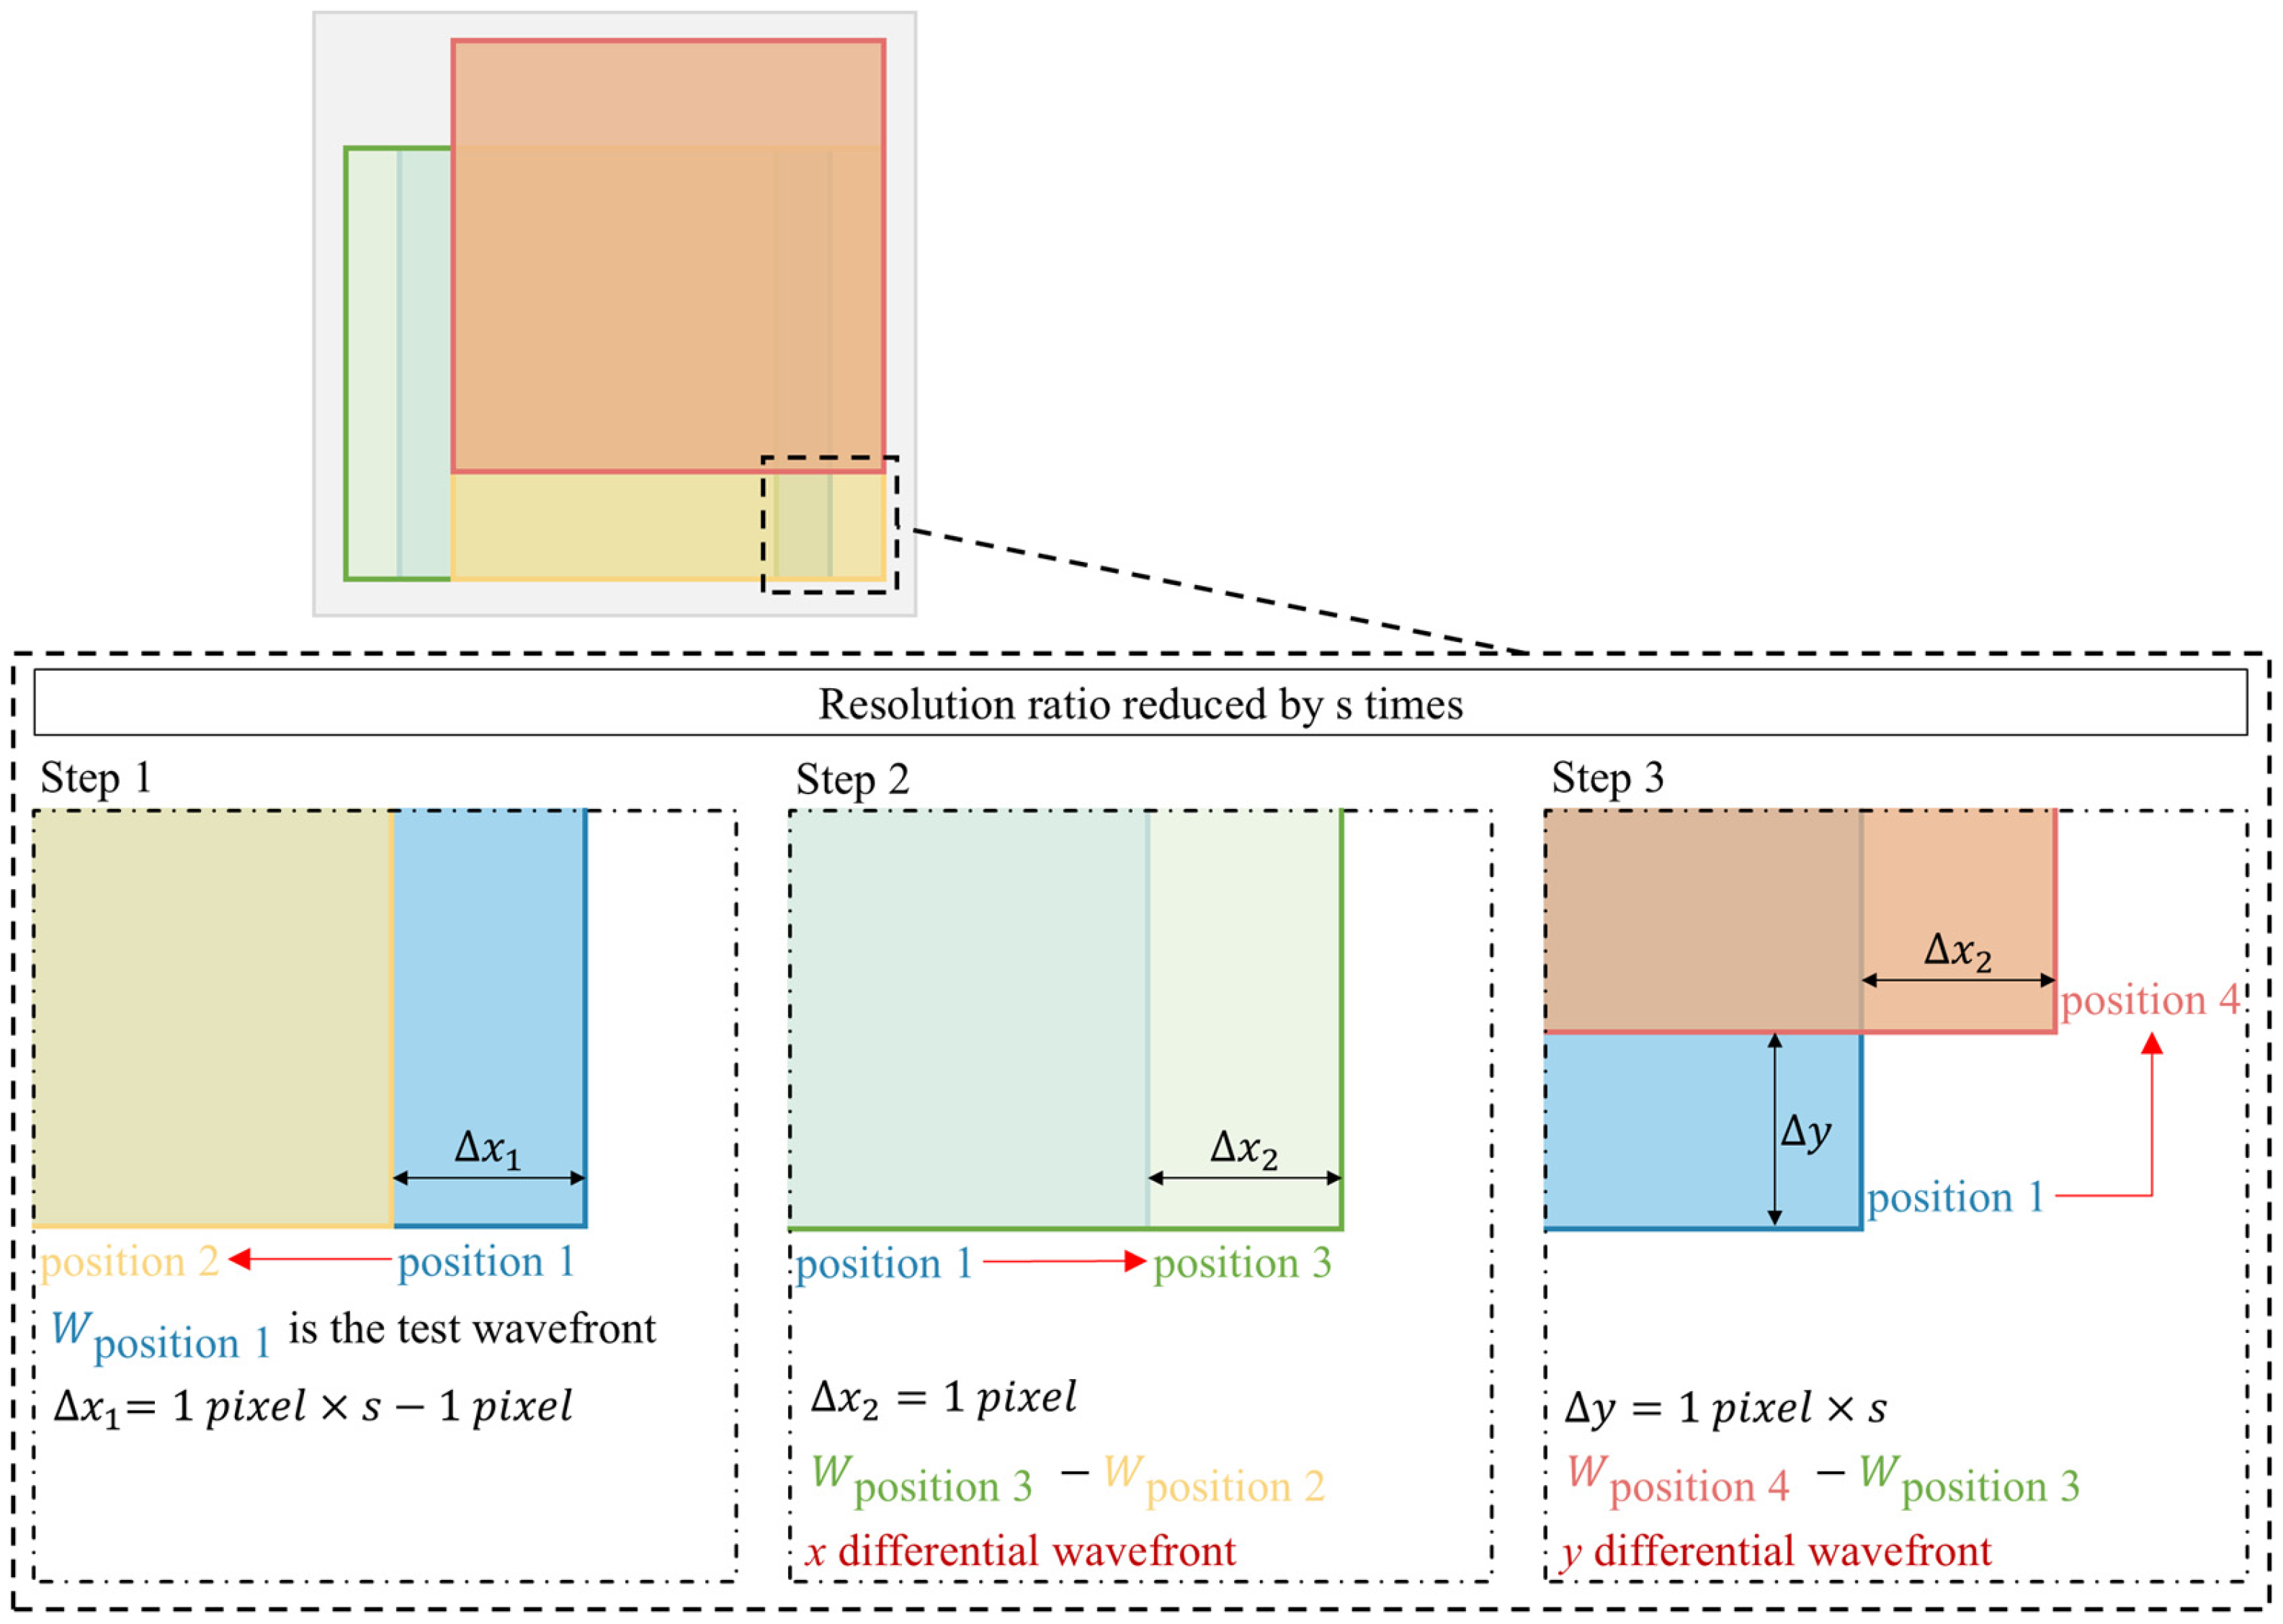
As shown in Figure 6, firstly, Wposition1 translates along the negative x-axis by ∆x1, and the shifted wavefront is then downsampled to obtain W1. Next, Wposition1 translates along the positive x-axis by ∆x2, and wavefront after translation is reduced in resolution to obtain W2. Subsequently, Wposition1 translates along the positive x-axis by ∆x2 and the positive y-axis by ∆y, and the translated wavefront is downsampled to obtain W3. In this case, the distance between W1 and W2 is dx, and between W2 and W3 is dy. The reconstructed figure after downsampling is obtained through 2DPLSI. Unlike in resolution simulation, downsampling is not needed when simulating shear amount. After obtaining the figure of multiple resolutions, W1, W2, and W3, the influence of shear amount and resolution on the error can be analyzed. In the simulation, resolutions are set to 0.193 mm/pixel, 0.356 mm/pixel, and 0.579 mm/pixel, while shear amounts are set to 1 pixel, 2 pixels, 3 pixels, 4 pixels, and 5 pixels. This setting is used to investigate the influence of measurement error under different combinations of shear amounts and resolutions.

4. Error Simulation Results

In this study, MC simulation is employed to analyze the effect of wavefront error magnitude by controlling the PV value of the test wavefront. The PV values are set within a range from 0.1 λ to 1 λ, with a total of 10 different levels. For each PV value, 100 completely random test wavefronts are generated to ensure statistical robustness. This range can better represent the impact of errors and guide the optimization of measurement system parameters. Since the error parameters are modeled based on actual data, the error-containing wavefront may exhibit similarities to the ideal wavefront.

4.1. System Error

(1) MF modulation error
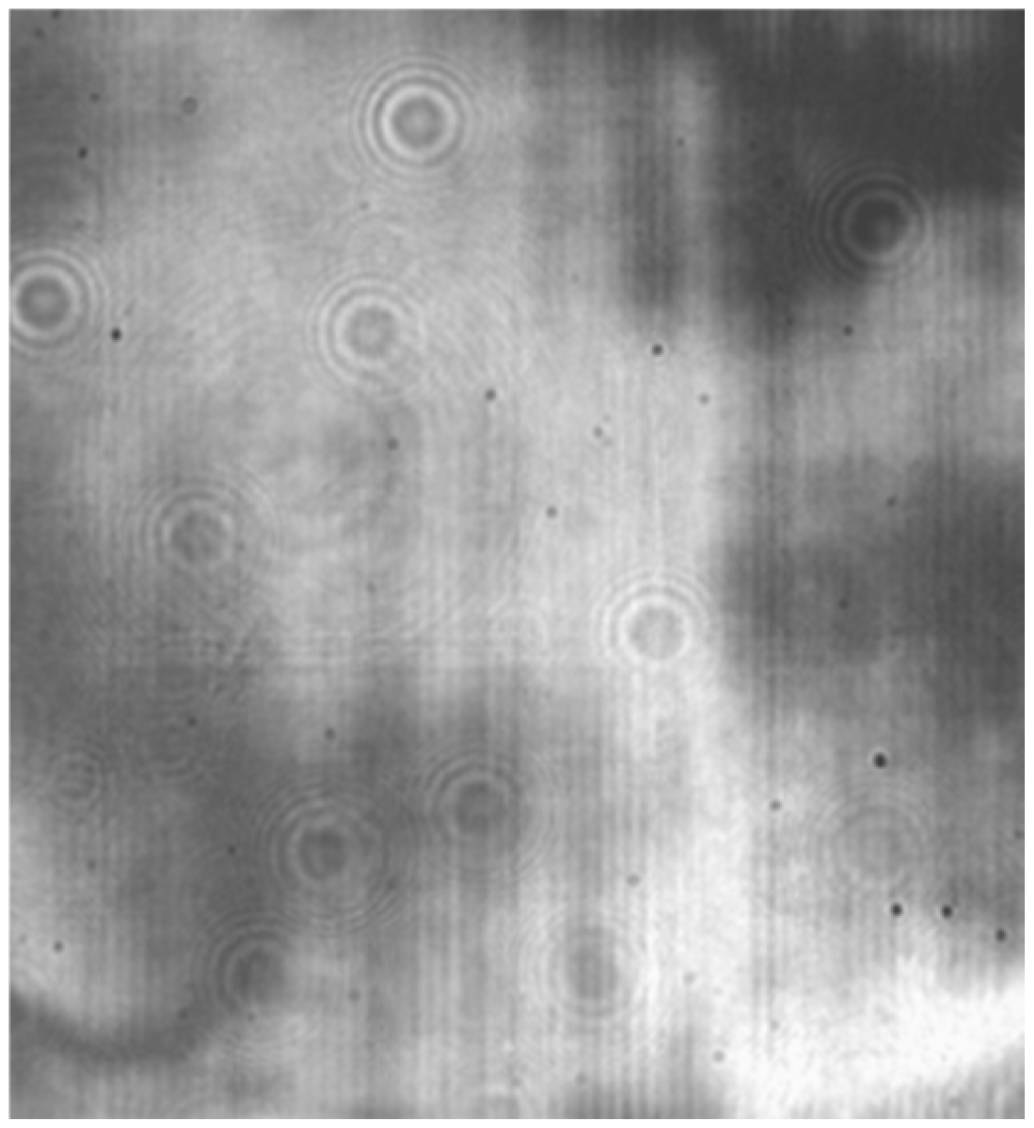
The figure of CSCP inevitably exhibits significant MSF error due to limitations in manufacturing technology. Light intensity is modulated by MSF error, leading to measurable interference fringe within interferogram as shown in Figure 7. Interference fringe not only diminishes the contrast of interferogram but also introduces waviness in measurement results. Hence, these errors are designated as MSF modulation errors. The incident angle of wavefront on MSF error changes as CSCP translates along the curvature direction; MSF modulation error is inevitably altered.
When shear amount is 1 pixel and resolution is 0.193 mm/pixel, the reconstructed figure appears as shown in Figure 8a. Figure 8b adopts MSF modulation error with a PV value of 0.02 λ. Figure 8c illustrates that the non-axisymmetric geometry of CSCP introduces spatially periodic components in MSF modulation error, characterized by a superposition of sinusoidal fringe along the non-curvature direction.
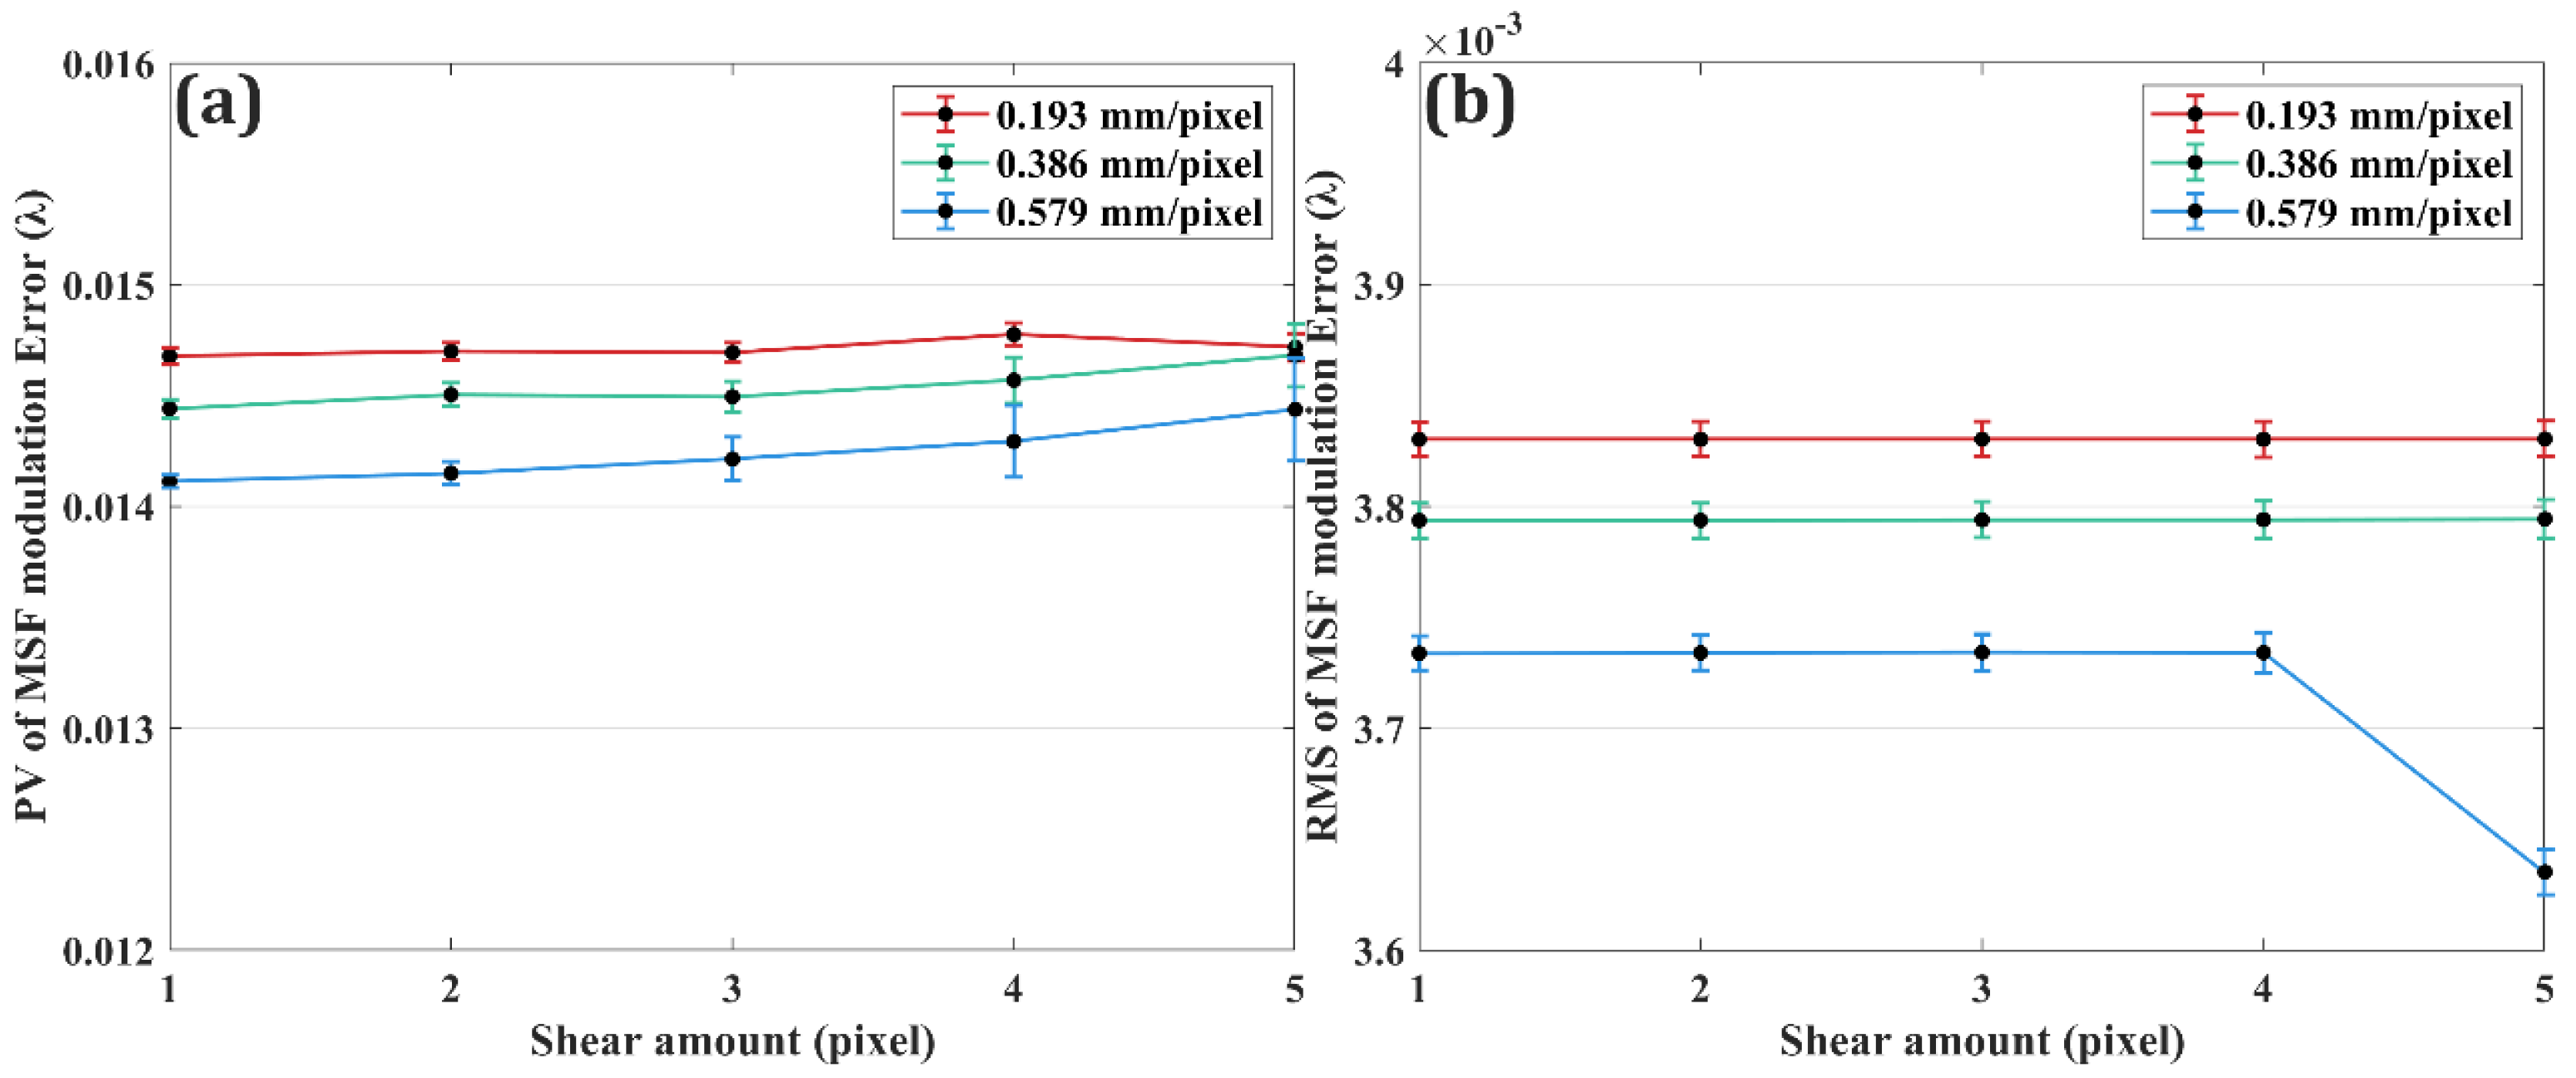
Multiple random sine waves are superimposed to simulate the influence of MSF modulation error in this simulation. As shown in Figure 9, points on the line represent the average of calculation results, and the error bar indicates standard deviation. MSF modulation error does not change with shear amount. It is relatively small and has no significant impact on figure. Shear amount affects the macroscopic wavefront more than the local gradients, so it has less impact on MSF modulation error. More wavefront information is captured at high resolution, including MSF modulation error caused by diffraction. When measuring with low resolution, sampling points are reduced and the system responds weakly to MSF information.
(2) Shear error
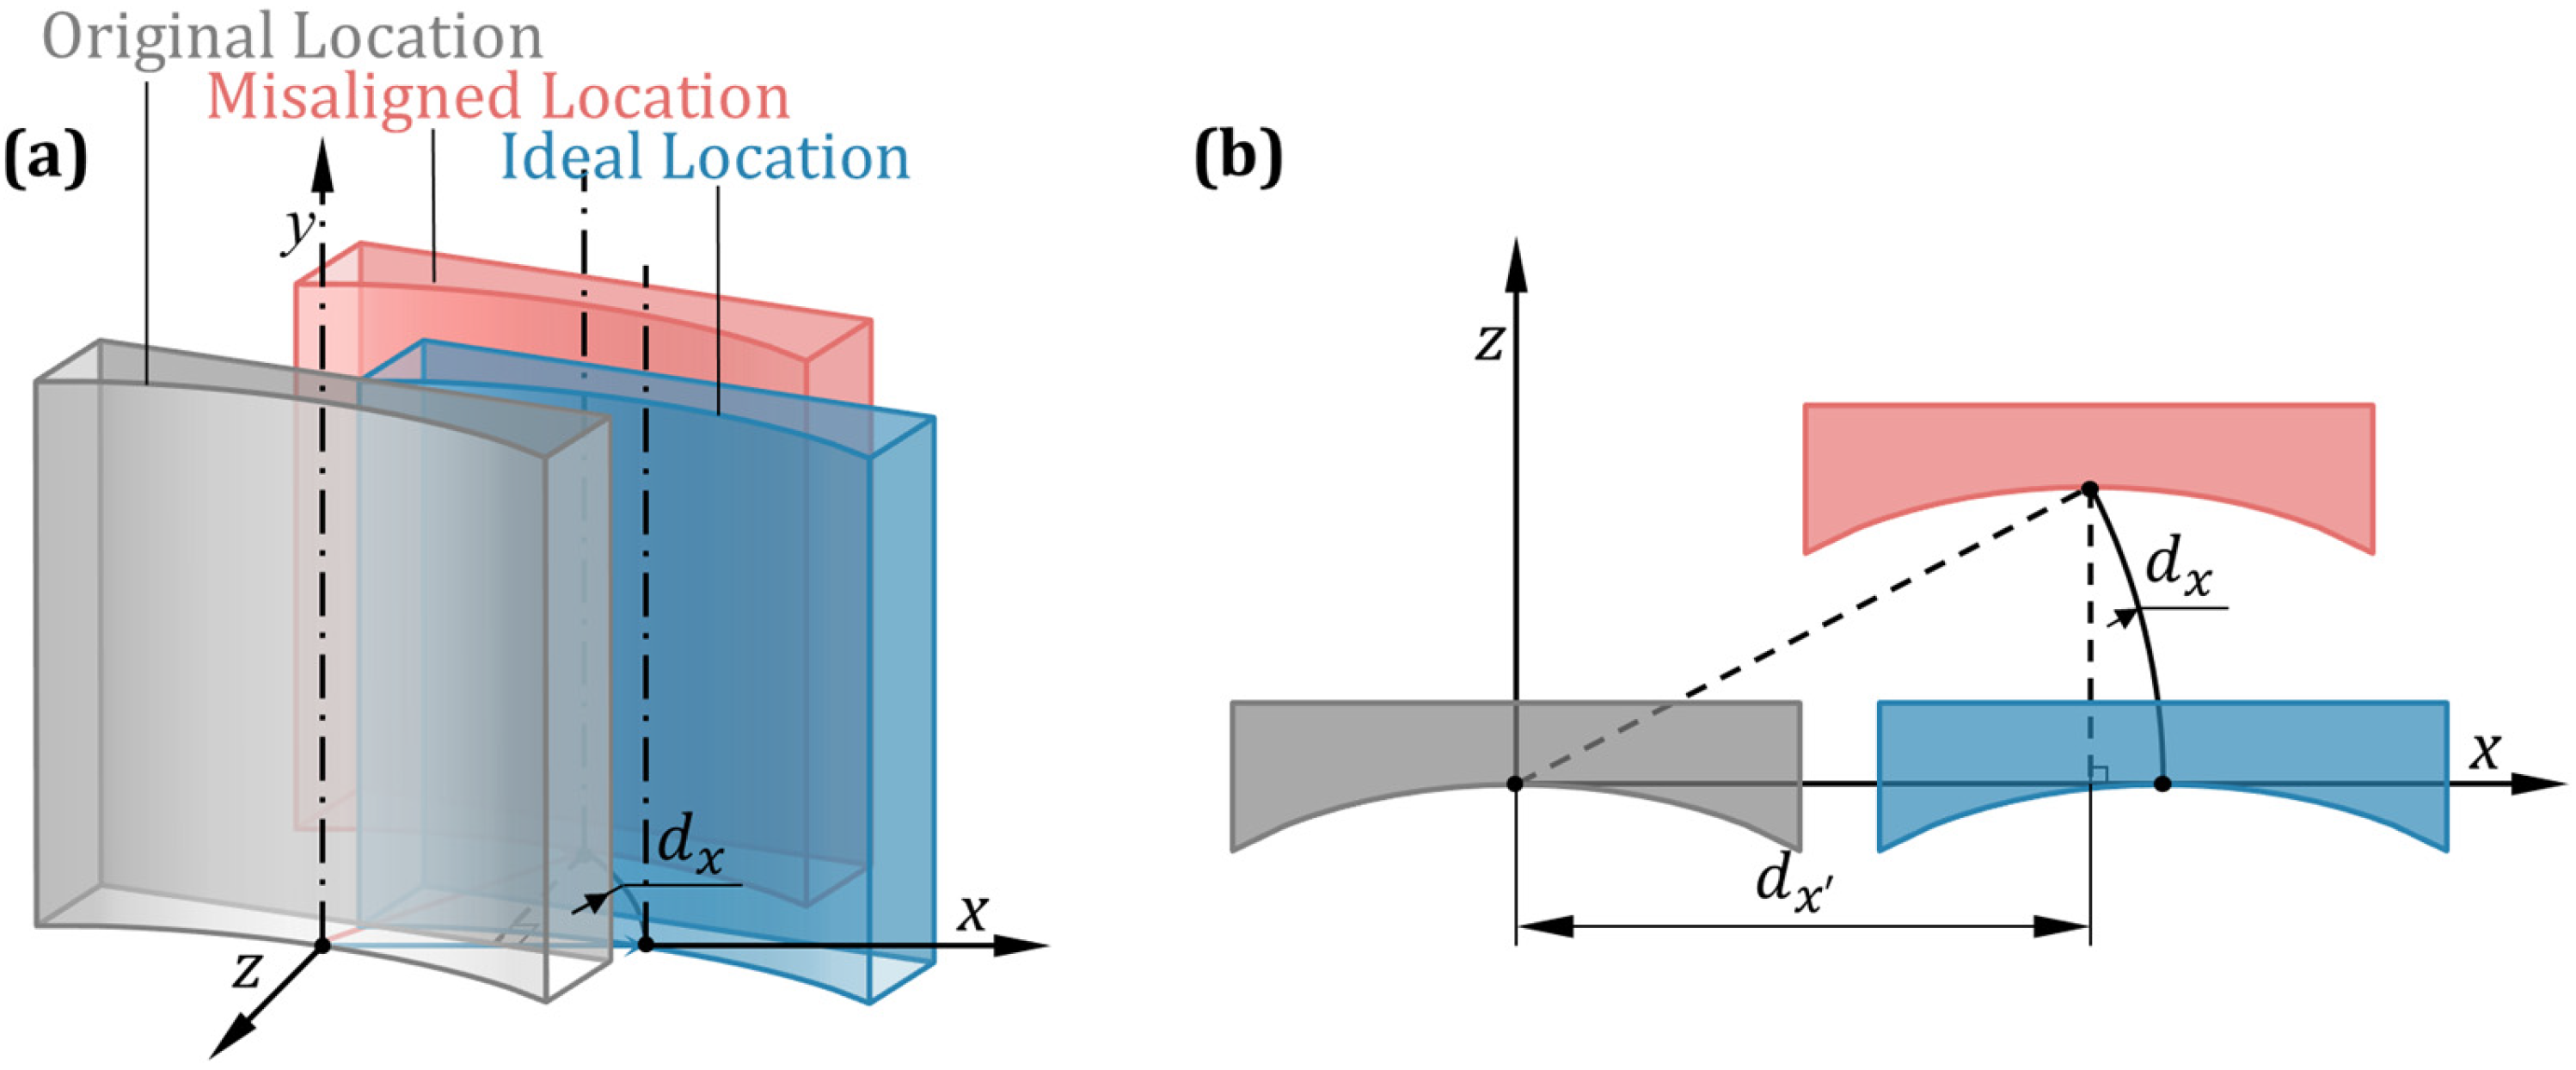
As shown in Figure 10, shear error is caused by inaccurate shearing, mainly including straightness error introduced during the translation of CSCP and indication error introduced by the minimum movement scale of y-axis. Non-orthogonal motion in the displacement device may cause deviations in the movement trajectory from the ideal path, leading to straightness error during the translation of CSCP. In Figure 10b, dx represents the actual translation of the CSCP along the x-axis. Because of the angular deviation between the actual and ideal movement direction, the increase in movement distance will lead to a corresponding increase in straightness error. CSCP translating along the y-axis with a movement distance smaller than the minimum increment cannot guarantee the accuracy of movement, which may result in measurement error.
When shear amount is 1 pixel and resolution is 0.193 mm/pixel, the reconstructed figure appears as shown in Figure 11a. In Figure 11b, a straightness error of −10 μm/200 μm and indication error of −3 μm are introduced. Compared with Figure 11a and Figure 11b, it can be found that straightness error and indication error are only in the order of nanometers, resulting in a small impact of shear error on figure. In addition, shear error results in an actual movement of less than 1 pixel, thus introducing a wavefront difference that contains LSF information. This portion of LSF information resembles the figure, consequently leading to similar residuals.
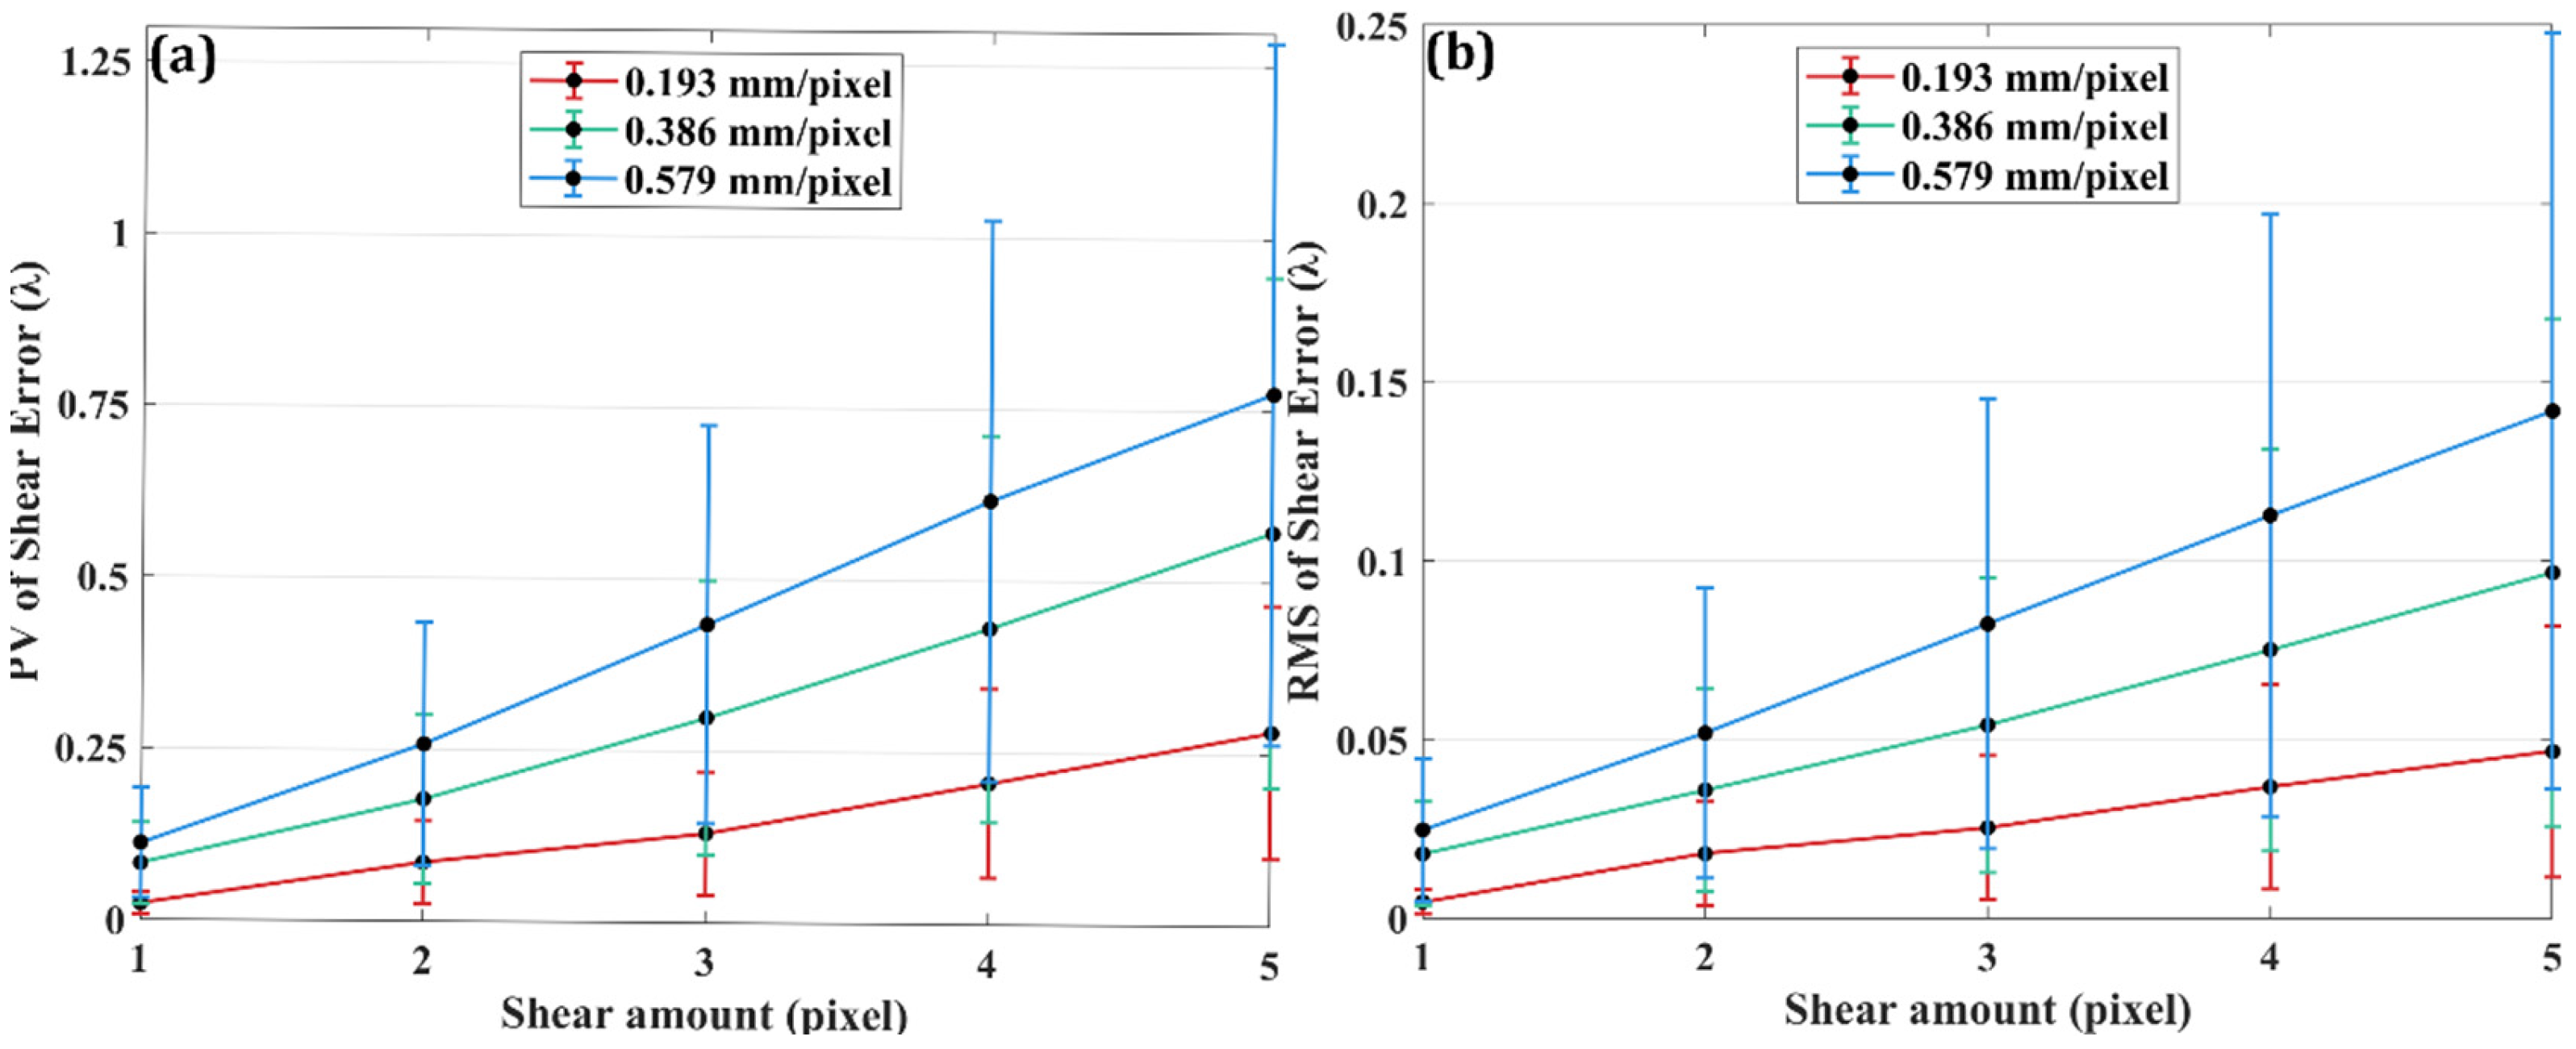
In this simulation, it is necessary to consider that CSCP not only has indication error introduced by minimum movement scale in y-axis but also has straightness error. As shown in Figure 12, shear error rises with the growth of shear amount, showing a linear relationship. The displacement distance of CSCP is increased, resulting in the accumulation of straightness error and a corresponding rise in shear error. As sampling points increase, more effective correction of local phase differences caused by shear is allowed, reducing the likelihood of shear error rising. For test wavefronts with larger PV values, the calculated standard deviation exhibits a relatively wide range, consistent with the positive correlation between PV values and standard deviation. Shear error is difficult to fully eliminate. It can only be minimized by selecting a high-precision displacement device to ensure its trajectory remains as close to the ideal as possible during movement, and by choosing an appropriate shear amount to reduce its magnitude.
(3) Additional adjustment error
As shown in Figure 13, the displacement device may exhibit slight rotational motion during linear translation, influenced by factors such as manufacturing tolerance, assembly error, and mechanical wear. This rotational motion can introduce systematic deviations in the measurement result. However, such errors are not accounted for in the theoretical framework of misalignment aberrations and are therefore classified as additional adjustment error.
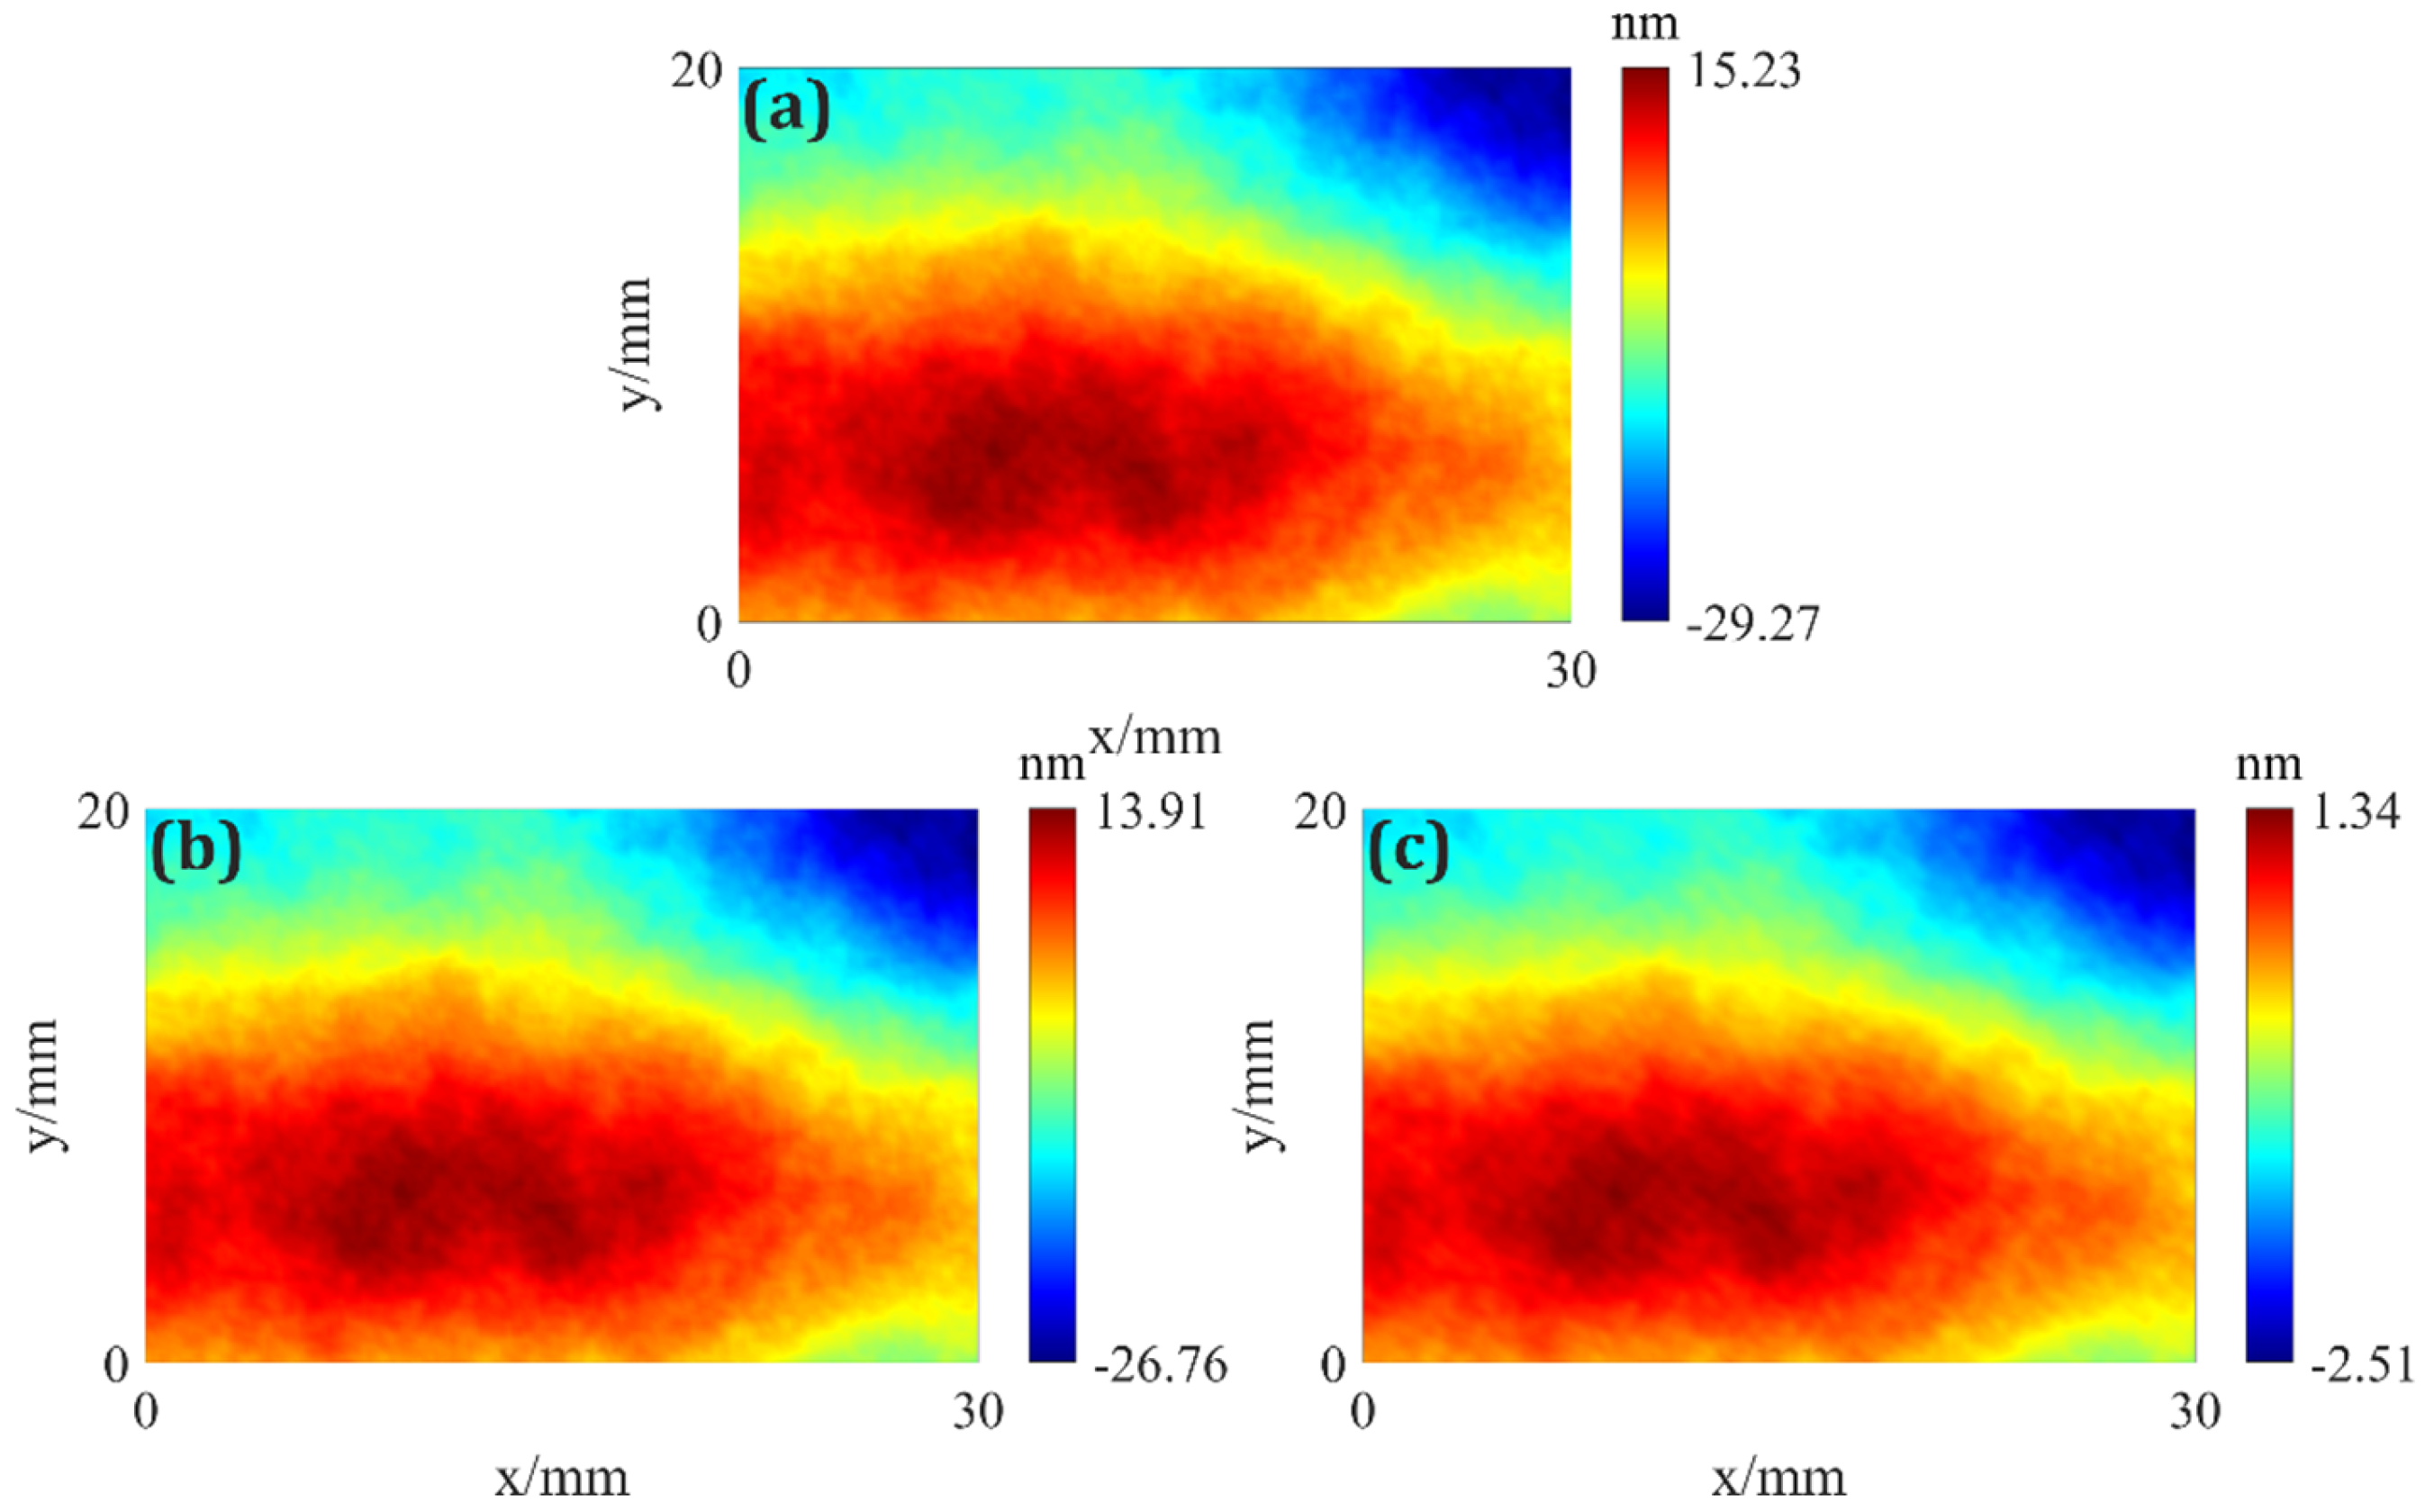
When shear amount is 1 pixel and resolution is 0.193 mm/pixel, the reconstructed figure appears as shown in Figure 14a. As shown in Figure 14b, the coefficient 2D Legendre of astigmatism induced by rotation is set to 0.01, which is not obvious in the figure. By performing a Legendre analysis of the residual, it is found that the residual mainly consists of the 9th term of 2D Legendre, which represents aberration characteristics.
The aberration introduced by CSCP translation along the x-axis can be represented by the 5th term of 2D Legendre in this simulation. Since translation along the y-axis is based on translation along the x-axis, astigmatism needs to be added to wavefronts. As shown in Figure 15, an increase in shear amount intensifies the variation in mechanical load during the movement of the displacement device, leading to greater rotational motion. This rotational motion induces astigmatism and results in an increase in additional adjustment error. Additional adjustment error decreases with the growth of resolution. Smaller resolution results in relatively minor additional adjustment error when moving 1 pixel. Therefore, optimizing shear amount and resolution can effectively reduce additional adjustment error and enhance measurement accuracy. Furthermore, simulation results show near-zero standard deviation since additional adjustment error is determined solely by pose and remains independent of figure.
(4) Reconstruction algorithm error
2DPLSI employs the Hudgin model method, in which differential wavefronts are used to approximate the ideal wavefront gradients for accurate reconstruction of the phase distribution of the test wavefront. However, inherent discrepancies exist between differential wavefronts and the ideal wavefront gradients, which introduce reconstruction algorithm error. Theoretically, reducing shear amount allows differential wavefronts to more closely approximate the ideal wavefront gradients, thereby improving the reconstruction accuracy.
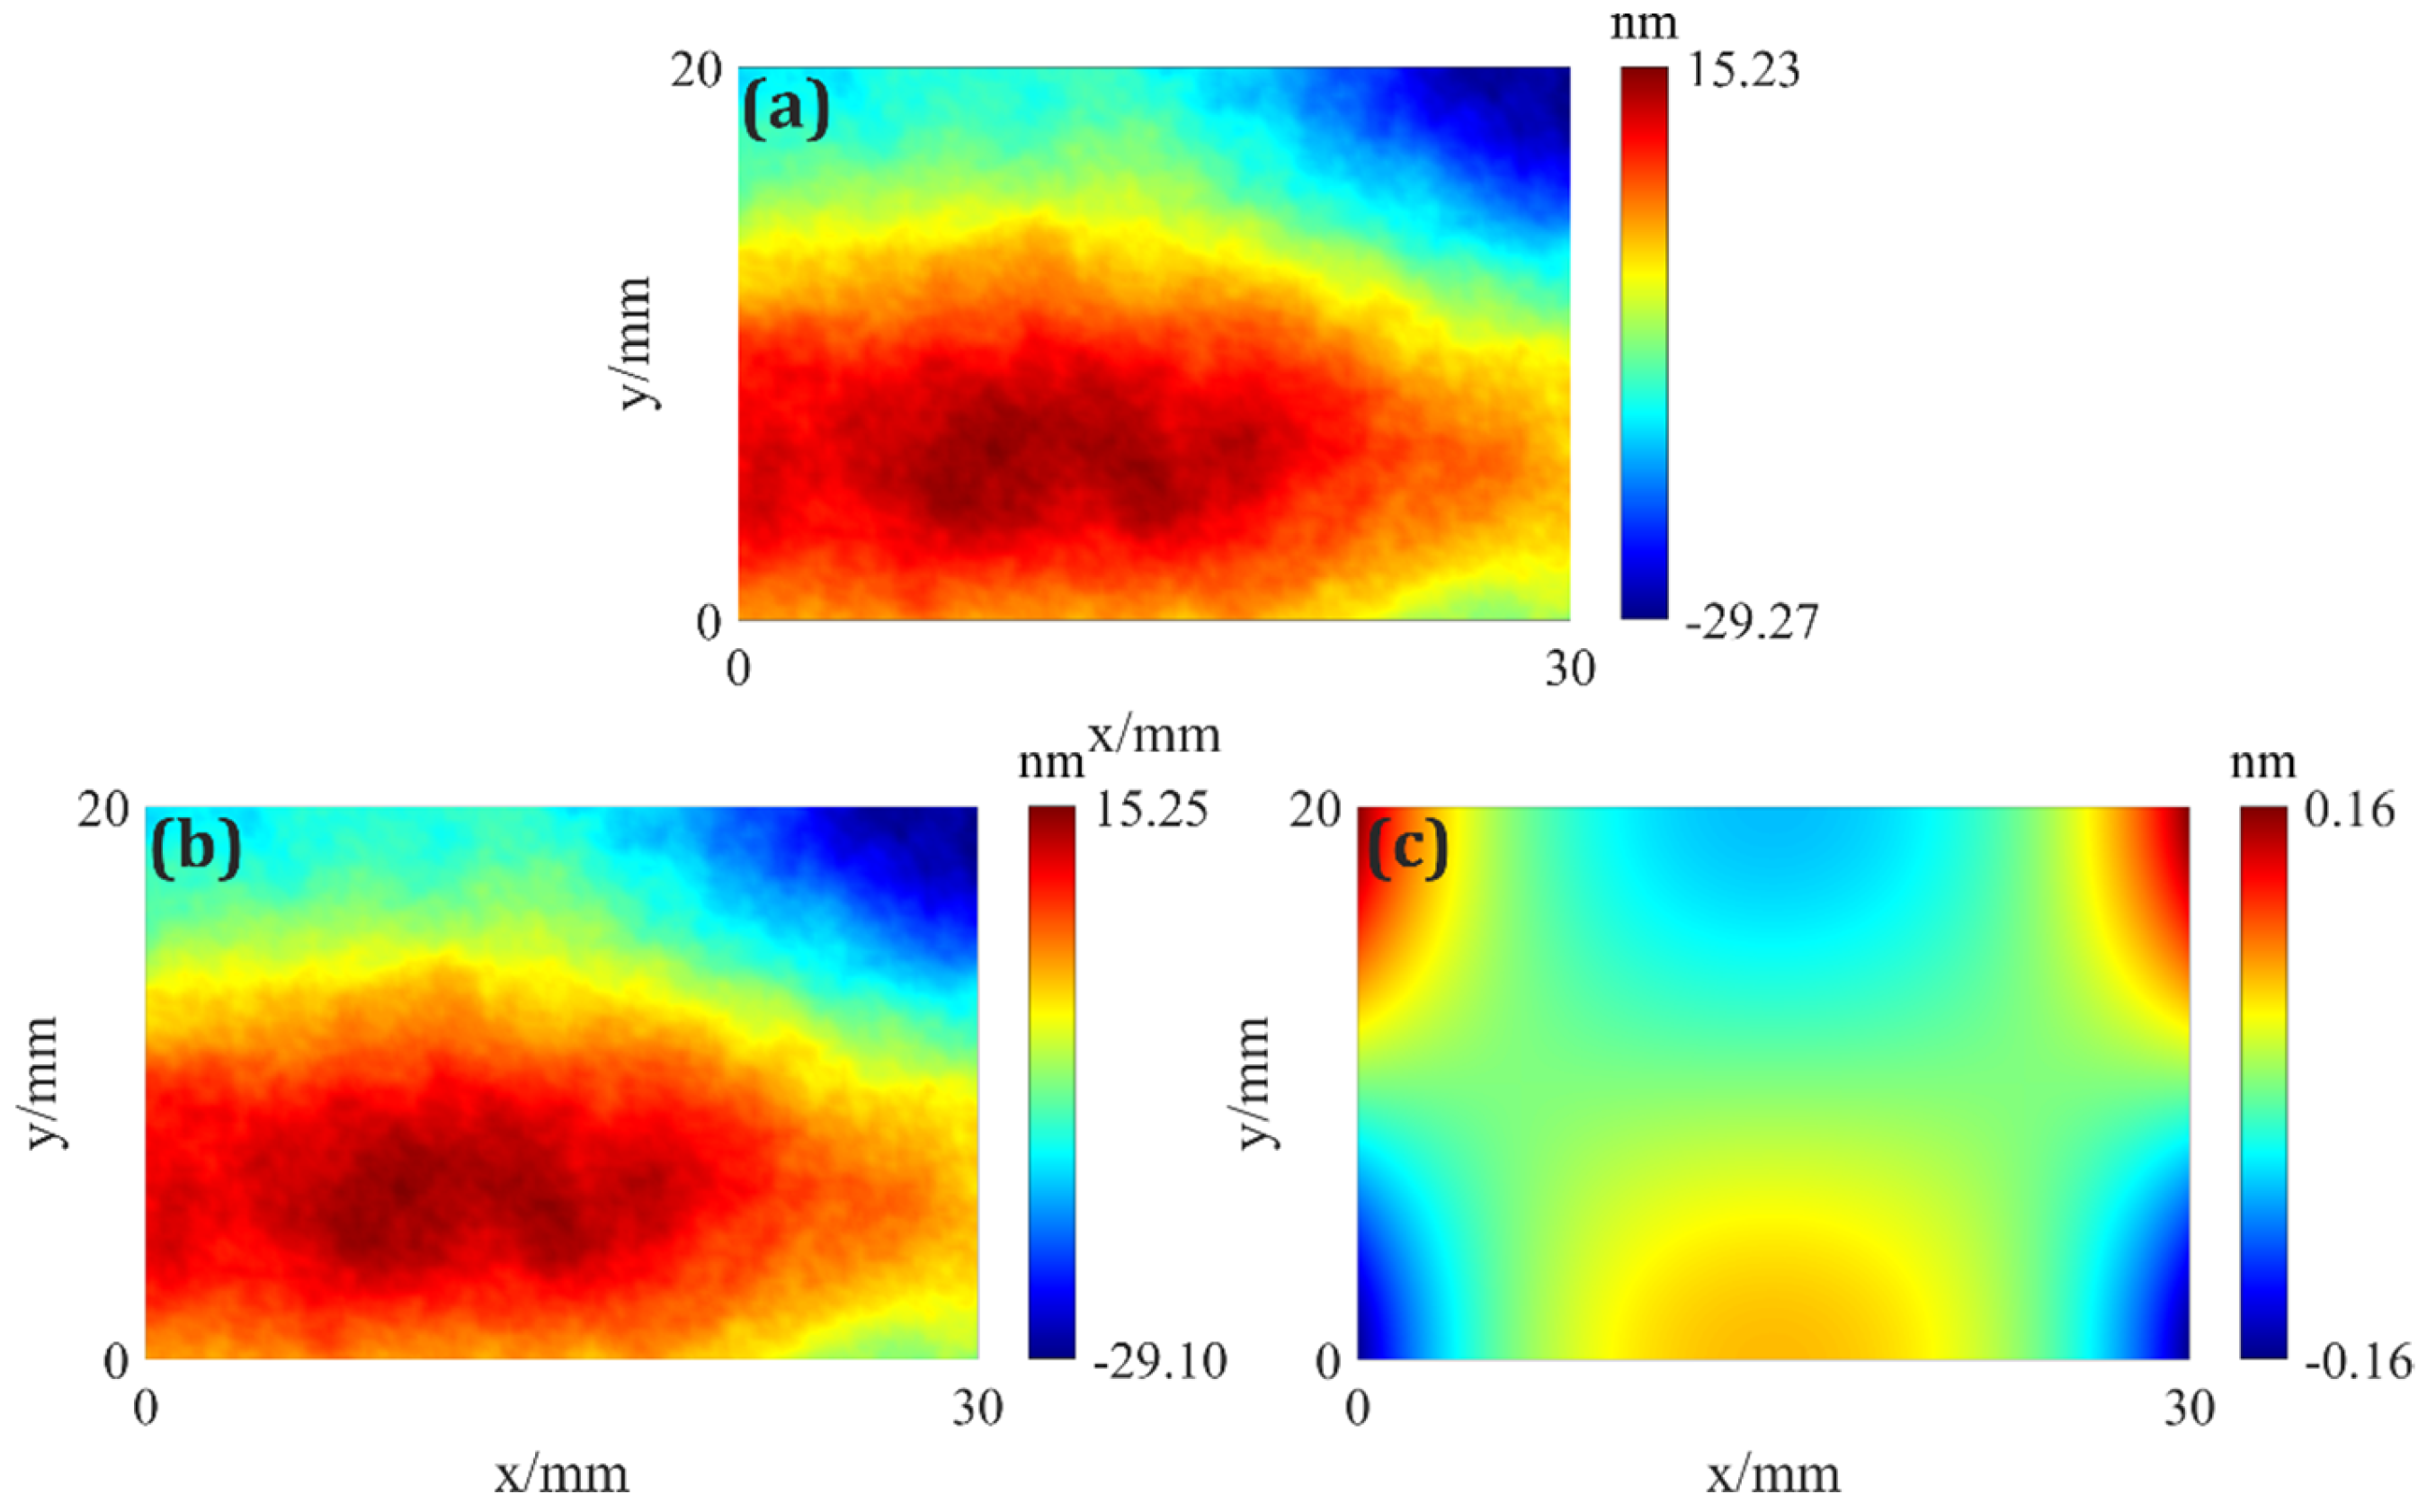
Given that the shear amount of the ideally reconstructed figure is set as 1 pixel and the resolution is 0.193 mm/pixel, to demonstrate the influence of reconstruction algorithm error, the shear amount for simulation is set to 3 pixels while the resolution is 0.193 mm/pixel. The result is illustrated in Figure 16. It can be known from the figure that the reconstructed figure with reconstruction algorithm error presents evident gridding artifacts.
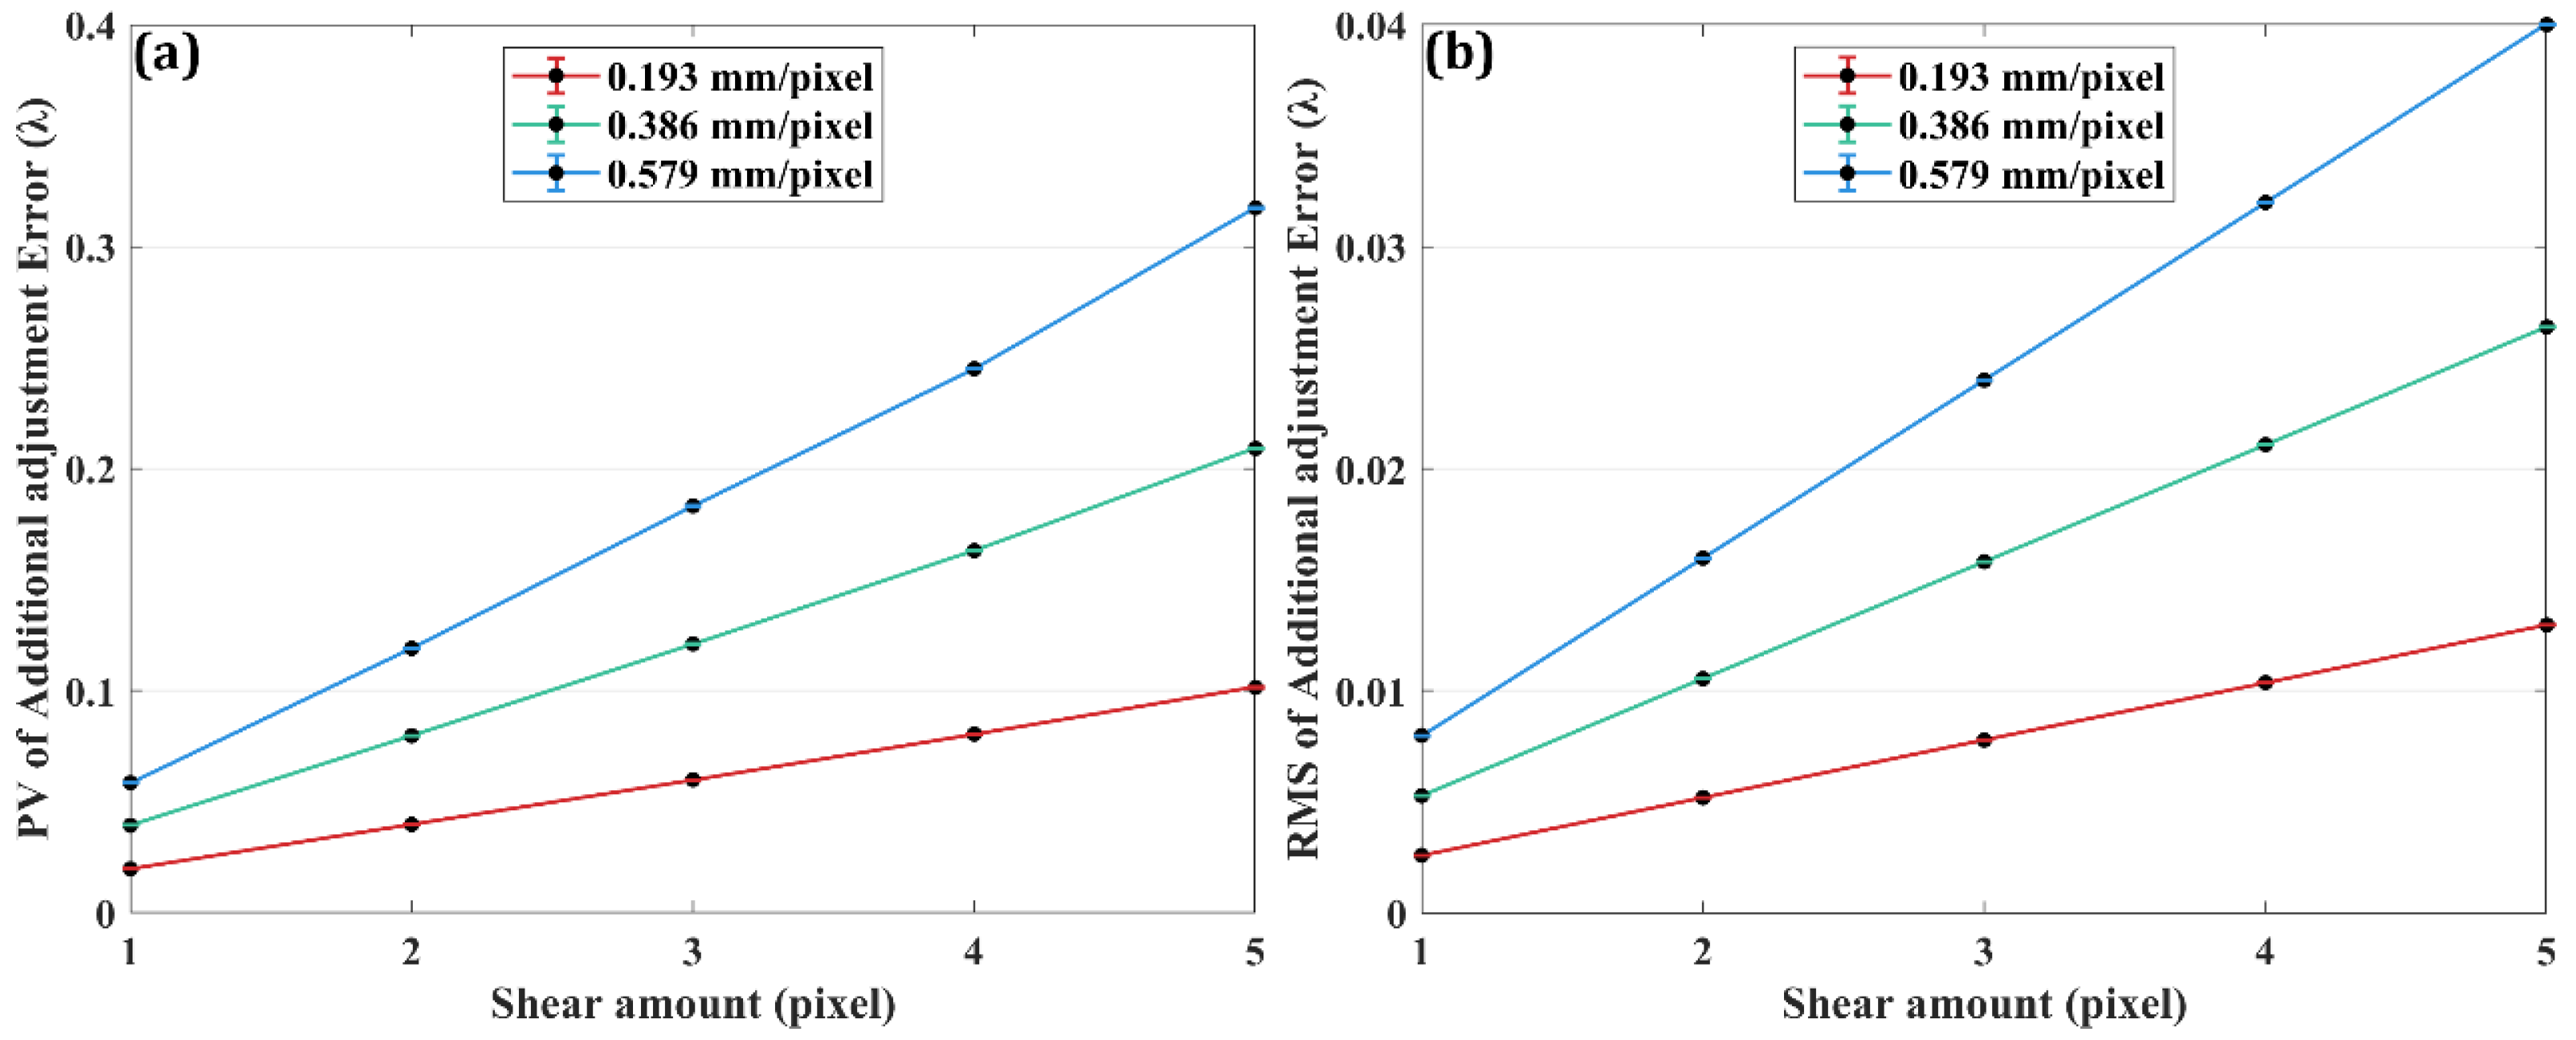
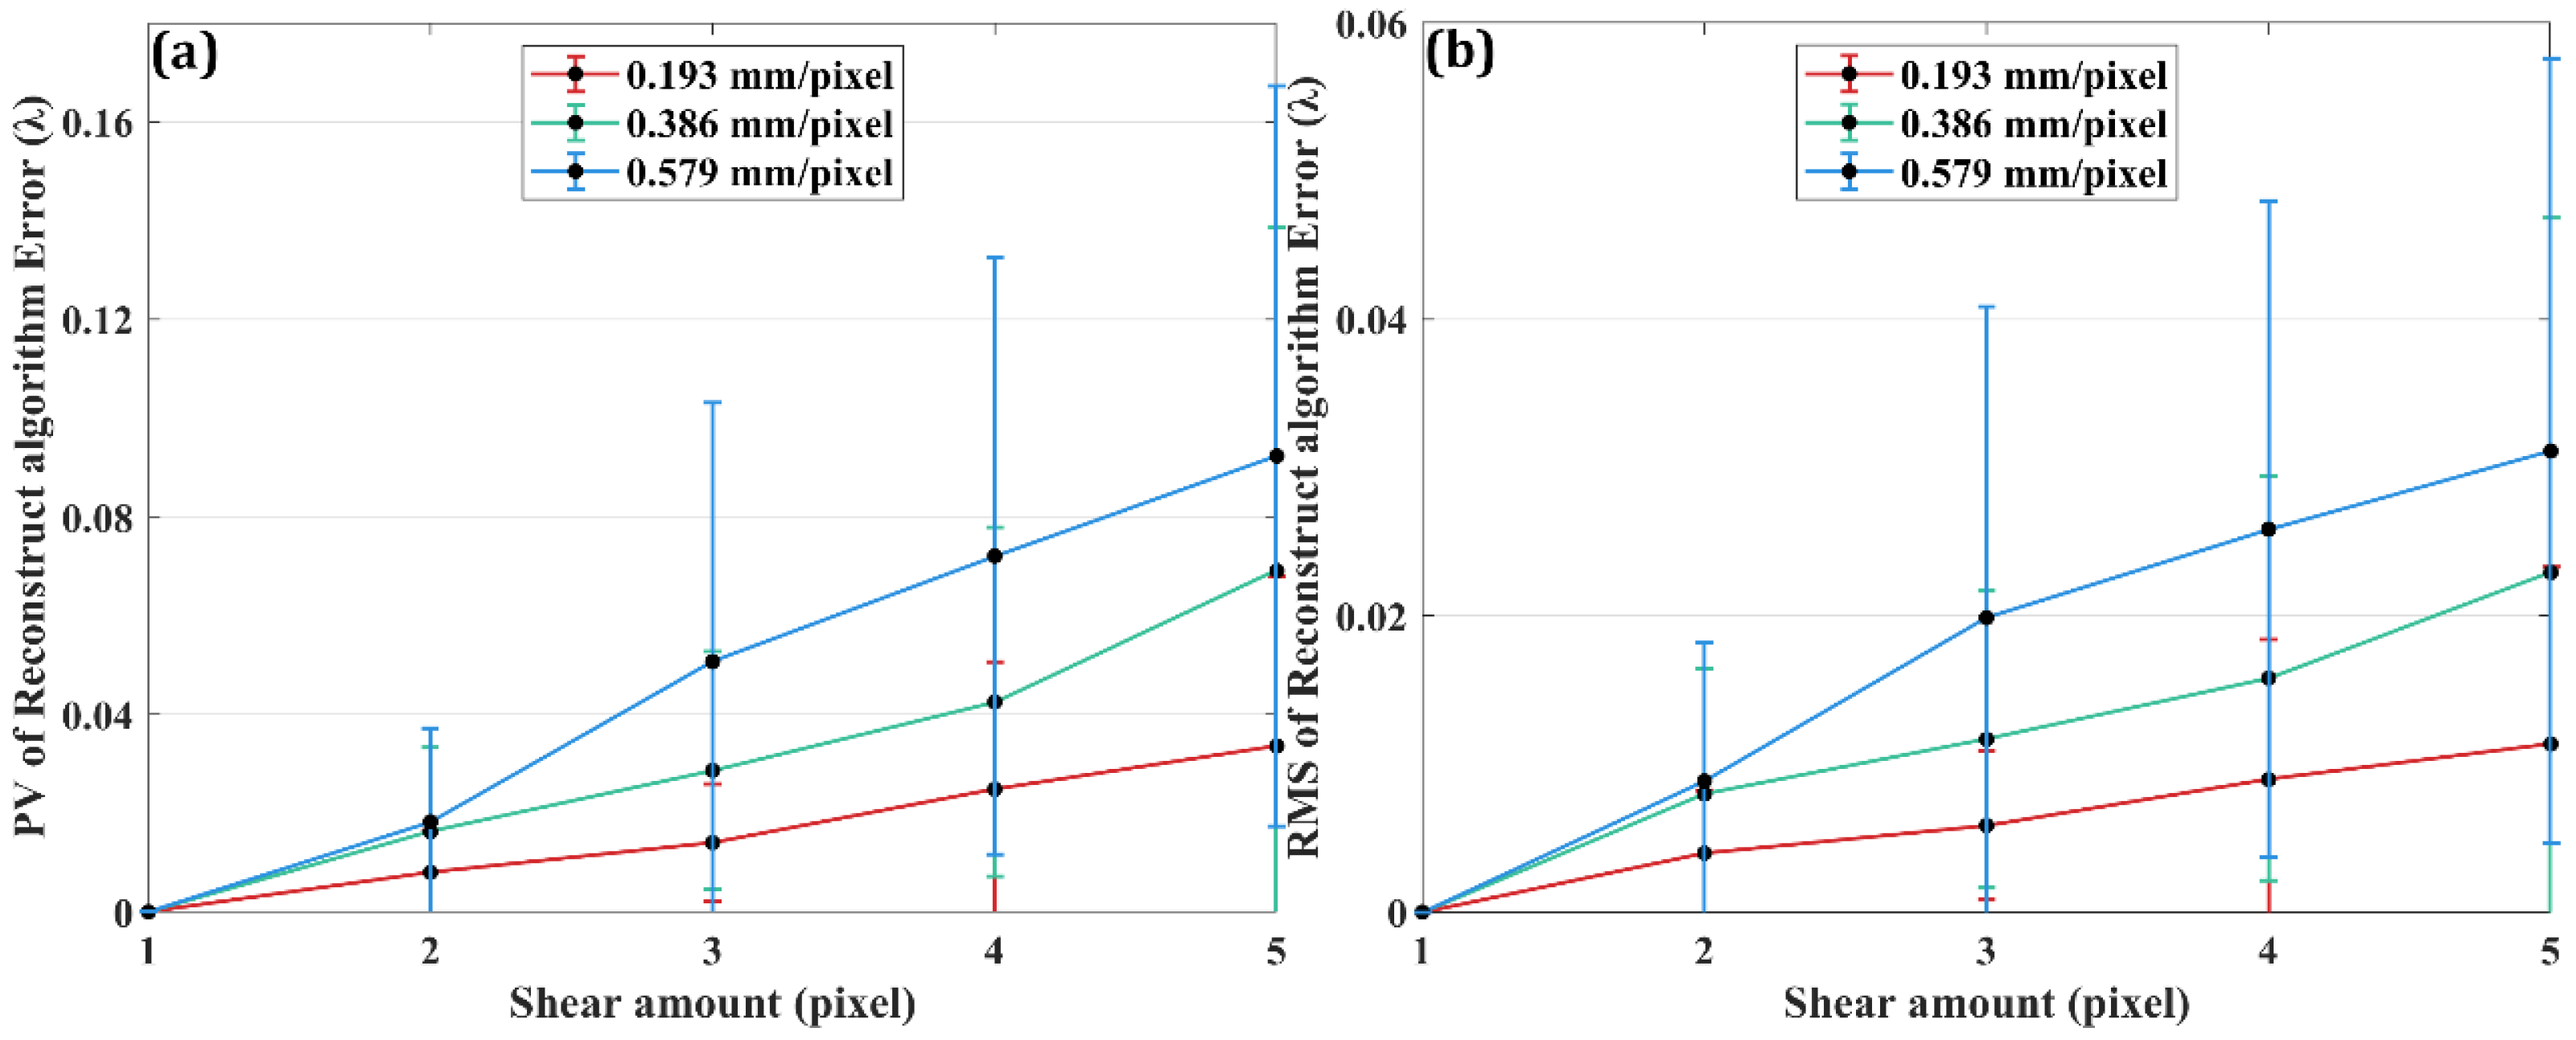
As shown in Figure 17, reconstruction algorithm error is affected by shear amount and increases in a linear relationship. The overlapping area between W1, W2, and W3 becomes smaller with the rise in shear amount, and wavefronts at different positions become more significant. This leads to an increase in reconstruction algorithm error. Reducing shear amount allows the differential wavefronts to more closely approximate the ideal differential wavefront, thereby effectively enhancing reconstruction accuracy. As resolution increases, wavefront contains more information. This effectively reduces wavefront error. When shear amount is 1 pixel, reconstruction algorithm error exhibits no significant correlation with resolution.
Based on the above simulation, a comprehensive simulation is now conducted. It considers the combined effects of MSF modulation error, shear error, additional adjustment error, and reconstruction algorithm error. In simulation of systematic error, root sum of squares (RSS) error is calculated to quantify overall scale of the above four errors and is compared with the systematic error for analysis.
Compared with RSS error and system error in Figure 18, it is found that both RSS error and systematic error rise with the increase in shear amount. In the case of high resolution, the magnitude of RSS error and systematic error decreases and standard deviation increases. In the bargain, RSS error calculates the root sum of squares of the above four errors, which assumes that the four errors are independent of each other. The trends of RSS error and systematic error are the same, but their magnitudes do not match. Shear error and additional adjustment error are caused by the movement of CSCP, making them related and both linearly correlated with shear amount. The magnitude of MSF modulation error is significantly smaller than other errors, resulting in its relatively minor weight in systematic error. Therefore, the above four errors are considered uncorrelated.

4.2. Random Error

Random error caused by noise is inevitable in measurement and inherently uncertain. The sources of random error come from factors such as slight vibrations in the measurement system, internal electronic noise, and occasional biases from the operator. Random error may cause instability in measurement results. The results cannot be fully reproduced under identical measurement conditions, and this affects the repeatability and accuracy of measurement. To minimize the impact of random error, methods such as taking the average of multiple measurements, signal filtering, and improving the stability of system can be employed. Additionally, controlling environmental conditions and enhancing the anti-interference capability of the instrument can also effectively reduce random error.
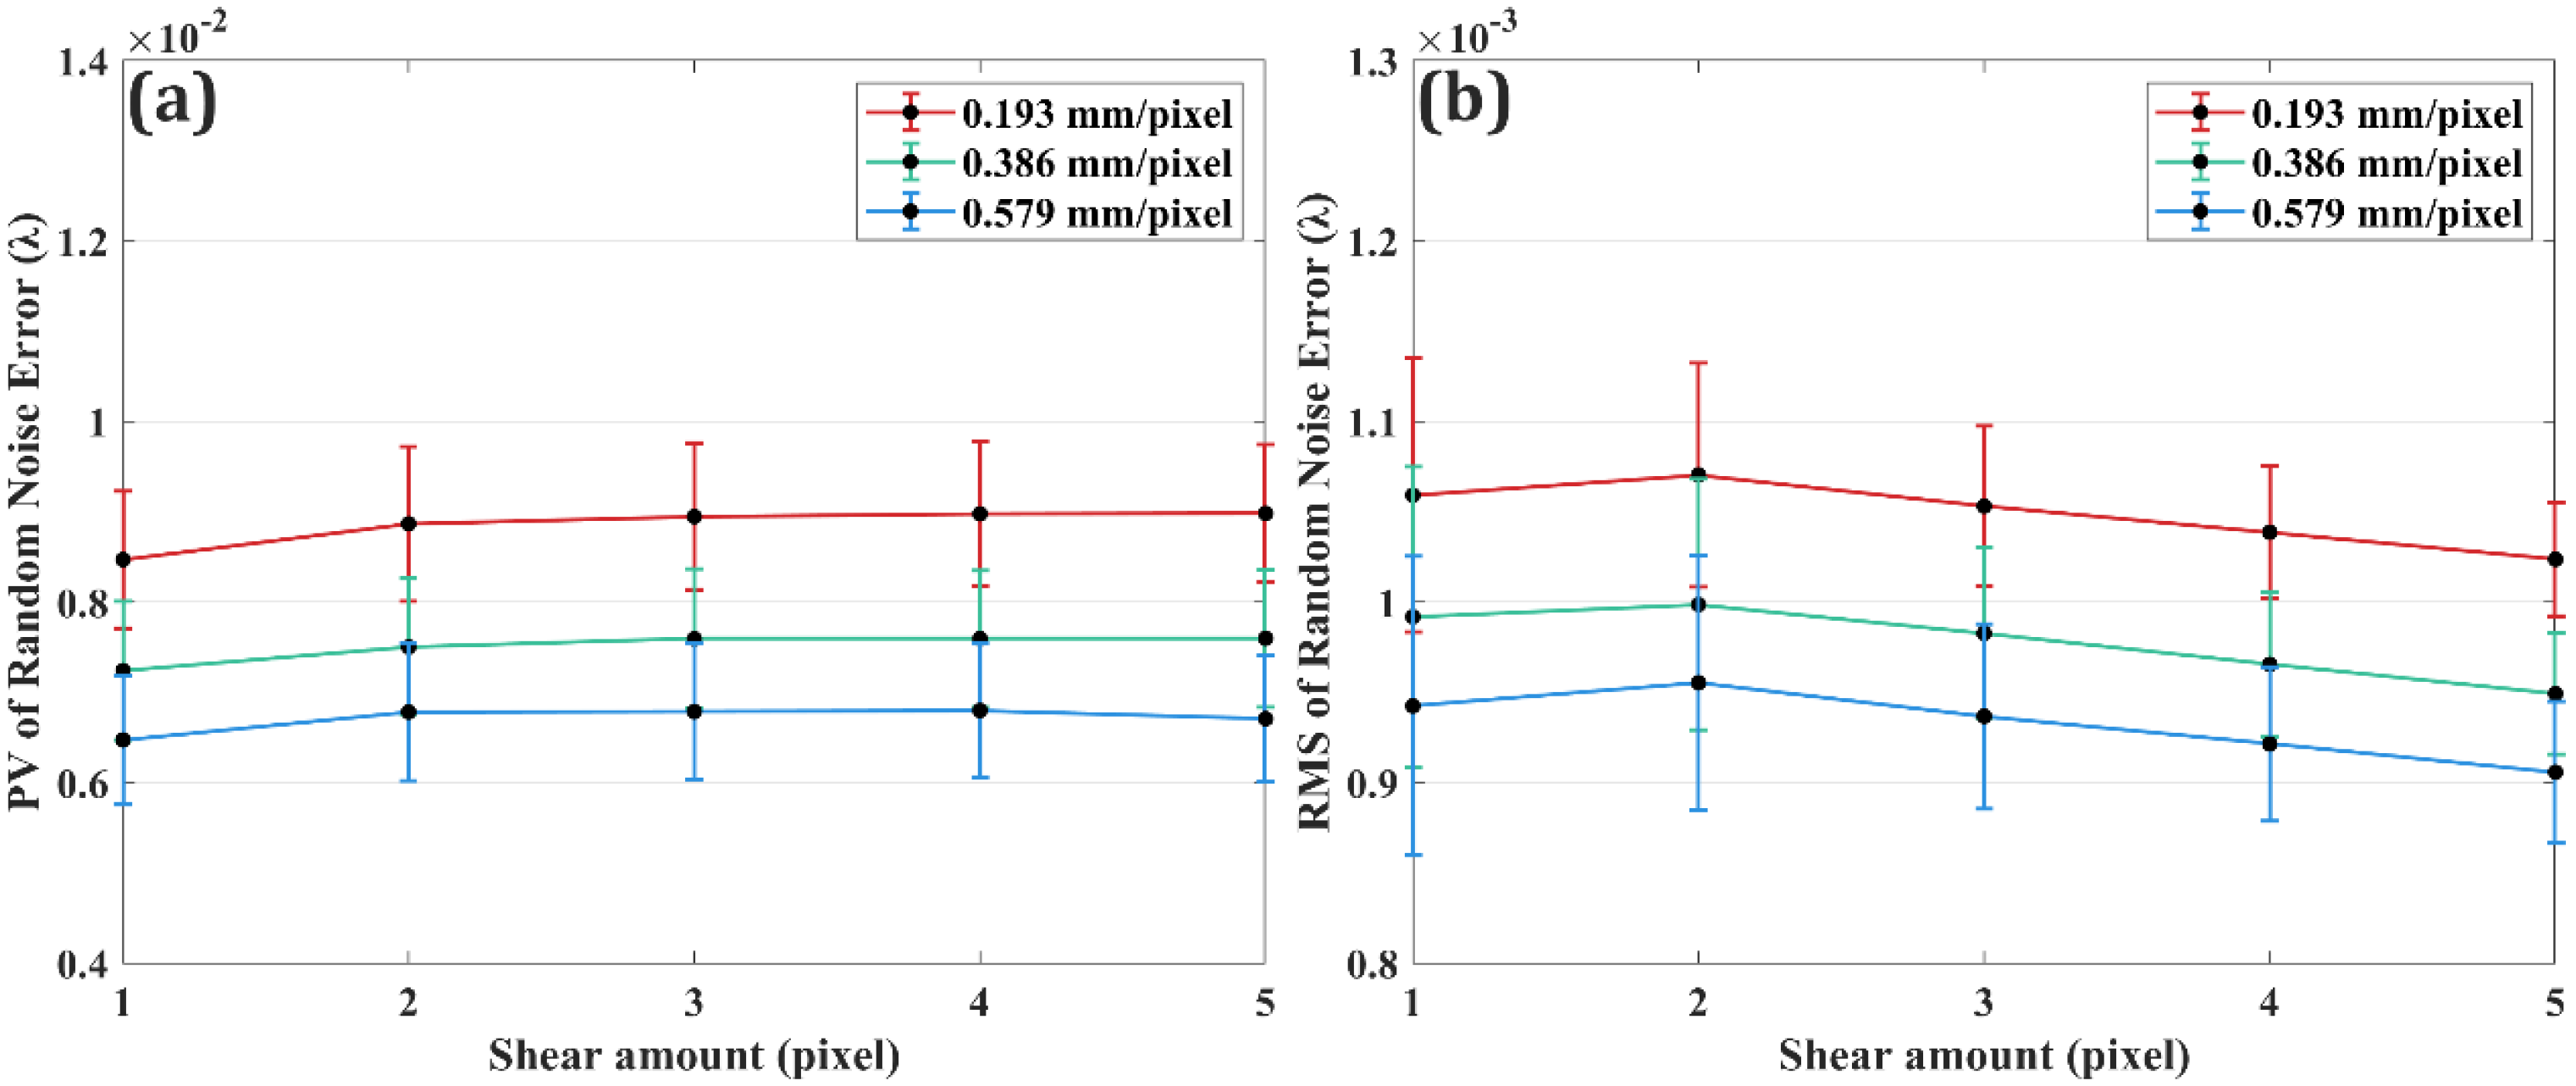
Different random noises were generated to analyze the effects of shear amount and resolution, and the results are shown in Figure 19. Because random noise is an inherent randomness in measurement, it affects the entire wavefront uniformly and is not affected by shear amount. Higher resolution enables sensors to resolve finer noise features, thereby increasing random error. Specifically, high-resolution sensors capture more high-frequency noise components that would be suppressed through spatial averaging in lower-resolution systems. Consequently, random error becomes more pronounced under high-resolution conditions.

4.3. Parameter Selection of Measurement System

The simulation of systematic error and random error shows that the resolution of the interferometer has a significant impact on the accuracy of 2DPLSI. High resolution can reduce shear error, reconstruction algorithm error, and additional adjustment error, but amplifies the effects of MSF modulation error and random error at the same time. Systematic error increases with shear amount. Under the same conditions, higher resolution results in smaller systematic error and effectively suppresses the impact of shear amount on results. Accordingly, choosing an appropriate resolution for the interferometer is essential to achieve optimal measurement accuracy. In conclusion, for the displacement device and interferometer selected in this study, the parameters of the measurement system are experimentally determined as 0.193 mm/pixel resolution and 1 pixel shear amount.

5. Experiment and Results

The CSCP wavefront error measuring experiment with 2DPLSI was carried out on the system in Section 2, using the selected parameters of measurement system. The experimental layout shown in Figure 20 was built to test an off-axis aspheric cylindrical surface (OACS). The curvature radius of the OACS is 2289.1 mm, the conic constant is −0.674, and the off-axis distance is 422.054 mm. The curvature radius of the CL is 790.23 mm, the conic constant is 0, the PV value is 6.48 λ and the RMS value is 1.26 λ, indicating low surface accuracy.
The PV value of wavefront exhibits randomness in practice, resulting in poor repeatability. However, 2DPLSI can achieve high-precision measurement under different parameters. As well, the RMS value of wavefront is usually a key performance indicator in processing and measurement. Therefore, in the analysis of this chapter, only the RMS value of wavefront is considered. In this experiment, a reconstructed figure with a shear amount of 1 pixel and a resolution of 0.193 mm/pixel is taken as reference, and a reconstructed figure of the other experimental conditions is compared with reference to verify the accuracy of the simulation.
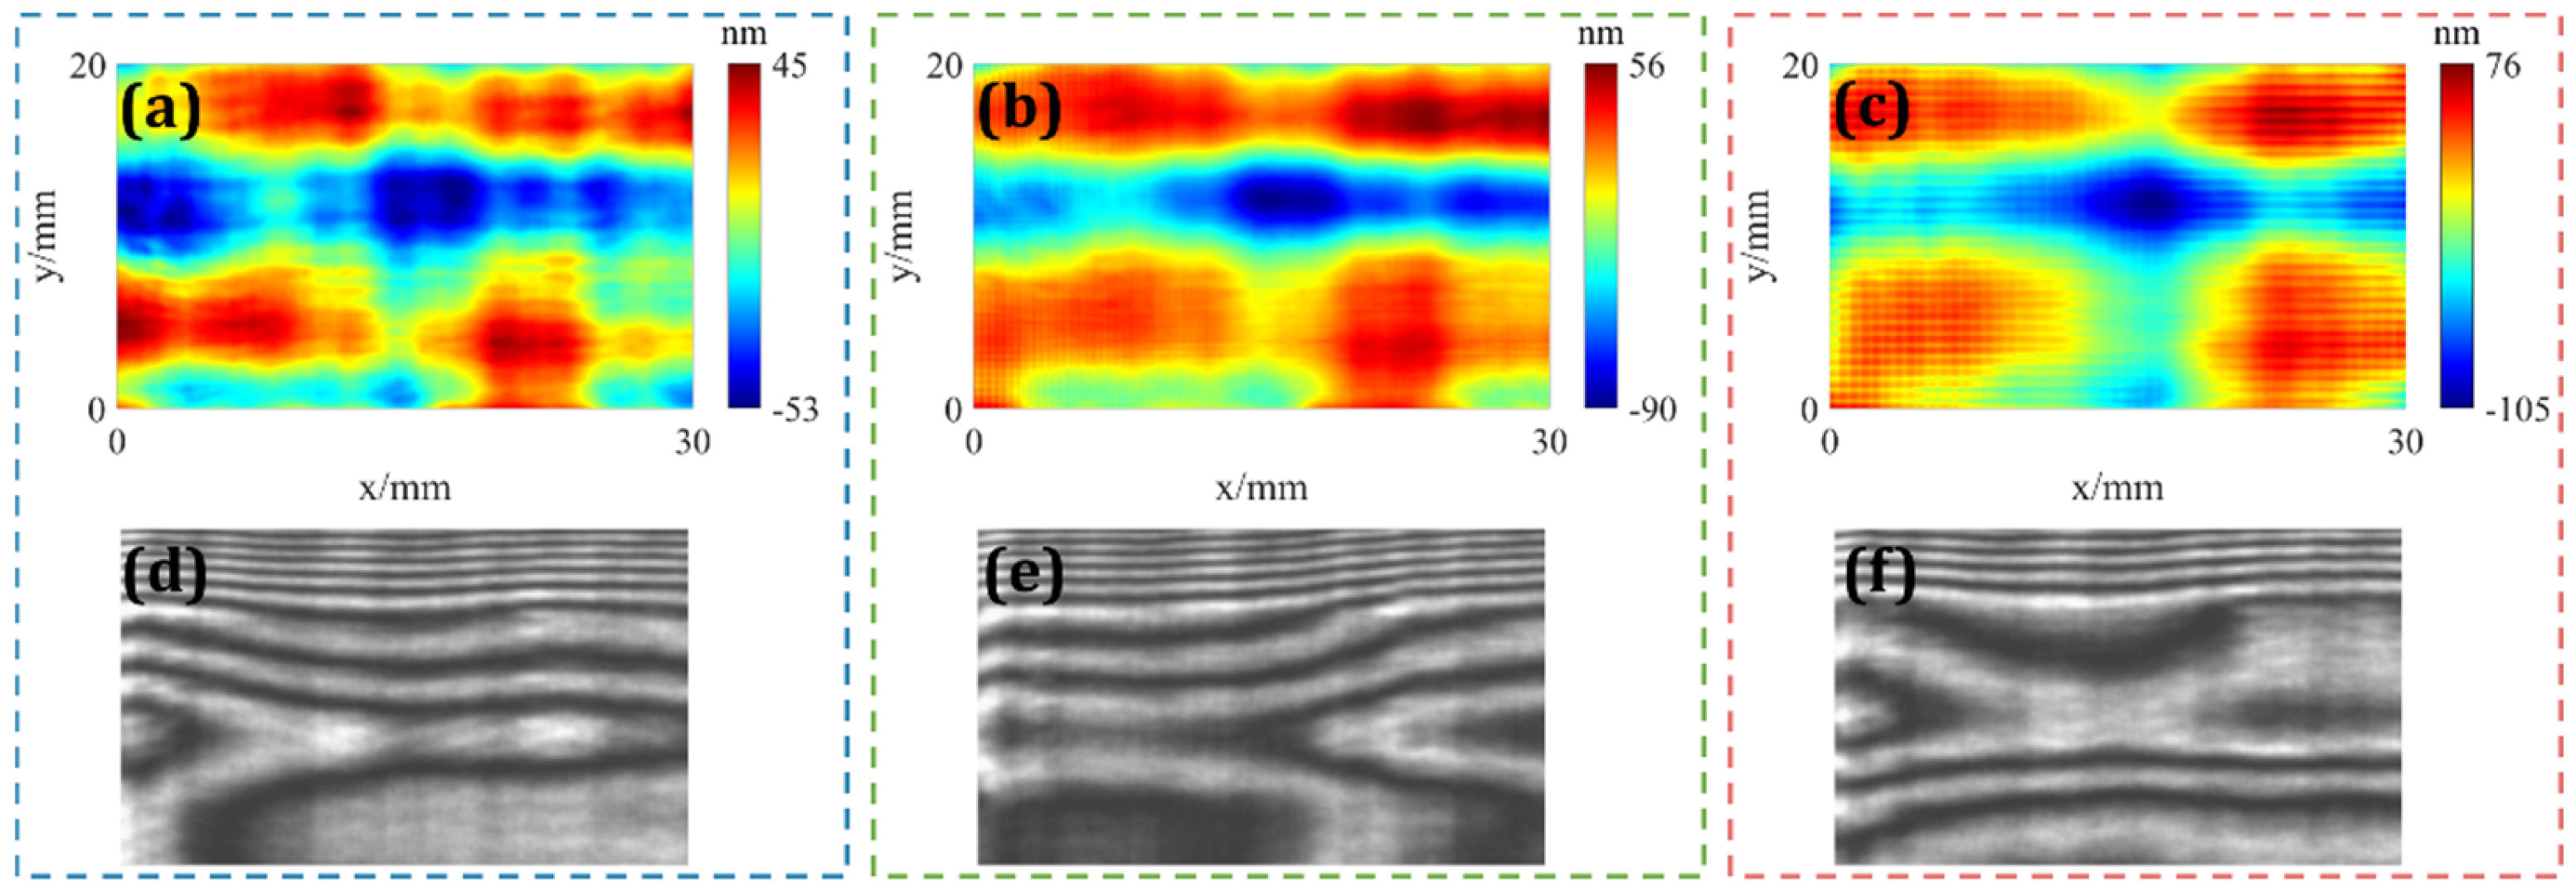
When resolution is 0.193 mm/pixel, shear amount is experimentally verified, and the experimental results are shown in Figure 21. Since the CL fails to completely compensate for the wavefront aberrations, null fringes cannot be obtained. We selected 95% of the area for reconstruction, with an effective size of 20 mm × 30 mm. An obvious gridding artifact in the reconstructed figure is observed as shear amount increases, which is demonstrated by comparing the results of the three experiments. According to analysis in Section 4, reconstruction algorithm error manifests as gridding artifacts. The presence of a larger shear amount leads to phase jumps. The algorithm cannot effectively handle these phase jumps, resulting in excessive unevenness of figure and reconstruction algorithm error. When shear amount is 1 pixel, the reconstructed figure is consistent with CSCP and gridding artifacts are minimal.
As shown in Figure 22, the RMS value of Figure 22a is 0.0209 λ, and the RMS value of Figure 22b is 0.0359 λ. The simulated values for residual are 0.0163 ± 0.0189 λ and 0.0277 ± 0.0261 λ. Experimental results indicate a wavefront PV value of 0.158 λ, which lies within the test wavefront PV range adopted in the simulation. Therefore, we can conclude that the experimental results are consistent with simulation results or within standard deviation range.
Shear amount experiments and resolution experiments only differ in data processing method. In the case of a shear amount of 1 pixel and a resolution of 0.193 mm/pixel, measurement results are the same dataset. Accordingly, the interference fringes obtained in the resolution experiment are consistent with those observed in the shear amount experiment. When shear amount is 1 pixel, resolution is experimentally verified, and the experimental results are shown in Figure 23. The lower the resolution, the blurrier the edge of the reconstructed figure. Reduced resolution means each pixel contains less information. As a result, some MSF information of wavefront error is not sampled and processed. A comparison of the results from three experiments shows that the higher the resolution, the clearer the reconstructed figure and the smaller the error. When resolution is 0.193 mm/pixel, reconstructed figure error is the smallest, and details of wavefront are better preserved.
In Figure 24, the RMS value of Figure 24a is 0.0194 λ, and the RMS value of Figure 24b is 0.337 λ. Additionally, the simulated values for residual are 0.0157 ± 0.0185 λ and 0.0266 ± 0.0254 λ in Figure 18, which are consistent with experimental results or within standard deviation range.
By comparing the shear amount experiment and the resolution experiment, it can be observed that the reconstructed figures are similar in both cases, except that gridding artifacts appear only in the reconstruction results of the shear amount experiment. In the resolution experiment, reduced resolution is achieved by translating the OACS according to corresponding shear amount, followed by downsampling. The downsampled data are then used to reconstruct the figure. Therefore, the shear amount experiment and the resolution experiment are essentially equivalent in principle. When the shear amount becomes too large, phase jumps may occur, leading to gridding artifacts in the reconstruction figure of the shear amount experiment.
In summary, measurement errors increase with larger shear amounts or reduced resolution. This finding not only validates the analysis of optimal measurement parameters in Section 4 but also highlights the critical importance of precise control over these parameters in applications. These results provide essential references for the design and operation of optimized measurement system parameters while demonstrating the significant influence of resolution and shear amount on the accuracy of wavefront reconstruction. Notably, under high-resolution conditions with small shear amounts, both quality and stability of wavefront reconstruction exhibit substantial enhancement.

6. Discussion

2DPLSI enables non-null interferometric measurement of CSCP and serves as a high-precision measurement method for off-axis aspherical cylinders. This paper designs a simulation to analyze the sources and impacts of measurement error. In addition, a wavefront construction method based on PSD is proposed for use in simulation. Simulation results show that the measurement error of 2DPLSI increases with shear amount and decreases with the rise in interferometer resolution. The main factors affecting the measurement error of 2DPLSI are MSF modulation error, shear error, additional adjustment error, and reconstruction algorithm error. MSF modulation error increases with the reduction in resolution and is constant without being affected by shear amount. Other errors decrease with resolution and increase with shear amount, among which shear error and additional adjustment error increase linearly. The above four errors are correlated. Random error is not affected by shear amount, and taking the average value of multiple measurements can effectively suppress the influence of random error.
The parameters of measurement system can be adjusted using existing devices. The simulation, designed based on this approach, provides optimized system parameters, which have been experimentally verified on 2DPLSI measurement system. The measurement error of 2DPLSI is the smallest when shear amount is 1 pixel and resolution is 0.193 mm/pixel. Moreover, variation between the measurement results of different parameters is consistent with simulation results.

Author Contributions

Conceptualization, J.Y.; Data Curation, L.Z. and Y.C.; Funding Acquisition, Z.Z. and S.W.; Investigation, Z.Z., Y.Z., Z.N. and S.W.; Methodology, L.Z., S.Z., Z.L., S.W. and K.H.; Project Administration, Z.Z., Z.N., W.L. and K.H.; Resources, W.L.; Supervision, J.Y., Z.L. and M.K.; Validation, L.Z. and Y.C.; Writing—Original Draft, L.Z.; Writing—Review and Editing, S.Z., Y.Z., Z.L., M.K., S.W. and K.H. All authors have read and agreed to the published version of the manuscript.

Funding

This research was funded by the National Natural Science Foundation of China, grant No. 62305317, National key research and development program of China, grant No. 2022YFB3403402, and Natural Science Foundation of Zhejiang Province, grant No. LQ24F050007.

Institutional Review Board Statement

Not applicable.

Informed Consent Statement

Not applicable.

Data Availability Statement

The data underlying the results presented in this paper are not publicly available at this time but may be obtained from the authors upon reasonable request.

Acknowledgments

The authors would like to thank the reviewers for their helpful suggestions for this article.

Conflicts of Interest

The authors declare no conflicts of interest.

References

  1. Malek, S.C.; Overvig, A.C.; Alu, A.; Yu, N.F. Multifunctional resonant wavefront-shaping meta-optics based on multilayer and multi-perturbation nonlocal metasurfaces. Light-Sci. Appl. 2022, 11, 246. [Google Scholar] [CrossRef] [PubMed]
  2. Kang, S.; Kang, P.; Jeong, S.; Kwon, Y.; Yang, T.D.; Hong, J.H.; Kim, M.; Song, K.D.; Park, J.H.; Lee, J.H.; et al. High-resolution adaptive optical imaging within thick scattering media using closed-loop accumulation of single scattering. Nat. Commun. 2017, 8, 2157. [Google Scholar] [CrossRef] [PubMed]
  3. Delmdahl, R. The excimer laser: Precision engineering. Nat. Photonics 2010, 4, 286. [Google Scholar] [CrossRef]
  4. Padilla, W.J.; Averitt, R.D. Imaging with metamaterials. Nat. Rev. Phys. 2022, 4, 85–100. [Google Scholar] [CrossRef]
  5. Chen, B.; Chang, B.J.; Roudot, P.; Zhou, F.; Sapoznik, E.; Marlar-Pavey, M.; Hayes, J.B.; Brown, P.T.; Zeng, C.W.; Lambert, T.; et al. Resolution doubling in light-sheet microscopy via oblique plane structured illumination. Nat. Methods 2022, 19, 1419–1426. [Google Scholar] [CrossRef]
  6. Liu, H.Y.; Yan, L.S.; Chen, H.S.; Liu, X.; Liu, H.Y.; Chew, S.H.; Gliserin, A.; Wang, Q.; Zhang, J.W. High-order femtosecond vortices up to the 30th order generated from a powerful mode-locked Hermite-Gaussian laser. Light-Sci. Appl. 2023, 12, 207. [Google Scholar] [CrossRef]
  7. Gatzweiler, A.; Glatzel, H. Interferometric measurement of near-cylindrical surfaces with high amplitude resolution. Appl. Opt. 1995, 34, 7207–7212. [Google Scholar] [CrossRef]
  8. Zhou, Q.; Wang, J.H.; Xu, M. Interferometric method of measuring external cylindrical surfaces. Appl. Opt. 2021, 60, 47–51. [Google Scholar] [CrossRef]
  9. Viotti, M.R.; Albertazzi, A.; Dal Pont, A.; Fantin, A.V. Evaluation of a novel algorithm to align and stitch adjacent measurements of long inner cylindrical surfaces with white light interferometry. Opt. Lasers Eng. 2007, 45, 852–859. [Google Scholar] [CrossRef]
  10. León-Rodríguez, M.; Rayas, J.A.; Martínez-García, A.; Martínez-González, A.; Téllez-Quiñones, A.; Porras-Aguilar, R. Panoramic reconstruction of quasi-cylindrical objects with digital holography and a conical mirror. Opt. Lett. 2021, 46, 4749–4752. [Google Scholar] [CrossRef]
  11. Liu, F.; Robinson, B.M.; Reardon, P.J.; Geary, J.M. Separating misalignment from misfigure in interferograms on cylindrical optics. Opt. Express 2013, 21, 8856–8864. [Google Scholar] [CrossRef] [PubMed]
  12. Blinder, D.; Birnbaum, T.; Ito, T.; Shimobaba, T. The state-of-the-art in computer generated holography for 3D display. Light Adv. Manuf. 2022, 3, 572–600. [Google Scholar] [CrossRef]
  13. Han, S.; Zhang, L.H.; Jia, W.X. Absolute Calibration of Smooth Surface and Cylindrical Surface Measurement. In Optical Metrology and Inspection for Industrial Applications VIII; SPIE: Washington, DC, USA, 2021. [Google Scholar]
  14. Huang, Y.; Ma, J.; Yuan, C.J.; Pruss, C.; Sun, W.Y.; Liu, M.C.; Zhu, R.H.; Gao, Z.S.; Osten, W.G. Absolute test for cylindrical surfaces using the conjugate differential method. Opt. Eng. 2016, 55, 114104. [Google Scholar] [CrossRef]
  15. Zhang, S.; Hou, X.; Hu, X.C.; Li, J.H.; Li, M.F. Stitching interferometry using Computer-Generated Hologram (CGH) based on sub-aperture adjustment aberration of 2-D Chebyshev polynomial. Opt. Lasers Eng. 2021, 143, 106618. [Google Scholar] [CrossRef]
  16. Hu, H.; Sun, Z.Z.; Xue, S.; Guan, C.L.; Dai, Y.F.; Liu, J.F.; Peng, X.Q.; Chen, S.Y.; Liu, Y. Self-calibration interferometric stitching test method for cylindrical surfaces. Opt. Express 2022, 30, 39188–39206. [Google Scholar] [CrossRef]
  17. Li, J.; Shen, H.; Wang, J.; Zhu, R. Common-path interferometry with tilt carrier for surface measurement of complex optics. Appl. Opt. 2019, 58, 1991–1997. [Google Scholar] [CrossRef]
  18. Kong, L.; Chen, S. Subaperture stitching test for large aperture mild acylinders. Opt. Commun. 2020, 455, 124526. [Google Scholar] [CrossRef]
  19. Chen, Y.; Hai, K.; Zhang, X.; Zhang, S.; Zheng, Y.; Liu, Q.; Su, X.; Huang, W.; Zhang, X.; Liu, D.; et al. Non-null test of cylindrical surfaces with complex parameters based on pseudo shearing interferometry. Opt. Lasers Eng. 2025, 184, 108687. [Google Scholar] [CrossRef]
  20. Zang, Z.; Peng, S.; Jin, W.; Zuo, Y.; Steinmeyer, G.; Dai, Y.; Liu, D. In-situ measurement and compensation of complex spatio-temporal couplings in ultra-intense lasers. Opt. Lasers Eng. 2023, 160, 107239. [Google Scholar] [CrossRef]
  21. Peng, S.; Xu, Z.; Zang, Z.; Li, X.; Dai, Y.; Wang, X.; Jin, B.; Li, X.; Sun, J.; Yang, B.; et al. Accuracy analysis of pseudo lateral shearing interferometry measuring complex spatio-temporal couplings. Opt. Laser Technol. 2023, 167, 109792. [Google Scholar] [CrossRef]
  22. Zhu, Y.; Tian, A.; Liu, B.; Wang, H. Error correction analysis of wavefront testing in quadriwave lateral shearing interferometry. J. Opt. Soc. Am. A 2024, 41, C10–C21. [Google Scholar] [CrossRef]
  23. Zhu, W.; Li, J.; Chen, L.; Zheng, D.; Yang, Y.; Han, Z. Systematic error analysis and correction in quadriwave lateral shearing interferometer. Opt. Commun. 2016, 380, 214–220. [Google Scholar] [CrossRef]
  24. Peng, L.; Feng, T.; Xiangzhao, W. Relationship between shear ratio and reconstruction accuracy in lateral shearing interferometry. Opt. Eng. 2020, 59, 034113. [Google Scholar] [CrossRef]
  25. Rhee, H.-G.; Ghim, Y.-S.; Lee, J.; Yang, H.-S.; Lee, Y.-W. Rotational error correction in lateral shearing interferometry for freeform surface measurement. In Optical Fabrication and Testing; Optica Publishing Group: Washington, DC, USA, 2014. [Google Scholar]
  26. Dai, F.; Tang, F.; Wang, X.; Sasaki, O.; Zhang, M. High spatial resolution zonal wavefront reconstruction with improved initial value determination scheme for lateral shearing interferometry. Appl. Opt. 2013, 52, 3946–3956. [Google Scholar] [CrossRef]
  27. Dai, F.; Tang, F.; Wang, X.; Sasaki, O. Generalized zonal wavefront reconstruction for high spatial resolution in lateral shearing interferometry. J. Opt. Soc. Am. A Opt. Image Sci. Vis. 2012, 29, 2038–2047. [Google Scholar] [CrossRef]
  28. Sidick, E. Power Spectral Density Specification and Analysis of Large Optical Surfaces. In Modeling Aspects in Optical Metrology II; SPIE: Washington, DC, USA, 2009. [Google Scholar]
  29. Williams, W.; Auerbach, J.; Hunt, J.; Lawson, L.; Manes, K. NIF optics phase gradient specfication. In US National Ignition Facility; Lawrence Livermore National Lab.: Livermore, CA, USA, 1997. [Google Scholar]
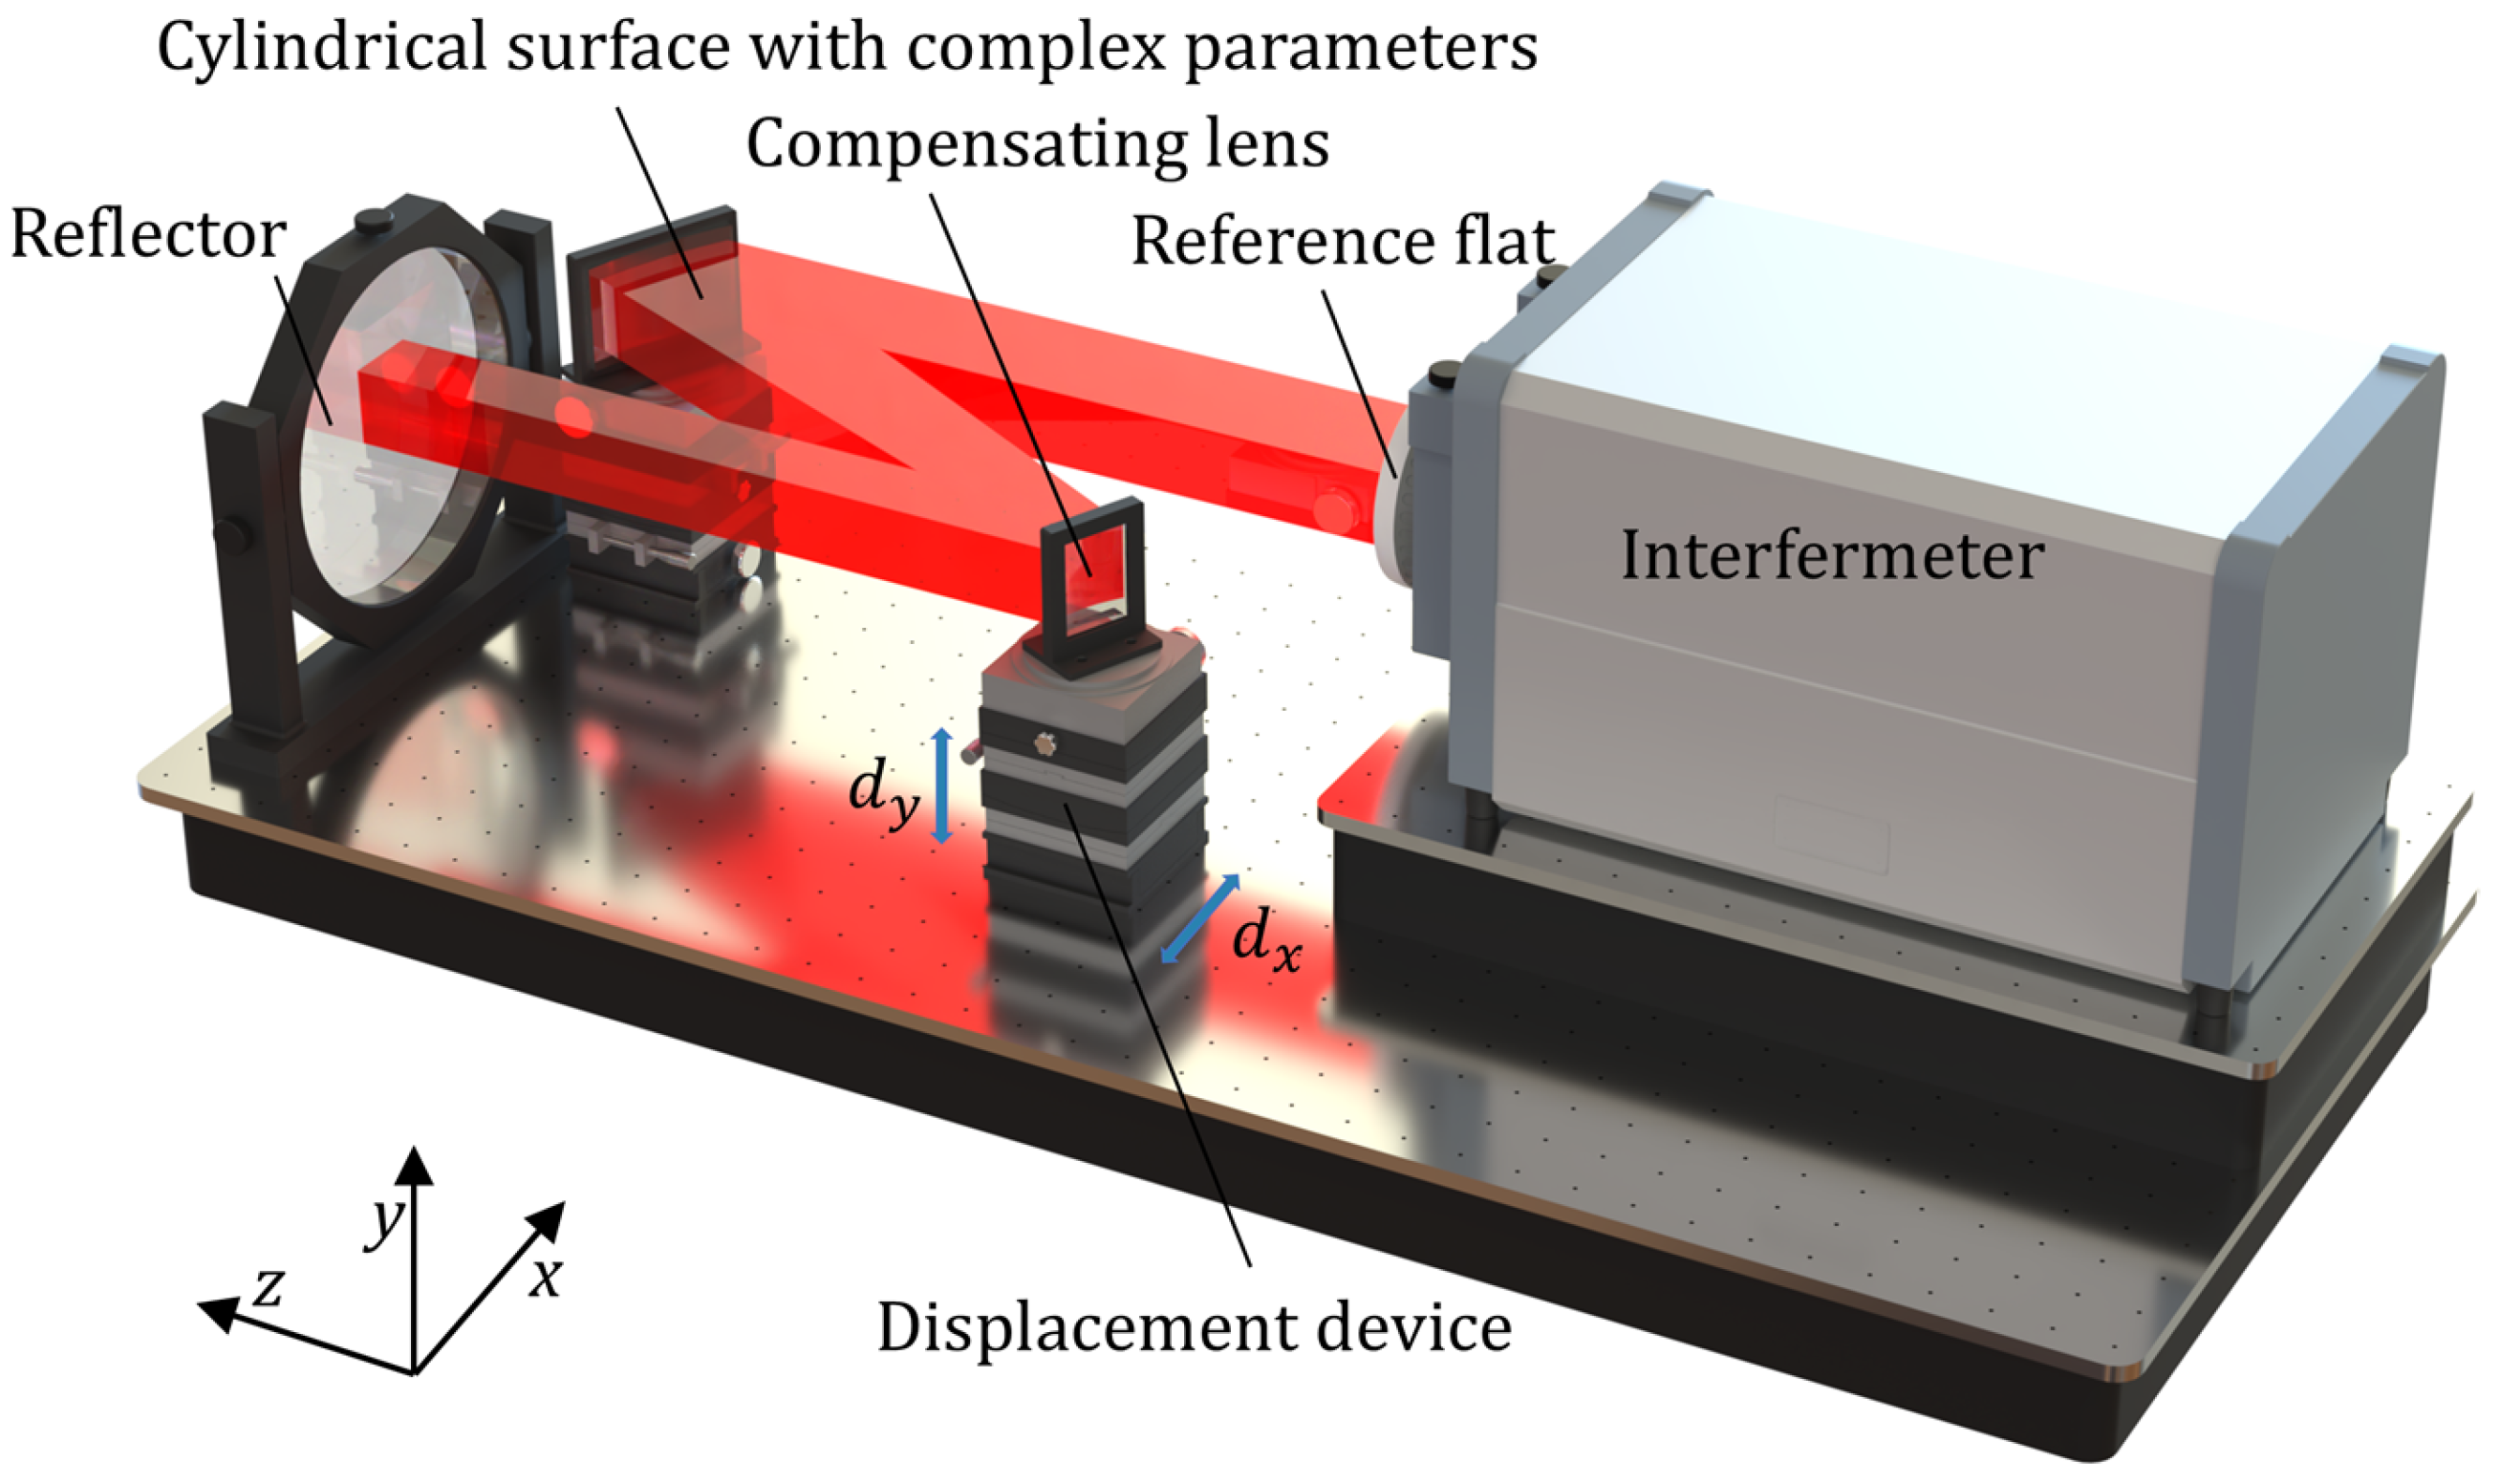
Figure 1. System for 2DPLSI of CSCP.
Photonics 12 01059 g001
Figure 2. The classification of 2DPLSI measurement error.
Photonics 12 01059 g002
Figure 3. The LSF wavefront constructed based on 2D Legendre.
Photonics 12 01059 g003
Figure 4. The MSF wavefront constructed based on PSD.
Photonics 12 01059 g004
Figure 5. The constructed wavefront.
Photonics 12 01059 g005
Figure 6. Schematic diagram of simulation with resolution.
Photonics 12 01059 g006
Figure 7. MSF modulation interferogram.
Photonics 12 01059 g007
Figure 8. The effect of MSF modulation error on 2DPLSI. (a) Ideal figure. (b) Figure with MSF modulation error. (c) Residual distribution of (a,b).
Photonics 12 01059 g008
Figure 9. Simulation results of MSF modulation error with different shear amounts and resolutions. The (a) PV and (b) RMS value of MSF modulation error.
Photonics 12 01059 g009
Figure 10. Schematic diagram of shear error. (a) 3D schematic with geometric definitions. (b) Top view of translation along the x-axis.
Photonics 12 01059 g010
Figure 11. The effect of shear error on 2DPLSI. (a) Ideal figure. (b) Figure with shear error. (c) Residual distribution of (a,b).
Photonics 12 01059 g011
Figure 12. Simulation results of shear error with different shear amounts and resolutions. The (a) PV and (b) RMS value of shear error.
Photonics 12 01059 g012
Figure 13. Three-dimensional schematic of additional adjustment error with geometric definitions.
Photonics 12 01059 g013
Figure 14. The effect of additional adjustment error on 2DPLSI. (a) Ideal figure. (b) Figure with additional adjustment error. (c) Residual distribution of (a,b).
Photonics 12 01059 g014
Figure 15. Simulation results of additional adjustment error with different shear amounts and resolutions. The (a) PV and (b) RMS value of additional adjustment error.
Photonics 12 01059 g015
Figure 16. The effect of reconstruction algorithm error on 2DPLSI. (a) Ideal figure. (b) Figure with reconstruction algorithm error.
Photonics 12 01059 g016
Figure 17. Simulation results of reconstruction algorithm error with different shear amounts and resolutions. The (a) PV and (b) RMS value of reconstruction algorithm error.
Photonics 12 01059 g017
Figure 18. The RMS value of simulation for different shear amounts and resolutions. (a) RSS error. (b) System error.
Photonics 12 01059 g018
Figure 19. Simulation results of random error with different shear amounts and resolutions. The (a) PV and (b) RMS value of random error.
Photonics 12 01059 g019
Figure 20. Experimental layout for testing OACS.
Photonics 12 01059 g020
Figure 21. Shear amount verification experiment. Reconstruction figure with shear amount of (a) 1 pixel, (b) 2 pixels, (c) 3 pixels. (d) is the interferogram of measurement result W2 from (a). (e) is the interferogram of measurement result W2 from (b). (f) is the interferogram of measurement result W2 from (c).
Photonics 12 01059 g021
Figure 22. (a) Residual distribution of reconstructed figure with shear amount of 1 pixel and 2 pixels. (b) Residual distribution of reconstructed figure with shear amount of 1 pixel and 3 pixels.
Photonics 12 01059 g022
Figure 23. Shear amount verification experiment, reconstructed figure with resolution of (a) 0.193 mm/pixel, (b) 0.386 mm/pixel, and (c) 0.579 mm/pixel.
Photonics 12 01059 g023
Figure 24. Residual distribution of reconstructed figure with resolutions of (a) 0.193 mm/pixel and 0.386 mm/pixel, (b) 0.193 mm/pixel and 0.579 mm/pixel.
Photonics 12 01059 g024
Disclaimer/Publisher’s Note: The statements, opinions and data contained in all publications are solely those of the individual author(s) and contributor(s) and not of MDPI and/or the editor(s). MDPI and/or the editor(s) disclaim responsibility for any injury to people or property resulting from any ideas, methods, instructions or products referred to in the content.