Article

Athermal Design of Star Tracker Optics with Factor Analysis on Lens Power Distribution and Glass Thermal Property

Department of Photonics, College of Electrical and Computer Engineering, National Yang Ming Chiao Tung University, 1001 University Road, Hsinchu 300, Taiwan
*
Author to whom correspondence should be addressed.
Photonics 2025, 12(11), 1057; https://doi.org/10.3390/photonics12111057
Submission received: 7 September 2025 / Revised: 9 October 2025 / Accepted: 23 October 2025 / Published: 25 October 2025
(This article belongs to the Special Issue Optical Systems and Design)

Abstract

A star tracker lens works in the environment with the temperatures ranging from −40 °C to 80 °C (a range of 120 °C), which makes athermalization a crucial step in the design. Traditional approaches could spend quite an amount of iterative process in between the optimization for nominal condition and athermalization. It is highly desired that the optimization can start with a thermally robust layout to improve the design efficiency. This study takes the star tracker lens module with seven elements as the base for investigating the possible layout variation on dioptric power distribution and thermo-optic coefficient d n / d T of the material, which are the two major factors of the layout interacting with each other to influence the thermal stability of the overall lens module. All the possible layouts are optimized firstly for the nominal condition at T = 20 °C, and only those meeting the optical performance specifications are selected for thermal performance evaluation. A merit function based on a thin lens model which represents the focal plane drift over a temperature range of 120 °C is then used as the criteria for ranking the layout variations passing the first stage. The layouts at top ranking exhibiting low focal plane drift become potential candidates as the final solution. The proposed methodology provides an efficient approach for designing thermally resilient star tracker optics, especially addressing the harsh thermal conditions encountered in Low Earth Orbit missions.

1. Introduction

Optical systems designed for Low Earth Orbit (LEO) applications are subject to rapid and repeated thermal cycling due to the alternating exposure to sunlight and Earth’s shadow. These temperature swings can span more than 100 °C from −40 °C to 80 °C, posing serious challenges to maintain stable imaging and pointing accuracy in star trackers [1,2]. Athermalization, the ability to maintain consistent optical performance despite such variations, is therefore a critical mission attribute [3]. Traditional design approaches often struggle to scale in complexity or lack predictive insights when extended to multi lens assemblies operating in LEO environments [4].
The growing demand for high precision, compact, and thermally stable optical systems in aerospace applications has made athermalization of star tracker lenses a crucial design objective. Thermal focus drift, the drift in focal position or degradation of image quality due to temperature changes, can severely compromise tracking accuracy. To mitigate this, traditional strategies have relied on either first order analytic methods that balance material and structural parameters, or brute-force global search (GS) algorithms in optical design tools [5]. While analytic approaches based on thermal power balance and athermal glass maps offer theoretical clarity, they often fall short when applied to complex multi-element systems, especially those with seven or more lenses and numerous additional optical parameters [6,7].
Recent athermal design studies often begin with material selection or first-order compensation strategies. For example, Xie et al. proposed a graphical 1 + Σ method in the visible band [6], while Zhu et al. extended to multi-element systems by a quantitative replacement of combined glasses on the athermal visible glass map [7]. Other works enable fast material screening via an equivalent Abbe number and a thermal glass constant [8] and further expand the athermal glass map to include housing/structural effects [9]. On the side of the layout, redistributing element powers on an athermal glass map has been used to achieve joint achromatization and athermalization [10]. In parallel, the required accuracy of thermo-optic and expansion coefficients for passive athermalization has been analyzed [11]. However, most prior approaches treat material thermo-parameters and dioptric-power distribution separately, with limited systematic exploration of their combined design space and interactions, particularly in systems with many elements.
Furthermore, a significant gap exists in mainstream optical design workflows. Most commercial optimization software does not directly include d n / d T or other thermo-optic coefficients as variables within their merit functions or optimization algorithms [12]. Consequently, even after optimizing a system for imaging quality, the selection of materials for thermal stability is often relegated to trial and error, empirical tuning, or exhaustive case by case testing [11]. This study aims to address this gap by introducing a merit function for thermal focus drift over a wide temperature variation as a preliminary evaluation on the thermal performance of various layouts with different lens power distribution and material thermal properties. For this analytical model, the focus is on static thermal performance under the assumption of a uniform temperature change (i.e., neglecting thermal gradients) across all components. With this merit function, the suitable layouts whose performance can meet the required criteria both in nominal condition and over wide temperature range can be effectively spotted.
This paper is organized as follows. Section 2 describes the configuration of the target star tracker lens and the merit function for thermal focus drift based on paraxial optics and a thin lens model. Section 3 describes the conditions and procedure of searching for the best few combinations of lens power distribution and material selection with the merit function in Section 2 as the metric. Section 4 presents the result and corresponding analysis, followed by the discussions and conclusions in Section 5.

2. Merit Function of Thermal Focus Drift for Star Tracker Lens

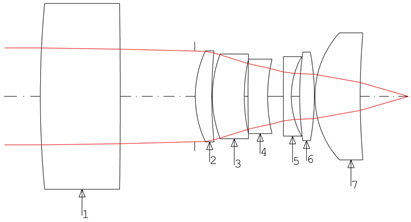
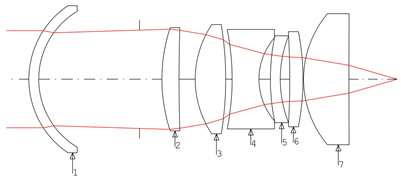
The target system under study consists of seven optical elements as illustrated in Figure 1. The basic layout has been fixed based on long-term practice on star tracker payloads used in LEO satellite missions. The major degree of freedom for design optimization lies in the lens power distribution and material selection.
The thermal focus drift equation is derived from paraxial approximation and a thin lens model, and it is used as a merit function for evaluating the thermal stability of the imaging system rather than an exact value of quantitative description, which requires exact ray tracing on real model and intensive numerical computation.
The paraxial optical power ϕ of a thin lens is defined as follows [8,10]:
ϕ = n 1 1 R 1 1 R 2 = n 1 κ
where n is the refrative index of the lens material; R 1 and R 2 are the radii of curvature for the incident and exit surfaces, respectively; and κ is the curvature difference. Both the refractive index n and curvature difference κ are temperature dependent due to the thermo-optic coefficient and thermal expansion, respectively:
d ϕ d T = n 1 d κ d T + κ d n d T
Given that both the refractive index n and the curvature difference κ of a thin lens are temperature dependent, the derivation proceeds by explicitly considering the effect of thermal expansion on the lens curvature.
Curvature difference change is governed by the glass linear expansion coefficient α g :
d κ d T = κ · α g
where α g is the linear thermal expansion coefficient of the glass. Substituting Equation (3) into Equation (2) leads to the power variation versus temperature shown in Equation (4):
d ϕ d T = κ d n d T n 1 α g
In convention, the material athermalization factor γ is defined as Equation (5) [8]:
γ = 1 n 1 d n d T α g
Therefore, the temperature derivative of the lens power can be expressed as Equation (6):
d ϕ d T = ϕ γ
This formula describes how the optical power of a single thin lens changes with temperature, with the consideration of both refractive index and curvature variation, while the thickness variation due to temperature change has been ignored.
For a system comprising N thin lenses, with air gap drift due to temperature changes being neglected, the temperature dependence of the total system power Φ , i.e., the rate of change of the total power with respect to temperature T , can be described as Equation (7) [9]:
d Φ d T = i = 1 N y i 2 ϕ i γ i
where y i represents the normalized paraxial ray height on surface 1 at the i -th lens, defined as the ray height divided by the entrance marginal ray height at the first lens; ϕ i is the power of the i -th lens at nominal condition (T = 20 °C); and γ i is its athermalization factor, as defined in Equation (5).
The effective focal length of the optical system is related to its total optical power f = 1 / Φ . Taking the temperature derivative yields the optical focus drift as a function of temperature variation Δ T :
Δ f optics = d f d T Δ T = f 2 d Φ d T Δ T
Combining Equations (7) and (8), the total focal plane drift is given by the following:
Δ S = Δ f optics = f 2 i = 1 N y i 2 ϕ i γ i · Δ T
This closed-form expression directly relates the lens configuration, material properties, and ray height of lenses to the thermal focus drift. It serves as the merit function for evaluating thermal performance of the lens module. (see Appendix A, Table A1, for symbol definitions and notation)

3. Simulation on Lens Power Distribution and Material Selection for Minimizing Thermal Focus Drift

To find out the lens power distribution and glass material with the least thermal focal plane drift shown in Equation (9), all the solutions should be first optimized to meet the specifications and optical performance at nominal condition (T = 20 °C) listed in Table 1 with ZEMAX OpticStudio (Ansys, Canonsburg, PA, USA). The ones which cannot even meet the criteria will be ruled out at this stage. The ones that pass through the first stage will be analyzed on thermal focus drift with Equation (9) over a temperature range from −40 °C to 80 °C. The ones with the least focus drift will then be ranked at the top for the choice.
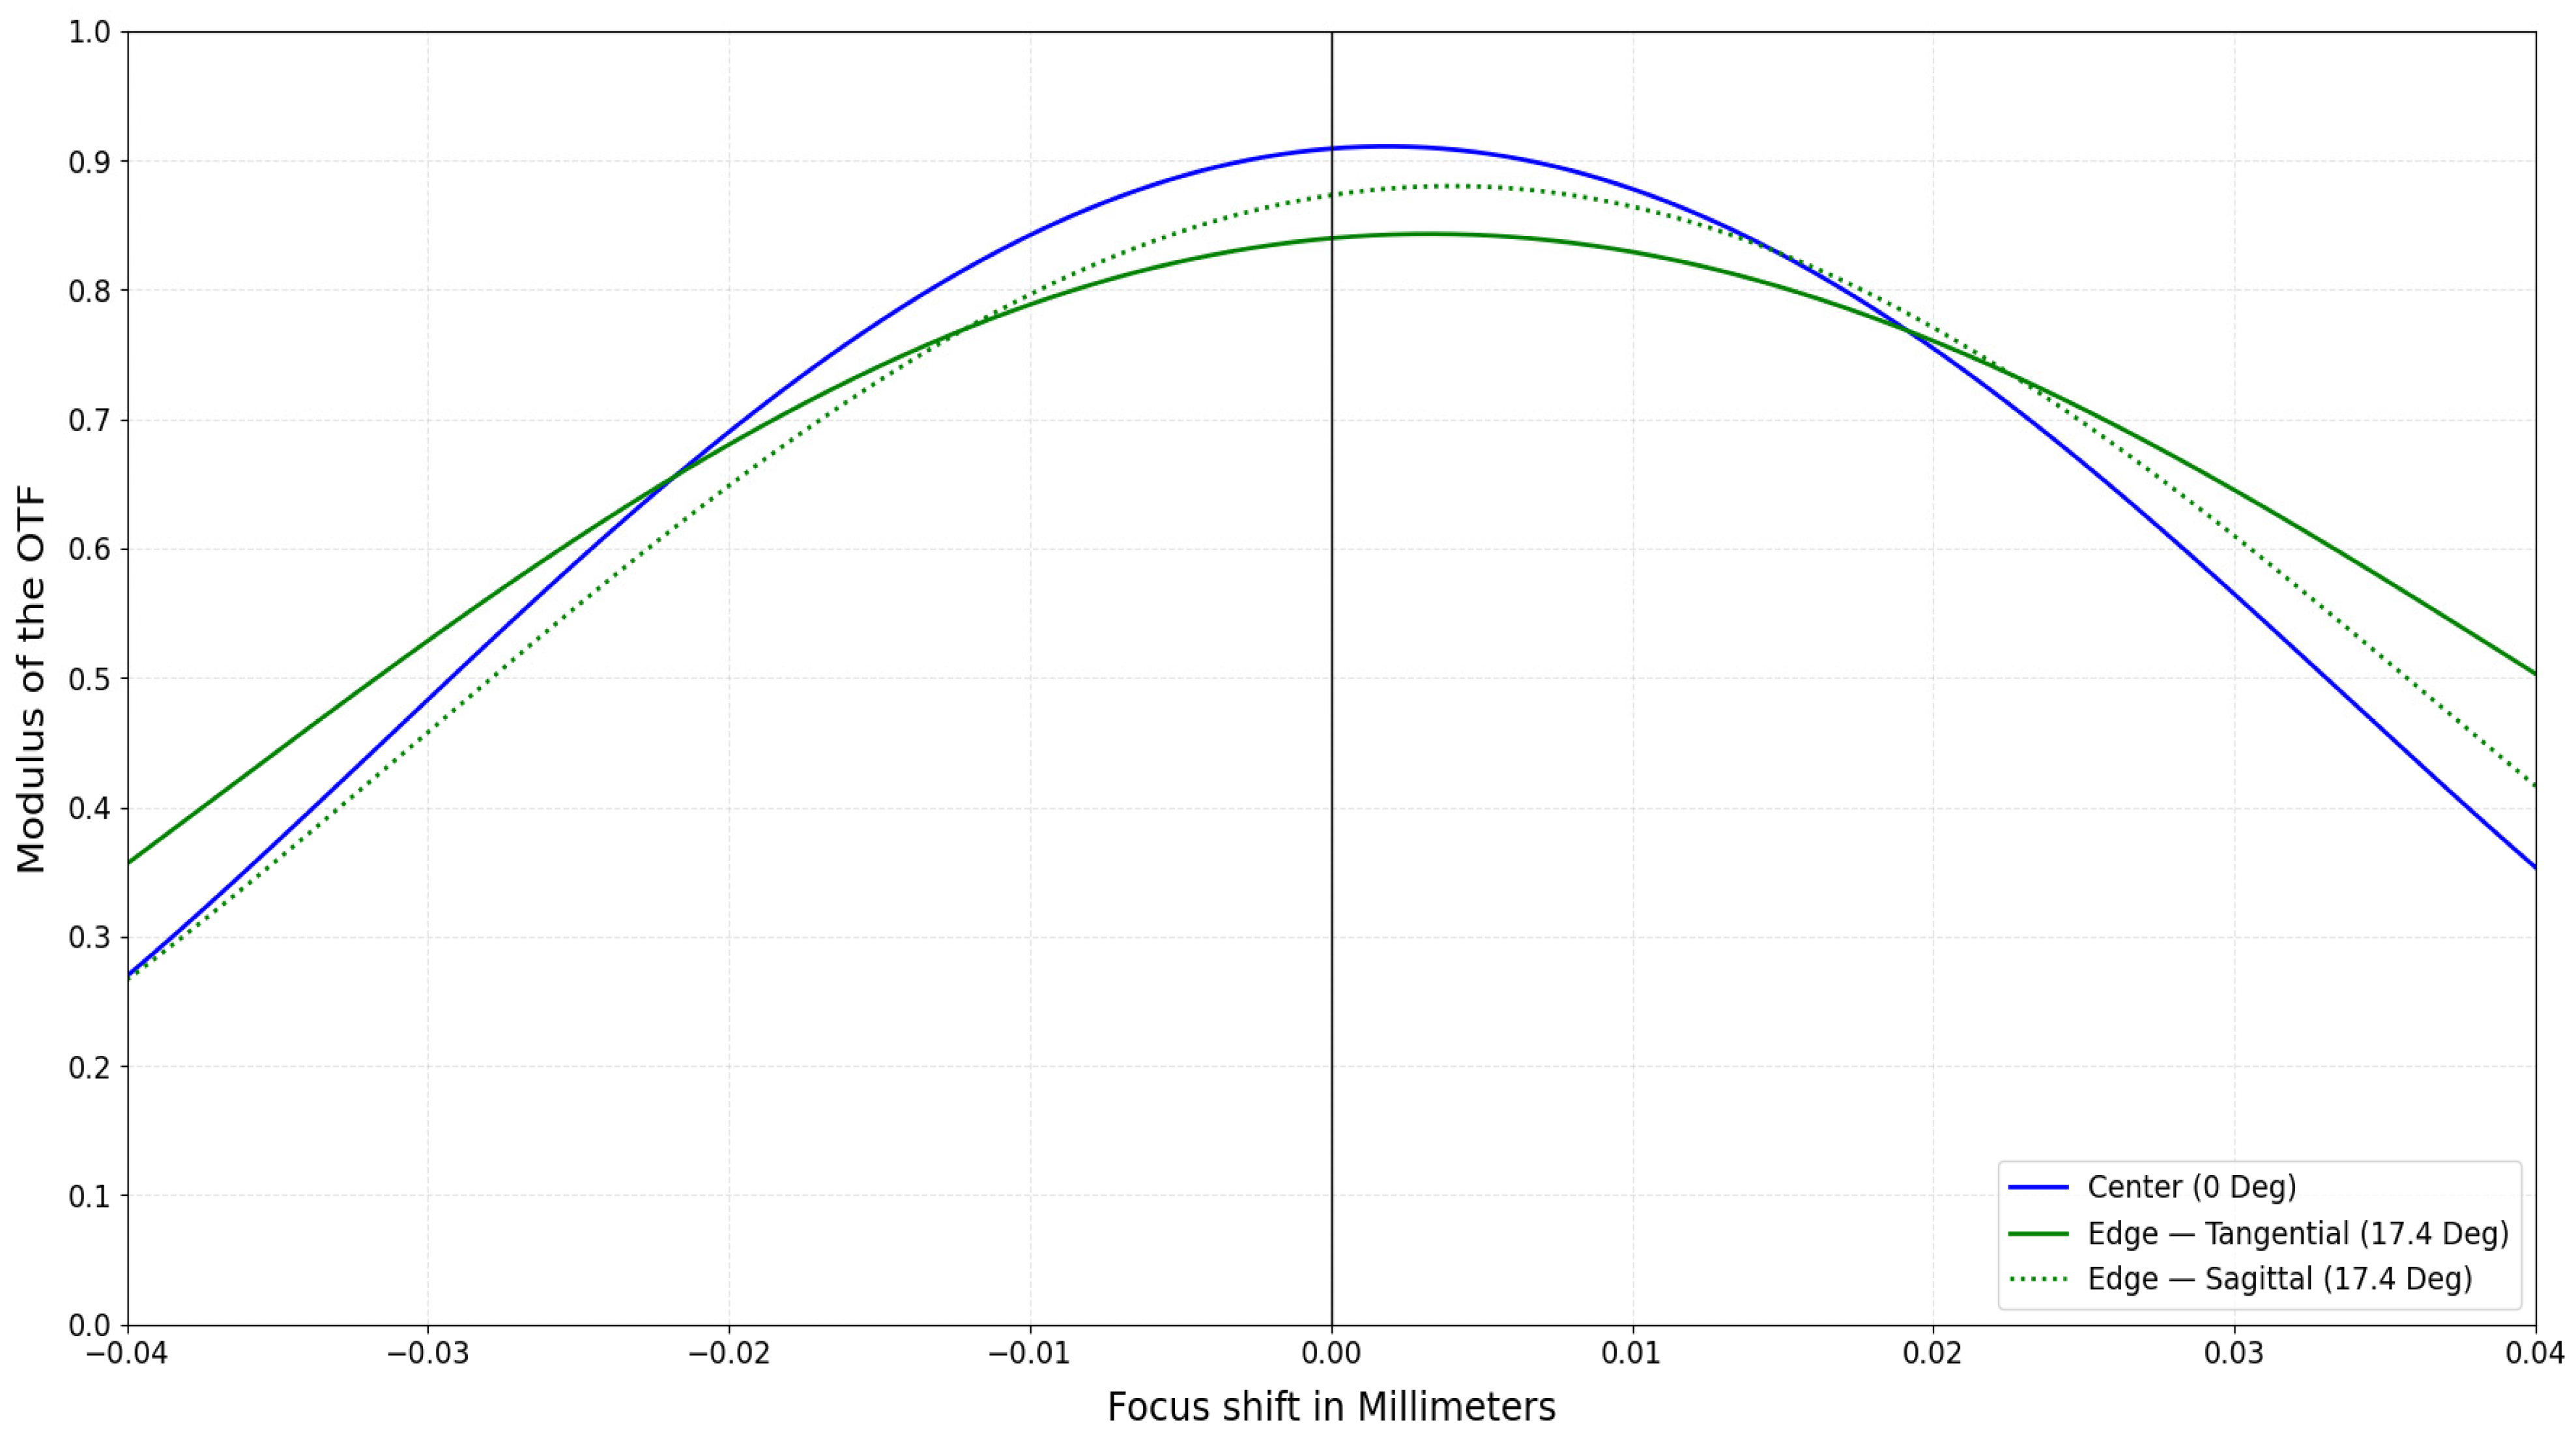
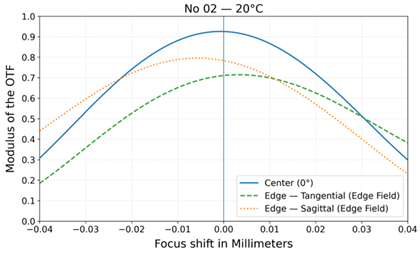
Among the items listed in Table 1, MTF is the major one which screens out a large portion of the possible layouts at the stage of optimization for the nominal condition. As an example, Figure 2 presents the through focus MTF performance evaluated at 40 lp/mm for both the on-axis (center) and edge field positions.
For material selection, the first lens element is chosen as fused silica because of its excellent radiation tolerance and thermo-mechanical stability in space. While fused silica itself is highly UV-transmissive, in our instrument it serves as a robust substrate for a UV-blocking front window; a UV-cut coating is applied to the fused-silica window to attenuate solar UV and protect the photosensitive sensor and internal optical assemblies from degradation in Low Earth Orbit (LEO) [13,14]. In addition, all mechanical components including lens housing and internal spacers are assumed to be constructed from Invar. Invar is an iron-nickel alloy celebrated for its near zero coefficient of thermal expansion (CTE), eliminating almost all thermomechanical expansion from the structure [9,15]. This assumption ensures that any focus drift calculated is mainly due to the intrinsic properties of the glass materials and their configuration, rather than from mechanical deformations or misalignment. With the condition mentioned above, the material selection process is then focused on lens element 2 to 7.
There is quite a large amount of material available in the glass map. However, in practice the material is normally chosen with the consideration of not only technical performance but also economic issues such as availability, manufacturability, etc. The material can be categorized as crown glass with low dispersion and flint glass with high dispersion for correcting chromatic aberration [16,17,18]. In addition, from the viewpoint of thermal performance, they can be categorized into groups with high and low thermo-optic coefficient d n / d T . In order to constrain the choice while keeping sufficient degree of freedom for optimizing system performance, the materials for selection are two crown glass materials and two flint glass materials; both have one with low d n / d T and the other one with high d n / d T . The materials are listed in Table 2, where the glass code is taken from Ohara glass catalogue (OHARA Inc., Sagamihara, Japan) and H/L means the material has a high or low thermo-optic coefficient d n / d T . The d n / d T values are specified at the Fraunhofer D-line (589.3 nm, reference temperature 0~20 °C). The thermal expansion coefficient α g used in our analysis is also added (reference temperature range −30~70 °C).
The initial design space for the power distribution is theoretically 27 = 128, with possible combinations of positive (+) and negative (−) optical power assignments on the seven lens elements 1 to 7. However, after applying the ZEMAX global search algorithm and local optimization to each configuration to satisfy the required specifications listed in Table 1 at nominal condition (T = 20 °C), only seven power distribution patterns were left, namely ++-+--+, +-++--+, +-+--++, -++--++, +++--++, ++-+++-, and +-+++-+, where (+) and (-) represent the sign of dioptric power of the lens element in the sequence from the left to the right shown in Figure 1. As a result, there are totally 348 layout configurations with different power distribution and material combination that satisfied all the specifications at T = 20 °C, with the rest failing to pass even the nominal condition.
Subsequently, Equation (9) which serves as the merit function for thermal stability is then applied to evaluate the thermal focus drift for the remaining 348 configurations. The temperature variation ΔT is taken to be 120 °C (from −40 °C to 80 °C) with the assumption that the thermal focus drift is uniform over this temperature range. In addition, the ray height in Equation (9) is directly taken from the ZEMAX file at the front surface of each lens element. Among these 348 configurations, the best top 10 candidates with the least thermal focus drift are listed in Table 3, where C and F stand for crown and flint glass, respectively, and H/L means the material is with high or low thermo-optic coefficient d n / d T .

4. Result Analysis and Discussion

Table 3 has already provided the best few candidates for the choice. However, for verifying the validity of the analytical merit function of Equation (9), the thermal focus drift evaluated with real tracing in ZEMAX has been made on all the 348 configurations for the comparison with that from Equation (9); although, the computational workload is heavy and time consuming, so this step will be skipped in practice.
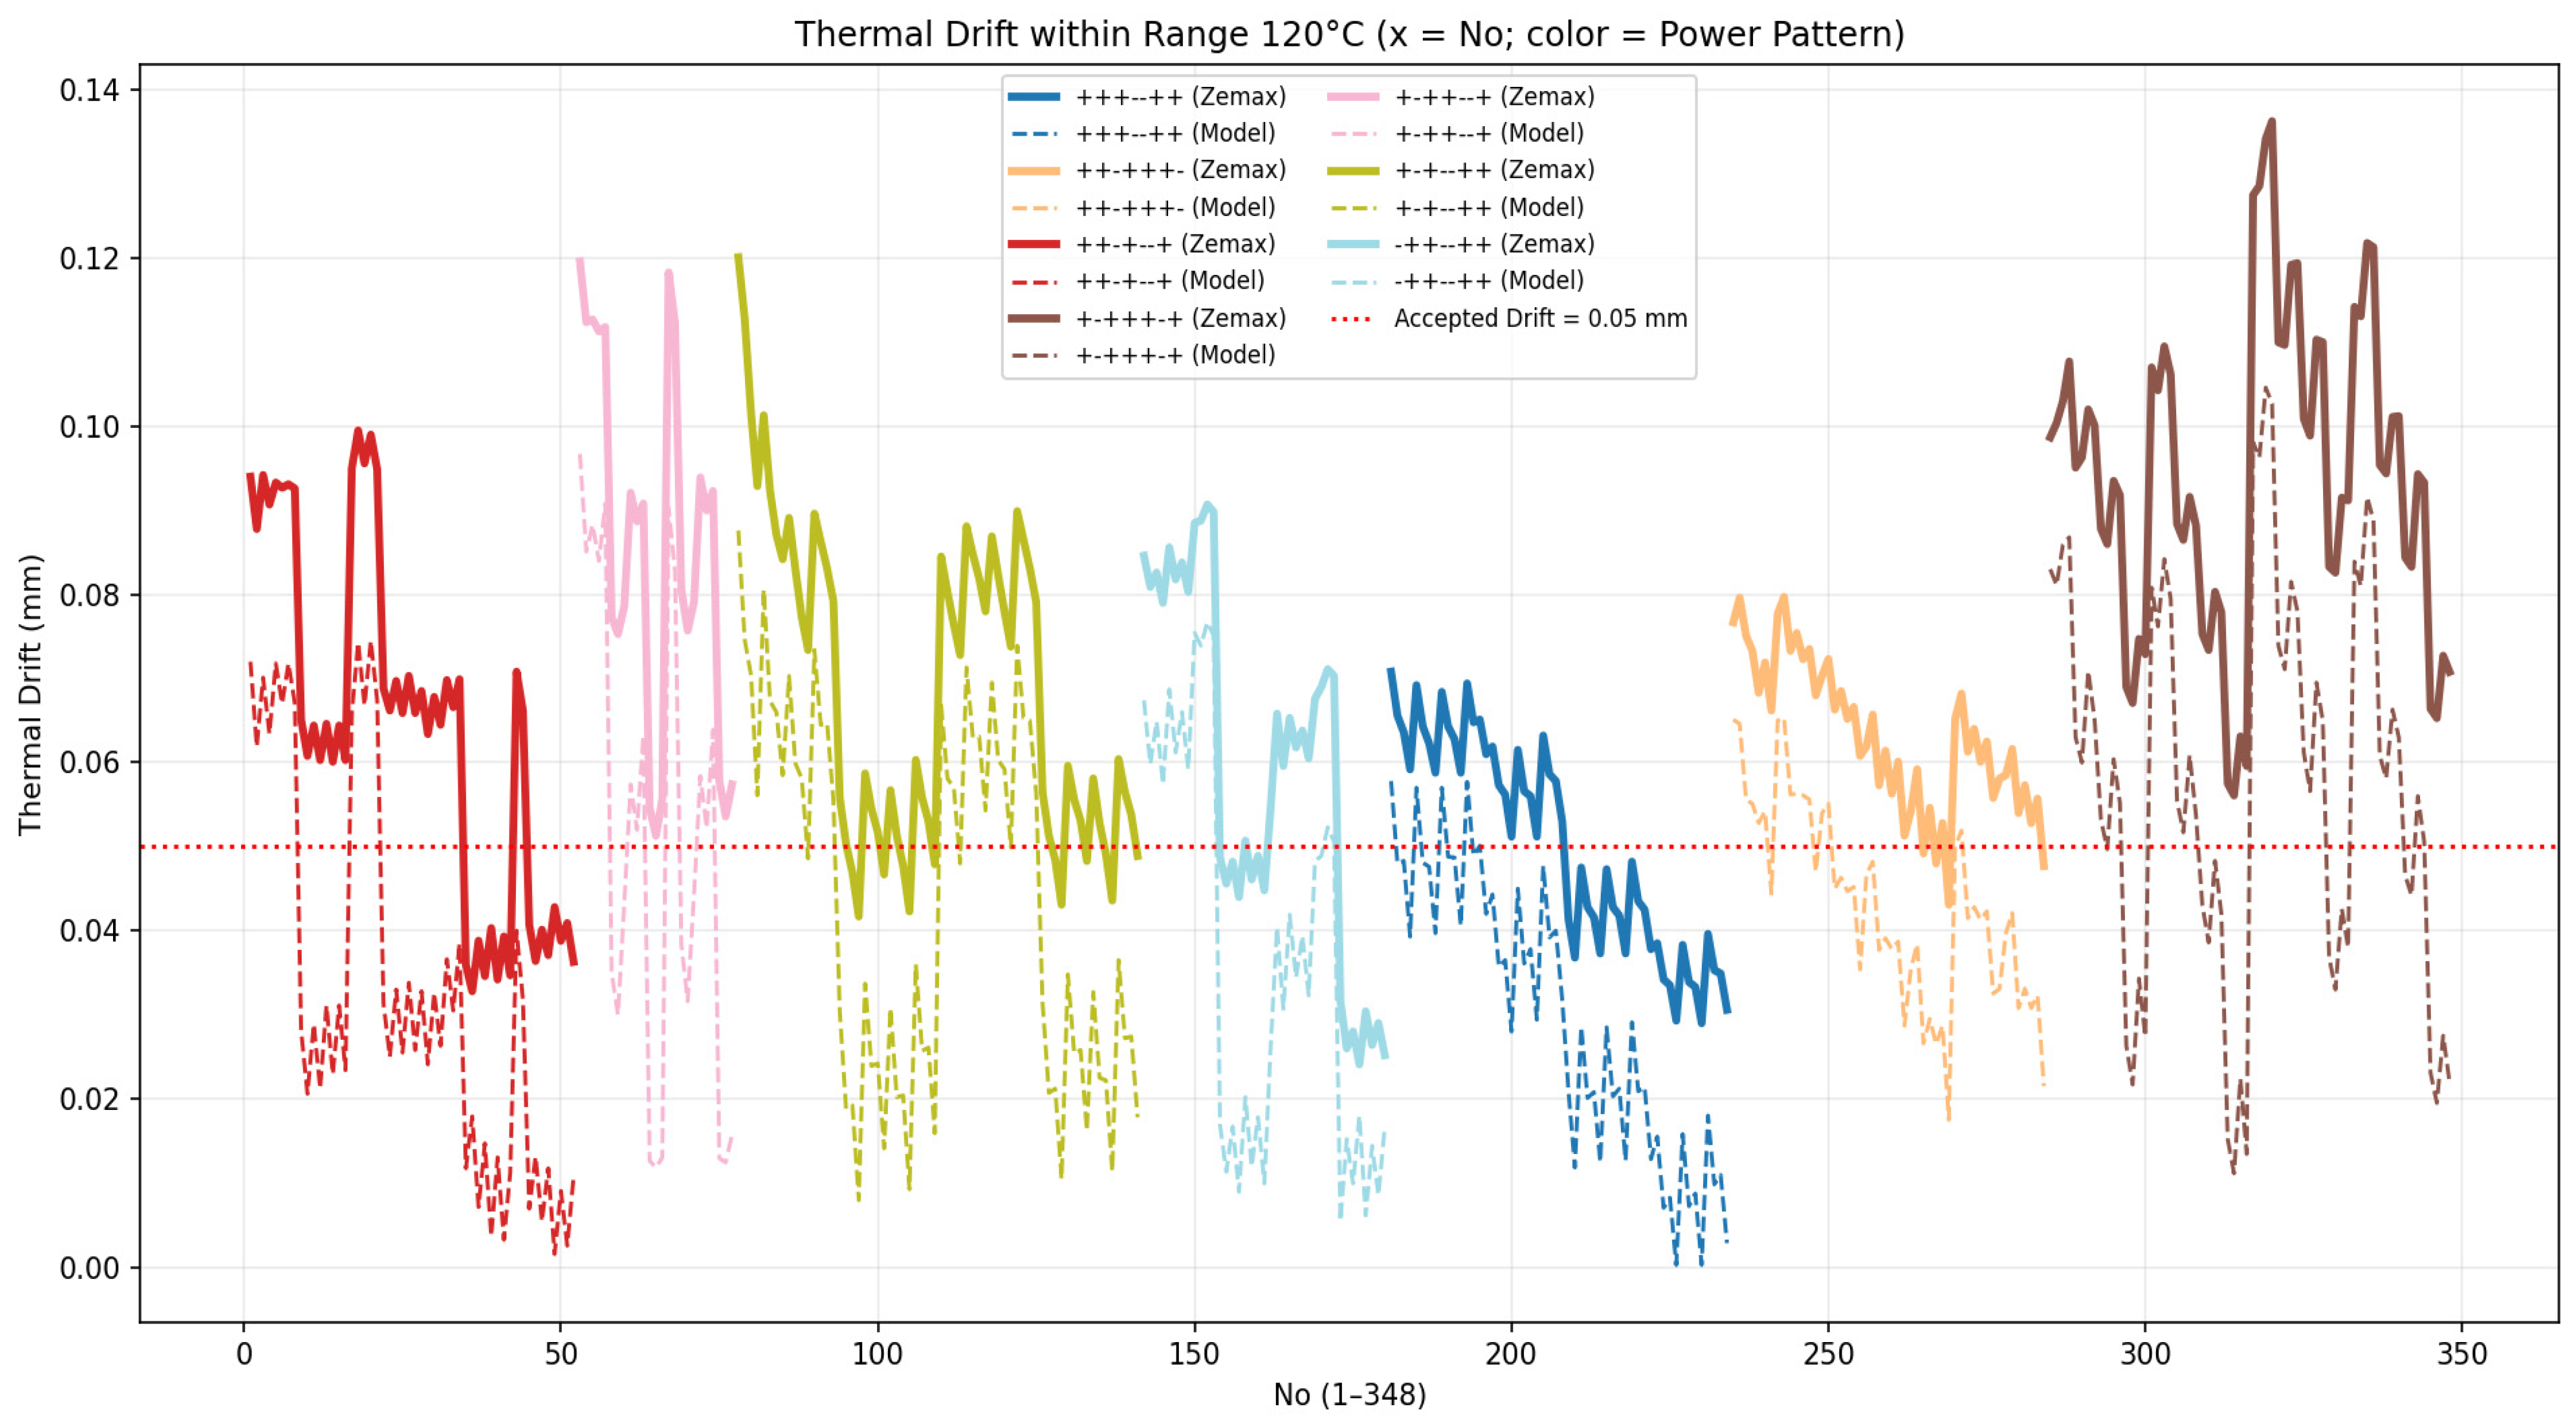
For real ray tracing evaluation in ZEMAX, both the focal plane position at −40 °C and 80 °C for each configuration are evaluated first, and the gap between these two positions becomes the thermal focus drift over a 120 °C temperature range for that configuration. Figure 3 compares the thermal focus drift evaluated with ZEMAX simulation and the merit function Equation (9), where the solid line represents the former and the dotted line represents the latter. Different colors are assigned for different power distribution patterns. It indicates that there is always a gap between the result from the ZEMAX simulation and the merit function, and the former is consistently larger than the latter one. Although there is no exact quantitative correlation between these two, the major trend can still be seen from Figure 3 that the ones ranked with better thermal performance from merit function Equation (9) would mostly keep their ranking in the evaluation from ZEMAX. The high constancy of the comparative ranking demonstrates the effectiveness of the merit function Equation (9) as a metric of preliminary selection for athermalization among those configurations passing the nominal condition. In deriving merit function Equation (9), the variation of air spacing between lens elements due to thermal effect and the thickness of lens elements have been ignored, while keeping mainly the influence of curvature and refractive index, so as to find a compact form for a quick evaluation of the thermal performance. Therefore, the validity of the merit function highly depends on the condition that the variation of curvature and refractive index dominate the thermal shift of the focal plane.
To further specify focus drift into a pass/fail metric, a horizontal red dotted line indicates the pass/fail threshold of 0.05 mm total focus drift. This threshold is specified on the basis that through-focus MTF at 40 lp/mm can still be larger than 0.45 with a defocus of ±0.025 mm, which corresponds to a total focus drift of 0.05 mm. It can be seen from Figure 3 that the configurations ranking among the top with the least thermal focus drift evaluated from Equation (9) would all pass the threshold with quite an amount of safety margin.
Table 4 shows the thermal focus drift evaluated from ZEMAX for the top 10 ranking configurations in Table 3 so as to make a comparison with the result evaluated from Equation (9). It indicates that the ranking can be changed a little, but all the configurations keep low thermal focus drift and qualified as a candidate solution.
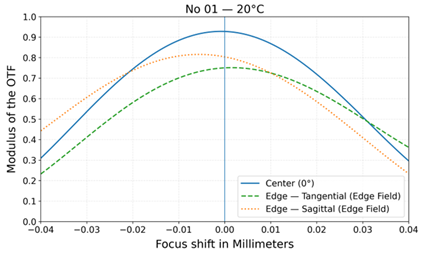
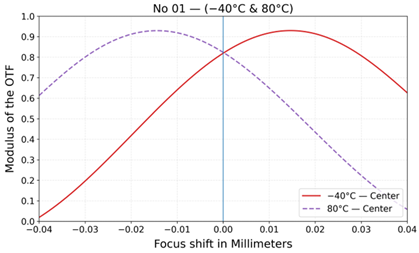
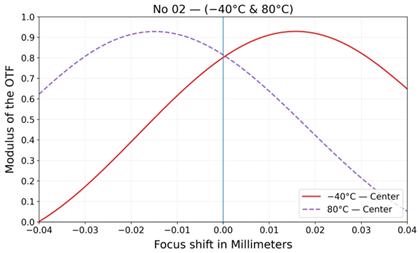
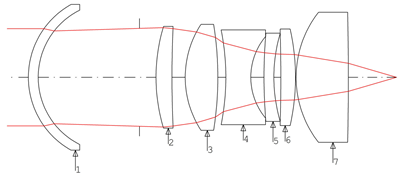
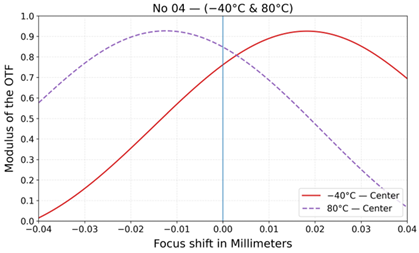
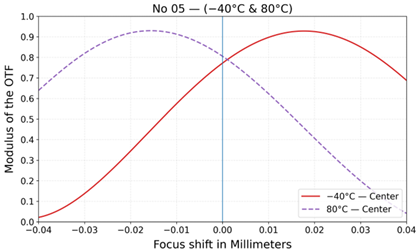
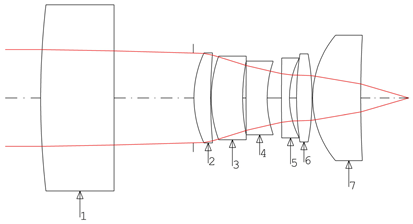
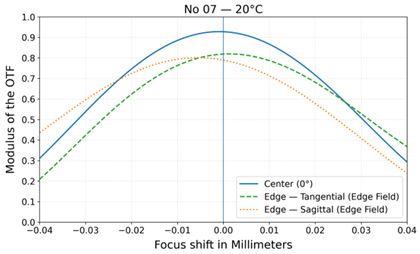
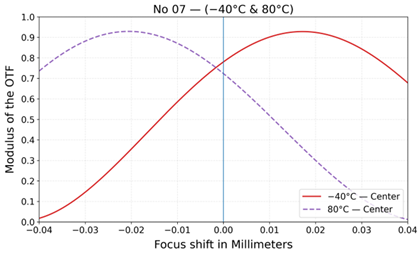
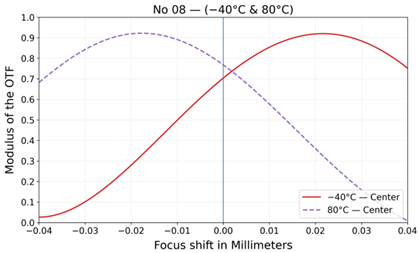
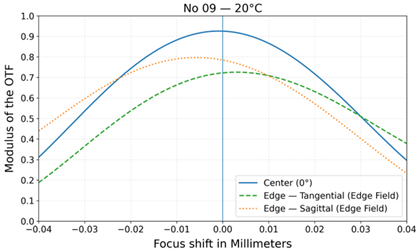
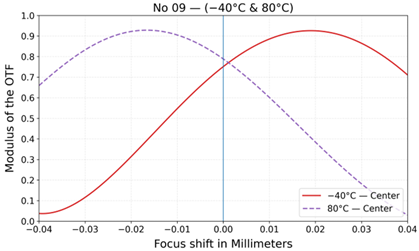
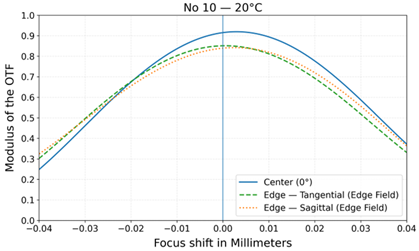
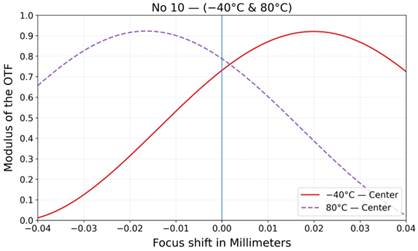
Furthermore, Table 5 consolidates the system layouts and image-quality outcomes for the ten top-ranked results in Table 4 by real ray tracing. For each design, it shows a panel of the seven-element layout, reports the through-focus MTF at 20 °C for the on-axis and edge fields (sagittal/tangential), and overlays the on-axis through-focus MTF at −40 °C and +80 °C at 40 lp/mm. In all cases, the 20 °C MTF meets the image-quality targets in Table 1 (on-axis and edge at 40 lp/mm), and the MTF peaks remain within ±0.05 mm after thermal drift.

5. Conclusions

A merit function based on paraxial approximation and a thin lens model has been developed as a metric for preliminary evaluation on the thermal focus drift of a star tracker lens module so as to increase the efficiency of the athermalization design process. Two major factors, including power distribution pattern and thermo-optic coefficient of the material, have been considered as the variables for degree of freedom in athermalization design. Different configurations have been evaluated on thermal focus drift over a temperature range from −40 °C to 80 °C with both proposed merit function and real ray tracing of commercial simulation software. The result demonstrates a high similarity of trend, which indicates the effectiveness of the proposed merit function, and it can be used as a tool for global optimization on athermalization design. The methodology can also be generalized to alternative glass catalogs and different optical layouts for wherever the operating temperature range of the system is high and the athermalization issue becomes critical.

Author Contributions

Conceptualization, K.-C.W.; methodology, K.-C.W.; validation, K.-C.W. and C.-H.C.; formal analysis, K.-C.W.; investigation, K.-C.W.; data curation, K.-C.W.; writing—original draft preparation, K.-C.W.; writing—review and editing, C.-H.C.; visualization, K.-C.W.; supervision, C.-H.C. All authors have read and agreed to the published version of the manuscript.

Funding

This research received no external funding.

Institutional Review Board Statement

Not applicable.

Informed Consent Statement

Not applicable.

Data Availability Statement

The data presented in this study are available on request from the corresponding author due to privacy or ethical restrictions.

Conflicts of Interest

The authors declare no conflicts of interest.

Abbreviations

The following abbreviations are used in this manuscript:
LEOLow Earth Orbit
GSGlobal Search
EFLEffective Focal Length
TTLTotal Track Length
DIYDistortion Index
BFLBack Focal Length
MTFModulation Transfer Function
CRAChief Ray Angle
d n / d T Thermo-optic Coefficient
CTECoefficient of Thermal Expansion
C(H)/C(L)Crowns with higher/lower thermo-optic coefficient d n / d T
F(H)/F(L)Flints with higher/lower thermo-optic coefficient d n / d T
OEMOriginal Equipment Manufacturer
G1 to G7Lens elements 1 through 7
G2 to G7Lens elements 2 through 7

Appendix A

Table A1 summarizes the symbols and key optical/thermal quantities used in the seven-element star tracker lens system. These include Refractive index of the lens material n , curvature difference of a lens κ , the effective focal length f , the total and element-wise optical powers Φ , ϕ i , the normalized ray heights y i , the thermo-optic coefficient terms d n / d T , α g , γ and focal plane drift resulting from temperature change Δ S . These definitions provide the foundation for the derivations and normalization procedures in Section 2.
Table A1. Symbols and Definitions.
SymbolDefinition
n Refractive index of the lens material
R 1 , R 2 Radii of curvature of the incident and exit surfaces of a lens
κ Curvature difference of a lens, κ = 1 R 1 1 R 2
ϕ Optical power (dioptric power) of a lens, ϕ = n 1 C
ϕ i Optical power of the i t h lens element
Φ Total optical power of the multi element lens system
f Effective focal length of the multi element lens system, f = 1 Φ
y i Normalized ray height at the first surface of i t h lens
α g Linear coefficient of thermal expansion ( C T E ) of the lens glass material
γ Athermalization Factor, γ = 1 n 1 d n d T α g
γ i Athermalization Factor for the i t h lens element
Δ T Temperature variation under consideration
Δ f optics Drift in focal length due to optical effects from temperature change
Δ S Total focal plane drift resulting from temperature change
d n / d T Thermo-optic coefficient (rate of change of refractive index with respect to temperature), provided by glass maker.

References

  1. Wang, X.; Wang, H.; Shen, Y.; Ma, Z.; Yan, H. Athermalization of star sensor optical system with large field of view and low distortion. Proc. SPIE 2023, 12557, 125571N. [Google Scholar]
  2. Rogers, J.R. An optically athermalized lens covering a 200-degree temperature range. Proc. SPIE 2018, 11180, 111808E. [Google Scholar]
  3. Kryszczyński, T.; Leśniewski, M. Material problem in athermalization of optical systems. Opt. Eng. 1997, 36, 1596–1600. [Google Scholar] [CrossRef]
  4. Olivieri, M.; Pieri, S.; Romoli, A. Analysis of defocusing thermal effects in optical systems. Proc. SPIE 1996, 2774, 283–292. [Google Scholar]
  5. Benham, P.; Kidger, M. Developments in MTF and Athermal Optimization. In Proceedings of the 1990 International Lens Design Conference, Monterey, CA, USA, 11–14 June 1990; Volume 1354, pp. 68–79. [Google Scholar]
  6. Xie, N.; Cui, Q.; Sun, L.; Wang, J. Optical athermalization in the visible waveband using the 1+ method. Appl. Opt. 2019, 58, 635–640. [Google Scholar] [CrossRef] [PubMed]
  7. Zhu, Y.; Cheng, J.; Liu, Y. Multiple lenses athermalization and achromatization by the quantitative replacement method of combined glasses on athermal visible glass map. Opt. Express 2021, 29, 34707–34722. [Google Scholar] [CrossRef] [PubMed]
  8. Kim, Y.J.; Kim, Y.S.; Park, S.C. Simple Graphical Selection of Optical Materials for an Athermal and Achromatic Design Using Equivalent Abbe Number and Thermal Glass Constant. J. Opt. Soc. Korea 2015, 19, 182–187. [Google Scholar] [CrossRef]
  9. Lim, T.-Y.; Kim, Y.-S.; Park, S.-C. Graphical Selection of Optical Materials Using an Expanded Athermal Glass Map and Considering the Housing Material for an Athermal and Achromatic Design. J. Opt. Soc. Korea 2015, 19, 531–536. [Google Scholar] [CrossRef]
  10. Lim, T.Y.; Park, S.C. Achromatic and athermal lens design by redistributing the element powers on an athermal glass map. Opt. Express 2016, 24, 18049–18057. [Google Scholar] [CrossRef] [PubMed]
  11. Rogers, J.R. Passive athermalization: Required accuracy of the thermo-optical coefficients. Proc. SPIE 2014, 9293, 92931A. [Google Scholar]
  12. Shi, J.; Liu, J.; Chen, T.; Wang, J.; Yu, F. Calculation Method for Athermalized Optical Systems and Athermal Design Based on ZEMAX. In Proceedings of the 2020 12th International Conference on Intelligent Human-Machine Systems and Cybernetics (IHMSC), Hangzhou, China, 22–23 August 2020; pp. 1010–1014. [Google Scholar]
  13. Moore, L.A. Fused silica as an optical material [Invited]. Opt. Mater. Express 2022, 12, 3043–3073. [Google Scholar] [CrossRef]
  14. Nicoletta, C.A.; Eubanks, A.G. Effect of Simulated Space Radiation on Selected Optical Materials. Appl. Opt. 1972, 11, 1365–1370. [Google Scholar] [CrossRef] [PubMed]
  15. Kul, M.; Akgül, B.; Karabay, Y.Z.; Hitzler, L.; Sert, E.; Merkel, M. Minimum and Stable Coefficient of Thermal Expansion by Three-Step Heat Treatment of Invar 36. Crystals 2024, 14, 1097. [Google Scholar] [CrossRef]
  16. Xie, Y.; Liu, C.; Liu, S.; Fan, X. Optical Design of Imaging Spectrometer Based on Linear Variable Filter for Nighttime Light Remote Sensing. Sensors 2021, 21, 4313. [Google Scholar] [CrossRef] [PubMed]
  17. Wang, L.; Ishikawa, M. Dynamic Response of Elastomer-Based Liquid-Filled Variable Focus Lens. Sensors 2019, 19, 4624. [Google Scholar] [CrossRef] [PubMed]
  18. Fan, C.-Y.; Su, G.-D.J. Time-Effective Simulation Methodology for Broadband Achromatic Metalens Using Deep Neural Networks. Nanomaterials 2021, 11, 1966. [Google Scholar] [CrossRef] [PubMed]
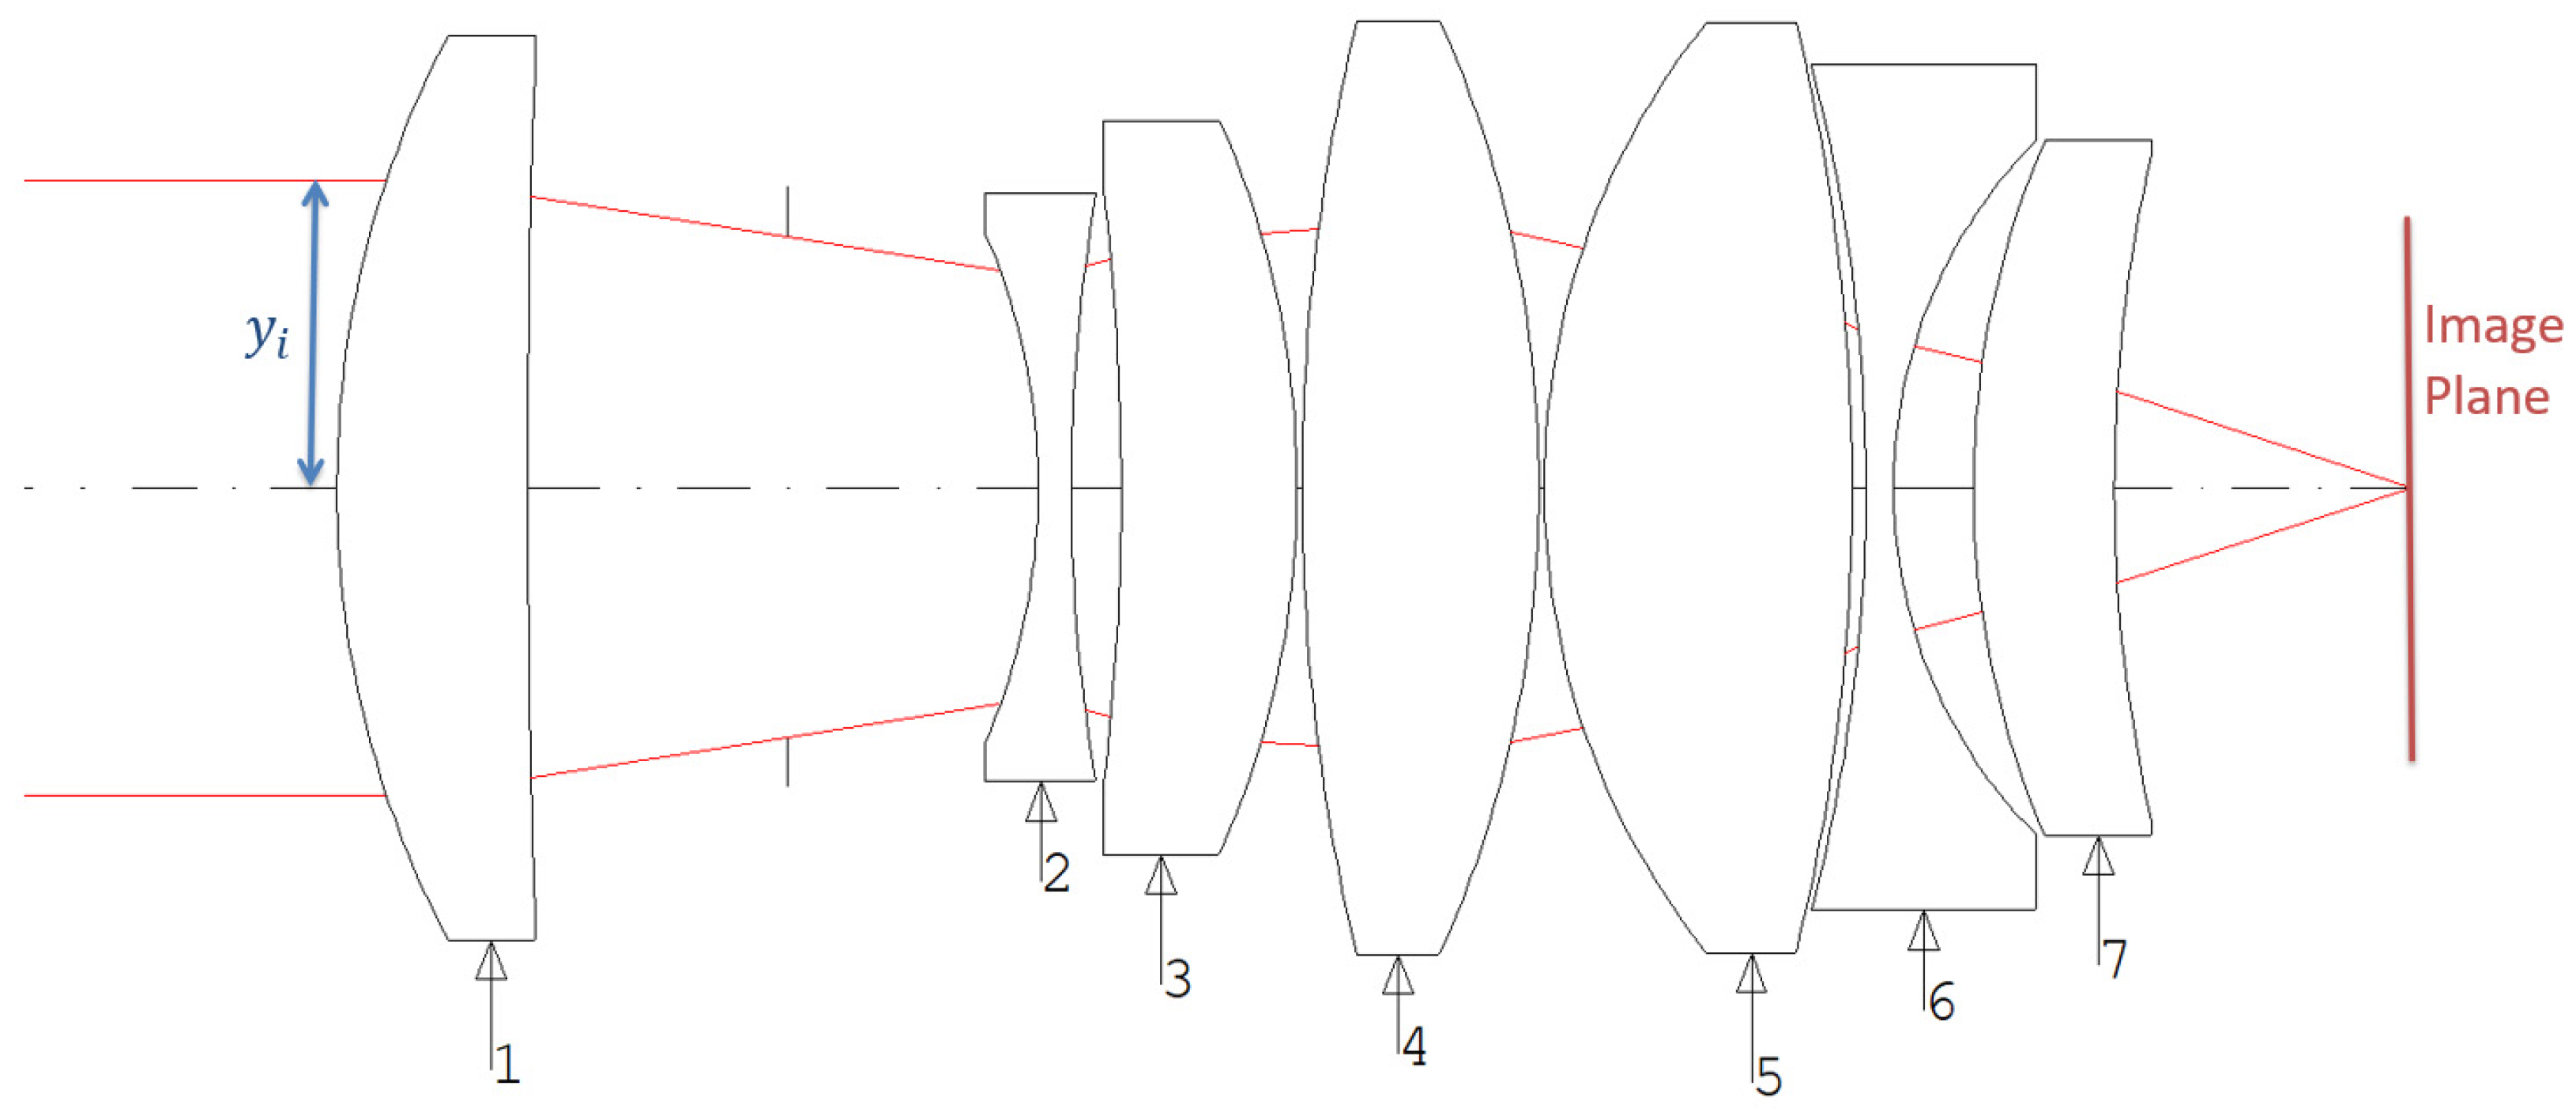
Figure 1. Schematic diagram of the star tracker lens layout.
Photonics 12 01057 g001
Figure 2. MTF at 40 lp/mm at center (blue) and edge (green) fields.
Photonics 12 01057 g002
Figure 3. Thermal focus drift over 120 °C of different power distribution patterns evaluated with Equation (9) (dot line) and ZEMAX (solid line).
Photonics 12 01057 g003
Table 1. Optical specifications of star tracker lens module.
ItemsSymbolValueUnitDescription/Note
Working wavelength 470–650nm
Effective Focal Length f 28.3mmSystem EFL
F-number F n o 1.8
Field of ViewFOV34.8degreeFull field of view
Total Track LengthTTL60mmFirst lens R1 to image plane
Back Focal LengthBFL8mmLast lens R2 to image plane
Chief Ray AngleCRA<10degreeIncident angle to image plane
Optical DistortionDIY<1.1%
Modulation Transfer FunctionMTFCenter > 0.8
Edge > 0.7
At spatial frequency 40 lp/mm
Table 2. Material list for lens module.
Role of PowerH/LGlass d n / d T (×10−7/°C) α g
(×10−7/°C)
(+)HighS-LAL217750
(+)LowS-LAL121072
(−)HighS-TIH102780
(−)LowS-TIH111389
Table 3. List of configurations with the least thermal drift evaluated with Equation (9).
Power Sign
G1 to G7
Focus Drift 120 °C
Equation (9) (mm)
G2 to G7 MaterialsG2 to G7_Crown/Flint (H/L)
+++--++0.0003SLAL12, SLAL12, STIH10, STIH11, SLAL12, SLAL12C(L), C(L), F(H), F(L), C(L), C(L)
+++--++0.0029SLAL12, SLAL12, STIH11, STIH11, SLAL12, SLAL12C(L), C(L), F(L), F(L), C(L), C(L)
-++--++0.0055SLAL12, SLAL12, STIH10, STIH10, SLAL21, SLAL21C(L), C(L), F(H), F(H), C(H), C(H)
-++--++0.0062SLAL12, SLAL12, STIH10, STIH11, SLAL21, SLAL21C(L), C(L), F(H), F(L), C(H), C(H)
+++--++0.0071SLAL12, SLAL12, STIH10, STIH11, SLAL21, SLAL12C(L), C(L), F(H), F(L), C(H), C(L)
+++--++0.0083SLAL12, SLAL12, STIH10, STIH11, SLAL12, SLAL21C(L), C(L), F(H), F(L), C(L), C(H)
+++--++0.0088SLAL12, SLAL12, STIH11, STIH10, SLAL12, SLAL21C(L), C(L), F(L), F(H), C(L), C(H)
++-+--+0.0091SLAL12, STIH11, SLAL12, STIH11, STIH10, SLAL12C(L), F(L), C(L), F(L), F(H), C(L)
+++--++0.0099SLAL12, SLAL12, STIH11, STIH11, SLAL21, SLAL12C(L), C(L), F(L), F(L), C(H), C(L)
++-+--+0.0108SLAL12, STIH11, SLAL12, STIH11, STIH11, SLAL12C(L), F(L), C(L), F(L), F(L), C(L)
Note: Colors indicate both material identity and d n / d T category in the “G2 to G7 Materials” column; orange = SLAL12 [C(L)], green = STIH10 [F(H)], blue = STIH11 [F(L)], purple = SLAL21 [C(H)]. Colors are for visual grouping only; the categorical labels C/F and H/L are explicitly given in the “G2 to G7_Crown/Flint (H/L)” column.
Table 4. Comparison of evaluated thermal focus drift from merit function and real ray tracing.
No.Power Sign
G1 to G7
Drift 120 °C
Equation (9) (mm)
Drift 120 °C
ZEMAX (mm)
1+++--++0.00030.0293
2+++--++0.00290.0306
3-++--++0.00550.0317
4-++--++0.00620.0304
5+++--++0.00710.0342
6+++--++0.00830.0335
7+++--++0.00880.0333
8++-+--+0.00910.0388
9+++--++0.00990.0353
10++-+--+0.01080.0363
Table 5. System layout and MTF outcomes.
NoLayoutMTF at 20 °CMTF at −40 °C and +80 °C
1Photonics 12 01057 i001Photonics 12 01057 i002Photonics 12 01057 i003
2Photonics 12 01057 i004Photonics 12 01057 i005Photonics 12 01057 i006
3Photonics 12 01057 i007Photonics 12 01057 i008Photonics 12 01057 i009
4Photonics 12 01057 i010Photonics 12 01057 i011Photonics 12 01057 i012
5Photonics 12 01057 i013Photonics 12 01057 i014Photonics 12 01057 i015
6Photonics 12 01057 i016Photonics 12 01057 i017Photonics 12 01057 i018
7Photonics 12 01057 i019Photonics 12 01057 i020Photonics 12 01057 i021
8Photonics 12 01057 i022Photonics 12 01057 i023Photonics 12 01057 i024
9Photonics 12 01057 i025Photonics 12 01057 i026Photonics 12 01057 i027
10Photonics 12 01057 i028Photonics 12 01057 i029Photonics 12 01057 i030
Disclaimer/Publisher’s Note: The statements, opinions and data contained in all publications are solely those of the individual author(s) and contributor(s) and not of MDPI and/or the editor(s). MDPI and/or the editor(s) disclaim responsibility for any injury to people or property resulting from any ideas, methods, instructions or products referred to in the content.