Article

Design of an Underwater Optical Communication System Based on RT-DETRv2

1
School of Artificial Intelligence and Computer Science, Hubei Normal University, Huangshi 435002, China
2
School of Information and Communication, The Hong Kong University of Science and Technology, Hong Kong 511453, China
3
Wuhan Liubo Photoelectric Technology Co., Ltd., Wuhan 430072, China
*
Author to whom correspondence should be addressed.
Photonics 2025, 12(10), 991; https://doi.org/10.3390/photonics12100991
Submission received: 10 September 2025 / Revised: 1 October 2025 / Accepted: 6 October 2025 / Published: 8 October 2025

Abstract

Underwater wireless optical communication (UWOC) is a key technology in ocean resource development, and its link stability is often limited by the difficulty of optical alignment in complex underwater environments. In response to this difficulty, this study has focused on improving the Real-Time Detection Transformer v2 (RT-DETRv2) model. We have improved the underwater light source detection model by collaboratively designing a lightweight backbone network and deformable convolution, constructing a cross-stage local attention mechanism to reduce the number of network parameters, and introducing geometrically adaptive convolution kernels that dynamically adjust the distribution of sampling points, enhance the representation of spot-deformation features, and improve positioning accuracy under optical interference. To verify the effectiveness of the model, we have constructed an underwater light-emitting diode (LED) light-spot detection dataset containing 11,390 images was constructed, covering a transmission distance of 15–40 m, a ±45° deflection angle, and three different light-intensity conditions (noon, evening, and late night). Experiments show that the improved model achieves an average precision at an intersection-over-union threshold of 0.50 (AP50) value of 97.4% on the test set, which is 12.7% higher than the benchmark model. The UWOC system built based on the improved model achieves zero-bit-error-rate communication within a distance of 30 m after assisted alignment (an initial lateral offset angle of 0°–60°), and the bit-error rate remains stable in the 10−7–10−6 range at a distance of 40 m, which is three orders of magnitude lower than the traditional Remotely Operated Vehicle (ROV) underwater optical communication system (a bit-error rate of 10−6–10−3), verifying the strong adaptability of the improved model to complex underwater environments.

1. Introduction

In recent years, underwater wireless optical communication (UWOC) has gained attention for its high-speed and secure transmission capabilities. However, its link performance is significantly affected by environmental factors such as absorption, scattering, and suspended particles. Previous studies reported that 10 mg/L suspended particles increased signal attenuation by approximately 0.1 dB/m [1]. Optical signal attenuation per unit distance ranged from 0.151 to 0.505 m−1 across different water qualities, with pulse broadening reaching tens to hundreds of nanoseconds [2]. These attenuation and broadening phenomena further increase the requirement for precise light source alignment. Particularly under interference from bubbles and waves, the emitted beam struggles to maintain stable orientation toward the receiver, posing greater challenges to link stability [3].
In 2013, a rapid reflector system combining cameras, quick tilt mirrors, and analog-to-digital acquisition cards was developed to achieve precise tracking in space optical communication [4]. However, the bulky APT (Acquisition, Pointing, and Tracking) system at that time struggled with underwater deployment. Beyond APT, optical device–side approaches have also enhanced alignment robustness. Ji et al. have shown via an aperture-averaging analysis based on oceanic turbulence spectra that in naturally turbid water under weak-to-strong turbulence, increasing the receiver aperture to 0.1 m can reduce the scintillation index to <1%, whereas enlarging it beyond 0.05 m yields only marginal improvements in bit-error rate (BER) [5]. Elamassie et al. have proposed multi-laser transmit selection with a maximum signal-to-noise ratio (SNR) single-source criterion, achieving low-complexity transmit-side diversity over a log-normal turbulence channel, thereby increasing link margin and tolerance to slight misalignment [6]. Palitharathna et al. have developed a cooperative non-orthogonal multiple-access framework in which the source, relay, and destination deploy multiple narrow-beam light-emitting diodes (LEDs) and photodiodes (PDs) with parallel element selection to spatially favor better-aligned paths, improving coverage and the average sum rate [7]. Collectively, these methods complement APT and jointly strengthen alignment robustness.
At the system layer, an adaptive multi-input multi-output (MIMO) and multiplexed data-link model enabling non-aligned link transmission was proposed [8]; it required advanced engineering solutions due to its multi-channel architecture and high-precision optics. Position error estimation using acoustic sensors for adaptive predictive control of underwater vehicles was implemented, proving effective in near-medium water environments [9]. Using fiber combiners and high-sensitivity multi-pixel photon counter (MPPC) arrays, maximum offsets of 6 m for individual MPPC units and 9 m for an array at 50 m were reported [10]. To develop cost-effective light source alignment methods, researchers conducted extensive studies on underwater image processing algorithms. In 2021, Kalman filtering combined with adaptive shift-mean drift compensation was used to develop a rapid tracking algorithm for charge-coupled device (CCD) camera light spots [11]. However, underwater turbulence, strong background light, and high turbidity-induced light spot jitter, deformation, and false targets severely limit the real-time precision of traditional feature-based image processing algorithms such as color and contour matching.
By contrast, deep learning offers stronger feature representation and domain generalization, substantially improving spot recognition and alignment robustness in complex waters. For single-stage detectors, the You Only Look Once (YOLO) family relies on non-maximum suppression (NMS) in post-processing to remove redundant boxes, which introduces additional latency and is prone to overlapping false positives when scattering halos are prominent [12]. YOLOv10 achieves accuracy comparable to YOLOv8 while improving end-to-end speed by removing NMS [13]. In contrast, RT-DETR performs candidate suppression within the network via a query mechanism with one-to-one matching, thereby reducing dependence on post-processing and enabling an end-to-end pipeline [14]. Nevertheless, these models have mainly targeted generic object detection and have not been tailored to the optical characteristics of UWOC. UWOC-oriented studies indicate that specialization is feasible; for example, Jia et al. employ a cascade of target-point and keypoint detection and, on specific datasets and setups, report 99.1% mean accuracy with a mean localization error of 4.66 pixels, and this cascade was applied to laser underwater communication [15]. A YOLOv5s-based APT system achieved average aiming and tracking times of 5.97 ms and 229 ms, respectively, in various underwater environments, though these durations fluctuated when background light intensity increased [16]. These studies indicate that generic detectors require task-specific adaptations aligned with the imaging and link requirements of UWOC.
Building on the above analysis, this work has implemented lightweighting and feature-extraction optimizations on the RT-DETRv2 framework [17], which was tailored to the imaging characteristics of underwater light spots, and it has constructed a UWOC system with optical alignment capability. The main contributions are as follows:
  • An end-to-end detector retrofit for UWOC has been proposed, in which the Next Vision Transformer (Next-ViT) model [18] replaces the Residual Neural Network (ResNet) [19] backbone; under strong backscatter, local saturation, and small-spot conditions, detection robustness and localization stability have been improved while maintaining end-to-end speed.
  • A hybrid encoder enhanced with Lightweight Dynamic Convolution (LDConv) [20], together with a dedicated underwater light-spot dataset (11,390 images covering 15–40 m transmission range, ±45° deflection, and three illumination levels at noon, evening, and late night), was developed. Under this setting, the improved model achieves AP50 = 97.4% on the test set, outperforming the RT-DETRv2-M baseline by 12.7%.
  • A UWOC prototype with automatic alignment: a CCD acquires light-spot images in real time, and the improved RT-DETRv2 outputs the spot center online; the host converts the center offset to a deflection angle via perspective projection and, combined with real-time optical power, performs attitude adjustment for closed-loop alignment. In a pool environment, through multi-angle alignment experiments, error-free transmission has been achieved over 30 m, and the BER at 40 m has remained in the 10−7–10−6 range.

2. Underwater Optical Communication System Design

The underwater optical communication system has four key components: an auxiliary alignment module, a control core module, an LED array module, and an avalanche photodiode (APD) receiver module. We now present a detailed description of each system component and its implementation. The system architecture is illustrated in Figure 1.

2.1. Auxiliary Alignment Module

The auxiliary alignment module consists of a host computer running the Underwater Communication Detection Transformer (UC-DETR) model and an underwater gimbal equipped with a CCD camera and a high-precision motor.

2.1.1. UC-DETR Model Design

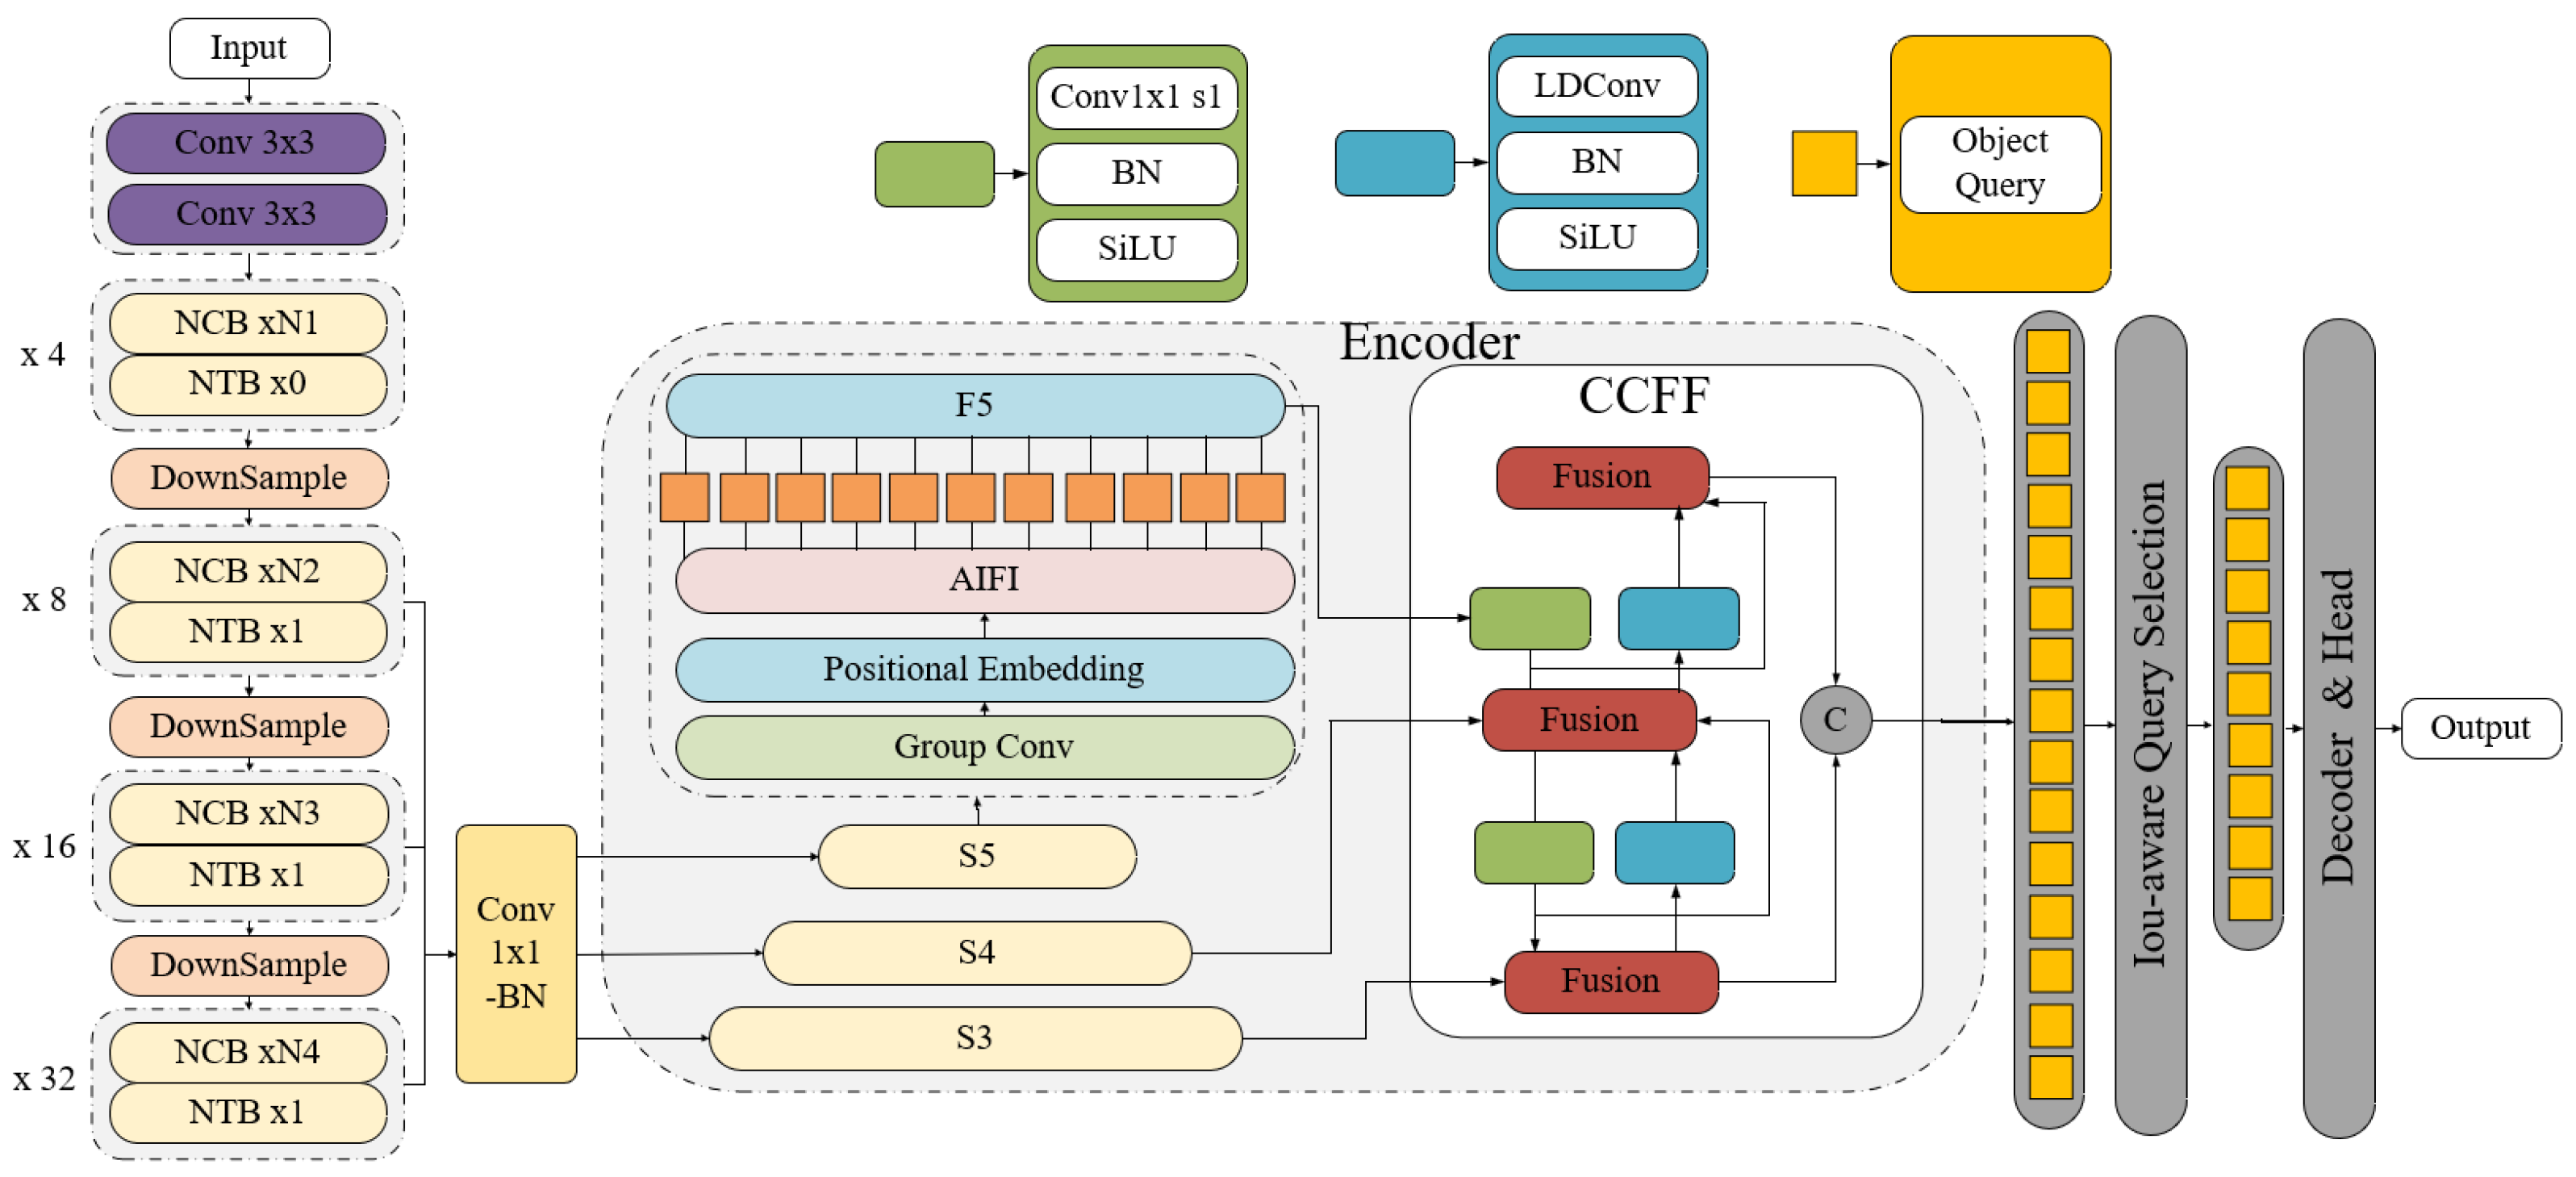
We have implemented two critical enhancements to RT-DETRv2-M and the proposed UC-DETR. First, we have replaced the ResNet50 backbone network in RT-DETRv2-M with Next-ViT, achieving both lightweight architecture and enhanced feature extraction capabilities to efficiently capture multi-scale, irregular features of underwater light sources. Second, we introduced LDConv at specific positions within the hybrid encoder to reduce computational complexity while improving the network’s ability to fuse features from complex target shapes (such as irregularities, strong scattering, and dynamic deformation). These improvements aim to enhance the model’s accuracy, robustness, and real-time performance in underwater scenarios. Figure 2 illustrates the network architecture of UC-DETR.
Regarding the backbone network architecture, Next-ViT comprises the Next Convolution Block (NCB) and the Next Transformer Block (NTB), which are designed to capture local features and model global semantics, respectively. Since an input features X R C × H × W , the combined design of NCB and NTB progressively enhances feature channels by extracting and fusing features layer by layer while maintaining spatial resolution. The feature extraction process can be described as
P Next - ViT = { P 1 , P 2 , P 3 } , P i R H × W × C
where P 1 , P 2 , and P 3 represent the feature maps, which are output by three stages. The number of channels C = [ 256 ,   384 ,   768 ] , while H and W denote the image size and spatial dimension, respectively. To enhance local feature capture in the shallow layers, Next-ViT employs the NCB for local feature modeling, as defined below:
Z l = MHCA ( X ) + X
Y l = MLP ( Z l ) + Z l
where MHCA(·) denotes a multi-head convolutional attention module and MLP(·) denotes a multi-layer perceptron. Nonlinear activation functions and linear transformations are used to enhance feature representation. X denotes the input from l blocks, and Z l and Y l denote the outputs of MHCA and NCB. MHCA achieves efficient local feature modeling through grouped convolutions and point-wise convolutions, which can be expressed as
MHCA ( X ) = Concat CA i ( X i ) , , CA h ( X h ) W p
where CA i ( X i ) denotes the single-head convolutional attention mechanism, where h denotes the number of attention heads and W p is the projection weight matrix. Although local representations have been effectively learned through NCB, capturing global information remains an unresolved challenge. NTB demonstrates strong capability in capturing low-frequency signals that provide insights into global shapes and structures. We employ the Enhanced Multi-Head Self-Attention (E-MHSA) module to capture low-frequency signals. The mechanism is described as follows:
E - MHSA ( X ) = Concat SA 1 ( X 1 ) , , SA h ( X h ) W p
SA ( X ) = Attention X · W q , AP n ( X · W k ) , AP n ( X · W v )
W q , W k , and W v represent the linear layer for context encoding, while SA is the self-attention for spatial compression. X h denotes the multi-head representation of the input feature X, which is obtained by partitioning it into h channel-wise heads. AP is the average pooling operation. Attention represents the attention calculation. AP n is an average pooling operation with a stride of n, which is used to downsample the spatial dimension before the attention operation to reduce the computational complexity and improve the global information capture capability. Therefore, the NTB module is defined as
Z E l = E - MHSA ( X ) + X
Z M l = MHCA Z E l + Z E l
Y l = MLP Concat ( Z E l , Z M l ) + Concat ( Z E l , Z M l )
The outputs of E-MHSA, MHCA, and NTB are denoted as Z E l , Z M l , and Y l . The hybrid encoder component of UC-DETR consists of two modules: the Axial Interaction Feed-Forward (AIFI) module and the CNN-based Cross-scale Feature Fusion (CCFF) module, which further model and fuse multi-scale features from the Next-ViT backbone network output. The AIFI module enhances spatial, position-sensitive feature interactions through a Multi-Head Self-Attention mechanism that embeds two-dimensional feature maps into positional encodings. Specifically, input features X R C × H × W are first compressed to a lower channel dimension C via a 1 × 1 convolution, then flattened into sequences X R C × H × W . In the feature interaction mechanism, AIFI employs an MHSA and cross-head feature reorganization strategy. The MHSA decomposes the compressed sequence into independent subspaces for parallel computation, where the scaled dot-product self-attention of each attention head can be expressed as
Attention i = Softmax Q i K i d k + PE V i
Among them, Q i , K i , and V i are the query, key, and value vectors of the i-th head, with d k = C / h . By integrating spatial position information through positional encoding P E during attention calculation, this enhances the geometric sensitivity of bounding box localization. The positional encoding uses a frequency-division strategy, dividing embedding dimensions C into four equal parts and applying sine or cosine encoding to the width (W) and height (H) directions, respectively, enabling the model to capture relative positional relationships between pixels. After concatenation and linear projection of multi-head outputs, cross-head feature recombination is performed to enhance subspace synergy:
M ^ = i = 1 h α i M i σ ( β i M i )
where α i and β i denote the learnable gating coefficients and σ is the sigmoid function. The output feature M i R N × d k denotes the i-th head. In the CCFF module, to further enhance the dynamism and flexibility of multi-scale feature fusion, UC-DETR introduces LDConv in place of the two-dimensional convolution (Conv2D) operation. LDConv dynamically adjusts the sampling positions of the convolution kernel to more effectively adapt to the irregular distribution of underwater light sources. Assuming the initial sampling points P 0 are and the dynamic offset is Δ P , the sampling points can be defined as
P = P 0 + Δ P
At the dynamic sampling point, LDConv computes the sampled feature by bilinear interpolation and completes the dynamic convolution operation at the sampling point:
F sample = i = 1 4 g i F ( q i )
LDConv ( P ) = P n R W P n F ( P n + P )
where q i represents four adjacent points, while g i represents the interpolation weights. The convolution sampling range is denoted as P, while the learnable weight matrix is represented by W P n . Through this dynamic mechanism, LDConv enhances the model’s adaptability to complex light source deformations and reduces detection errors caused by scattering and shape perturbations. To address underwater light source diversity, the decoder employs multi-scale queries and optimizes the attention mechanism through discrete sampling, thereby improving target localization stability. The discrete sampling point is computed as
P discrete = round ( Δ P ) + P base
In the above formula, P base denotes the position of the initial query point. By incorporating a Multi-Head Self-Attention mechanism, the decoder efficiently optimizes target queries, with
Q i = MHSA F cross i , F cross j , i j
F cross i and F cross j denote the multi-scale features output by the hybrid encoder, and Q i denotes the target query feature. The multi-scale aggregation and discrete sampling strategies of the decoder significantly improve the robustness and detection accuracy of target localization.

2.1.2. Optical Axis Deflection Calculation

The UC-DETR system processes real-time images acquired by a CCD camera at a resolution of 640 × 640 to form the model’s initial feature input. The processed images yield predicted bounding boxes overlaid on the original images, together with predicted light source categories and confidence scores. Based on these outputs, the system uses perspective projection geometry and the camera’s intrinsic parameters to compute the angular deviation between predicted box center coordinates and the camera’s optical center (positioned directly above the photodetector), which is then transmitted to the host computer. The angular deviation calculation formula is
θ yaw = arctan u c x f x
θ pitch = arctan v c y f y
u and v denote the coordinates of the light spot center on the image plane. c x and c y denote the position of the intersection point between the optical axis and the imaging plane in the camera’s coordinate system. f x and f y represent the horizontal and vertical focal lengths of the camera. After normalization using the focal lengths and principal point coordinates, the coordinates ( u ,   v ) mitigate the influence of different camera and sensor configurations, ensuring more consistent angle calculations. The yaw angle θ yaw and pitch angle θ pitch indicate angular deviations between light sources and the device.

2.2. Control Core Module

The system control core utilizes a Field-Programmable Gate Array (FPGA) to coordinate module interactions and control functions, primarily handling Ethernet communication, data buffering, flow control, encoding, and modulation. Through the FPGA’s Ethernet physical layer (PHY), the system exchanges data with the host computer via the User Datagram Protocol (UDP). After receiving and caching the data from the host computer, the transmitter adopts Reed–Solomon coding; specifically, 16 bytes of redundant check is inserted for every 239 bytes of effective data to generate 255 bytes of code, and the coding rate is about 93.73%. The encoded data undergoes scrambling using a pseudo-random sequence generated by the following polynomial:
f ( x ) = x 8 + x 6 + x 5 + x 4 + 1
where x denotes the unit-delay operator and the terms x 8 ,   x 6 ,   x 5 ,   x 4 and 1 specify feedback taps at stages 8, 6, 5, and 4 of an eight-stage linear feedback shift register. Signal scrambling aims to balance the DC component by ensuring a uniform distribution of high and low levels across the bus. In underwater optical communication systems, 8b/10b encoding remains the primary data encoding method for serial communication, though it only achieves 80% bandwidth utilization. While scrambling offers slightly weaker DC balancing capabilities compared to 8b/10b, it significantly enhances channel bandwidth efficiency. After scrambling, Binary Pulse-Amplitude Modulation (BPAM) is implemented using On–Off Keying (OOK) technology, achieving a channel rate of 30 Mbps. The host computer can send commands to select the M-sequence that is continuously transmitted by the FPGA-controlled device while simultaneously generating an M-sequence through local synchronization to perform error detection.
After completing photoelectric conversion, the receiver first extracts and restores the serial data clock through the Clock and Data Recovery (CDR) module. The data is then converted from parallel serial to 8-bit parallel, demodulated, and RS-decoded. It verifies the frame-synchronization header consistency of the processed data. If inconsistencies are detected, the system adjusts bit slip in the serial-to-parallel conversion. The verified data is transmitted via Ethernet to the host computer. Meanwhile, the FPGA monitors the optical power of the APD using an external analog-to-digital converter chip, returning the optical power readings to the host computer to assess communication quality between devices.

2.3. LED Array Module

Compared to laser diodes, LEDs feature a wider emission angle that enables beam coverage over larger areas, reducing alignment difficulty [21]. However, their high divergence results in relatively insufficient light intensity at longer distances. To address this, we have employed an array of six high-power LEDs (Osram LB H9GP and Cree D02) connected in series as the light source. The diverging light from these high-power LEDs expands the spot radius, reduces the difficulty of quasi-alignment in the UWOC system, enhances its mobility, and compensates for the light intensity attenuation caused by divergence.
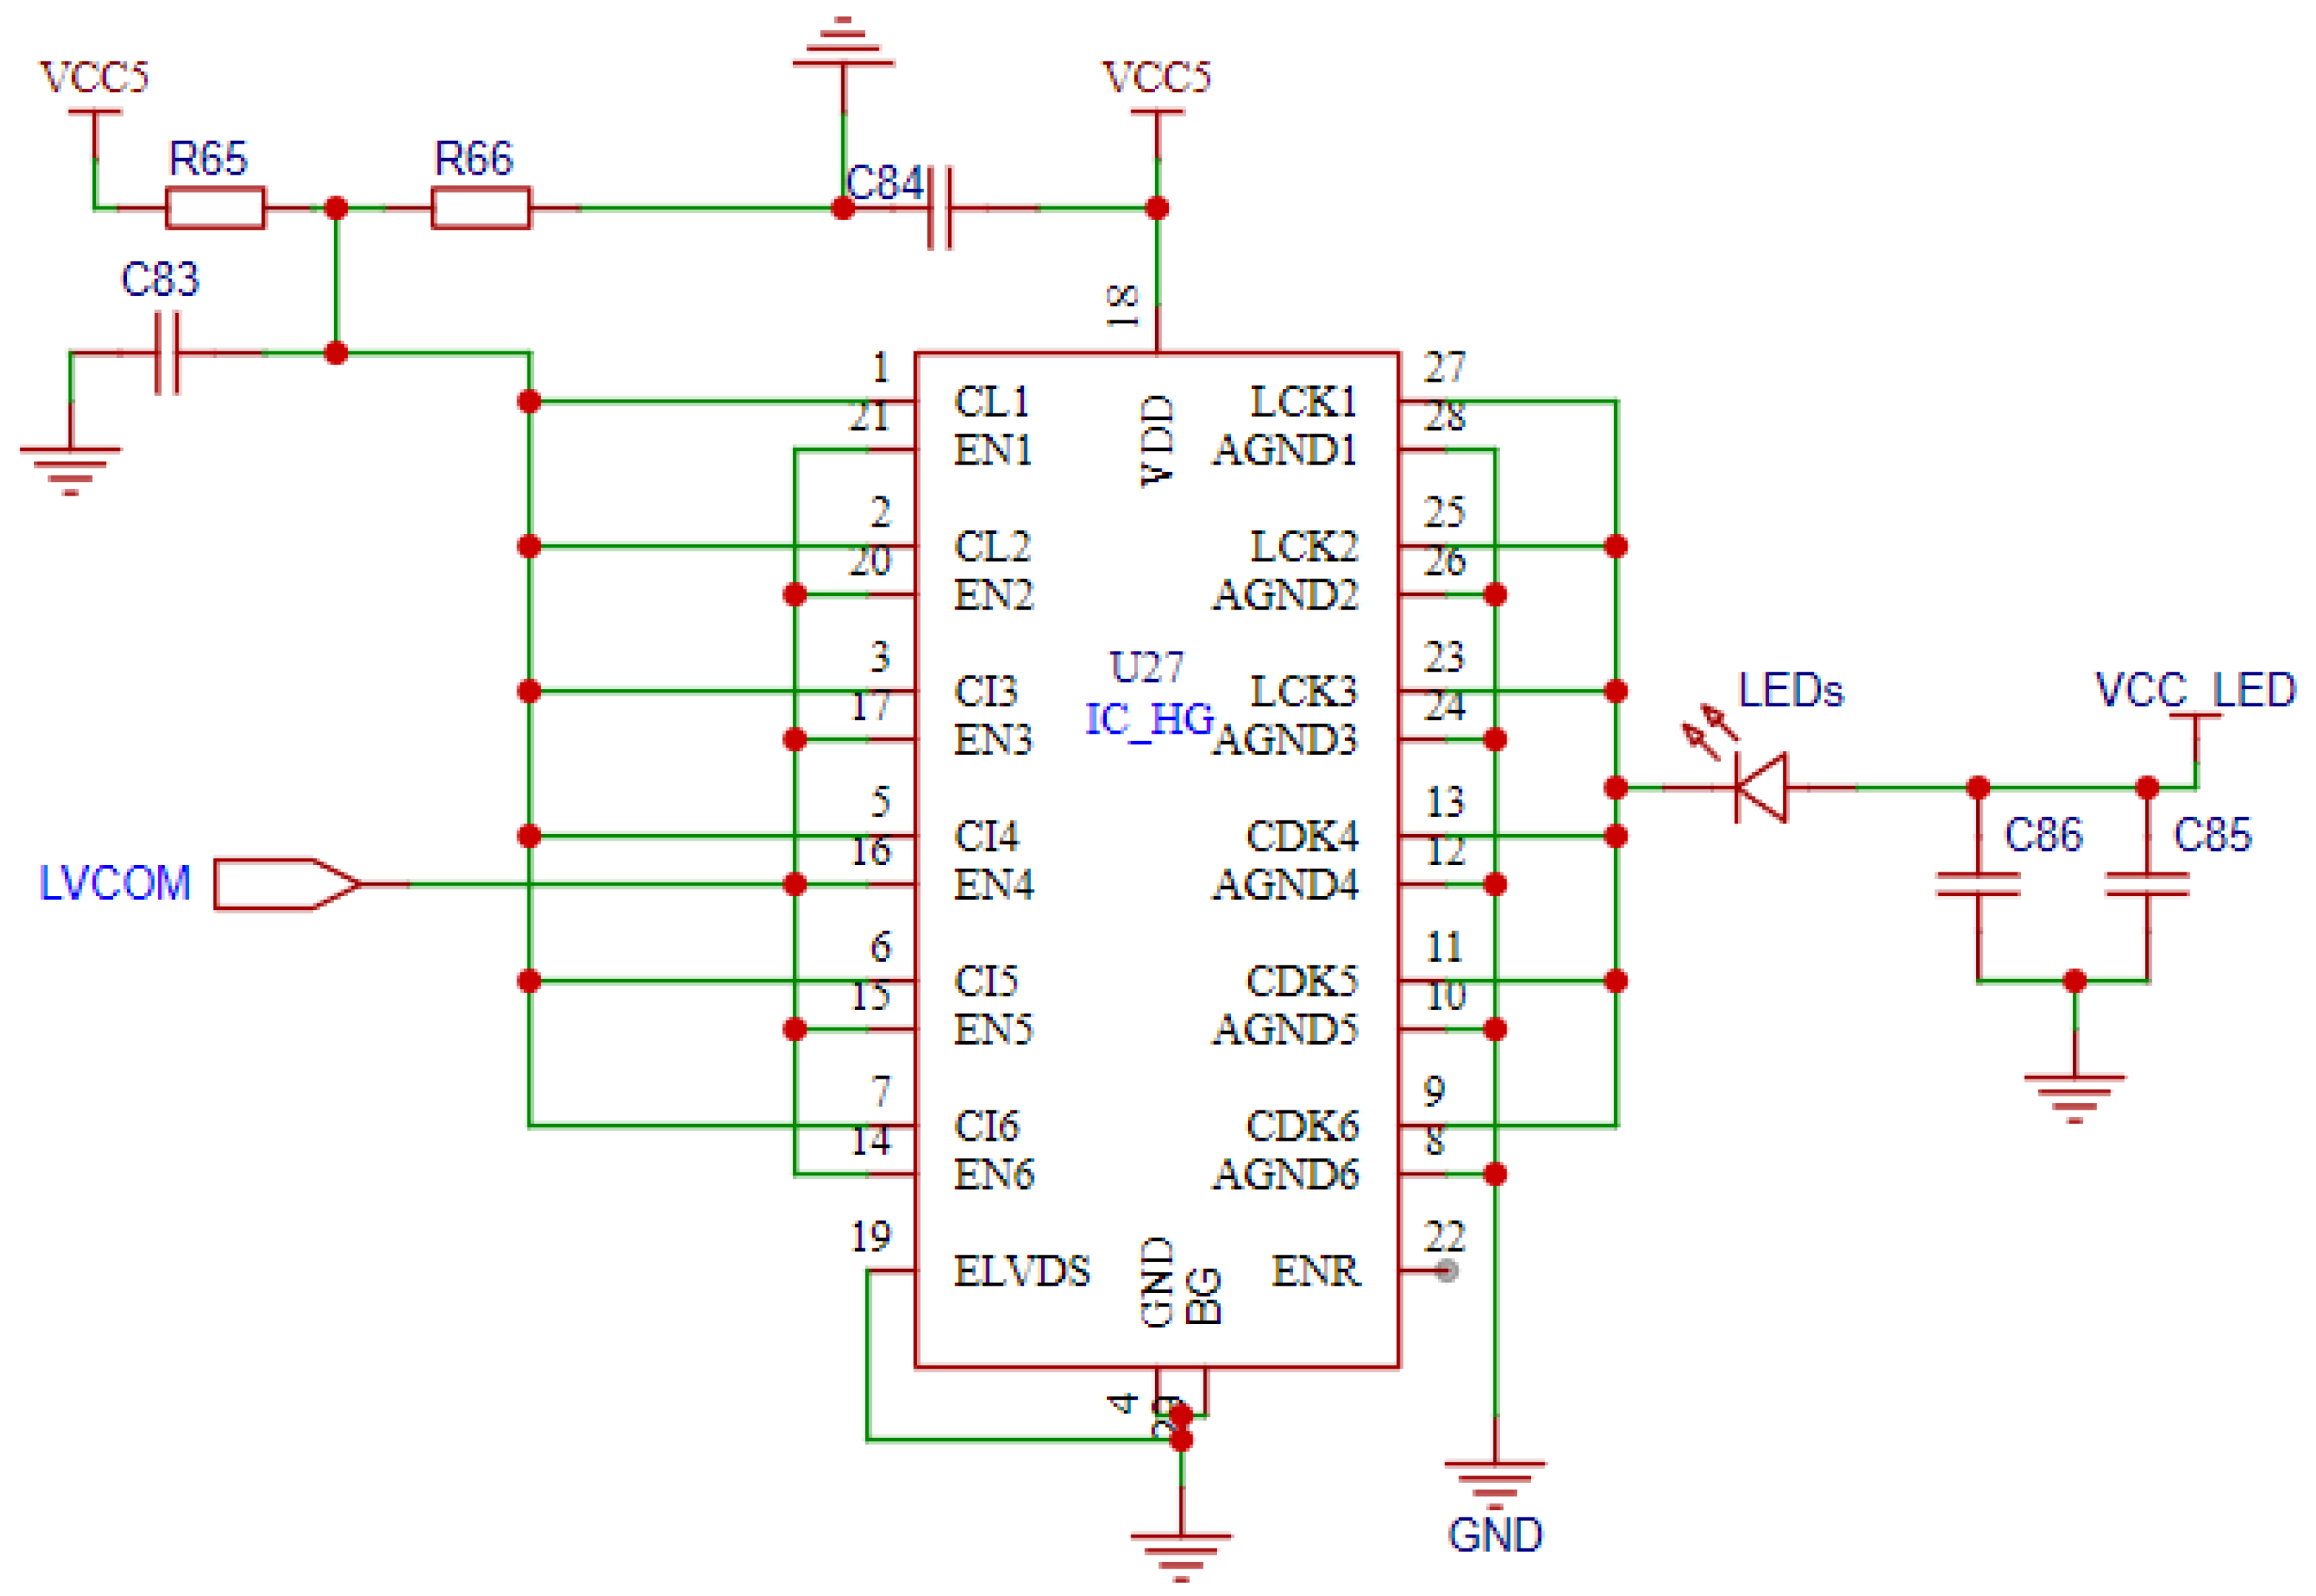
The LED array radius is 110 mm, while the divergence angle of a single LED is about 60°–120°, and the power is about 1.65 W. The LED drive circuit design is shown in Figure 3.
As the forward current flowing through the LED increases, the carrier recombination rate within the device rises, thereby generating more photons. However, excessive current may cause overheating and light decay, while the internal resistance decreases with rising temperature, further increasing current demand. Simultaneously, elevated temperatures shift the emitted light wavelength toward longer wavelengths, affecting the LED’s color temperature and hue. To address these issues, the IC-HG30 six-channel laser switch is employed in the LED driver to achieve nanosecond-level switching frequency. The circuit incorporates multiple capacitors for power decoupling, filtering out noise to ensure stable power supply. To maintain signal integrity and system stability, the driver current is adjusted to an optimal range, with the photoelectric modulation frequency limited to 30 MHz.

2.4. APD Receiver Module

In underwater optical communication, water flow-induced disturbances cause continuous misalignment between transmitters and receivers, making light source alignment significantly more complex than in air environments. To address this, we have employed a high-sensitivity APD detector (S8664-50K with a photosensitive area of 19.6 mm2), whose avalanche multiplication effect amplifies weak optical signals. Compared to traditional PIN photodiodes, this design achieves remarkable improvements in both reception sensitivity and transmission distance. The circuit design of the APD receiver module is illustrated in Figure 4.
The receiver APD converts the weak optical signal into an electrical current, which is then amplified by an OPA847 transimpedance amplifier (theoretical bandwidth 501 MHz). The amplified signal passes through a high-pass filter composed of capacitor C8 and resistor R11 to eliminate low-frequency noise. Subsequently, the signal undergoes secondary amplification via an EL5362 operational amplifier (a theoretical bandwidth of 500 MHz), ultimately being converted into the LVCOMS digital level by a comparator. Due to the APD’s maximum photoelectric response bandwidth of 55 MHz, the actual bandwidth of the receiving module is determined by this parameter. Combined with the modulation capability of the LED array, the system communication bandwidth is set to 30 MHz, consistent with the FPGA configuration.

3. Experimental Test and Analysis

3.1. Data Set Construction

In this study, we have utilized a single server equipped with 16 NVIDIA A100 GPUs (NVIDIA, Santa Clara, CA, USA) for training and testing the UC-DETR model. To enhance the model’s generalization performance and validate the effectiveness of the optimization module, we have constructed a dataset containing 11,390 images, which is named the underwater wireless optical communication LED source (UWOC-LED). All images were captured using an underwater CCD camera in real underwater environments and divided into training, validation, and test sets at an 8:1:1 ratio. Light in the blue–green window (approximately 450–550 nm) exhibits relatively low attenuation in seawater, which improves propagation efficiency [22]. Accordingly, we have used blue (470 nm) and green (520 nm) as the source wavelengths. Additionally, we have conducted imaging at multiple communication distances: 5 m, 10 m, 15 m, 20 m, and 35 m. At each distance, we have captured light source images from different angles to ensure comprehensive data coverage. To further diversify the dataset, we have performed imaging under various lighting conditions, including daytime, evening, and nighttime. The CCD camera features an image resolution of 1920 × 1080, a frame rate of 60 FPS, and a field of view angle of 90°. We have recorded two environmental quantities directly related to image quality during the acquisition of the UWOC-LED dataset: ambient illuminance and water-quality attenuation. Ambient illuminance was measured with a DLX-1830 at the same measurement location (poolside, approximately 0.5 m above the water surface, and probe parallel to the camera optical axis) during daytime/evening/night, and typical readings were approximately 8153 lx/151 lx/5 lx. Water-quality attenuation was estimated by comparing the transmitted power along the same optical path with and without water using 470 nm (blue) and 520 nm (green) narrowband LEDs; after subtracting empty-load and window losses, the result was converted to an attenuation of approximately 0.8 dBm/m.

3.2. UC-DETR Comparative Analysis

To evaluate the performance of different object detection models, we compared YOLOv8, YOLOv10, YOLOv11, RT-DETRv2, and our proposed UC-DETR model across various scales. All comparison models were trained using the same input resolution (640 × 640). Evaluation metrics included model parameters (Params), inference latency (Latency), mean Average Precision (mAP), GFLOPs (Giga Floating-point Operations Per Second), and the AP50 metric.
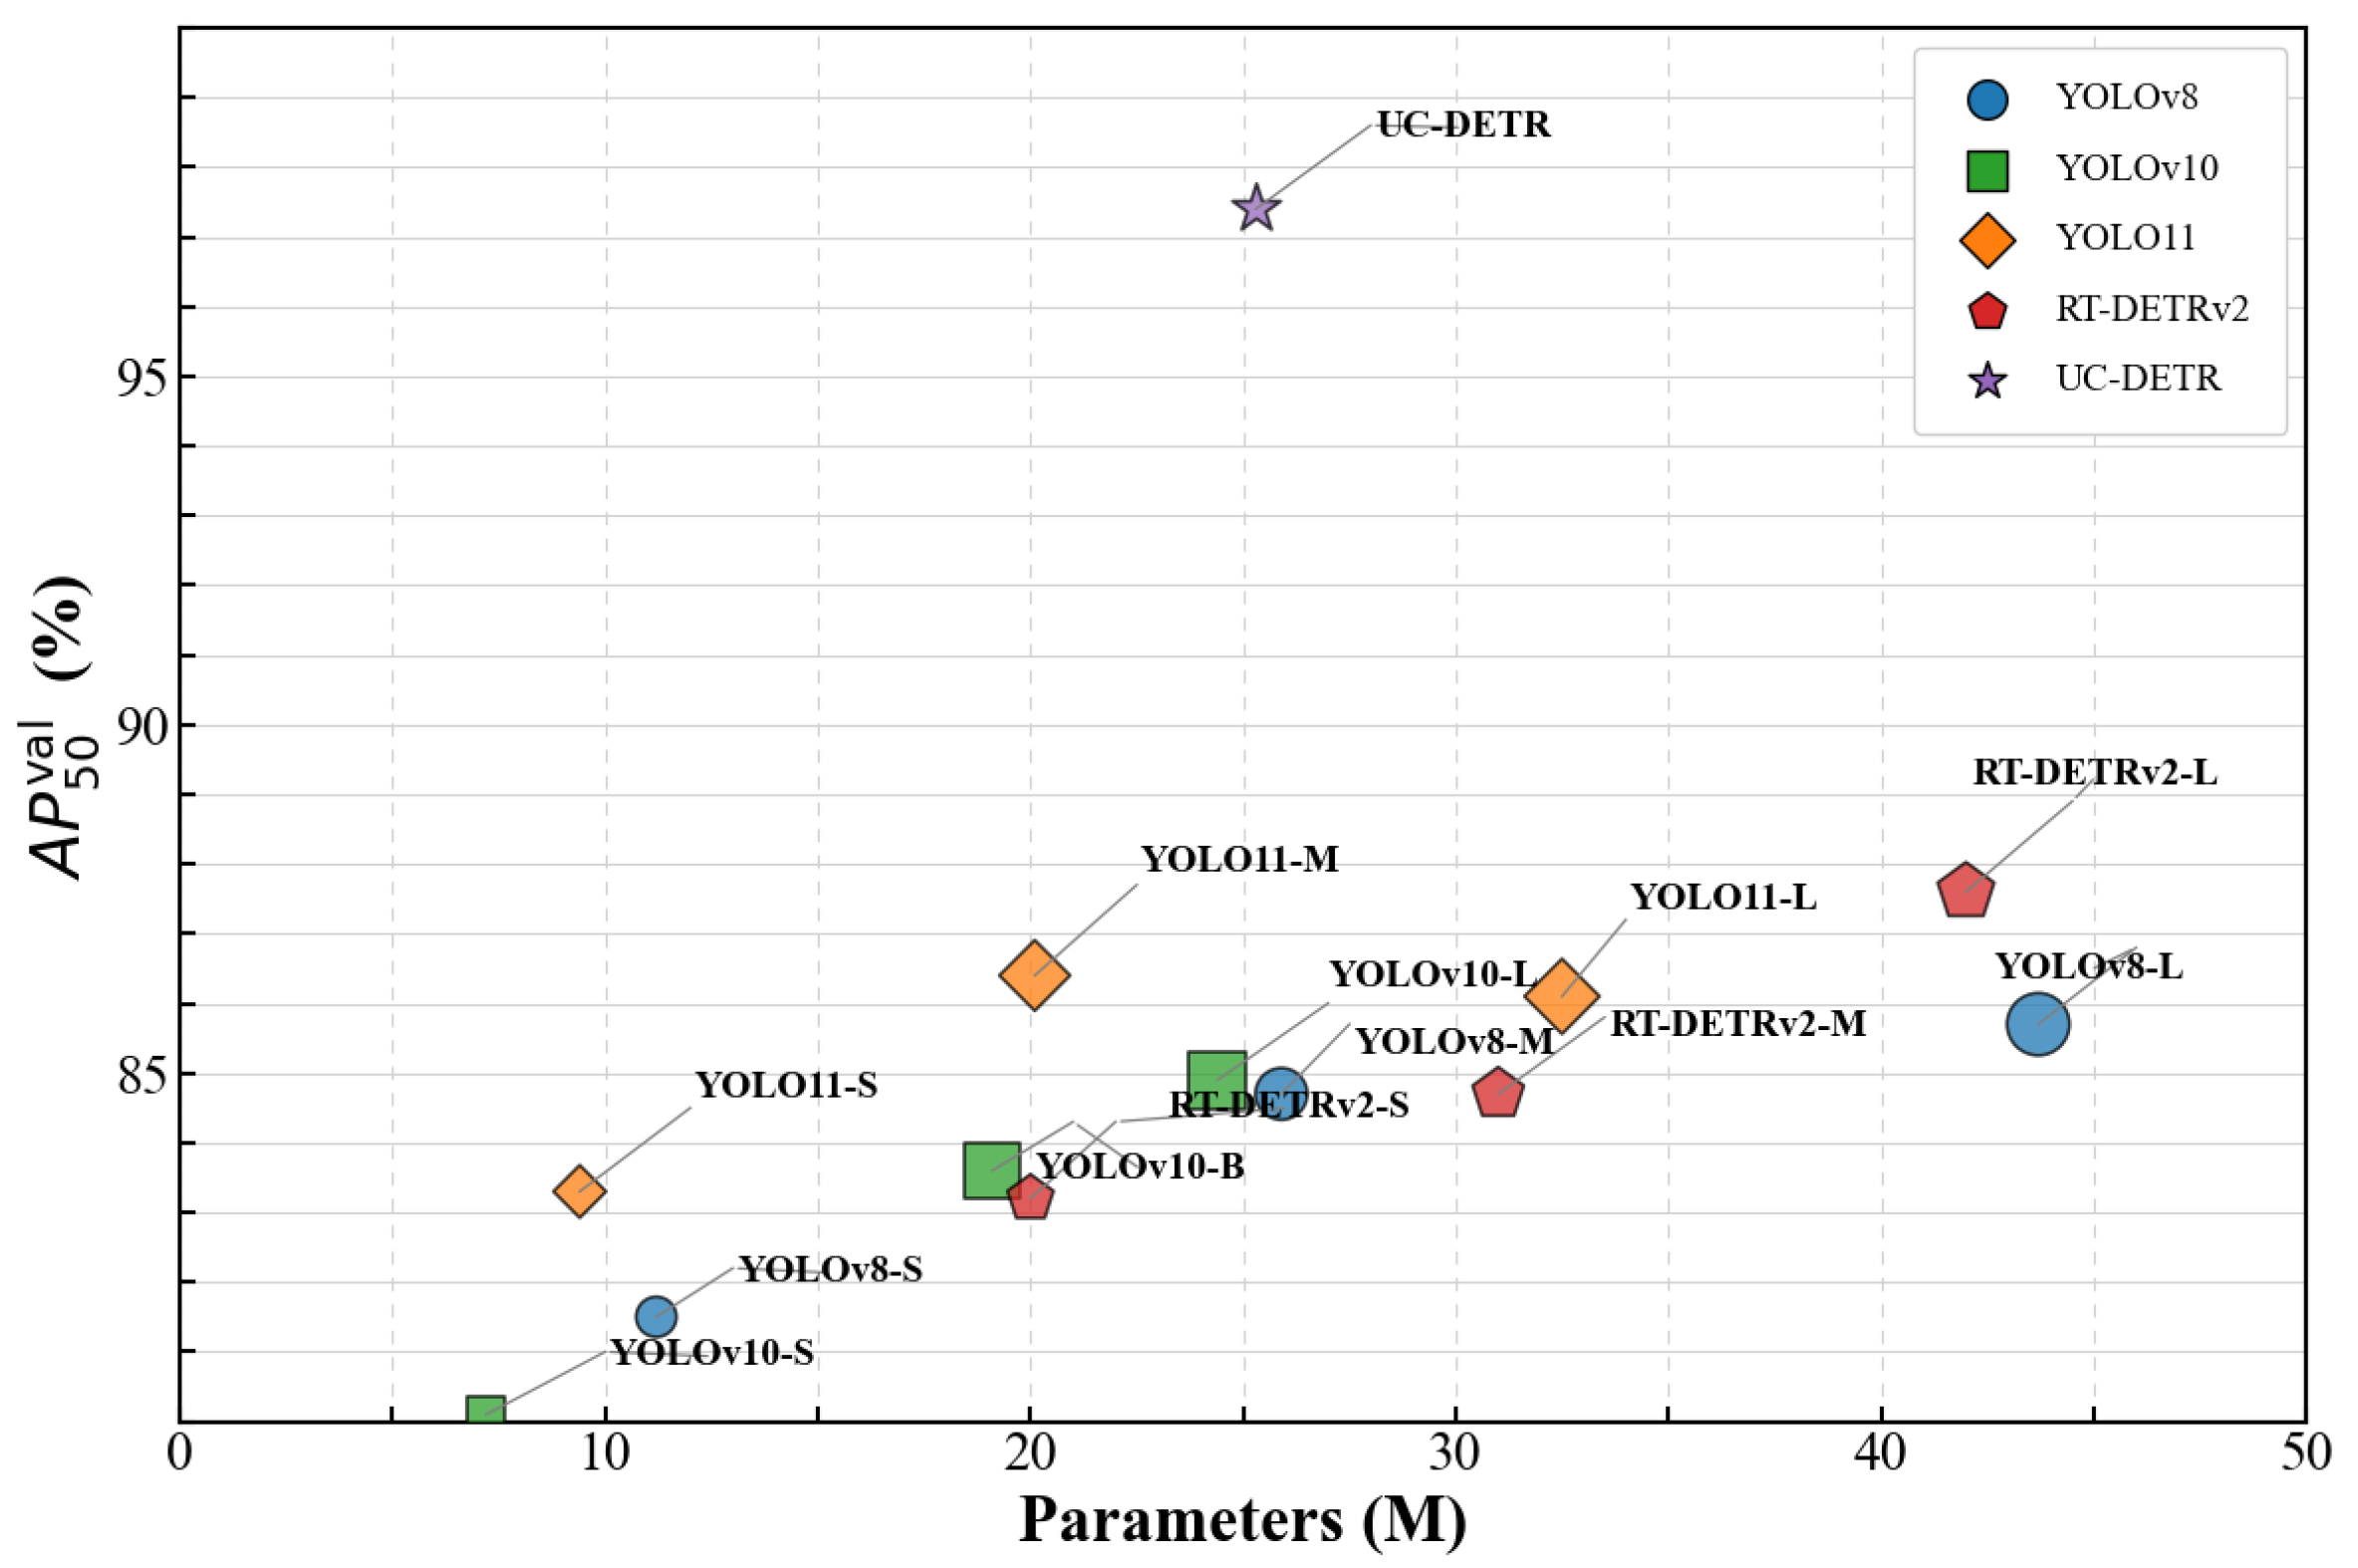
As shown in Table 1, UC-DETR demonstrates superior performance across multiple metrics. With a parameter size of 25.3 million and a computational complexity of 72.7 GFLOPs, it achieves lower computational costs compared to the YOLOv8 series while being approximately 46.5% more efficient than RT-DETRv2-L. For inference latency, UC-DETR’s processing time of 4.98 ms significantly outperforms YOLOv8-L (12.39 ms) and RT-DETRv2-L (13.71 ms), making it particularly suitable for deployment on underwater devices with limited computing power.
As shown in Figure 5, the other comparison models exhibit monotonically increasing accuracy as the parameter scale grows, but the area of the scatter points shows a decreasing trend; by contrast, UC-DETR delivers higher accuracy and stability at a comparable parameter scale. Specifically, UC-DETR achieves an mAP of 81.1%and an AP50 of 97.4%. Compared to RT-DETRv2-L, it shows a 14.8% improvement in mAP and a 10% increase in AP50. When measured against YOLOv11-L, UC-DETR outperforms by 13.9% in mAP and 11.3% in AP50. These results indicate that UC-DETR strikes an optimal balance between model complexity, inference efficiency, and detection accuracy, making it particularly suitable for real-time applications requiring high precision.

3.3. UC-DETR Ablation Experiment

The ablation experiments were conducted on UWOC-LED using the same 16 NVIDIA A100 GPUs. Table 2 presents the results of the ablation experiments based on the UC-DETR model, where we have analyzed how different backbone networks and convolutional module replacements affect model performance. The experiments employed ResNet18, ResNet50, and Next-ViT as backbone networks, compared Conv2D with LDConv architectures, and evaluated multiple dimensions using metrics from the previous section.
Experimental results show that while ResNet50 increases parameters by 11.1 million and GFLOPs by 32.1 compared to ResNet18, its mAP and AP50 only improve by 0.7% and 2.5%, respectively, with inference latency significantly increasing to 9.39 ms. This indicates limited benefits from simply adding more layers to the main network for feature extraction efficiency. This change corresponds to an increase in the channel configuration from [64, 128, 256, 512] to [256, 512, 1024, 2048], that is, a four-fold widening at each stage. The model depth remains essentially unchanged; however, the wider channels improve accuracy by enhancing the backbone’s representational capacity. When Next-ViT is used as the backbone, the hyperparameters are configured with fixed channel widths tailored to the downstream task. Compared with ResNet50+LDConv, the parameter count increases slightly to 25.3 M, whereas the GFLOPs decrease to 72.7 and the inference latency to 4.98 ms; correspondingly, mAP and AP50 increase to 81.1% and 97.4%, respectively. These results indicate that the hybrid Transformer–CNN design of Next-ViT yields more efficient feature representations. Additionally, replacing Conv2D with LDConv on the same Next-ViT backbone causes only a slight reduction in GFLOPs to 72.7 and a 0.27 ms increase in latency, yet it achieves 1.3% and 1.5% improvements in mAP and AP50. These results reveal that LDConv’s dynamic properties better capture cross-scale feature correlations, thereby enhancing target detection performance. Therefore, the ablation experiments in UC-DETR clearly validate the effectiveness of LDConv in the encoder’s feature fusion module and the outstanding performance of the Next-ViT backbone in overall model efficiency.
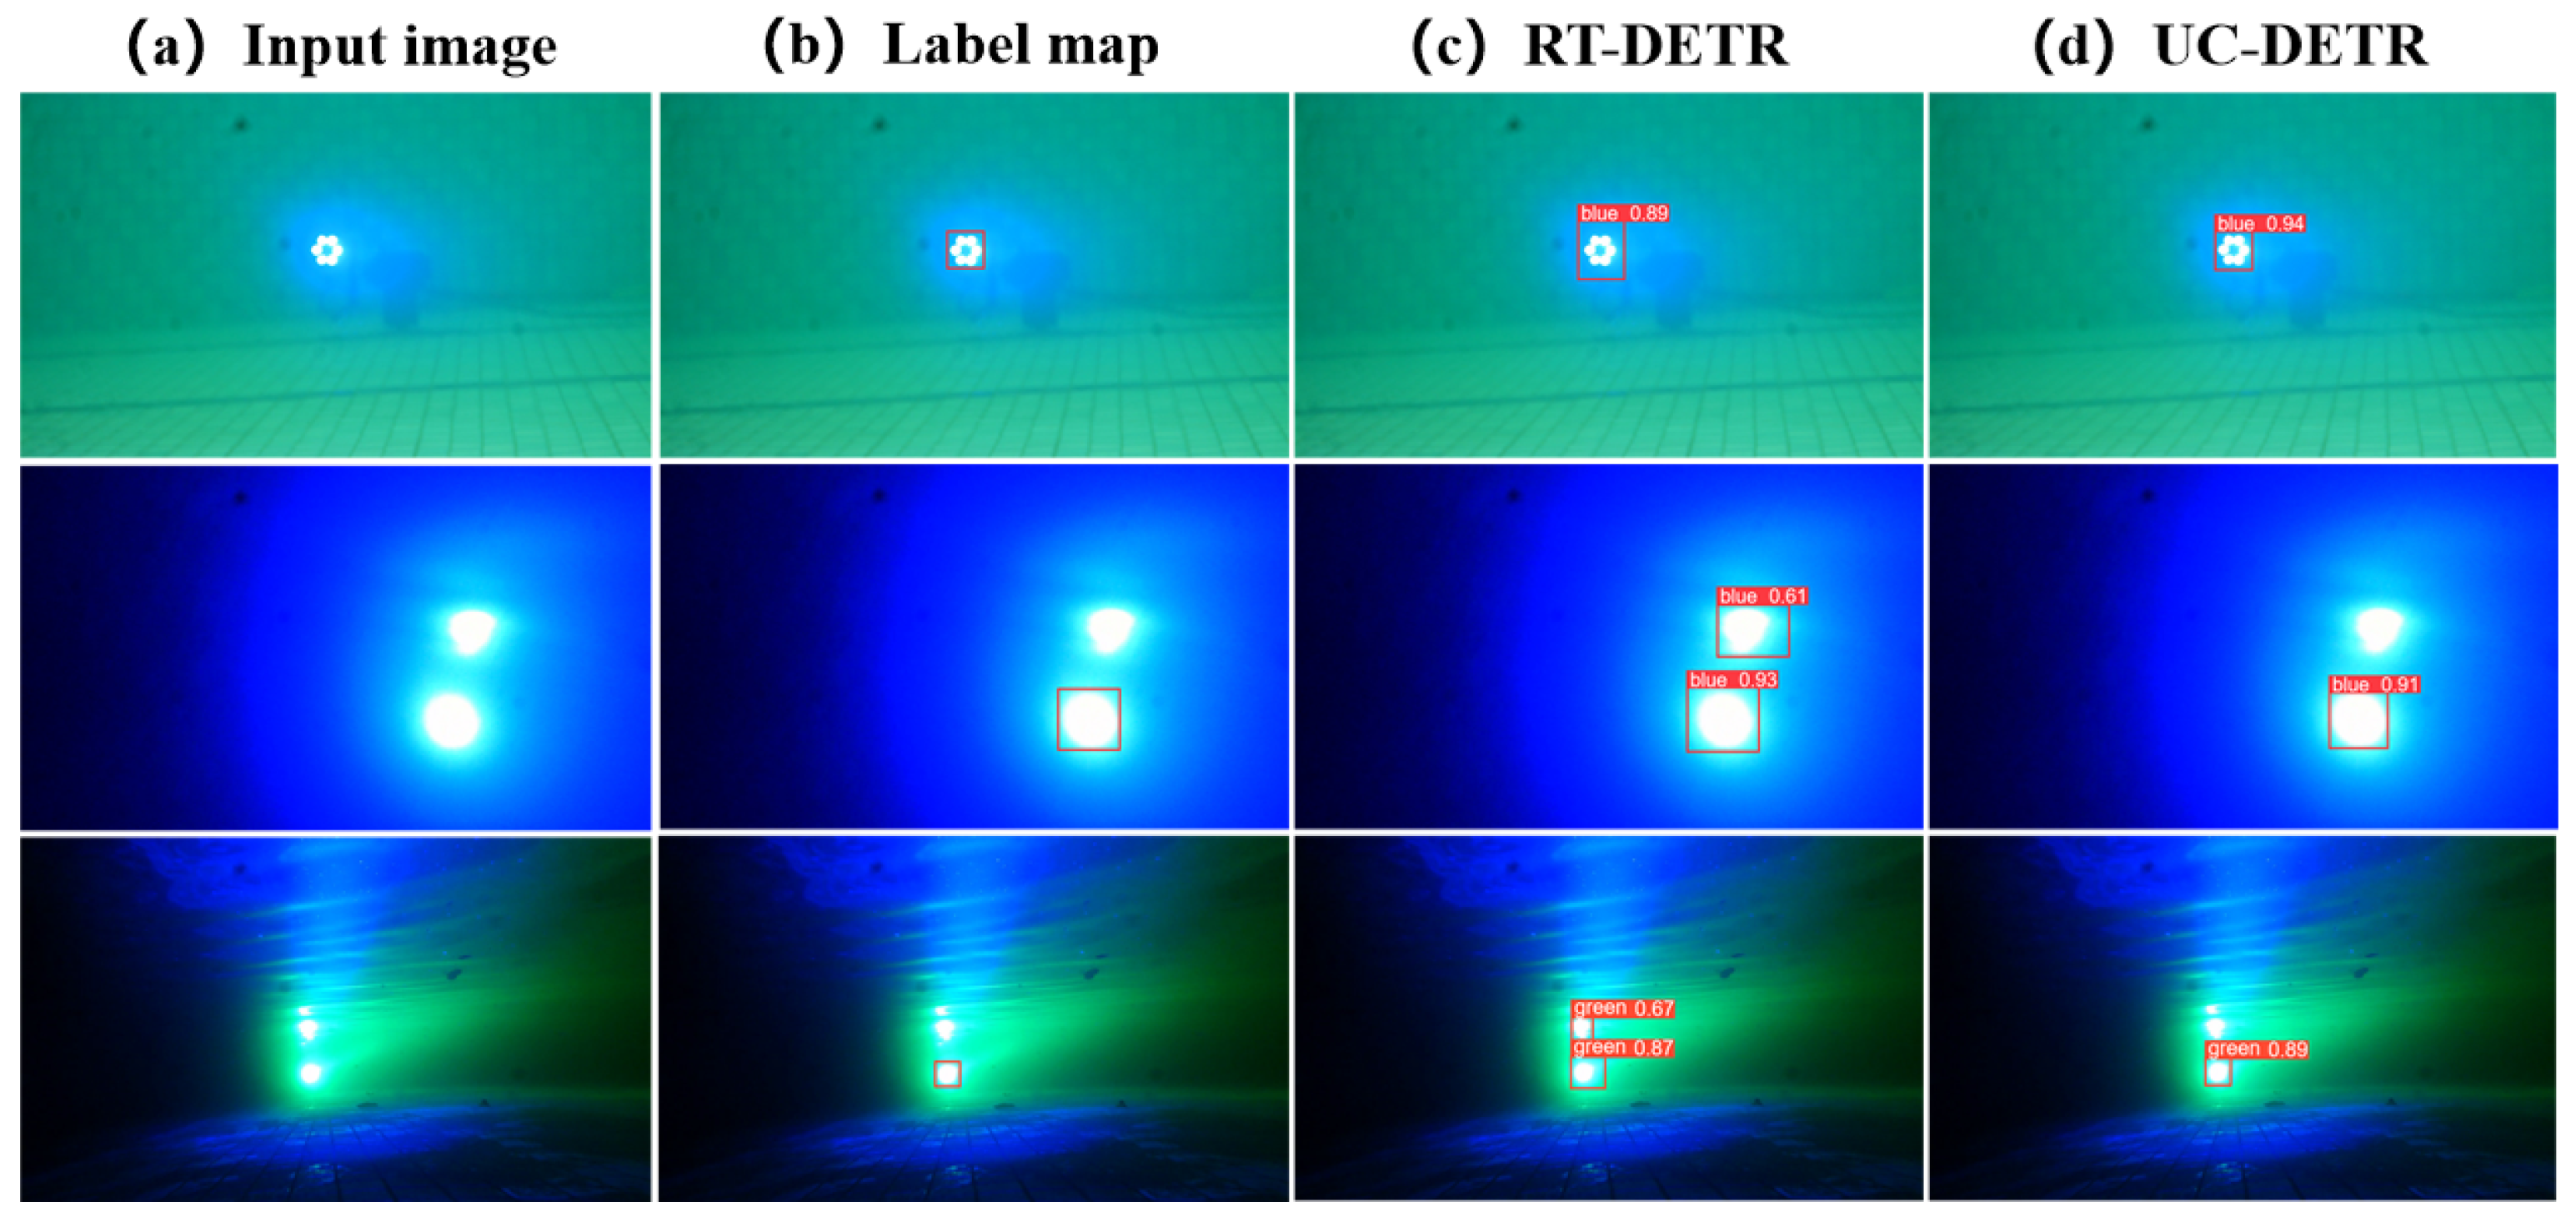
As shown in Figure 6, during the ablation experiments, RT-DETR fails to effectively filter out interference light sources. This phenomenon indicates that RT-DETR primarily relies on the ResNet convolutional network to extract local features while lacking attention to global features. Additionally, the excessive number of network layers leads to the loss of high-frequency features in key target regions. In contrast, UC-DETR employs Next-ViT as its backbone network to capture global contextual information in images. By feeding critical regional information into its neck encoder, UC-DETR can more effectively analyze initial features of light spots, thereby enhancing its ability to distinguish authentic light spots from interference ones.

3.4. Underwater Optical Communication System Swimming Pool Experiment

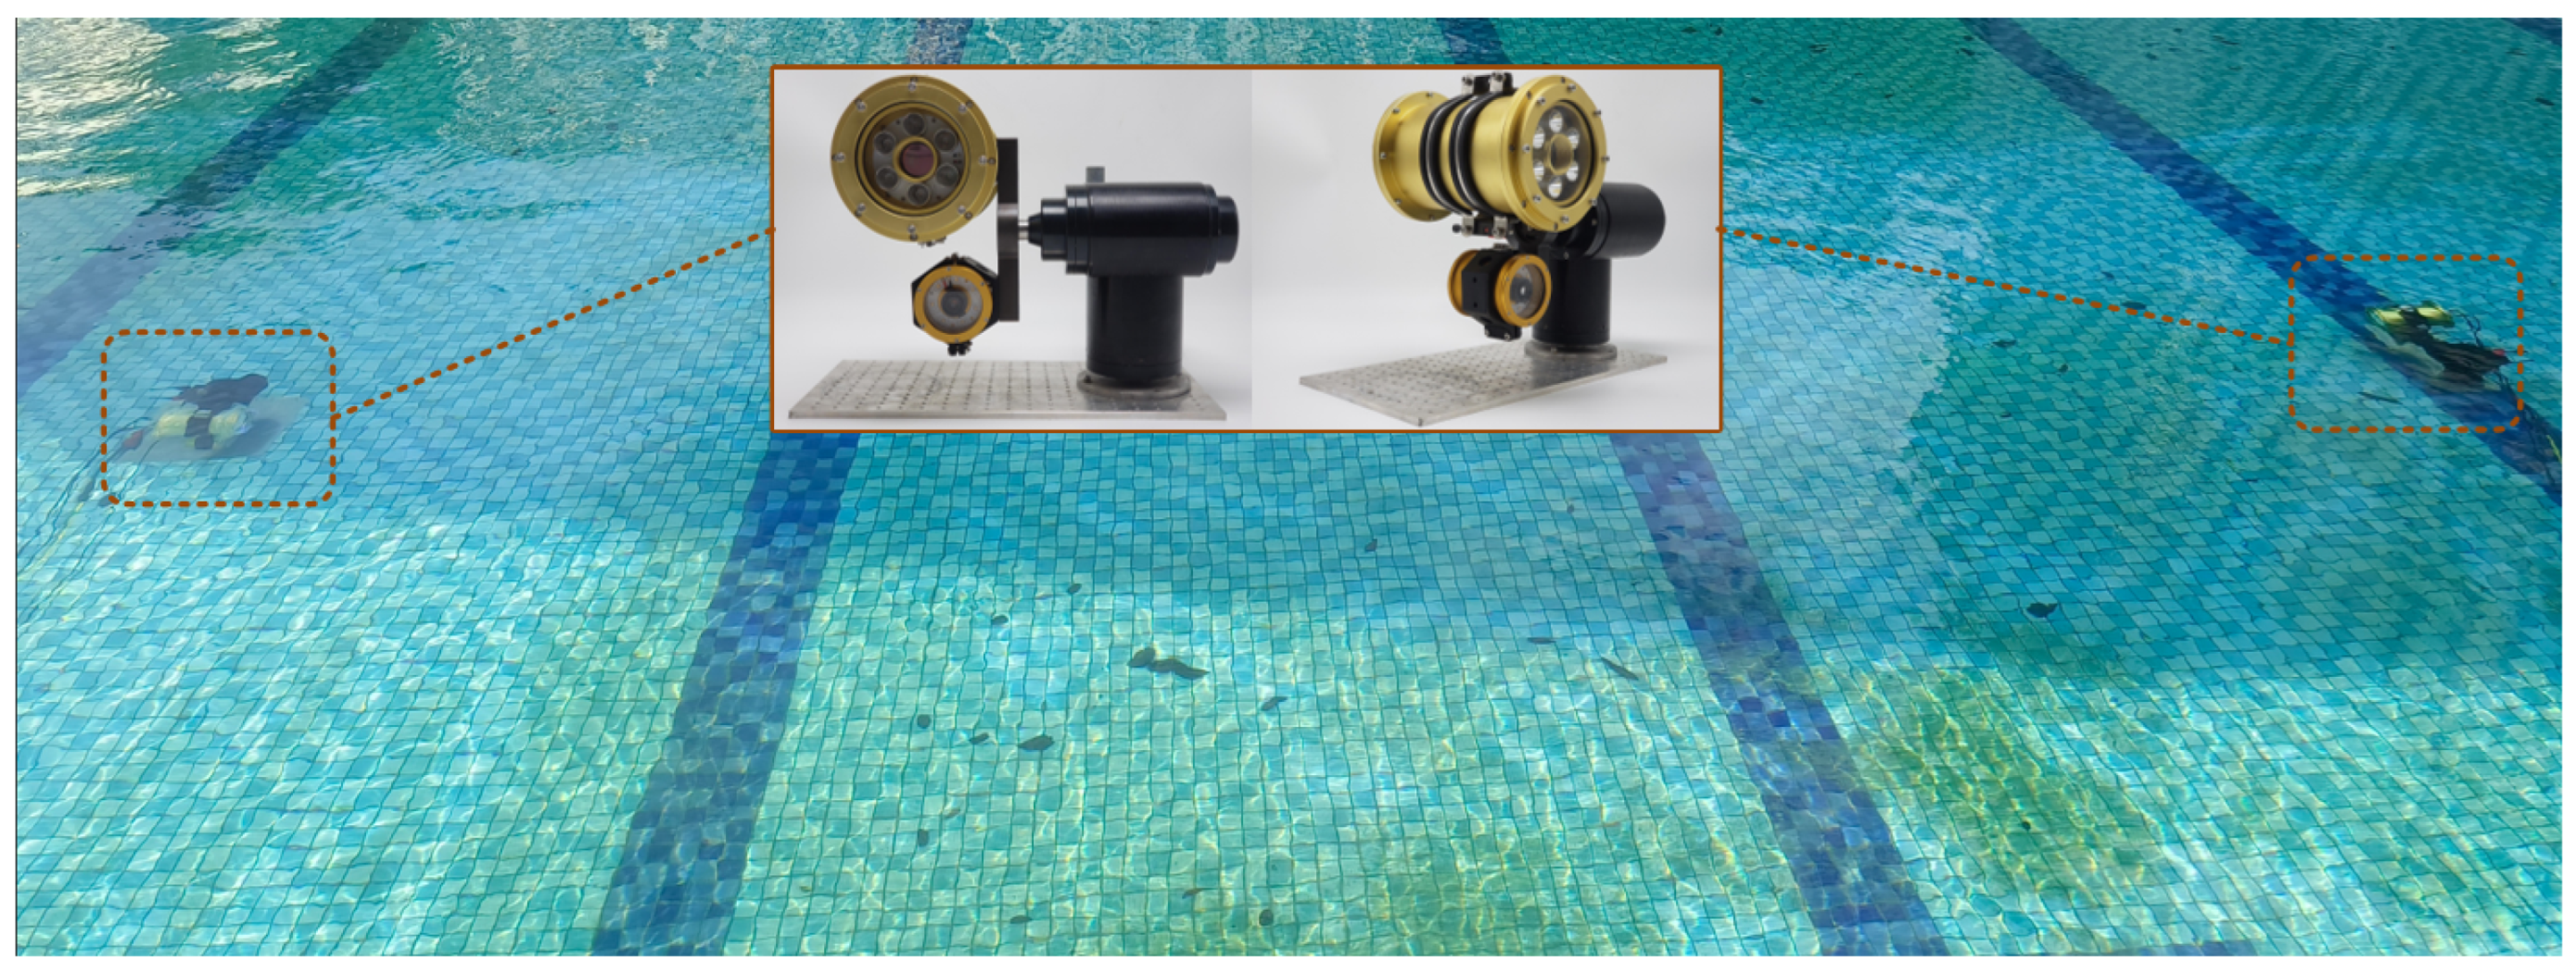
In order to verify the communication performance of the system, we have conducted real underwater experiments in an open standard swimming pool. The pool is 50 m long and 25 m wide, with relatively clear water quality and a light attenuation coefficient of about 0.8 dBm/m, as shown in Figure 7.
We have employed two prototype devices, with one equipped with green LEDs at one end and blue LEDs at the other. The primary purpose of using light with different wavelengths is to prevent crosstalk and detection interference caused by signals of the same wavelength during bidirectional communication. Both prototypes have been mounted on underwater gimbal systems composed of high-resolution CCD industrial cameras and precision motors. Motor specifications are detailed in Table 3.
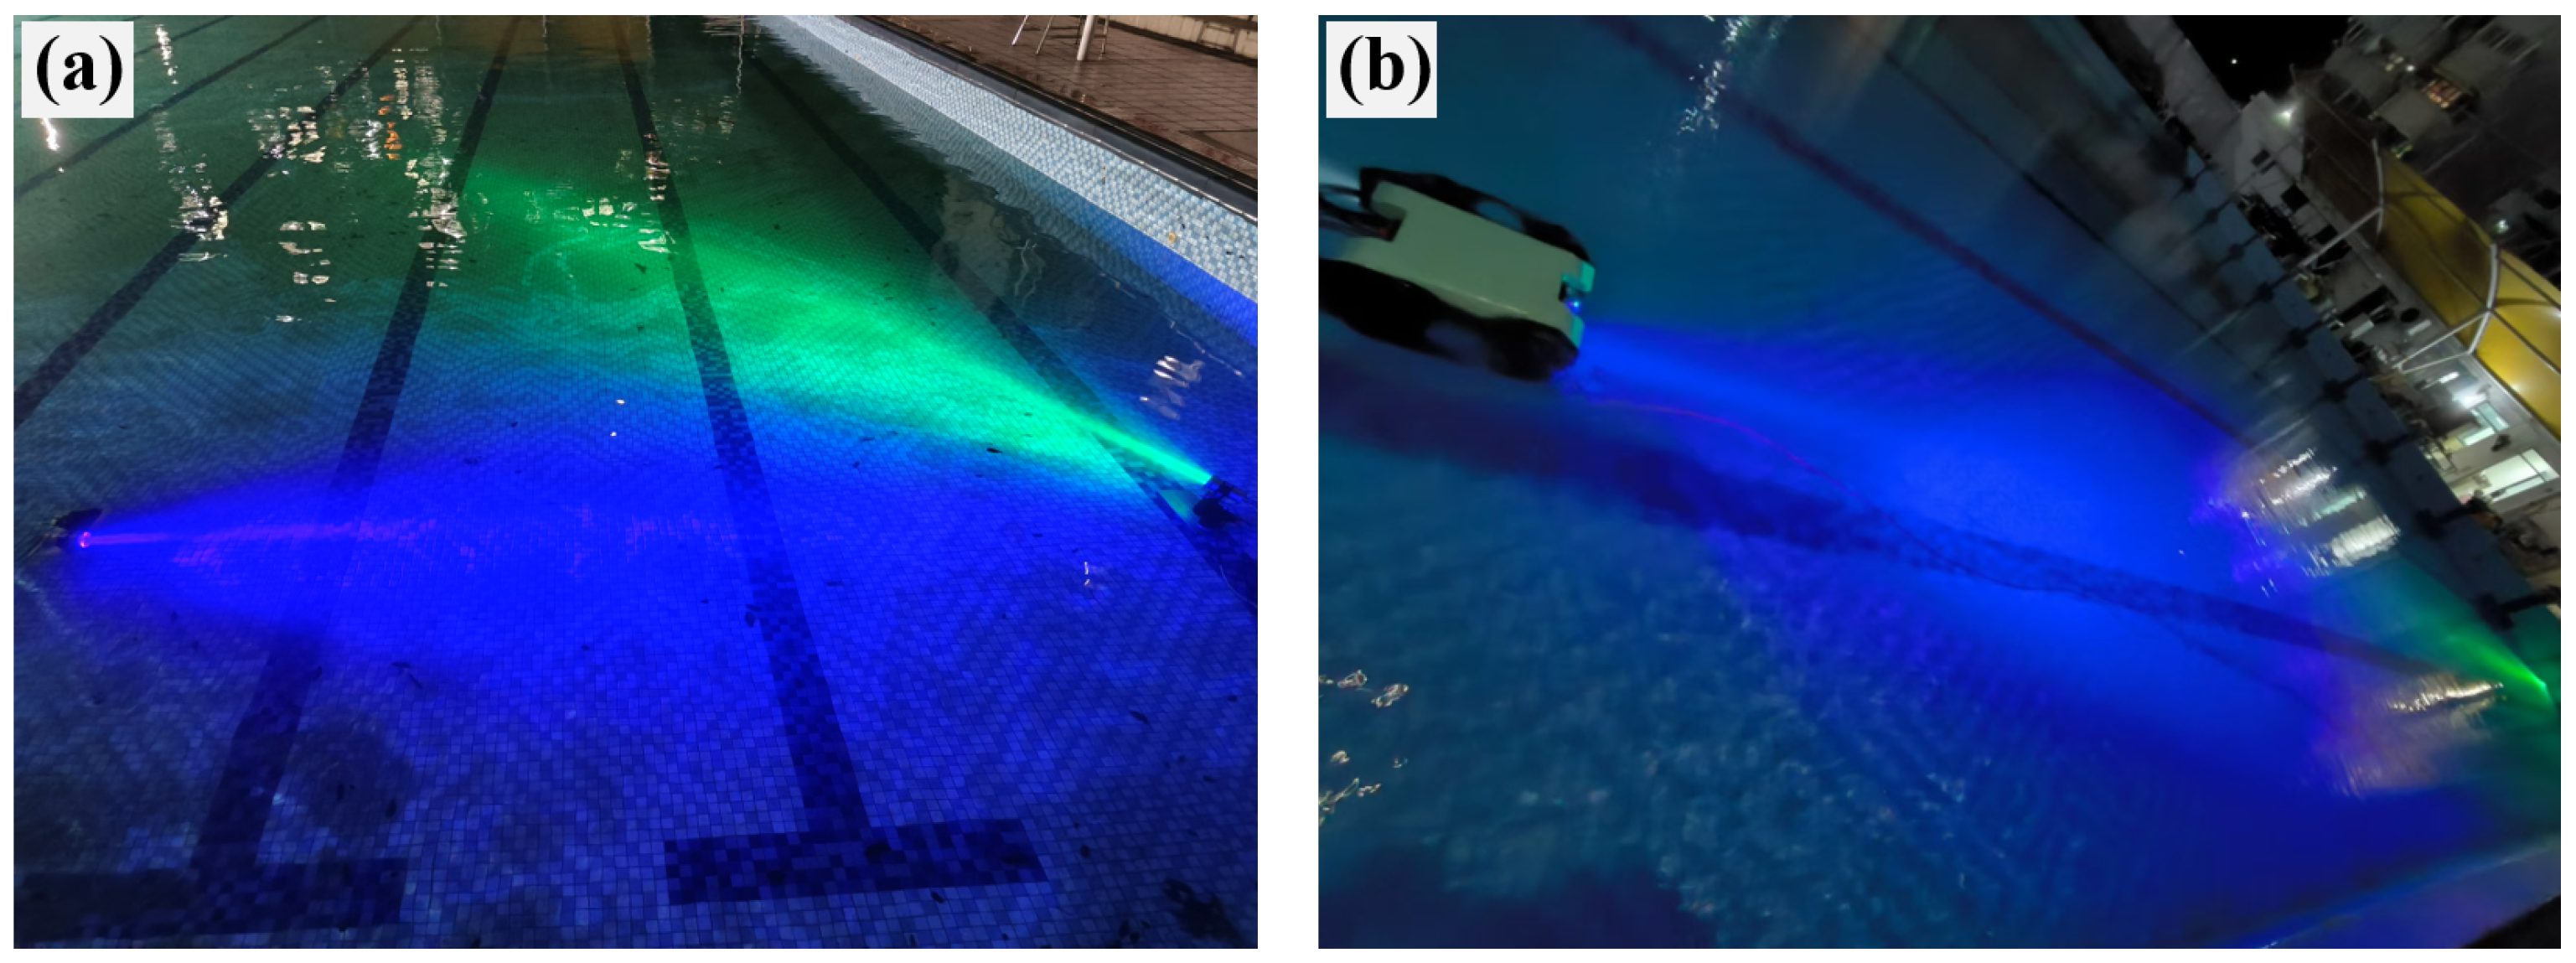
To verify the auxiliary light source alignment capabilities from different angles, we have positioned a prototype equipped with blue LEDs at the center of the pool. By adjusting the horizontal distance between the two devices using a portable bracket mounted with green LEDs on the shore, we have simulated lateral displacement caused by underwater turbulence. For comparison, we have also conducted alignment experiments using the standard ROV-based UWOC system, as shown in Figure 8.
After system startup, the host computer initiates dual-end initialization error testing and activates light source-assisted alignment. Communication establishment and stability are verified through BER analysis. The CCD camera mounted on the underwater pan-tilt unit captures images at 60 frames per second (16.6 ms interval). The UC-DETR model processes each frame in approximately 5 ms, which is significantly faster than the 30.8 ms required to correct 1-degree deviation under maximum motor rotation speed conditions.
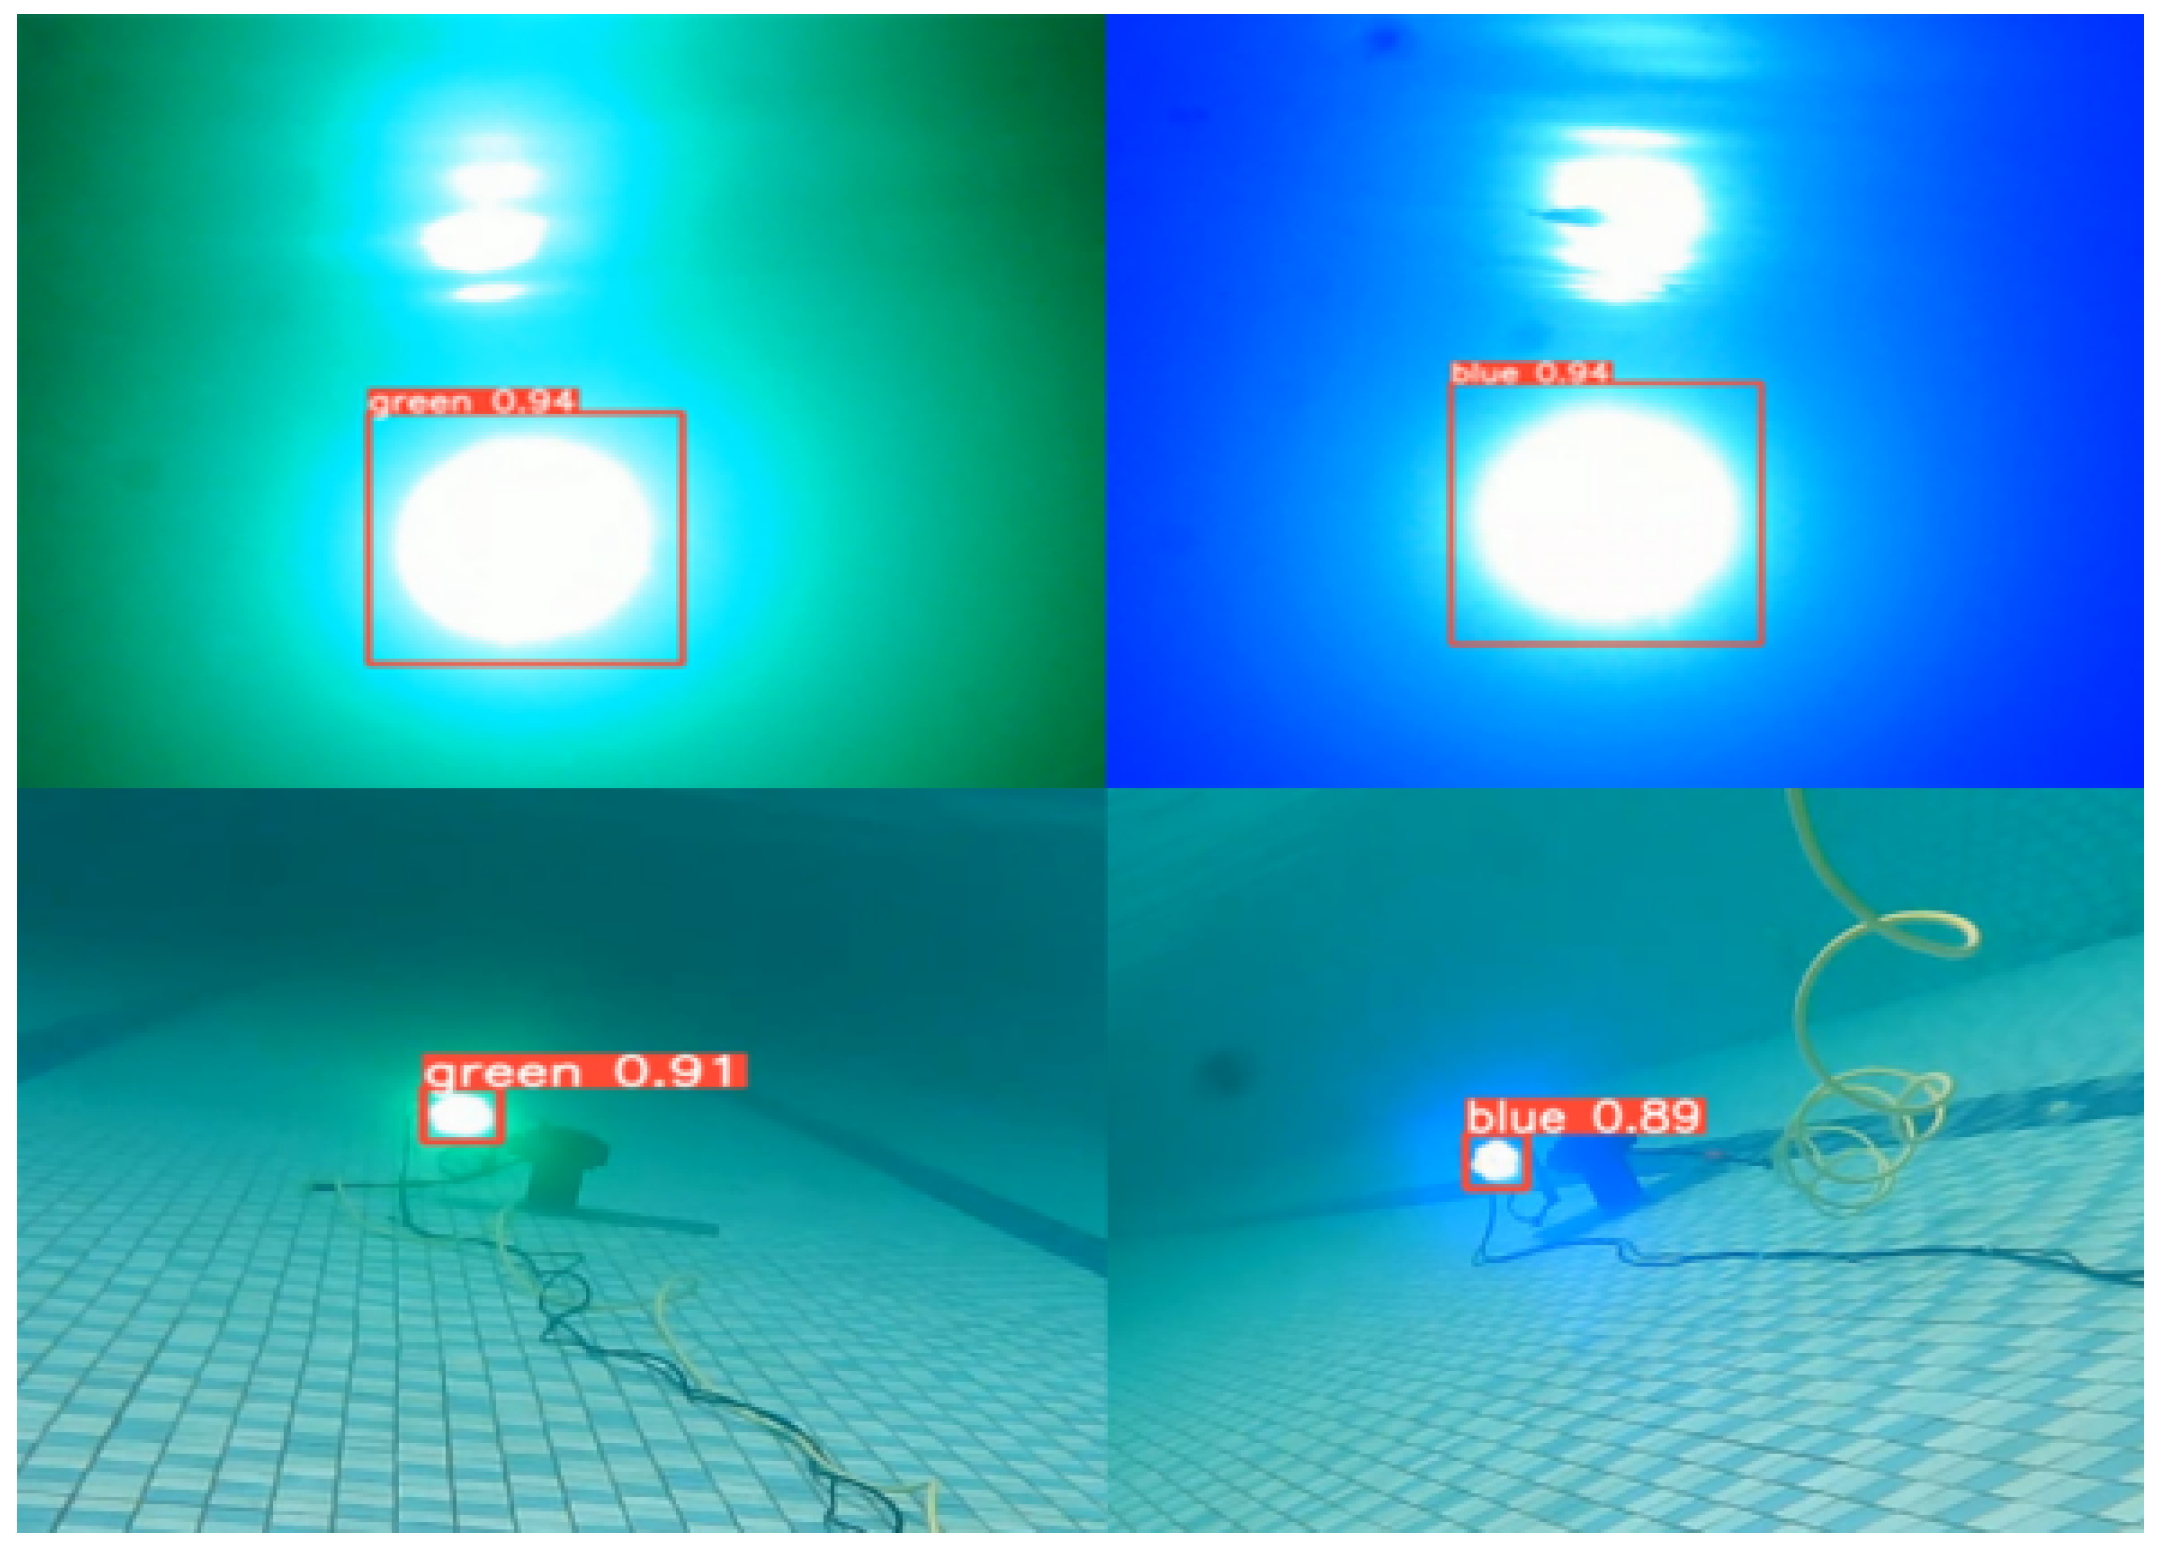
The captured light spot images are transmitted in real time to the host computer, where the UC-DETR algorithm predicts the light source’s center position and sends back the relative rotation angle parameters of the light spot with respect to the device, thereby driving the light source to align. Before the correction is complete, the model continuously processes subsequent images, dynamically updating commands to ensure alignment accuracy. Figure 9 shows a real-time imaging example of light spot detection for the light source.

3.5. Swimming Pool Communication Experiment Analysis

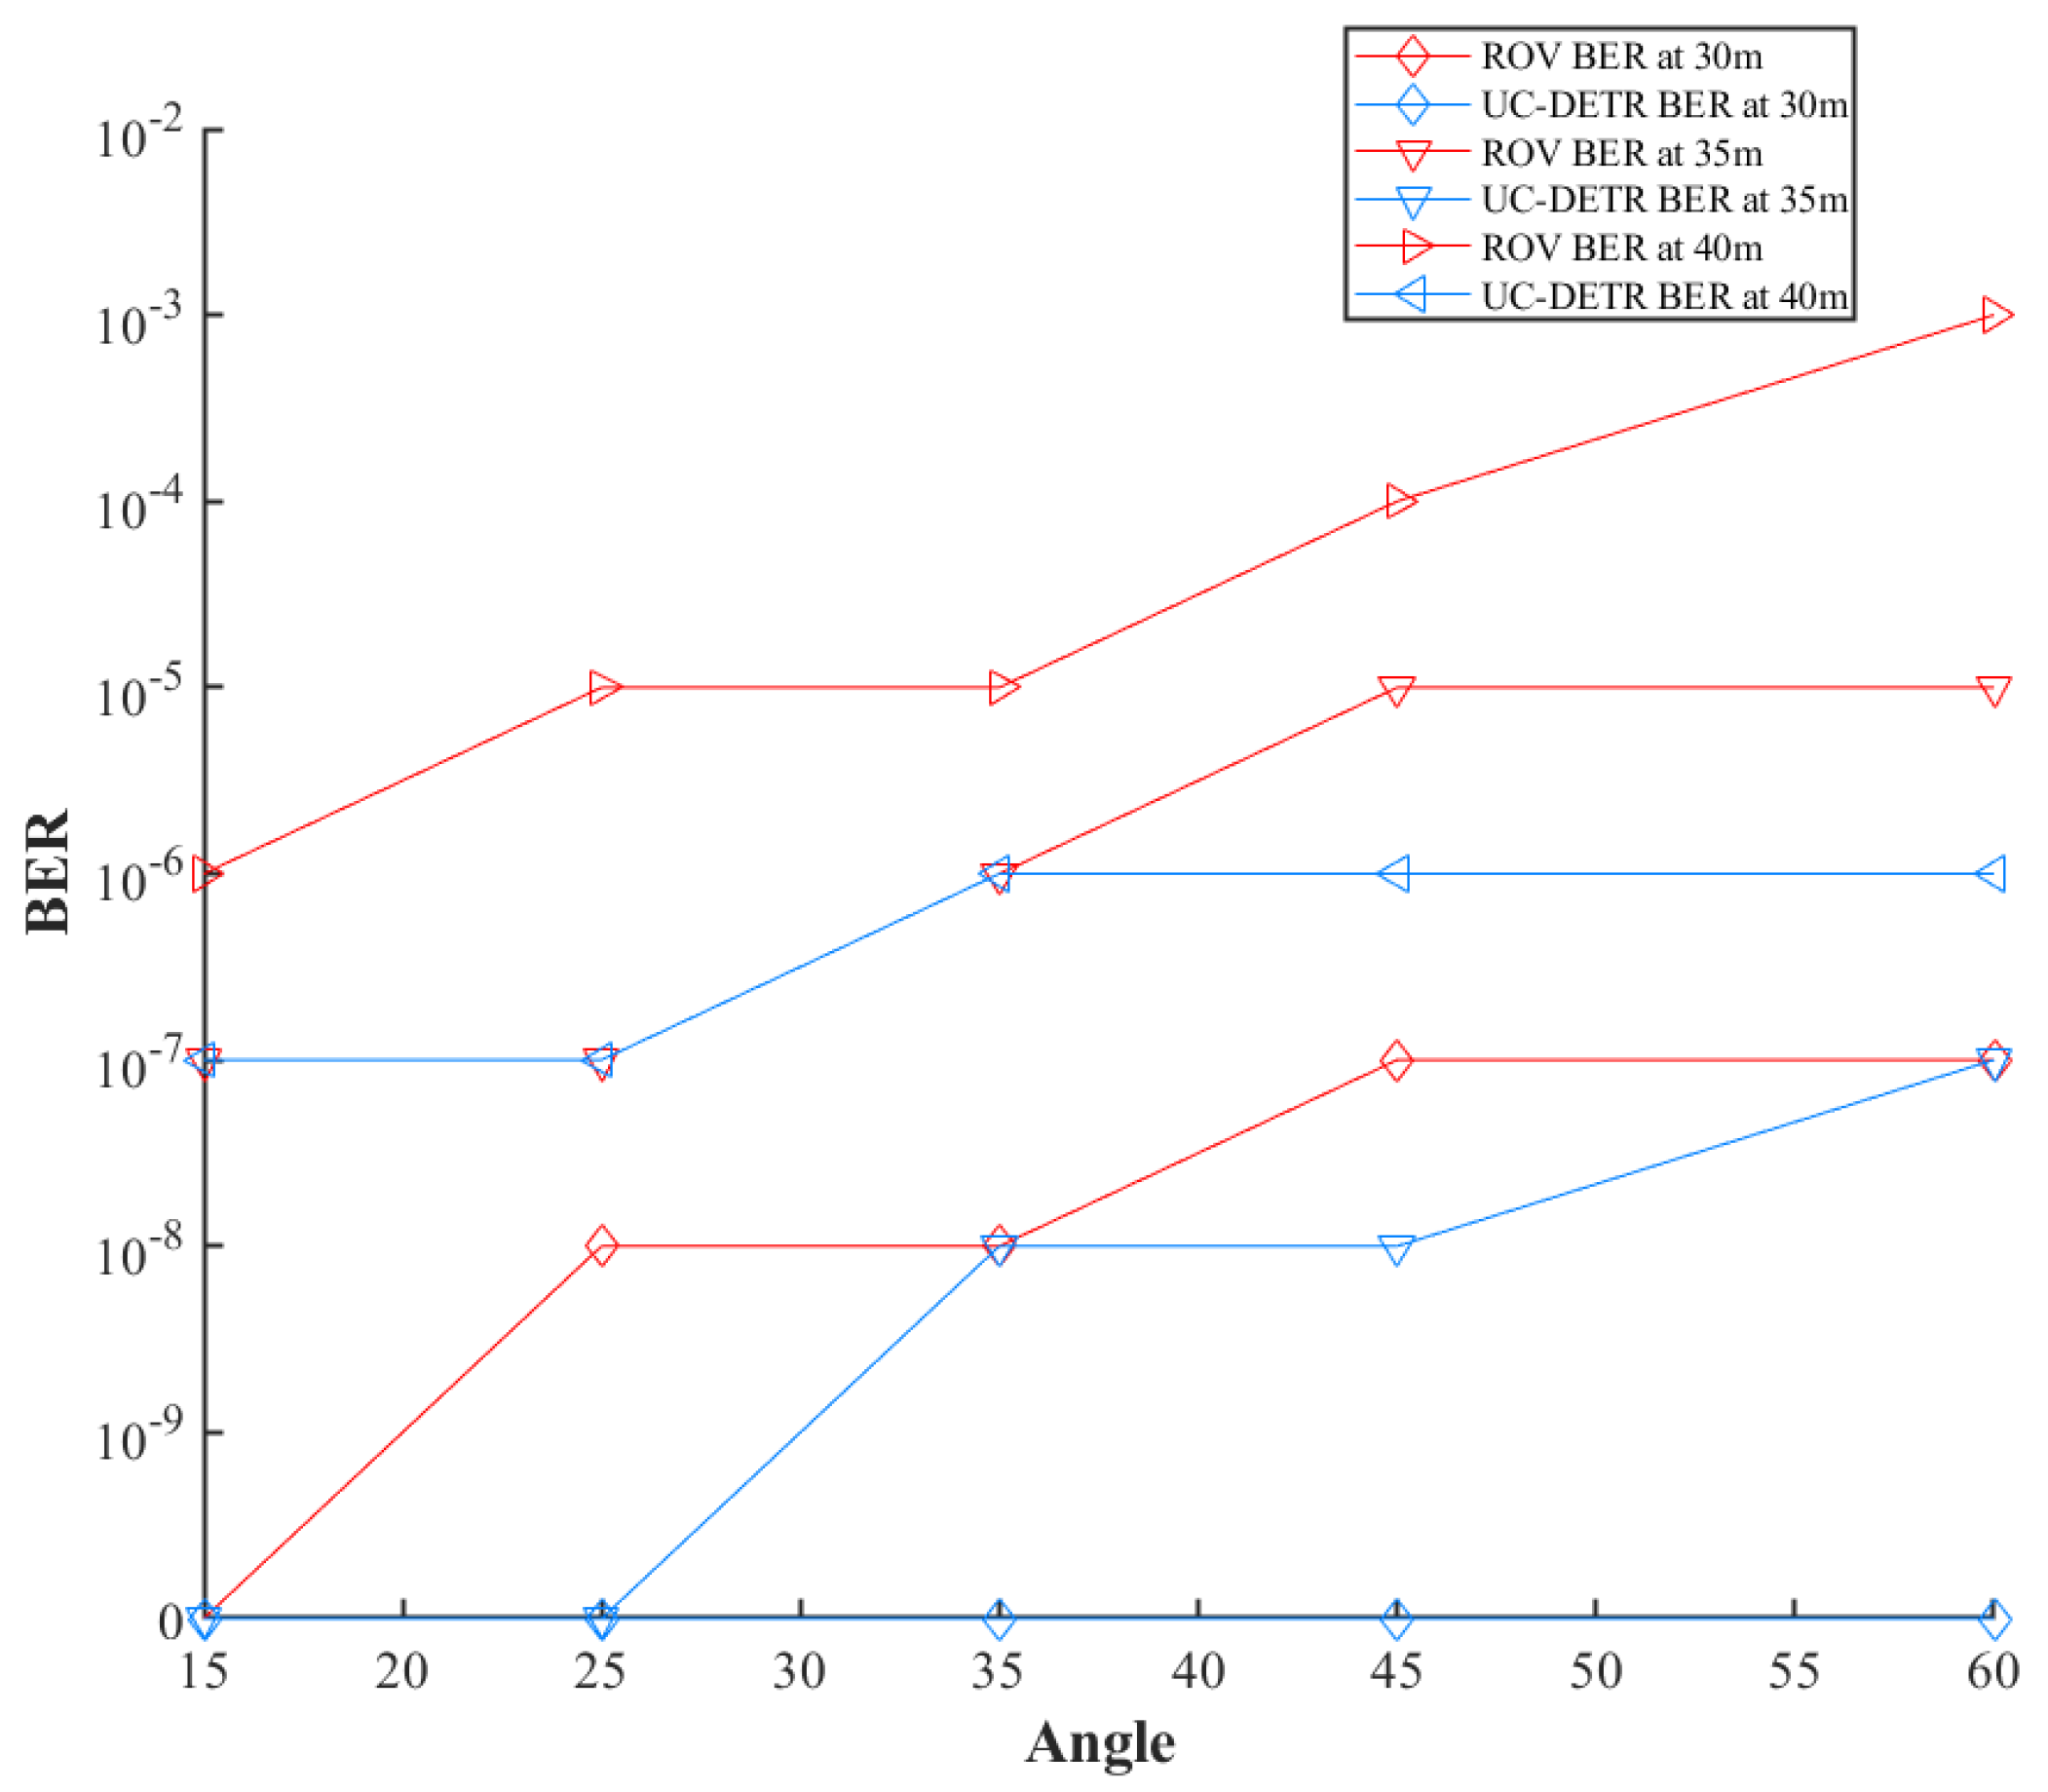
To evaluate the performance of the proposed UWOC system, we have calibrated five communication distances and five dual-end offset angles, and then we have conducted communication BER experiments with auxiliary alignment. After measuring the BER of real-time data transmission between both ends with stabilized ROV-based UWOC equipment, we have calculated the average BER. The comparison results of the BER experiments are shown in Figure 10.
Because the BER remained zero for all transmission distances less than 30 m, this interval is omitted from Figure 10. The UWOC system equipped with UC-DETR maintained a zero-error rate at 30 m, while the ROV-based UWOC system exhibited an error rate of the order of 10 8 at the same distance. This disparity became more pronounced between 35 and 40 m: the ROV-based UWOC system’s error rate rose to 10 6 10 3 , whereas the UC-DETR system stabilized at the 10 7 10 6 level. Experimental results from different angles demonstrate that the BER fluctuation of the UC-DETR system is significantly smaller than that of the ROV-based UWOC system, indicating superior robustness and stability. Compared with the ROV-based UWOC systems in references [23,24] which lacks auxiliary alignment, our proposed UWOC system exhibits higher tolerance for lateral offset, making it feasible for practical light source tracking. Under long-distance and complex-angle conditions, this system significantly reduces BER while ensuring stable alignment accuracy. Its performance advantages stem from the effective integration of deep learning and UWOC, enabling precise compensation for interference and deviations during alignment processes, thereby substantially enhancing the system’s automation and practicality.

4. Conclusions

This study proposes an efficient underwater optical communication alignment system based on the RT-DETRv2 model, achieving coordinated improvements in light source alignment accuracy and communication quality. In standard pool experiments, the enhanced system achieved zero BER across a 30 m communication range with a 0–60° offset, demonstrating two orders of magnitude better error performance compared to traditional ROV-based UWOC system. When extending the communication distance to 40 m, the system maintained BER at the 10 6 level, outperforming ROV-based UWOC system by three orders of magnitude and showcasing adaptability to complex scenarios. Future work will proceed on the current basis along three tracks. On the hardware side, we will increase motor speed and camera resolution and combine LD and LED light sources with high-sensitivity detectors to enhance dynamic tracking and alignment robustness; under long-range, low-SNR conditions, we will conduct dedicated training on light-spot characteristics and quantify the impact of hardware factors on BER and link bandwidth. On the methods and deployment side, while retaining the Next-ViT backbone, we will introduce stronger global-modeling and deformation-suppression mechanisms and employ inference and quantization tools to determine accuracy–latency trade-offs via reproducible experiments.

Author Contributions

Conceptualization, H.L. (Hexi Liang) and Y.A.; methodology, H.L. (Hexi Liang), H.L. (Hang Li), M.W. and Y.A.; software, H.L. (Hang Li), M.W. and J.Z.; validation, J.Z. and W.N.; formal analysis, M.W. and J.Z.; investigation, H.L. (Hang Li), W.N. and B.H.; resources, H.L. (Hexi Liang), B.H. and Y.A.; data curation, B.H.; writing—original draft preparation, H.L. (Hang Li); writing—review and editing, H.L. (Hexi Liang), H.L. (Hang Li) and M.W.; visualization, M.W. and J.Z.; supervision, Y.A.; project administration, Y.A.; funding acquisition, H.L. (Hexi Liang) and B.H. All authors have read and agreed to the published version of the manuscript.

Funding

This research was funded by the Hubei Provincial Natural Science Foundation Joint Fund (China), grant number 2022CFD045, and by the Key R&D Program of the Hubei Provincial Department of Science and Technology (China), grant number 2021BAB099.

Data Availability Statement

The data that support the findings of this study are available from the corresponding author upon reasonable request.

Acknowledgments

The authors thank Wuhan Liubo Photoelectric Technology Company Limited for providing communication hardware equipment and technical support and gratefully acknowledge Y.A. for constructive discussions on optical component selection and experimental safety.

Conflicts of Interest

Author Yong Ai was employed by the company Wuhan Liubo Photoelectric Technology Co., Ltd. The remaining authors declare that the research was conducted in the absence of any commercial or financial relationships that could be construed as a potential conflict of interest.

References

  1. Zeng, Z.; Fu, S.; Zhang, H.; Dong, Y.; Cheng, J. A Survey of Underwater Optical Wireless Communications. IEEE Commun. Surv. Tutor. 2017, 19, 204–238. [Google Scholar] [CrossRef]
  2. Gabriel, C.; Khalighi, M.-A.; Bourennane, S.; Léon, P.; Rigaud, V. Monte-Carlo-Based Channel Characterization for Underwater Optical Communication Systems. J. Opt. Commun. Netw. 2013, 5, 1–12. [Google Scholar] [CrossRef]
  3. Lv, Z.; He, G.; Yang, H.; Chen, R.; Li, Y.; Zhang, W.; Qiu, C.; Liu, Z. The Investigation of Underwater Wireless Optical Communication Links Using the Total Reflection at the Air–Water Interface in the Presence of Waves. Photonics 2022, 9, 525. [Google Scholar] [CrossRef]
  4. Cui, N.; Liu, Y.; Chen, X.; Wang, Y. Active Disturbance Rejection Controller of Fine Tracking System for Free Space Optical Communication. Proc. SPIE 2013, 8906, 890613. [Google Scholar]
  5. Ji, X.; Yin, H.; Jing, L.; Liang, Y.; Wang, J. Analysis of Aperture Averaging Effect and Communication System Performance of Wireless Optical Channels with Weak to Strong Turbulence in Natural Turbid Water. SSRN Electron. J. 2022. [Google Scholar] [CrossRef]
  6. Palitharathna, K.W.S.; Suraweera, H.A.; Godaliyadda, R.I.; Herath, V.R.; Thompson, J.S. Average Rate Analysis of Cooperative NOMA Aided Underwater Optical Wireless Systems. IEEE Open J. Commun. Soc. 2021, 2, 2292–2310. [Google Scholar] [CrossRef]
  7. Elamassie, M.; Al-Nahhal, M.; Kizilirmak, R.C.; Uysal, M. Transmit Laser Selection for Underwater Visible Light Communication Systems. In Proceedings of the 2019 IEEE 30th Annual International Symposium on Personal, Indoor and Mobile Radio Communications (PIMRC), Istanbul, Turkey, 8–11 September 2019; pp. 1–6. [Google Scholar]
  8. Yousif, B.B.; Elsayed, E.E.; Alzalabani, M.M. Atmospheric Turbulence Mitigation Using Spatial Mode Multiplexing and Modified Pulse Position Modulation in Hybrid RF/FSO Orbital-Angular-Momentum Multiplexed Based on MIMO Wireless Communications System. Opt. Commun. 2019, 436, 197–208. [Google Scholar] [CrossRef]
  9. Zhang, D.; N’Doye, I.; Ballal, T.; Al-Naffouri, T.Y.; Alouini, M.-S.; Laleg-Kirati, T.-M. Localization and Tracking Control Using Hybrid Acoustic–Optical Communication for Autonomous Underwater Vehicles. IEEE Internet Things J. 2020, 7, 10048–10060. [Google Scholar] [CrossRef]
  10. Zhao, M.; Li, X.; Chen, X.; Tong, Z.; Lyu, W.; Zhang, Z.; Xu, J. Long-Reach Underwater Wireless Optical Communication with Relaxed Link Alignment Enabled by Optical Combination and Arrayed Sensitive Receivers. Opt. Express 2020, 28, 34450–34460. [Google Scholar] [CrossRef] [PubMed]
  11. Zheng, Z.; Yin, H.; Wang, J.; Jing, L. A Laser Spot Tracking Algorithm for Underwater Wireless Optical Communication Based on Image Processing. In Proceedings of the 2021 13th International Conference on Communication Software and Networks (ICCSN), Chongqing, China, 4–7 June 2021; pp. 192–198. [Google Scholar]
  12. Li, Y.; Sun, K.; Han, Z.; Lang, J.; Liang, J.; Wang, Z.; Xu, J. Deep Learning-Based Docking Scheme for Autonomous Underwater Vehicles with an Omnidirectional Rotating Optical Beacon. Drones 2024, 8, 697. [Google Scholar] [CrossRef]
  13. Wang, A.; Chen, H.; Liu, L.; Chen, K.; Lin, Z.; Han, J.; Ding, G. YOLOv10: Real-Time End-to-End Object Detection. Adv. Neural Inf. Process. Syst. 2024, 37, 107984–108011. [Google Scholar]
  14. Zhao, Y.; Lv, W.; Xu, S.; Wei, J.; Wang, G.; Dang, Q.; Liu, Y.; Chen, J. DETRs Beat YOLOs on Real-Time Object Detection. In Proceedings of the 2024 IEEE/CVF Conference on Computer Vision and Pattern Recognition (CVPR), Seattle, WA, USA, 16–22 June 2024; pp. 16965–16974. [Google Scholar]
  15. Jia, B.; Ge, W.; Cheng, J.; Du, Z.; Wang, R.; Song, G.; Zhang, Y.; Cai, C.; Qin, S.; Xu, J. Deep Learning–Based Cascaded Light Source Detection for Link Alignment in Underwater Wireless Optical Communication. IEEE Photonics J. 2024, 16, 7801512. [Google Scholar]
  16. Kong, M.; Pan, Y.; Zhou, H.; Yu, R.; Le, X.; Yuan, H.; Wang, R.; Yang, Q. Deep Learning-Based Acquisition Pointing and Tracking for Underwater Wireless Optical Communication. IEEE Photonics Technol. Lett. 2025, 37, 555–558. [Google Scholar] [CrossRef]
  17. Lv, W.; Zhao, Y.; Chang, Q.; Huang, K.; Wang, G.; Liu, Y. RT-DETRv2: Improved Baseline with Bag-of-Freebies for Real-Time Detection Transformer. arXiv 2024, arXiv:2407.17140. [Google Scholar]
  18. Li, J.; Xia, X.; Li, W.; Li, H.; Wang, X.; Xiao, X.; Rao, R.; Wang, M.; Pan, X. Next-ViT: Next Generation Vision Transformer for Efficient Deployment in Realistic Industrial Scenarios. arXiv 2022, arXiv:2207.05501. [Google Scholar]
  19. He, K.; Zhang, X.; Ren, S.; Sun, J. Deep Residual Learning for Image Recognition. In Proceedings of the 2016 IEEE Conference on Computer Vision and Pattern Recognition (CVPR), Las Vegas, NV, USA, 27–30 June 2016; pp. 770–778. [Google Scholar]
  20. Zhang, X.; Song, Y.; Song, T.; Yang, D.; Ye, Y.; Zhou, J.; Zhang, L. LDConv: Linear Deformable Convolution for Improving Convolutional Neural Networks. Image Vis. Comput. 2024, 149, 105190. [Google Scholar] [CrossRef]
  21. Zhang, M.; Zhou, H. Real-Time Underwater Wireless Optical Communication System Based on LEDs and Estimation of Maximum Communication Distance. Sensors 2023, 23, 7649. [Google Scholar] [CrossRef]
  22. Duntley, S.Q. Light in the Sea. J. Opt. Soc. Am. 1963, 53, 214–233. [Google Scholar] [CrossRef]
  23. Shen, T.; Guo, J.; Liang, H.; Li, Y.; Li, K.; Dai, Y.; Ai, Y. Research on a Blue–Green LED Communication System Based on an Underwater Mobile Robot. Photonics 2023, 10, 1238. [Google Scholar] [CrossRef]
  24. He, J.; Li, J.; Zhu, X.; Xiong, S.; Chen, F. Design and Analysis of an Optical–Acoustic Cooperative Communication System for an Underwater Remote-Operated Vehicle. Appl. Sci. 2022, 12, 5533. [Google Scholar] [CrossRef]
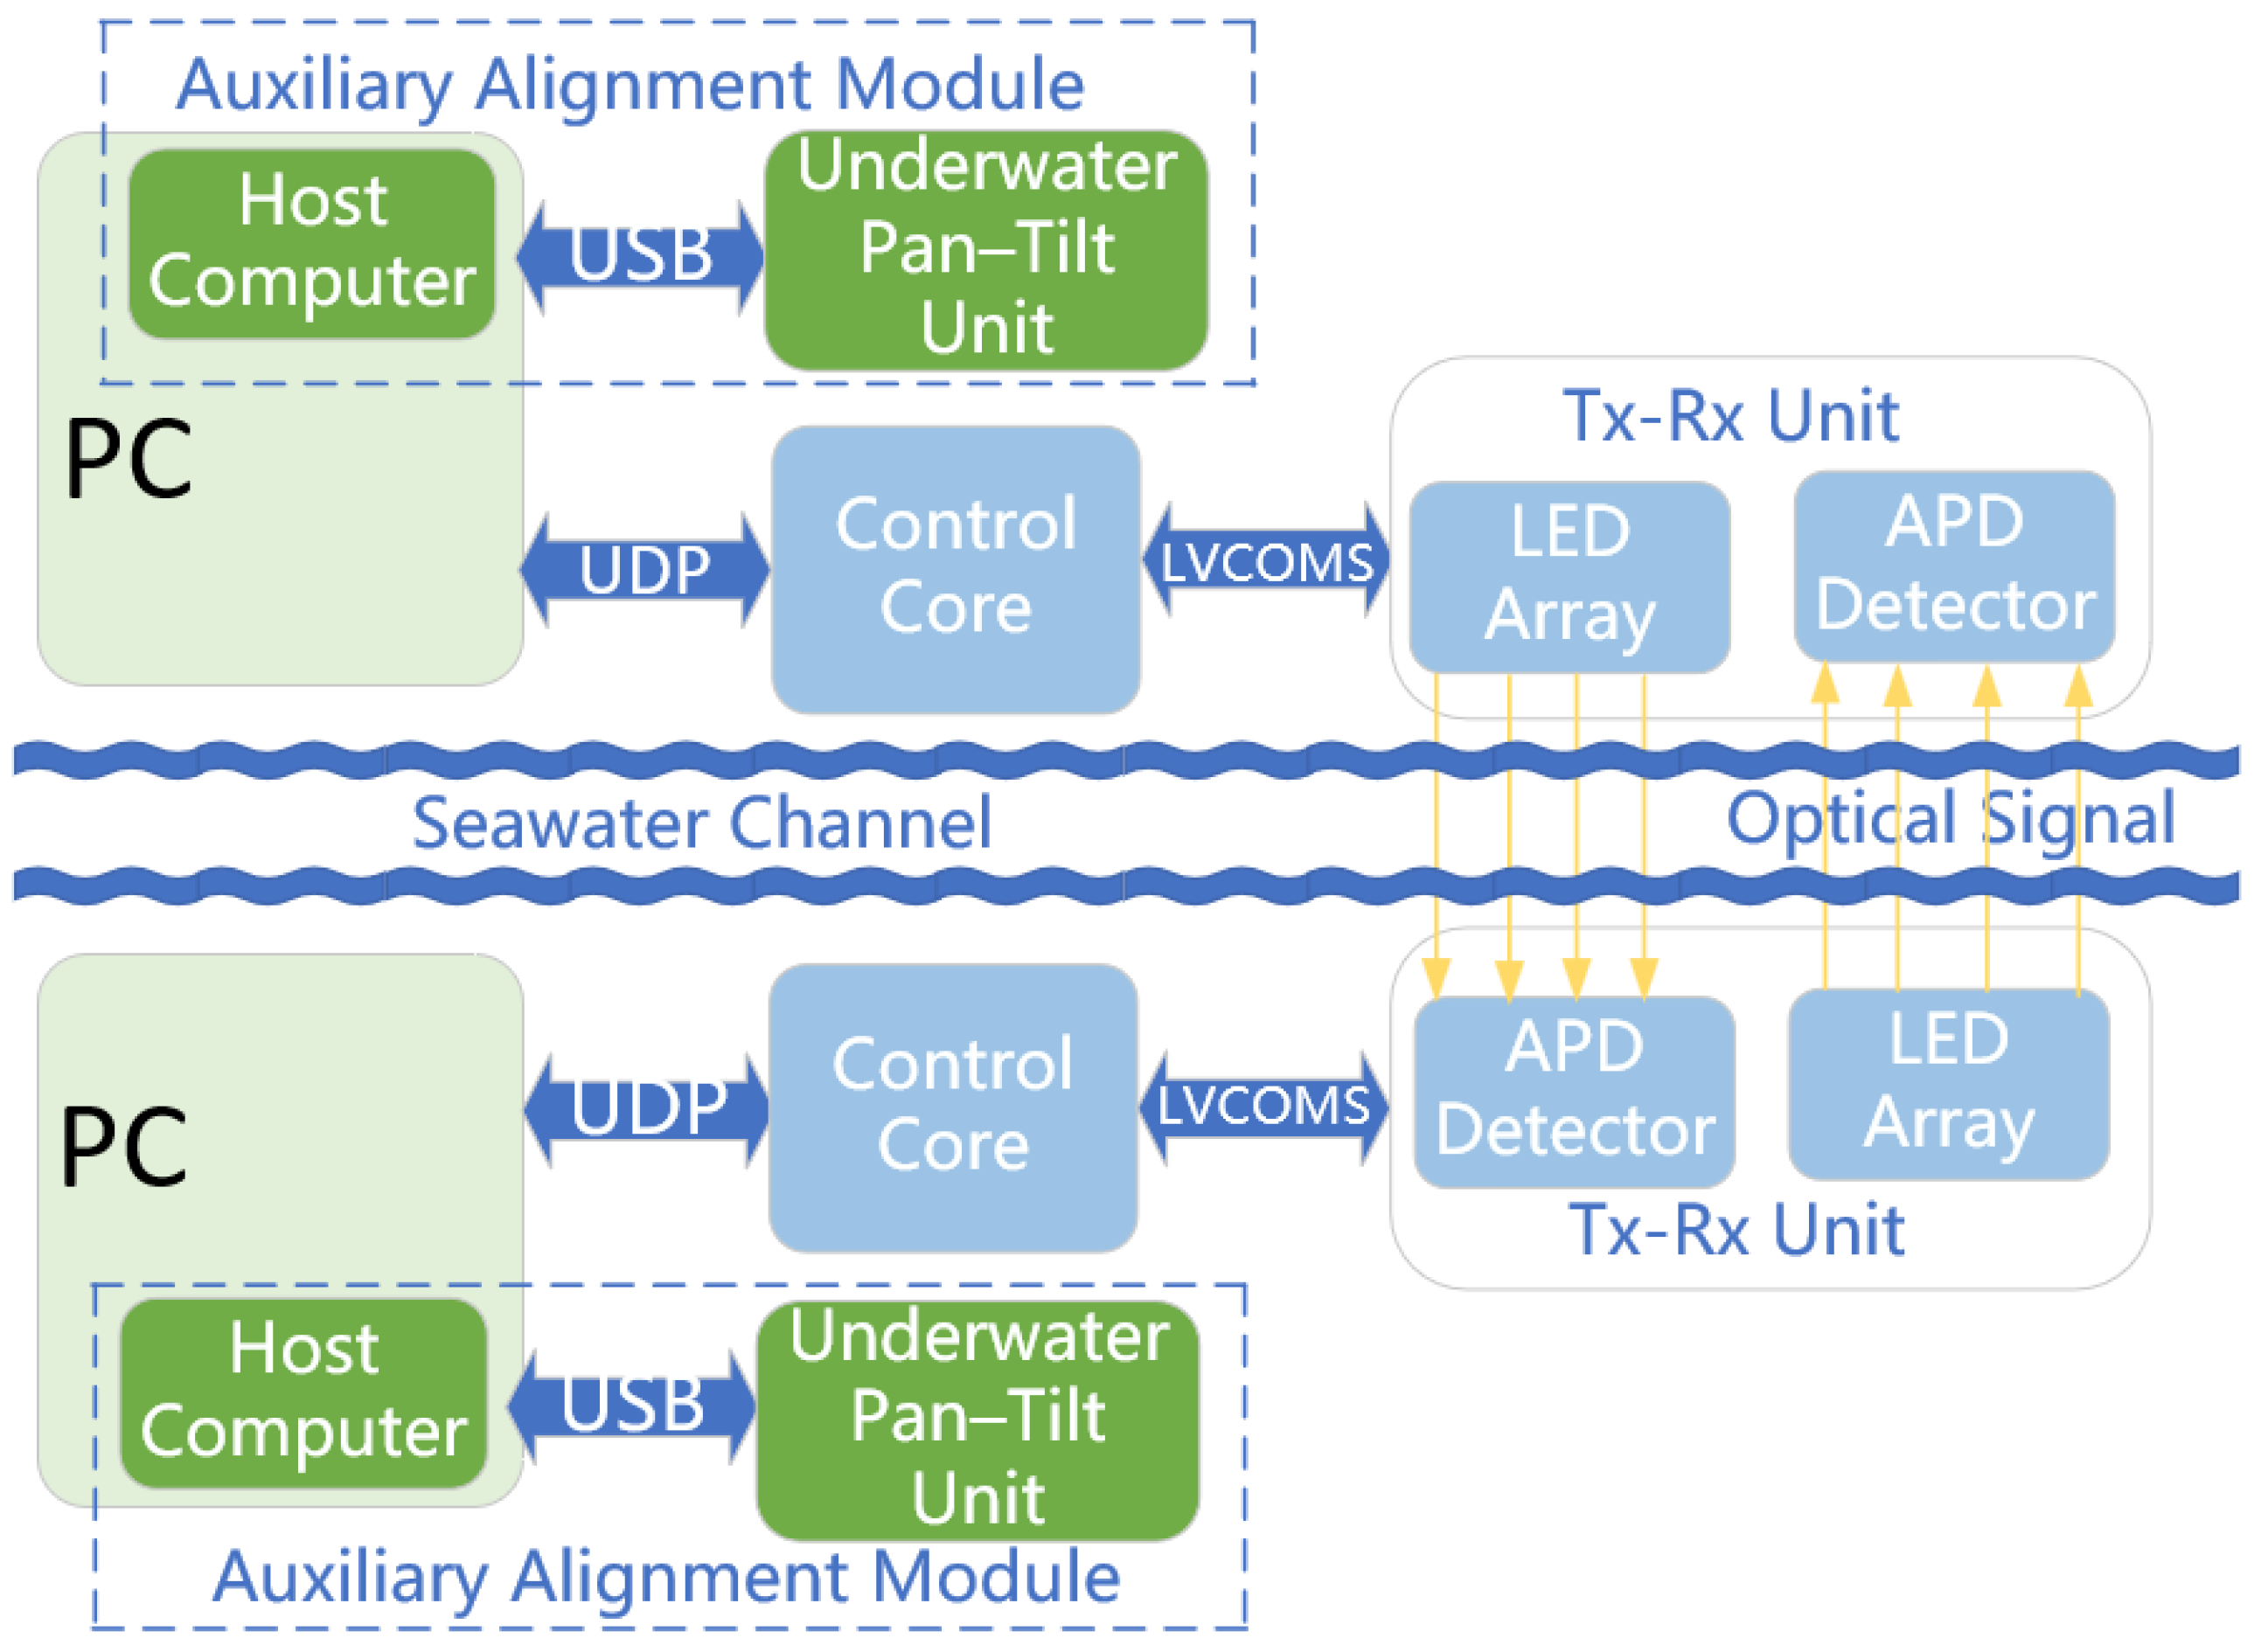
Figure 1. Block diagram of the underwater optical communication system.
Photonics 12 00991 g001
Figure 2. UC-DETR network structure diagram.
Photonics 12 00991 g002
Figure 3. LED circuit design diagram.
Photonics 12 00991 g003
Figure 4. Design diagram of the APD receiving module circuit.
Photonics 12 00991 g004
Figure 5. Comparison of model performance.
Photonics 12 00991 g005
Figure 6. Comparison of the ablation experiments diagram.
Photonics 12 00991 g006
Figure 7. Underwater experimental scene diagram.
Photonics 12 00991 g007
Figure 8. Light sources alignment experiments: (a) UC-DETR light source alignment experiment. (b) ROV light source alignment experiment.
Photonics 12 00991 g008
Figure 9. Real time blue–green light source detection diagram.
Photonics 12 00991 g009
Figure 10. Comparison experiment result diagram.
Photonics 12 00991 g010
Table 1. Comparison of experimental results.
ModelParamsGFLOPsLatencymAPAP50
YOLOv8-S11.2 M28.67.07 ms62.881.5
YOLOv8-M25.9 M78.99.50 ms64.284.7
YOLOv8-L43.7 M165.212.39 ms65.985.7
YOLOv10-S7.2 M21.62.49 ms59.980.1
YOLOv10-B19.1 M92.04.74 ms63.383.6
YOLOv10-L24.4 M120.37.28 ms65.184.9
YOLO11-S9.4 M21.52.46 ms63.382.3
YOLO11-M20.1 M68.04.70 ms66.685.4
YOLO11-L25.3 M86.96.16 ms67.286.1
RT-DETRv2-S20.0 M60.04.58 ms64.782.3
RT-DETRv2-M31.0 M92.09.20 ms65.284.7
RT-DETRv2-L42.0 M136.013.71 ms66.387.4
UC-DETR25.3 M72.74.98 ms81.197.4
Table 2. Results of the UC-DETR ablation experiment.
ModelBackboneChannelsConvParams (M)GFLOPsLatency (ms)mAPAP50
UC-DETRResNet18[64, 128, 256, 512]LDCConv20.360.44.6765.884.7
UC-DETRResNet50[256, 512, 1024, 2048]LDCConv31.492.59.3966.587.2
UC-DETRNext-ViT[96, 192, 384, 768]Conv2D25.073.24.7179.895.9
UC-DETRNext-ViT[96, 192, 384, 768]LDCConv25.372.74.9881.197.4
Table 3. Motor parameter table.
Parameter of Electric MachineParameter Values
Horizontal rotation Angle ± 180
Pitch angle ± 90
spin velocity 1 . 0 / s 32 . 4 / s
Torque of rotation 13.2 N · m
operating temperature range−10 °C–40 °C
Disclaimer/Publisher’s Note: The statements, opinions and data contained in all publications are solely those of the individual author(s) and contributor(s) and not of MDPI and/or the editor(s). MDPI and/or the editor(s) disclaim responsibility for any injury to people or property resulting from any ideas, methods, instructions or products referred to in the content.