Abstract
Optical transmission gratings with quasi-sinusoidal surface-relief profiles were inscribed in IOG and Pyrex glasses and in Bi12GeO20, Er: LiNbO3, and Er: Fe: LiNbO3 crystals by microbeams of carbon, nitrogen, and oxygen ions at ion energies of 5, 6, and 10.5 MeV. Grating constants were 4, 8, and 16 μm. Amplitudes of the surface-relief gratings were in the 10–2000 nm range. The diffraction efficiency of the gratings was measured at a wavelength of 640 nm. Maximum diffraction efficiencies were close to the theoretical maximum of 33% for thin gratings. Grating profiles were measured by optical microscopic profilometry. Measurement of the diffraction efficiencies at higher orders and Fourier analysis of the grating profiles revealed the dependence of the residual nonlinearity of the grating profiles on the implanted ion fluence. The ion microbeam-written gratings can be used as light coupling elements in integrated optics for sensors and telecommunication.
1. Introduction
Optical gratings diffract an incident light beam into several beams propagating in various directions that make various angles with the normal of the grating. When illuminated with white light, the diffracted beams become colorful due to the dispersive property of the gratings. Optical gratings can work both in transmission and reflection. There is a periodic modulation of the index of refraction or of the grating surface or both (mixed gratings).
Naturally occurring diffraction gratings were reported and described by scientists in the 17th century [1,2].
The first known artificial diffraction grating was prepared by David Rittenhouse in 1785. That grating consisted of 50 hairs extended between two fine thread screws. It was a rather coarse grating, with four-line pairs per mm (lp/mm) [3]. The first notable scientific application of diffraction gratings was due to Joseph von Fraunhofer. He discovered a large number of dark (absorption) lines in the emission spectrum of the Sun [4].
Important pioneers of the development of modern optical gratings were Friedrich Adolph Nobert and William B. Rogers [5], and also Henry Augustus Rowland [6].
As for the fabrication of diffraction gratings, the first methods were based on high-precision mechanical ruling machines. Modern gratings are fabricated by various microelectronic techniques, holography [7], direct laser writing [8], laser ablation [9], dry etching pattern transfer from photoresist surface reliefs [10], electron- [11] and ion beam techniques [12].
Holographic recording, in principle, can produce optical gratings of perfect sinusoidal profiles. However, the transformation of the sinusoidal interference pattern into the spatial modulation of the absorption, index of refraction, or surface height of the recording material is never perfect, due to the nonlinear response of the recording material [13,14].
Fourier analysis is the par excellence tool for the study of spatially (or temporally) periodic structures. Magnusson and Gaylord developed a method for the analysis of multiwave diffraction in thick gratings of arbitrary profiles. They used the Fourier expansion of the square and sawtooth grating profiles in their model [15]. Taunaumang and co-authors recorded holographic mixed amplitude and phase gratings in a thin film of Disperse Red 1 thin film [16]. They took microscopic photos of the absorption holographic grating during hologram build-up, and performed Fourier analysis of the grating profiles. The highest exposures resulted in the appearance of three Fourier components instead of the single component obtained at low exposure (at the beginning of the recording). Mello et al. developed a theoretical numerical model for the holographic recording of surface-relief grating in photoresist [17]. The model predicted highly nonlinear grating profiles, depending on the parameters of the processing of the exposed photoresist. Bányász performed a thorough analysis of phase holograms in a silver halide recording material [18]. He recorded a large number of plane wave holograms in the full range of useful bias exposures and at various fringe visibilities (recording beam ratios). Phase contrast microscopic images of each grating were taken, and grating profiles were Fourier analyzed. Amplitudes of the first-, second-, and third-order modulations of the refractive index across the gratings as a function of bias exposure and fringe visibility were determined. De Gans et al., in a systematic experimental study, optimized the fabrication of photo-embossed surface-relief gratings in a polymer [19]. They measured the grating profiles by an atomic force microscope (AFM). They concluded that, depending on the grating period and processing, grating height increased linearly with increasing exposure before reaching a maximum, and then decreased. Johansen et al. studied gratings and other photonic structures occurring in nature, also using Fourier analysis [20]. Fourier analysis of natural photonic structures revealed a certain degree of disorder in them. The disorder provided control of some properties of the structures, such as color and angular selectivity. Rekola et al. used digital holographic microscopy for the real-time observation of surface-relief grating formation by holographic recording on azobenzene-containing strongly polarization-sensitive polymer films [21]. The aim of their research was to produce true-color diffractive pixels by multi-exposure surface-relief gratings. They used Fourier synthesis to obtain the desired grating profiles.
Recording of surface-relief gratings of quasi-sinusoidal profiles in optical glasses and crystals by microbeams of nitrogen, oxygen, and carbon ions was recently proposed and demonstrated by Bányász and co-workers [22,23]. Quasi-sinusoidal grating profiles were obtained in both works by adequate modulation of the fluence of the implanted ions across the grating periods. The microscale mechanism of the grating formation by direct writing with an ion microbeam was also outlined in those articles [22,23]. Although the greatest part of those surface-relief gratings could be fitted quite well with sine curves, a varying degree of nonlinearity could be observed. Besides the two first-order diffracted beams, corresponding to a perfectly sinusoidal grating, higher-order diffracted beams, up to the fourth order, could be observed. Moreover, when first-order diffraction efficiencies of the ion microbeam-written gratings were calculated from the measured grating amplitudes, using the Raman–Nath equation [24], they were always slightly higher than the measured ones. That difference could be attributed to the presence of higher harmonics in the grating profiles. The aim of the present work was to determine the amplitudes of the higher harmonics of the grating profiles using Fourier analysis. Fourier analysis was introduced to add a substantial improvement to the design of the quasi-sinusoidal gratings. Then correct values of the diffraction efficiencies of the various orders could be calculated. Thus, the efficacy of the proposed fabrication method with various combinations of implanted ions and target materials could be determined, as well as the useful ion energies and optimum ranges of the implanted fluence.
2. Materials and Methods
2.1. Design and Fabrication of the Gratings
The method proposed for the fabrication of surface-relief gratings of quasi-sinusoidal and blazed profiles, using microbeams of high-energy medium-mass ions, was published recently in two articles [22,23]. The method is briefly summarized here. Based on previous research by the authors of the present article on the fabrication of channel waveguides in optical glasses and crystals, both through a special silica mask [25], and using ion microbeams [26], it was found that—besides the intended refractive index modulation below the sample’s surface—a ridge over the implanted channel was also created. The height of the ridge was found to be proportional to the implanted ion fluence. The proposed method was based on the quasi-sinusoidal modulation of the implanted ion fluence across the grating lines. An example of grating design is shown in Figure 1 [22].
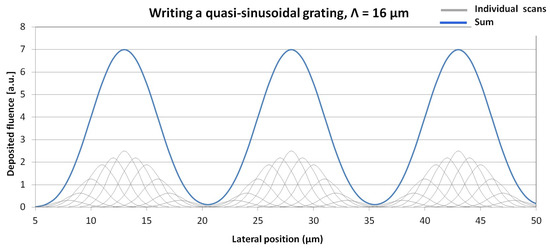
Figure 1.
Total deposited fluence along a sinusoidal grating with a grating constant of 16 μm. The profile of the ion microbeam was approximated by Gaussian with a FWHM of 3 μm. Fluence distributions of the individual scans are represented by gray lines. Individual scans were separated by 1 μm. Sum of the deposited fluence distributions of the individual scans is represented by the blue line. This figure was originally published in [22].
A large number of transmission surface-relief gratings of quasi-sinusoidal profiles were fabricated in optical glasses and crystals, using microbeams of carbon, nitrogen, and oxygen ions. All the implantations were performed at the Tandetron laboratory of the UJF research institute in Řež, Czech Republic. The following target materials were used: IOG phosphate glass, Pyrex glass, Sillenite-type bismuth germanate crystal (Bi12GeO20), and Er: LiNbO3 and Er: Fe: LiNbO3 crystals. The experimental conditions of the grating fabrication are presented in Table 1, taken from publications [22,23], with some grating groups added. The very high current density did not cause damage to the samples, because the ion microbeam was magnetically scanned over the sample at a speed of a few hundred micrometers per second. The lateral resolution of the microbeam writing of optical gratings was limited by the microbeam size. The lowest microbeam size was around 2 µm, so the grating constant of the finest grating was 4 µm (See Table 1).

Table 1.
Parameters of the ion microbeam-implanted sinusoidal gratings.
2.2. Microscopic Study of the Gratings
First information on the ion microbeam-implanted gratings was obtained by optical microscopy. A Zeiss Peraval transmission microscope was used both in interference and interference phase contrast (INTERPHAKO) modes. The former technique visualizes the variations in the full optical path across the sample in the form of deformations of an equidistant interference fringe system. The latter mode transforms the variations in the full optical path into interference colors. An example of a pair of interference and INTERPHAKO microscopic images can be seen in Figure 2.
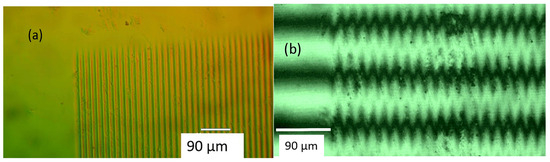
Figure 2.
(a) INTERPHAKO and (b) interference microscopic image of grating GF2 implanted in Pyrex glass. Implanted ion: 6 MeV O4+, fluence: 8.4 × 10¹⁵ ion/cm2, grating constant: 16 μm.
2.3. Microprofilometric Study of the Gratings
Surface topography (optical profilometry) of the gratings was performed by two high-resolution devices, Sensofar PLU-2300 [27] and Zygo NewView 7100 [28].
2.4. Fourier Analysis of the Grating Profiles
To reveal the nonlinearities of the ion-implanted gratings, the free Gwyddion program [29] was used to perform a two-dimensional Fourier transform (2-D FT) of the topography of the gratings. The modulus of the 2-D Fourier transform (FT) was calculated. Then relative amplitudes of the harmonics of the grating profile were determined by the analysis of the one-dimensional distribution of the modulus of the FT along the direction of the grating constant. The procedure is shown in Figure 3a–d.
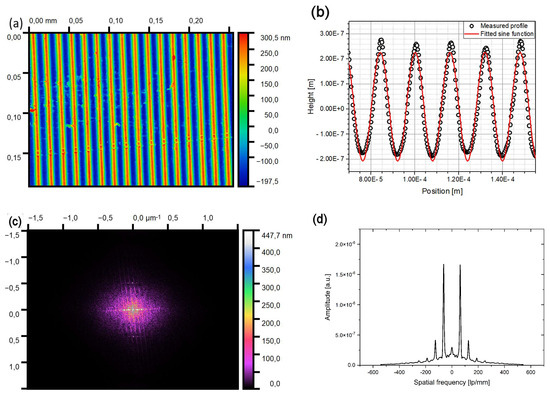
Figure 3.
(a) Surface topography of grating GH (measured by Sensofar). (b) Measured profile of grating GH along a line, perpendicular to the grating lines (black circles), and a sine curve fitted to the experimental data. (c) Modulus of the 2-D Fourier transform of the surface topography. Note the peaks along the horizontal axis of the ellipsis. They correspond to the harmonics of the grating profile. (d) Line profile along the horizontal axis of the Fourier transform. Peaks corresponding to the ±1st–4th harmonics can be seen clearly.
Let us assume that all the harmonics of the grating are in phase. Then the total amplitude of the grating profile, A0, is the sum of the amplitudes of the individual harmonics, A1…An:
A0 can be determined by fitting a sine function to the measured surface-relief profiles of the gratings. Actually, grating profiles were approximated by sine functions in our two previous publications [22,23].
Let us denote the average of the heights of the ±ith peaks in the spatial frequency spectrum by Pi. Then the amplitude of the ith harmonics in the physical space (not in the Fourier space) can be calculated in the following way:
In general, the highest detectable orders both in the Fourier spectra and in the diffraction efficiency measurements were of n = 4.
The assumption that harmonics of the ion microbeam-implanted gratings are in phase is based on symmetry considerations. In principle, the sinusoidal lateral profile of the fluence of the implanted ions and the lateral homogeneity of the interaction of the ions with the sample should ensure these conditions. Fourier analysis of some one-dimensional grating profiles (like the one in Figure 3b) proved that the phase difference between the first and second harmonics was around 5 mrad.
2.5. Measurement of the Diffraction Efficiencies
Diffraction efficiency of the ion microbeam-implanted optical gratings was measured by a setup described in detail in our previous publications [22,23].
First experiments were performed by a TECBL-10GC-405 semiconductor laser from World Star Technologies, working at a wavelength of 405 nm. Then it was necessary to change to another wavelength, because the Bi12GeO20 crystal has a high absorption and scattering at 405 nm. Results presented in this article were obtained using an SM600 Fabry-Perot pigtailed semiconductor laser from Thorlabs, working at 640 nm, connected to a fiber optics collimator to obtain a free-space beam.
Ion beam-implanted gratings were generally 500 µm × 500 µm, and in some cases 1 mm × 1 mm in lateral dimensions. An illuminating laser beam passed through an aperture with a diameter of 500 µm to ensure that no laser light bypassed the gratings.
2.6. Calculation of the Diffraction Efficiencies
Diffraction efficiency of thin sinusoidal gratings is given by the Raman–Nath equation [24,30]:
where λ is the wavelength, d is the peak-to-peak amplitude of the grating, ηm is the diffraction efficiency in the m-th order, Jm is the m-order Bessel function, and Δn is the maximum difference of refractive index in the grating. For surface-relief gratings,
ηm = Jm 2 (π Δnd/λ)
Δn = ngrating − nair.
However, the nonlinearity of the profile of the diffraction grating should also be taken into account. So, the 1st-order diffraction efficiency of the grating becomes:
where A1 is given by Equation (2) with i = 1.
Higher-harmonic gratings do not contribute to the first-order diffraction efficiency.
As for the higher-order diffraction efficiencies, the situation is more complicated. The direction of the first-order diffracted wave from the 2nd harmonic grating (of a grating constant of Λ/2) coincides with that of the second-order diffracted wave of the base (first-order) grating of grating constant of Λ. Then the direction of the first-order diffracted wave from the 3rd harmonic grating (of a grating constant of Λ/3) coincides with that of the third-order diffracted wave of the base grating of grating constant of Λ. Finally, the direction of the first-order diffracted wave from the 4th harmonic grating (of a grating constant of Λ/4) coincides with that of the fourth-order diffracted wave of the base grating of grating constant of Λ.
In a first approximation, contributions to the higher-order diffraction efficiencies from the base grating are omitted.
So, one obtains for the higher-order diffraction efficiencies:
For i = 2, 3, 4, where Ai is given by Equation (2).
Actually, Equation (6) is identical to Equation (5), but the former is based on the above approximation, while the latter is not.
3. Results
3.1. Fourier Analysis of the Grating Profiles
Sensofar PLU-2300 [27] and Zygo NewView 7100 [28] high-resolution optical profilometers were used for the systematic study of the ion microbeam-implanted surface-relief gratings. Grating profiles were extracted from the surface topographies, and sine functions were fitted to the profiles. Then the moduli of the two-dimensional transforms of the surface topography of each grating were calculated to determine the relative amplitudes of the harmonics of the grating profiles. Finally, Equation (2) was used to calculate the absolute amplitude of the harmonics in the profile of each grating.
This method proved to be very good for the determination of the amplitudes of the harmonics of the grating profile. The lower limit of the detectable amplitudes was always set by the noise in the Fourier transform, due to the imperfections of the sample surface. However, at low-to-moderate fluences, all the sample materials studied in this work suffered only minimal surface damage. On the other hand, the doped LiNbO3 crystal was the most susceptible to ion implantation-induced damage at high fluences.
Absolute peak-to-peak amplitudes of harmonics up to the 4th order are presented in Figure 4, Figure 5, Figure 6, Figure 7 and Figure 8.
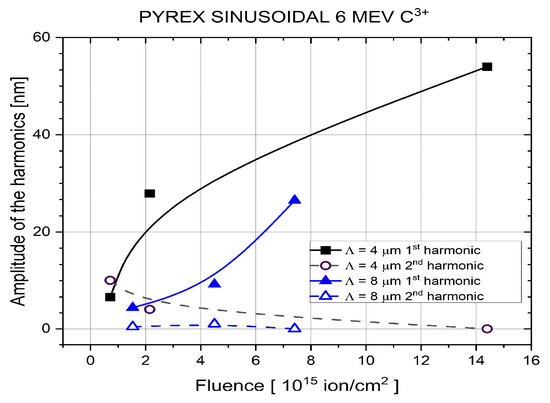
Figure 4.
Amplitudes of the harmonics of the gratings implanted in Pyrex glass by 6 MeV C3+ ions. Blue symbols: Λ = 8 μm. Black symbols: Λ = 4 μm. Lines in this figure and all the next ones up to Figure 8 serve only to guide the eye. Symbol sizes correspond to measurement errors.
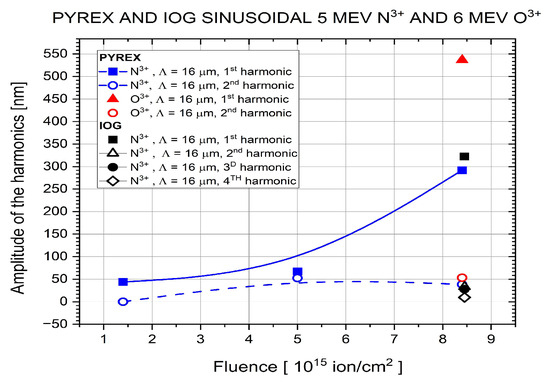
Figure 5.
Amplitudes of the harmonics of the gratings implanted in Pyrex and IOG glasses by 5 MeV N3+ and 6 MeV O4+ ions. Note that there are four overlapping or close data points at the fluence of 8.45 × 10¹⁵ ion/cm2. Symbol sizes correspond to measurement errors.
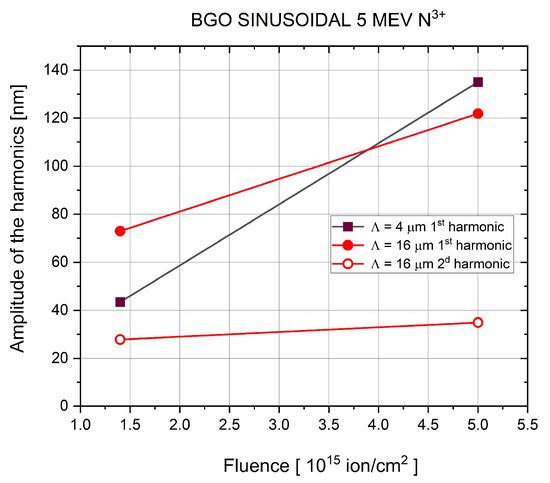
Figure 6.
Amplitudes of the harmonics of the gratings implanted in Bi12Ge20 crystal by 5 MeV N3+ ions. Black symbols: Λ = 4 μm. Red symbols: Λ =16 μm. Symbol sizes correspond to measurement errors.
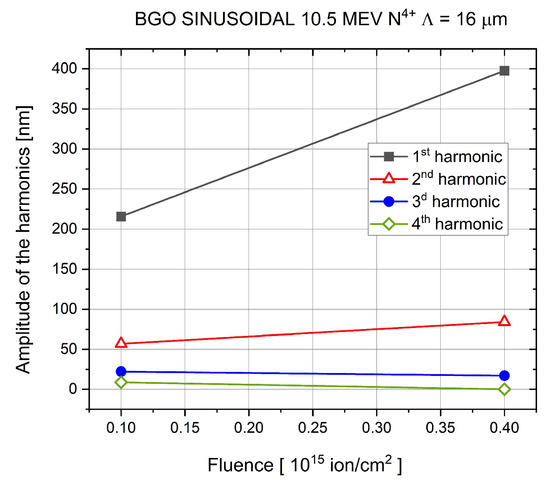
Figure 7.
Amplitudes of the harmonics of the gratings implanted in Bi12Ge20 crystal by 10.5 MeV N4+ ions. Λ = 16 μm. Symbol sizes correspond to measurement errors.
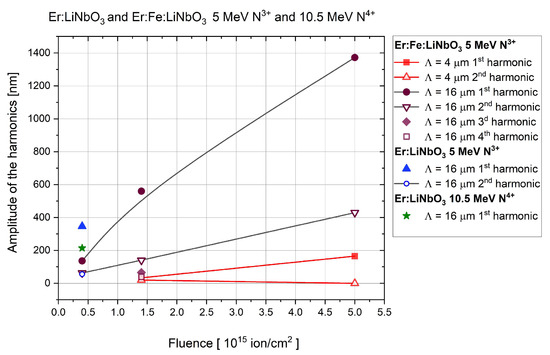
Figure 8.
Amplitudes of the harmonics of the gratings implanted in Er: LiNbO3 and Er: Fe: LiNbO3 crystals by 5 MeV N3+ and 10.5 N4+ ions. Red symbols: Λ = 4 μm. Symbols of other colors: Λ = 16 μm. Note that there are four overlapping or close data points at the fluence of 1.4 × 10¹⁵ ion/cm2. Symbol sizes correspond to measurement errors.
In general, amplitudes of the first and second harmonics of the gratings could be determined by the Fourier analysis, as can be seen in Figure 4, Figure 5, Figure 6, Figure 7 and Figure 8. A complete set of amplitudes of all the orders up to the 4th can be found only in Figure 7, where harmonics of gratings implanted in the Bi12Ge20 crystal by 10.5 MeV N4+ ions are presented.
It must be noted that the highest implanted fluence used in these experiments was 1.44 × 10¹⁶ ion/cm2, when very fine (Λ = 4 μm) gratings were implanted in Pyrex glass by 6 MeV C3+ ions. In spite of the very high fluence, the amplitude of the first harmonic was only 54 nm, as can be seen in Figure 4.
It can be deduced from Figure 4 that the amplitude of the second harmonic either remained constant (Λ = 8 μm) or slightly decreased (Λ = 4 μm) with increasing fluence, while the amplitude of the first harmonic increased with increasing fluence for both grating constants. So, it can be concluded that the nonlinearity of those gratings decreased with increased fluence in that range. For the fine grating (Λ = 4 μm), the ratio of the amplitude of the 1st harmonic to that of the 2nd one was about 9.2.
When 5 MeV N3+ ions were used for the implantation of the sinusoidal gratings of a larger grating constant of Λ = 16 μm in the same material, an implanted fluence of 8.45 × 10¹⁵ ion/cm2 resulted in an amplitude of 292 nm for the 1st harmonic, while the amplitude of the 2nd harmonic was 33 nm (see Figure 5). Implantation of the same type of grating in Pyrex glass by 6 MeV O4+ ions at the same fluence of 8.45 × 10¹⁵ ion/cm2 produced an amplitude of 537 nm for the 1st harmonic. The amplitude of the 2nd harmonic was 53.22 nm. This significant increase in the amplitude of the implanted grating can be attributed to the difference in current density during the two experiments. It was 1.07 × 10⁻³ A/cm2 in the case of the implantation by 5 MeV N3+ ions, and 4.17 × 10⁻³ A/cm2 in the case of 6 MeV O4+ ions (Gratings GF4 and GF2 in Table 1).
Implantation of a grating with a grating constant of Λ = 16 μm in an IOG glass at the same fluence of 8.45 × 10¹⁵ ion/cm2 of 5 MeV N3+ ions gave very similar results to those obtained in the Pyrex glass. It can be seen in Figure 5 that the amplitude of the 1st harmonic was only slightly higher, 322 nm, while that of the 2nd harmonic was 3.5 nm. Current density was somewhat higher than in the case of the Pyrex glass, 1.73 × 10⁻³ A/cm2. (Grating GG.)
Higher-order harmonics of grating GG could also be extracted; the amplitude of the 3rd order one was 28 nm, and that of the 4th one was 9.6 nm.
In Figure 5, there are three data points only for the first and second harmonics of the gratings implanted by 5 MeV N3+ ions in Pyrex glass. It is not easy to establish a trend of the change in nonlinearity with fluence, since the first-to-second-harmonic amplitude ratio significantly increases at the fluence of 5 × 10¹⁵ ion/cm2, due to the small increase in the 1st order harmonic amplitude. Then that ratio reaches an extremely high value of 12 at the highest implanted fluence of 8.45 × 10¹⁵ ion/cm2. That ratio at the same fluence is very similar (11) for the grating implanted by 6 MeV O4+ ions. This fact could suggest that the nonlinearity of the ion beam-implanted gratings is largely the same for the ion species used in these experiments.
In the case of gratings implanted in Bi12GeO20 crystals by 5 MeV N3+ ions (Figure 6), apparently, the amplitude of the first harmonic increased more rapidly for the gratings of Λ = 4 μm than for the gratings of Λ = 16 μm, although one has to rely only on two points to determine that trend. The amplitude of the second harmonic could be determined only for the gratings of Λ = 16 μm. The ratio of the amplitude of the first harmonic to that of the second harmonic increased from 2.5 to 3.15 when fluence increased from 1.4 × 10¹⁵ ion/cm2 to 5 × 10¹⁵ ion/cm2.
Changing from 5 MeV N3+ ions to 10.5 MeV N4+ ions drastically increased the 1st amplitude of the implanted gratings using the same fluence, as can be seen in Figure 6 and Figure 7. In the low-energy implantation experiment, the maximum 1st amplitude was 122 nm at a fluence of 5 × 10¹⁵ ion/cm2. In the high-energy implantation experiment, it was 398 nm at a fluence of 4 × 10¹⁴ ion/cm2. Grating constants were the same, Λ = 16 μm. So, the efficacy of the implantation at 5 MeV was 2.44 × 10⁻¹⁴, while that at 10.5 MeV was 9.95 × 10⁻¹³. This enormous 40-fold increase in the efficiency of the grating production cannot be attributed to the less than 2-fold increase in current density (0.7 × 10⁻³ A/cm2 at 5 MeV and 1.73 × 10⁻³ A/cm2 at 10.5 MeV). A possible explanation of this effect could be the fact that N4+ ions of an energy of 10.5 MeV can already be considered as swift heavy ions, and their interaction with the target material can be described in the framework of the thermal spike model [31,32,33,34]. The implanted gratings were created via the local swelling of the target surface under the microbeam. Such changes in the target volume, and hence in its surface topography, can be explained by plastic deformation of the target in the microregions of the ion tracks [35,36,37,38].
As for the detected nonlinearity of the 5 MeV N3+ ion beam-implanted gratings in Bi12GeO20, amplitudes of the 2nd harmonic could be determined only for gratings of Λ = 16 μm. The 1st-to-2nd harmonic amplitude ratio increased from a value of 2.6 measured at a fluence of 1.4 × 10¹⁵ ion/cm2 to 3.5 at a fluence of 5 × 10¹⁵ ion/cm2 (Figure 6). The same ratio increased from 3.8 at a fluence of 1.0 × 10¹⁴ ion/cm2 to 4.7 at a fluence of 4.0 × 10¹⁴ ion/cm2 (Figure 7). So, the trend observed in the gratings implanted in glasses also applies to the gratings implanted in Bi12GeO20.
It turned out that, among the target materials used in these experiments, the Er: Fe: LiNbO3 crystal proved to be the most efficient in terms of the amplitude of the implanted grating divided by the implanted fluence. Implantation by 5 MeV N3+ ions at a fluence of 5 × 10¹⁵ ion/cm2 resulted in a Λ = 16 μm grating of a 1st harmonic amplitude of 1372 nm (Figure 8). This corresponds to an efficacy of 2.74 × 10⁻¹³. Note that the same implantation in the Bi12GeO20 crystal has an efficacy of 2.44 × 10⁻¹⁴, i.e., more than ten times lower than Fe: LiNbO3. Unfortunately, no gratings could be fabricated in Er: Fe: LiNbO3 using 10.5 MeV N3+ ions due to the lack of beamtime. However, on the one hand, that grating was clearly overexposed, i.e., resulted in low first-order diffraction efficiency. On the other hand, the grating showed clear signs of surface damage.
As for the fine grating of Λ = 4 μm, implanted also in the Er: Fe: LiNbO3 crystal by 5 MeV N3+ ions, its maximum 1st order harmonic amplitude was only 166 nm at 5 × 10¹⁵ ion/cm2.
The 1st-to-2nd harmonic amplitude ratio for the 5 MeV N3+ ion-implanted Λ = 16 μm gratings in Er: Fe: LiNbO3 increased from a value of 2.17 measured at a fluence of 4 × 10¹⁴ ion/cm2 to 3.19 at a fluence of 5 × 10¹⁵ ion/cm2. Consequently, the same trend of decreasing nonlinearity with increasing implanted fluence also applied to Er: Fe: LiNbO3.
Although the amplitudes for only one grating implanted by 5 MeV N3+ ions in Er: LiNbO3 (also of Λ = 16 μm) are presented in Figure 8, these results are important. The amplitude of the 1st harmonic was 346 nm at a fluence of 4 × 10¹⁴ ion/cm2, very close to that obtained in Bi12GeO20 at the same fluence, but by 10.5 MeV N4+ ions, namely 398 nm.
The 1st-to-2nd harmonic amplitude ratio for the above grating was very high, 6.18.
Implantation of a Λ = 16 μm grating in Er: LiNbO3 crystal by 10.5 MeV N4+ ions at a fluence of 4 × 10¹⁴ ion/cm2 resulted in a much lower 1st harmonic amplitude of 215 nm.
Values of the ratio of the amplitude of the first harmonic of the grating to that of the second harmonic, A1/A2 of the quasi-sinusoidal gratings implanted in the two glasses and the three crystals at various implantation conditions and at a total of five values of the implanted fluence are summarized in Table 2. It can be seen that the gratings with the lowest nonlinearity (highest values of the A1/A2 ratio) were those implanted in Pyrex and IOG glasses by carbon, oxygen, and nitrogen ions. However, total amplitudes and hence diffraction efficiencies of those gratings were low, with the exception of the grating implanted in IOG glass by 5 MeV N3+ ions.
Table 2.
Summary of the nonlinear characteristics of the ion microbeam-implanted optical quasi-sinusoidal gratings.
It is an important result that A1/A2 ratios of the gratings implanted in Bi12GeO20 crystal are still relatively high, and they can be achieved at a very low fluence when 10.5 MeV N4+ ions are used for the fabrication of the gratings instead of the 5 MeV N3+ ions. The decrease in the necessary fluence was tenfold. Diffraction efficiencies (not indicated in the table) were rather high at both energies.
Gratings implanted in Er:Fe:LiNbO3 crystal using 5 MeV N3+ ions became overmodulated at higher fluences, as will be shown later.
3.2. Measurement of Diffraction Efficiencies
The diffraction efficiency of the ion microbeam-implanted optical gratings was measured by a setup described in detail in our previous publications [22,23].
Some of the experiments were performed by a TECBL-10GC-405 semiconductor laser from World Star Technologies at a wavelength of 405 nm. Due to the high absorption and scattering of Bi12GeO20 crystals at 405 nm, a wavelength change to 640 nm was necessary. The greatest part of the results presented in this article were obtained using an SM600 Fabry-Perot pigtailed semiconductor laser from Thorlabs at 640 nm, connected to a fiber optics collimator to obtain a free-space beam.
Gratings were always illuminated from the back side of the samples, so that diffracted orders did not have to pass through all the sample below the gratings. Net diffraction efficiencies (without taking into account Fresnel and absorption losses) were measured, usually up to the ±4th order.
The first-order diffraction efficiencies of the harmonics of the ion beam-implanted gratings were calculated, and measured diffraction efficiencies were compared to those predicted by the Raman–Nath equations.
3.3. Calculation of Diffraction Efficiencies
First-order diffraction efficiencies were calculated, and the measured ones were compared to the theoretical ones in our two recent articles, where the same ion beam-implanted gratings were studied as in the present article [22,23]. Generally, it was found that measured first-order diffraction efficiencies were lower than those calculated using the Raman–Nath equation, with the assumption that the grating profiles were perfectly sinusoidal. Differences were lower in the case of gratings fabricated in glasses and higher in the case of gratings implanted in crystals. Since relatively high higher-order diffraction efficiencies were measured in the gratings fabricated in crystals, a logical assumption was that those gratings could not be considered to be pure sinusoidal. It was supposed that the high values of the higher-order diffraction efficiencies were due to the higher harmonics of the grating profiles. As it was shown in Section 3.1 of this article, it was possible to determine the corrected amplitude of the 1st harmonic of the grating by the use of Fourier analysis. Naturally, the corrected amplitude of the 1st harmonic was always lower than that calculated by fitting a sinusoidal function to the measured grating profile.
To check whether the corrected values of the 1st harmonic of the grating profiles would result in predicted diffraction efficiencies closer to the measured ones, diffraction efficiencies of all the gratings were calculated using Equation (5), using the corrected amplitude values. Then the measured diffraction efficiencies were compared to the calculated ones. Results obtained in the gratings implanted in Bi12GeO20 and Er: LiNbO3 crystals are presented in Figure 9 and Figure 10.
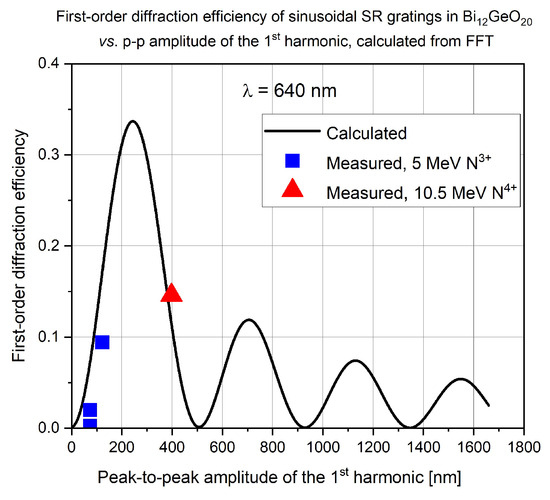
Figure 9.
Calculated (line) and measured (points) first-order diffraction efficiency of ion microbeam-implanted sinusoidal surface-relief gratings in Bi12GeO20. Symbol sizes correspond to measurement errors.
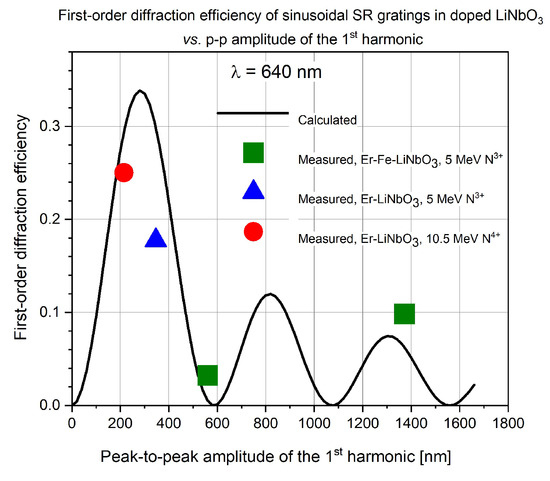
Figure 10.
Calculated (line) and measured (points) first-order diffraction efficiency of ion microbeam-implanted sinusoidal surface-relief gratings in Er: LiNbO3 and Er: Fe: LiNbO3. Symbol sizes correspond to measurement errors.
It can be seen that in general there is a good agreement between the calculated and measured diffraction efficiencies. Larger differences between the measured and calculated values around the first maximum of the Bessel function in both Figure 9 and Figure 10 can be attributed to the fact that a small error in the grating amplitude results in a large difference in diffraction efficiency. As for the last point at the highest value of the grating amplitude in Figure 10, the large difference can be attributed to the fact that the amplitude of that grating is 1390 nm, about 2.2 times the wavelength of the laser light (640 nm), and the Raman-Nath formula is not valid for very large grating amplitudes [39].
One of the main theses of this article was that the relatively large higher-order diffraction efficiencies of the ion beam-implanted gratings were due to the higher harmonics of the grating profiles. To check that thesis, both first-order diffraction efficiencies of the second harmonic and second-order diffraction efficiency of the first harmonic were calculated for a part of the gratings studied in this work. Results for gratings implanted in Bi12GeO20 are shown in Figure 11.
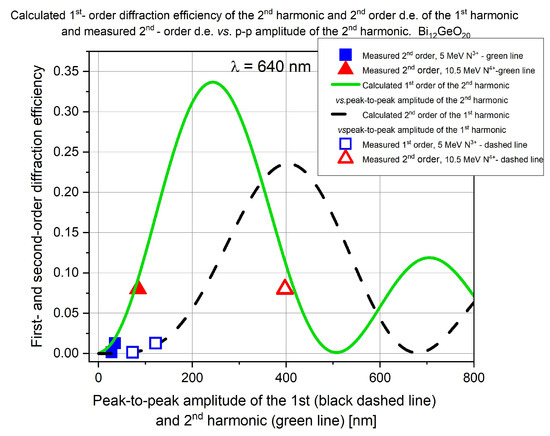
Figure 11.
Measured 2nd order diffraction efficiency of gratings implanted with 5 MeV N3+ (blue full squares) and 10.5 MeV N4+ (red full triangles) ions vs. amplitude of the 2nd harmonic. Calculated 1st order diffraction efficiency of the 2nd harmonic (green continuous line). Measured 2nd order diffraction efficiency of gratings implanted with 5 MeV N3+ (blue hollow squares) and 10.5 MeV N4+ (red hollow triangle) ions vs. amplitude of the 1st harmonic. Calculated 2nd order diffraction efficiency of the 1st harmonics of the gratings (black dashed line) vs. amplitude of the 2nd harmonic. Gratings fabricated in Bi12GeO20. Symbol sizes correspond to measurement errors.
It can be seen that the 1st order diffraction efficiency of the 2nd harmonic grating can attain rather high values (green continuous line). On the other hand, the 2nd order diffraction efficiency increases slowly with the grating amplitude (black dashed line). It must be noted here that, according to the Raman-Nath theory, even a perfectly sinusoidal grating diffracts into higher orders, too. Equation (3) was used with values m = 1 and 2 to calculate the two curves in Figure 11. It can be seen that measured 2nd order diffraction efficiencies (blue full squares and red full triangles) are close to the calculated values of the 1st order diffraction efficiency of the 2nd harmonic grating (green continuous line). On the other hand, when the same measured second-order diffraction efficiencies (blue hollow squares and red hollow triangles) are compared to the values calculated using the first harmonic (black dashed line), the measured data are close to the calculated ones up to A1 = 150 nm, but at A1 = 400 nm the measured second-order diffraction efficiency is only one quarter of the calculated one.
4. Discussion and Conclusions
The aim of this work was to determine the dependence of the nonlinearities of the profiles of ion microbeam-implanted quasi-sinusoidal transmission surface-relief gratings on the parameters of the fabrication.
Microbeams of 6 MeV C3+, 6 MeV O4+, 5 MeV N3+, and 10.5 MeV N4+ ions were used for the fabrication of the gratings. The target materials were IOG phosphate glass, Pyrex glass, Bi12GeO20, Er: LiNbO3, and Er: Fe: LiNbO3 crystals. Implanted fluences ranged from 6.24 × 10¹³ to 1.44 × 10¹⁶ ion-cm2.
Nonlinearity of the grating profiles was studied using Fourier analysis of the surface topography of the gratings. Amplitudes of up to the 4th harmonic of the grating profiles were determined. However, in the greatest part of the gratings, only the amplitudes of the 1st and 2nd harmonics could be determined, due either to measurement sensitivity limits or poor surface quality of some samples.
Total uncorrected amplitude of the gratings (determined by fitting a sine function to the measured grating profiles) depended on ion species and energy, implanted ion fluence, current density of the ion microbeam, grating constant, and target material.
The most susceptible material was Er: Fe: LiNbO3. Implantation of Λ = 16 μm grating by 5 MeV N3+ ions at a fluence of 5 × 10¹⁵ ion/cm2 resulted in a total grating amplitude of 1800 nm (1st harmonic amplitude of 1390 nm). However, the implantation also produced significant surface damage to that grating. But, as can be seen in Figure 10, that grating was overmodulated. Gratings with much lower amplitude could produce nearly optimum 1st order diffraction efficiency, without surface damage.
Implantation of gratings by 10.5 MeV N4+ ions produced much higher grating amplitudes in Bi12GeO20 than by 5 MeV N3+ ions at much lower fluences, as can be seen in Figure 6 and Figure 7. It was attributed to the stronger electronic interaction of the higher-energy ions (swift heavy ions) with the target.
The most important result of this research was that the ratio of the amplitude of the 1st harmonic to that of the 2nd harmonic increased with increasing fluence in the applied fluence ranges for all the gratings. The same trend could be observed for the ratios of the 1st harmonic amplitude to the 3rd and 4th when those amplitudes could be determined. So, it can be stated that grating quality improved with increasing fluence in the studied parameter range.
Comparison of the measured diffraction efficiencies to those predicted by the Raman-Nath theory gave very useful results. Measured and calculated first-order diffraction efficiencies coincided quite well for the greatest part of the ion microbeam-implanted gratings. However, it turned out that the validity of the Raman–Nath theory broke down for relatively low first harmonic grating amplitudes (400 nm or less), when second-order diffraction efficiency was calculated from the amplitude of the first harmonic, using the second-order Bessel function.
Moreover, optimizing the diffraction efficiency of such gratings is possible by first determining the optimum amplitude of the 1st harmonic from the Raman–Nath equation (Figure 9 and Figure 10), then determining the necessary implanted fluence from the 1st order harmonic amplitude vs. fluence curves (Figure 4, Figure 5, Figure 6, Figure 7 and Figure 8).
Since the first (and highest) maximum of the first-order Bessel function is rather narrow, the correct determination of the amplitude of the 1st harmonic by the Fourier analysis proposed in this article can be very useful for that optimization. This method could be used for the optimization of diffracting grating fabrication by other methods, too.
Author Contributions
Methodology, I.B., G.N. and I.R.; Formal analysis, I.B. and R.M.; Investigation, I.B., G.N., V.H., R.M. and I.R.; Writing—original draft, I.B., G.N. and I.R.; Writing—review & editing, I.B., R.M. and I.R.; Supervision, I.B.; Project administration, I.B. All authors have read and agreed to the published version of the manuscript.
Funding
Part of this research has been carried out at the CANAM (Centre of Accelerators and Nuclear Analytical Methods) infrastructure LM 2015056. This study was partly supported by the RADIATE project under the Grant Agreement 824096 from the EU Research and Innovation program HORIZON 2020. The financial support of the Hungarian Government, Economic Development and Innovation Operational Program (GINOP-2.3.3–15-2016-00005) grant, co-funded by the EU, is acknowledged.
Institutional Review Board Statement
Not applicable.
Informed Consent Statement
Not applicable.
Data Availability Statement
The original contributions presented in this study are included in the article. Further inquiries can be directed to the corresponding author.
Conflicts of Interest
The authors declare no conflicts of interest.
References
- Robert, H. Micrographia. Chapter 36 (‘Observ. XXXVI. of Peacoks, Ducks, and Other Feathers of Changeable Colours.’). Available online: https://www.gutenberg.org/files/15491/15491-h/15491-h.htm (accessed on 20 August 2025).
- Gregory, J. Letter from James Gregory to John Collins, dated 13 May 1673. In Correspondence of Scientific Men of the Seventeenth Century; Rigaud, S.J., Ed.; Oxford University Press: Oxford, UK, 1841; Volume 2, pp. 251–255, see especially page 254; Available online: https://books.google.hu/books?id=oBnP1vRoAOcC&redir_esc=y (accessed on 10 August 2025).
- Hopkinson, F.; Rittenhouse, D. An optical problem, proposed by Mr. Hopkinson, and solved by Mr. Rittenhouse. Trans. Am. Philos. Soc. 1786, 2, 201–206. [Google Scholar] [CrossRef]
- Fraunhofer, J. Neue Modifikation des Lichtes durch Gegenseitige Einwirkung und Beugung der Strahlen, und Gesetze derselben. (New Modification of Light by the Mutual Influence and the Diffraction of [Light] Rays, and the Laws Thereof); Denkschriften der Königlichen Akademie der Wissenschaften zu München (Memoirs of the Royal Academy of Science in Munich); Lentner: Munich, Germany, 1821; Volume 8, pp. 3–76. Available online: https://iiif.wellcomecollection.org/pdf/b22013052 (accessed on 10 August 2025).
- Turner, G.L.E. The contributions to Science of Friedrich Adolph Nobert. Phys. Bull. 1967, 18, 338. [Google Scholar] [CrossRef]
- Hentschel, K. The Discovery of the Redshift of Solar Fraunhofer Lines by Rowland and Jewell in Baltimore around 1890. Hist. Stud. Phys. Biol. Sci. 1993, 23, 219. [Google Scholar] [CrossRef][Green Version]
- Lee, S. Holographic Recording Versus Holographic Lithography. Curr. Opt. Photon. 2023, 7, 638–654. [Google Scholar] [CrossRef]
- Zhang, B.; Yan, W.; Chen, F. Recent advances in femtosecond laser direct writing of three-dimensional periodic photonic structures in transparent materials. Adv. Photonics 2025, 7, 034002. [Google Scholar] [CrossRef]
- Meinertz, J.; Godecke, A.; Richter, L.J.; Ihlemann, J. Fast fabrication of diffractive patterns on glass by excimer laser ablation. Opt. Laser Technol. 2022, 152, 108148. [Google Scholar] [CrossRef]
- Cunha, J.; Garcia, I.S.; Santos, J.D.; Fernandes, J.; González-Losada, P.; Silva, C.; Gaspar, J.; Cortez, A.; Sampaio, M.; Aguiam, D.E. Assessing tolerances in direct write laser grayscale lithography and reactive ion etching pattern transfer for fabrication of 2.5D Si master molds. Micro Nano Eng. 2023, 19, 100182. [Google Scholar] [CrossRef]
- Chen, Y. Nanofabrication by electron beam lithography and its applications: A review. Microelectron. Eng. 2015, 135, 57–72. [Google Scholar] [CrossRef]
- Watt, F.; Bettiol, A.A.; Van Kan, J.A.; Teo, E.J.; Breese, M.B.H. Ion beam lithography and nanofabrication: A review. Int. J. Nanosci. 2005, 4, 269–286. [Google Scholar] [CrossRef]
- Rigrod, W.W. Diffraction efficiency of nonsinusoidal Bragg reflection gratings. J. Opt. Soc. Am. 1974, 64, 97–99. [Google Scholar] [CrossRef]
- Slinger, C.W.; Syms, R.R.A.; Solymar, L. Non Linear Recording in Silver Halide Planar Volume Holograms. Appl. Phys. B 1985, 36, 217–224. [Google Scholar] [CrossRef]
- Magnusson, R.; Gaylord, T.K. Analysis of multiwave diffraction of thick gratings. J. Opt. Soc. Am. 1977, 67, 1165–1170. [Google Scholar] [CrossRef]
- Taunaumang, H.; Solyga, M.; Tija, M.O.; Miniewicz, A. On the efficient mixed amplitude and phase grating recording in vacuum-deposited Disperse Red 1. Thin Solid Film. 2004, 461, 316–324. [Google Scholar] [CrossRef]
- de A. Mello, B.; da Costa, I.F.; Lima, C.R.A.; Cescato, L. Developed profile of holographically exposed photoresist gratings. Appl. Opt. 1995, 34, 597–603. [Google Scholar] [CrossRef]
- Bányász, I. Fourier analysis of high-spatial-frequency holographic phase gratings. J. Mod. Opt. 2005, 52, 2443–2451. [Google Scholar] [CrossRef]
- de Gans, B.-J.; Sánchez, C.; Kozodaev, D.; Wouters, D.; Alexeev, A.; Escuti, M.J.; Bastiaansen, C.W.M.; Broer, D.J.; Schubert, U.S. Optimizing Photo-Embossed Gratings: A Gradient Library Approach. J. Comb. Chem. 2006, 8, 228–236. [Google Scholar] [CrossRef]
- Johansen, V.E.; Onelli, O.D.; Steiner, L.M.; Vignolini, S. Photonics in Nature: From Order to Disorder. In Functional Surfaces in Biology III. Biologically-Inspired Systems; Gorb, S., Gorb, E., Eds.; Springer: Cham, Switzerland, 2017; Volume 10. [Google Scholar] [CrossRef]
- Rekola, H.; Berdin, A.; Fedele, C.; Virkki, M.; Priimagi, A. Digital holographic microscopy for real-time observation of surface-relief grating formation on azobenzene-containing films. Sci. Rep. 2020, 10, 19642. [Google Scholar] [CrossRef]
- Bányász, I.; Rajta, I.; Havránek, V.; Pujol, M.C.; Bazsó, G.; Kármán, G.; Nagy, G. Fabrication of Quasi-Sinusoidal Surface Relief Optical Transmission Gratings in Pyrex and IOG Glasses by Implantation with Oxygen and Nitrogen Ion Microbeams of the 5–6 MeV Energy Range. ACS Omega 2024, 9, 30415–30424. [Google Scholar] [CrossRef]
- Bányász, I.; Nagy, G.; Havránek, V.; Pujol, M.C.; Nagyné Szokol, Á.; Kármán, G.; Magnusson, R.; Rajta, I. Direct Writing of Quasi-Sinusoidal and Blazed Surface Relief Optical Transmission Gratings in Bi12GeO20, Er: LiNbO3 and Er: Fe: LiNbO3 Crystals by Nitrogen Ion Microbeams of 5 MeV and 10.5 MeV Energy. Sensors 2025, 25, 804. [Google Scholar] [CrossRef]
- Raman, C.V.; Nagendra Nathe, N.S. The diffraction of light by high frequency sound waves: Part I. Proc. Indian Acad. Sci. (Math. Sci.) 1935, 2, 406–412. [Google Scholar] [CrossRef]
- Berneschi, S.; Conti, G.N.; Bányász, I.; Watterich, A.; Fried, M.; Pászti, F.; Brenci, M.; Pelli, S.; Righini, G.C. Ion beam irradiated channel waveguides in Er3+-doped tellurite glass. App. Phys. Lett. 2007, 90, 121136. [Google Scholar] [CrossRef]
- Bányász, I.; Szilágyi, E.; Rajta, I.; Nagy, G.U.L.; Pelli, S.; Conti, G.N.; Berneschi, S.; Havránek, V.; Vosecek, V.; Nagy, N.; et al. Fabrication of low loss channel waveguide in tungsten-tellurite glass by 11 MeV carbon ion microbeam for telecom C band. Opt. Mater. X 2019, 4, 100035. [Google Scholar] [CrossRef]
- Available online: https://www.sensofar.com/launch-plu-2300/ (accessed on 10 August 2025).
- Available online: https://www.lambdaphoto.co.uk/zygo-newviewtm-7100.html (accessed on 10 August 2025).
- Available online: https://gwyddion.net/ (accessed on 10 August 2025).
- de Jong, T.M.; de Boer, D.K.G.; Bastiaansen, C.W.M. Surface-relief and polarization gratings for solar concentrators. Opt. Express 2011, 19, 15127–15142. [Google Scholar] [CrossRef]
- Dessauer, F. Über einige Wirkungen von Strahlen. IV. Z. Phys. 1923, 20, 288–298. (In German) [Google Scholar] [CrossRef]
- Jordan, P. Methods and results of radiobiology. Radiologica 1938, 3, 157. [Google Scholar]
- Seitz, F. On the disordering of solids by action of fast massive particles. Discuss. Faraday Soc. 1949, 5, 271–282. [Google Scholar] [CrossRef]
- Seitz, F.; Koehler, J.S. Displacement of Atoms during Irradiation. In Solid State Physics; Seitz, E., Turnbull, D., Eds.; Academic Press: London, UK; New York, NY, USA, 1956; Volume 2, p. 305. Available online: https://shop.elsevier.com/books/solid-state-physics/low/978-0-12-607702-5 (accessed on 20 August 2025).
- Klaumünzer, S.; Changlin, L.; Löffler, S.; Rammensee, M.; Schumacher, G. Plastic Flow of Vitreous Silica and Pyrex During Bombardment with Fast Heavy Ions. Nucl. Instrum. Methods Phys. Res. 1989, 39, 665–669. [Google Scholar] [CrossRef]
- Trinkaus, H.; Ryazanov, A.I. Viscoelastic Model for the Plastic Flow of Amorphous Solids under Energetic Ion Bombardment. Phys. Rev. Lett. 1995, 74, 5072. [Google Scholar] [CrossRef]
- Klaumünzer, S.L. Plastic Flow of Amorphous Materials During Ion Bombardment. In Multiscale Phenomena in Plasticity: From Experiments to Phenomenology, Modelling and Materials Engineering. NATO Science Series; Lépinoux, J., Mazière, D., Pontikis, V., Saada, G., Eds.; Springer: Dordrecht, The Netherlands, 2000; Volume 367. [Google Scholar] [CrossRef]
- van Dillen, T.; Polman, A.; Onck, P.R.; van der Giessen, E. Anisotropic plastic deformation by viscous flow in ion tracks. Phys. Rev. B 2005, 71, 024103. [Google Scholar] [CrossRef]
- Moharam, M.G.; Young, L. Criterion for Bragg and Raman-Nath diffraction regimes. Appl. Opt. 1978, 17, 1757–1759. [Google Scholar] [CrossRef]
Disclaimer/Publisher’s Note: The statements, opinions and data contained in all publications are solely those of the individual author(s) and contributor(s) and not of MDPI and/or the editor(s). MDPI and/or the editor(s) disclaim responsibility for any injury to people or property resulting from any ideas, methods, instructions or products referred to in the content. |
© 2025 by the authors. Licensee MDPI, Basel, Switzerland. This article is an open access article distributed under the terms and conditions of the Creative Commons Attribution (CC BY) license (https://creativecommons.org/licenses/by/4.0/).