Article

An Adaptive Absolute Phase Correction Method with Row–Column Constraints for Projected Fringe Profilometry

Faculty of Intelligent Transportation, Anhui Sanlian University, Hefei 230601, China
*
Author to whom correspondence should be addressed.
Photonics 2025, 12(10), 956; https://doi.org/10.3390/photonics12100956 (registering DOI)
Submission received: 5 August 2025 / Revised: 24 September 2025 / Accepted: 25 September 2025 / Published: 27 September 2025

Abstract

The accuracy of phase unwrapping is a decisive factor in achieving high-precision dimensional measurement using the projected fringe profilometry. However, discontinuities at truncation points inevitably lead to phase jumps, especially when measuring objects with complex hollow features, resulting in significantly increased errors. To address this issue, this paper proposes an adaptive phase correction algorithm based on row and column constraints. First, the algorithm identifies the main normal phase distribution region in each column and interpolates abnormal values deviating from this region, ensuring smooth phase distribution in the column direction. Then, it detects each continuous non-zero segment in every row, locates phase jump positions, and performs local corrections. This approach enhances the overall continuity of the phase map and effectively compensates for phase jump errors. Experimental results demonstrate that the proposed method can effectively suppress phase jumps caused by object edges and hollow regions, achieving an absolute error of less than 0.05 mm in measured step height differences in standard blocks. This provides a reliable phase preprocessing solution for the optical measurement of complex-shaped objects.

1. Introduction

With the wide application of 3D measurement technology [1,2] in the fields of industrial inspection, intelligent manufacturing, medical imaging, and cultural relic digitization, there is a growing demand for high-precision and high-efficiency non-contact measurement methods. The projected fringe profilometry [3,4], as an active optical measurement technique based on structured light, has become an important research direction in the field of 3D morphology reconstruction by virtue of its advantages of high measurement accuracy, fast response speed, and simple equipment construction. The basic principle of this method is to project a series of periodic grating patterns onto the surface of an object using a projection system, and the camera receives the patterns modulated by the object and extracts the phase information through a phase demodulation algorithm. The change in phase reflects the height undulation of the object surface, which is further combined with the system calibration parameters to realize the 3D reconstruction of the measured object. In practice, the initial phase extracted by the phase-shifting method [5] is the wrapped phase, which takes the value range of [−π, π], and the continuous absolute phase must be obtained by phase unwrapping. However, the unwrapped phase is prone to jumps when measuring the measured object with cavity features, which seriously affects the completeness and accuracy of the final 3D reconstruction. Therefore, how to realize phase unwrapping and error correction in a stable and efficient way has become a key issue in current research.
Numerous scholars have carried out extensive research on phase unwrapping methods based on the outlier principle. Guo Chuangwei et al. [6] proposed an error correction method using multi-frequency parcel phase comparison, which identifies phase-jump errors by comparing parcel phases at multiple frequencies and subsequently corrects abnormal pixels. This approach enables smooth phase unwrapping and high-precision three-dimensional reconstruction for objects with relatively regular surfaces. However, it shows poor adaptability to objects with complex geometries or voids, offers limited error localization accuracy, and is highly dependent on the choice of frequency combinations, making it difficult to generalize to broader measurement scenarios.
Chen Songlin et al. [7] introduced a series of constraints to improve the three-frequency outlier phase unwrapping method. Their approach allows for a smooth recovery of the absolute phase without jumps, but the numerous constraints imposed inevitably reduce the flexibility of fringe projection.
Liu Fei et al. [8] developed a hybrid method that combines the standard four-step phase-shifting technique with a full-frequency solution. The wrapped phase is first obtained through the four-step algorithm, after which the absolute phase relationship among gratings of different periods is exploited to fuse multi-period details. This improves the accuracy of phase unwrapping while imposing fewer constraints in suppressing phase-jump errors. Nevertheless, the method still relies heavily on empirical frequency selection and period matching, resulting in a relatively low degree of automation.
Liu et al. [9] proposed a hierarchical phase unwrapping strategy for dual-wavelength phase-shifted fringes. By establishing a coarse-to-fine unwrapping framework, the long-wavelength phase map is first used to obtain the initial absolute phase, which then guides the unwrapping of the short-wavelength high-precision phase. This method demonstrates good performance in reducing jump errors and handling surfaces with complex structures. However, it requires strict phase consistency between wavelengths, and the overall accuracy is strongly dependent on the design of the hierarchical strategy, which increases computational complexity and limits adaptability.
Gu Qianqian et al. [10] presented a phase demodulation algorithm that integrates dual-frequency outlier detection with the phase-shifting method. This combination significantly enhances anti-interference capability and measurement accuracy, effectively suppressing phase jumps and cumulative errors caused by environmental disturbances or surface discontinuities. Nevertheless, the approach is sensitive to the choice of frequency parameters; improper settings may amplify interference errors. In addition, the dual-frequency demodulation process is relatively complex, placing higher demands on hardware performance and phase-shift control accuracy.
Beyond phase unwrapping-oriented PFP studies, complementary advances in optical profiling and calibration further motivate our design choices. Xu et al. developed a light sheet-based approach for surface topography and curvature analysis on complex, opaque objects, underscoring the need for accurate geometry signal mapping under controlled illumination [11]. In a related direction, Luo et al. proposed a parameter-free calibration scheme for a Scheimpflug LiDAR using hinge-point geometry, demonstrating how calibration formulations can reduce sensitivity to internal parameters and improve volumetric profiling [12]. Although these systems (LSM and Scheimpflug LiDAR) differ from dual-frequency PFP, both works reinforce two principles we adopt here, namely (i) an explicit, robust mapping from measured signals to 3D geometry and (ii) calibration choices that mitigate error accumulation. Building on these principles within a fringe projection setting, our method targets the suppression of jump errors in discontinuous regions via adaptive phase correction.
Aiming at the problem that the absolute phase of the projected dual-frequency stripe has a jumping error when the phase is unfolded according to the outlier principle, this paper proposes an adaptive phase correction algorithm based on rank constraints. The algorithm repairs anomalous phase values using linear interpolation, where the principal value interval is constructed from histogram peaks and thresholds are set along the vertical direction of stripe movement. It determines the jumping position through the consistency of the local gradient in the parallel stripe moving direction; the front segment slope is used to replace the anomalous increment to realize the adaptive correction of transverse jumps. The experimental results show that the improved method can significantly suppress the jump error in the edge and cavity regions and improve the continuity and smoothness of the phase diagram, and it is suitable for high-precision measurement of complex structural objects.

2. Dual-Frequency Outlier Principle

Acquisition of Phase Principal Value

The three-dimensional measurement principle of the projected fringe profilometry [13,14] is shown in Figure 1, where D is the distance between the camera and the center line of the projector, L is the height of the camera optical center from the reference plane, and AE is the height of the point to be measured.
I 1 ( m , n ) = I ( m , n ) + I ( m , n ) cos [ ϕ ( m , n ) ] I 2 ( m , n ) = I ( m , n ) + I ( m , n ) cos [ ϕ ( m , n ) + π 2 ] I 3 ( m , n ) = I ( m , n ) + I ( m , n ) cos [ ϕ ( m , n ) + π ] I 4 ( m , n ) = I ( m , n ) + I ( m , n ) cos [ ϕ ( m , n ) + 3 π 2 ]
where ϕ(m,n) is the main value of the phase to be solved; Ii(m,n) is the gray value of the ith grating stripe image at point (m,n); I′(m,n) is the magnitude of the background gray value of the image; and I″(m,n) is the modulation intensity of the image. Then the phase solution of the four-step phase-shifting method is shown in Equation (2):
ϕ ( m , n )   =   arctan [ I 4 ( m , n ) I 2 ( m , n ) I 1 ( m , n ) I 3 ( m , n ) ]
From Equation (2), the gray scale range [0, 255] of the image is mapped to the phase value range of [−π/2, π/2] by using the inverse tangent function, and at the same time, in order to ensure the uniqueness of the phase, it is necessary that the extracted phase values need to be restricted to one period, for example, [−π, π]. In this case, the phase wrapped in the range [−π/2, π/2] needs to be expanded.
The dual-frequency outlier principle [15,16,17], as shown in Figure 2, involves the projection of the stripe period to the surface of the object to be measured, respectively, p1 and p2, which are two kinds of sinusoidal stripe maps, in which p1 < p2. With two kinds of grating after stacking the grating after the period of p12 for the object to be measured at a certain point, the metrics (3)–(7) holds as follows:
p 1 n 1 = p 2 n 2
Δ n i = φ i 2 π , ( i = 1 , 2 )
n i   =   N i   +   Δ n i , N i     Ζ
p 12 = p 1 p 2 p 2 p 1 , ( p 2 > p 1 )
θ = 2 n π
In the above equation, φi denotes the phase principal values of two different cycles extracted by the phase-shifting method, and ni, Ni, and Δni denote the number of levels of the two fringes, as well as the corresponding integer and fractional parts.
From Equations (3) and (5), it can be derived that
n 1   =   p 2 ( n 1 n 2 ) p 2 p 1 =   p 2 ( N 1 N 2 + Δ n 1 Δ n 2 ) p 2 p 1
n 2   =   p 1 ( n 1 n 2 ) p 2 p 1 =   p 1 ( N 1 N 2 + Δ n 1 Δ n 2 ) p 2 p 1
  N 1 N 2 = ( p 2 p 1 ) n 2 p 1 + Δ n 2 Δ n 1
From the above equation, if the value of N1N2 can be solved, then n1 and n2 can be found. Set the absolute phase after unfolding if θ1 and θ2 are used to represent the absolute phase after unfolding of the main value of the phase of two different frequencies. Then the phase unwrapping Equations (11) and (12) are shown as follows:
θ 1 = p 2 [ 2 π ( N 12 + m ) + φ 1 φ 2 ] p 2 p 1
θ 2 = p 1 [ 2 π ( N 12 + m ) + φ 1 φ 2 ] p 2 p 1
When φ2 > φ1, we set m = 1, and when φ2φ1, we set m = 0. By choosing the appropriate stripe period, the stacked grating stripe period can be made to cover the whole field of view, at which time N12 = 0. Then θ1 and θ2 can be calculated from Equations (11) and (12).
From the above derivation, it can be seen that two main types of errors exist. The first is caused by ambient noise and the accuracy of system hardware (camera and projector), which may lead to incorrect rounding of the stripe integer level N12. This results in a jump error in the unwrapped phase θ1 (or θ2) with an amplitude of {p2/(p2p1)} × 2π. The second arises when the error value (φ1φ2)/2π induces a phase error with an amplitude of 2π in the unwrapped phase.

3. Phase Unwrapping Error Correction Method

3.1. Row and Column Vector Analysis of Absolute Phase

Analysis of the principle of phase unwrapping shows that, ideally, the parcel phase of the absolute phase value along the row direction is strictly monotonic, either increasing or decreasing. Across multiple cycles, the phase gradient remains approximately constant and is positively correlated with the spatial frequency of the stripes.
Along the column direction, which is perpendicular to the projected stripe movement, the phase value is relatively constant or changes slowly. The phase difference between adjacent points is very small, and the gradient is close to zero. If the object is planar, the phase values of the same row are identical, while real surfaces exhibit only small continuous phase variations.
The phase difference in the column vectors essentially reflects the height profile of the object in the direction perpendicular to the stripes, and its small local variations correspond to the slope characteristics of the object surface.
Figure 3 shows the absolute phase map after wrapping the phase unwrapping, and the three figures, Figure 3a–c, together demonstrate the distribution characteristics of the absolute phase in space. Figure 3a is a three-dimensional map of phase distribution, which shows that the phase value decreases linearly with the pixel position in the row direction, while it remains basically unchanged in the column direction, and the whole shows a slanting feature; Figure 3b demonstrates the absolute phase change in each column on the 500th row, the curve is a straight line with a negative slope, and the phase decreases uniformly in the same row with the increase in the column coordinate, which indicates that the phase changes mainly along the column direction; Figure 3c demonstrates the absolute phase change in each row on the 500th column, which is a straight line with a negative slope. At 500 columns on the absolute phase of each row, the curve is approximately a horizontal straight line; the same column in different positions of the phase value is basically the same and the change is very small.

3.2. Principle of the Improvement Method

Combining the principle of phase jumping and the row–column characteristic of the absolute phase, a row–column-based absolute phase error correction method is proposed. Firstly, the data in each column are counted, and the histogram is used to find the main value interval N of the column, i.e., the region where the absolute phase values are most concentrated, and the threshold value π/10 is set so that when the data point is in the interval in the range of N ± π/10, it is considered to belong to the normal point, or else it is an anomaly, and finally, the anomalies are repaired by smoothing them through linear interpolation of the normal values. At this point, the following two situations occur:
If the number of jumps in the absolute phase of a column is less than the number of non-jumps, normal phase smoothing repair will be achieved, as shown in Figure 4.
The structure of sample 1 is relatively regular, and the absolute phase is continuous in the column direction, with only a small number of jumps at the edge, which is a typical case where the number of jump points is less than the number of non-jump points. Using the column-direction principal value extraction and linear interpolation correction method, the jumps can be effectively suppressed to realize the accurate phase unwrapping. The blue rectangular box in the figure indicates the region where the jumps are concentrated, there is an obvious break in this region in the original unfolding diagram, and the phase transition is smooth and the jumps are eliminated after the correction in the column direction; the red box region is used as a reference region for comparison, which further verifies that the method can realize complete restoration in a regular structure without additional row-direction processing.
If the number of jumps in the absolute phase of a column is larger than the number of non-jumps, all the data in a column will become anomalous after the above algorithm correction.
To address this problem, the absolute phase data for each row is then corrected by correcting the absolute phase data for each row. The steps for correcting the absolute phase of a specific row are as follows:
(1)
Separate the continuous non-zero region (region of interest) and the zero-value region (null or background) in each row, always treating the zero value as the natural boundary and not operating across segments;
(2)
Inside each non-zero segment, starting from the third point, calculate the “difference between the first two points” and the “difference from the current point to the next point”. If the difference between the first two points is very small (indicating that the curve is smooth at that point) and the subsequent difference is very large, exceeding the set threshold value of 2π, then a phase jump has occurred, and the next point is judged to be an “abnormal jump point”;
(3)
Instead of replacing the point judged as abnormal with a fixed value, the increment (i.e., local slope) of the previous two points is used to smoothly calculate the new value of the point so as to ensure that the corrected data not only retains the original trend but also suppresses the phase jump;
(4)
All corrections are made only within the same continuous non-zero segment, the zero value is skipped immediately when encountered, and the void region is kept in its original state; the end of the segment and the beginning of the segment are smoothed and connected with the data in their respective segments so that the data in different segments will not be mixed or continued.
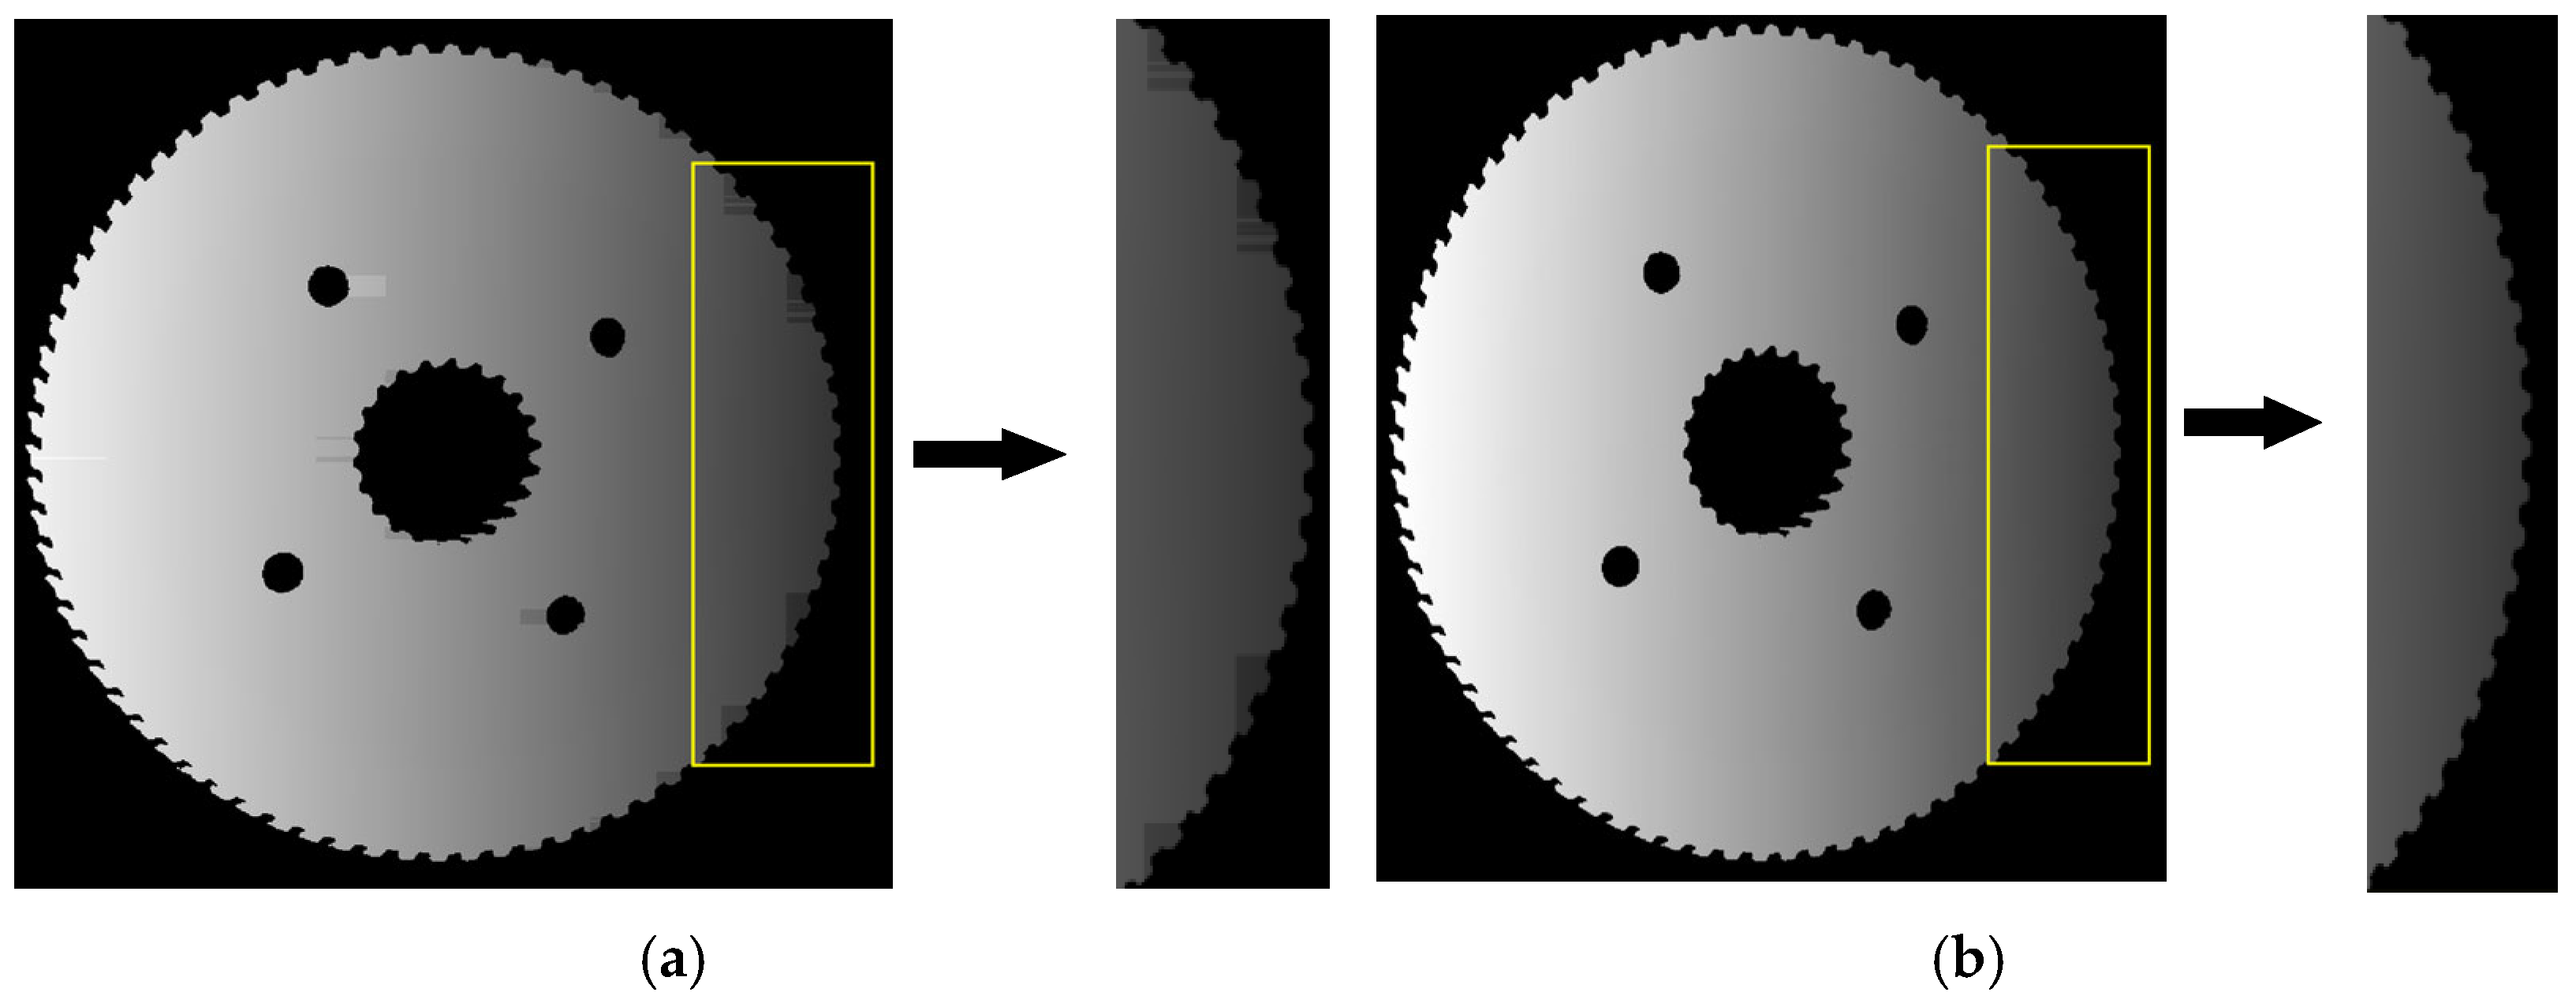
As shown in Figure 5, sample 2 contains multiple sets of tooth and cavity structures with complex boundaries and significant local occlusion, resulting in a wide range of phase jumps in both the column and row directions, which is in line with the second type of scenario in which there are more jump points than non-jump points. The column correction alone cannot completely restore its phase continuity, so the gradient consistency-based row-direction correction strategy is introduced to jointly repair the anomalous region. In the figure, the blue rectangle corresponds to the cavity edge region, and the red rectangle corresponds to the tooth root complex structure. The discontinuous transition is still visible in the original figure and the column correction figure, while phase continuity is realized in the two regions after the joint correction of columns and rows, which effectively restores the real shape of the boundary of the complex structure.

4. Experiment and Result Analysis

4.1. Comparative Measurement Experiments with Multiple Samples

To verify the effectiveness and generality of the proposed method, three types of specimens—synchronous wheels, cup lids, and bearings—were measured in 3D. A fringe projection measurement system was first constructed [18], as shown in Figure 6. The experiments employed a Basler acA1920-48gc industrial camera (resolution: 1920 × 1080 pixels, Basler AG, Ahrensburg, Germany) and a Texas Instruments DLP6500 projector (resolution: 1920 × 1080 pixels, Texas Instruments, Dallas, TX, USA). To mitigate specular highlights, a very thin layer of developer was sprayed uniformly on the surfaces of all three objects. The images acquired in the experiment are shown in Figure 7.
Firstly, the projection device projects grating stripes with pitches of 34 pixel and 36 pixel, respectively, to the measured object, and the absolute phase of the measured object is obtained using the four-step phase-shifting method and the two-frequency outlier method. The phase is solved using the traditional method, the method in the literature [10], and the method in this paper, respectively, in which the single row of the absolute phase comparisons under the different methods is to take a line of data across the center of the measured object for absolute phase comparison. Figure 8 shows the single-row absolute phase of the synchronous wheel under different methods.
In the single-row absolute phase comparison of synchronous wheels, the traditional method (Figure 8a) has multiple jumps in the curve phase, which has difficulty reflecting the real shape; the method in reference [10] (Figure 8b) shows a significant improvement in the continuity, but sporadic jumps and small discontinuities are still left at the edge of the holes, whereas the method in this paper (Figure 8c) presents a smooth and continuous phase curve throughout the whole row down, which not only preserves the natural transition of the high-phase region to the holes but also eliminates isolated noise jumps, transitions to the hole area, and eliminates the isolated noise jumps, realizing the stable single-row absolute phase recovery.
In the global absolute phase comparison of the synchronous wheel, the 3D surface generated by the traditional method (Figure 9a) is full of vertical “columnar” artifacts, and the contours of the holes and raised areas are severely broken, making the overall shape almost unrecognizable; the method in the reference (Figure 9b) removes most of the jumping columnar artifacts and makes the main body of the synchronous wheel have a coherent contour. However, there are still rough step-like discontinuities at the edge of the hole and the slope transition; the absolute phase solved by this paper’s method (Figure 9c) is smooth and flat, which accurately shows the high and low ups and downs of the inside and outside of the hole, and it also has no jumps and completely restores the real absolute phase distribution of the synchronous wheel.
Figure 10 shows the single-row absolute phase of the cup covers obtained using different methods. It can be seen from the figure that there are significant differences among the three methods in extracting the single-row absolute phase. When using the traditional method (Figure 10a), obvious phase jumps and poor continuity are observed. The method in reference [10] (Figure 10b) improves the phase discontinuity to some extent, but large errors still exist. In contrast, the method proposed in this paper (Figure 10c) effectively maintains the overall smoothness and continuity of the phase curve, significantly reduces phase jumps, and improves the accuracy and stability of the absolute phase.
As shown in Figure 11, in the global absolute phase comparison of the cup covers, the traditional method (Figure 11a) produces large areas of phase jumps when extracting the absolute phase, resulting in incomplete morphological structures that are difficult to use for subsequent reconstruction. Although the method in reference [10] (Figure 11b) improves the continuity of the absolute phase to a certain extent, a large number of phase jumps still occur at the edges. In contrast, the method proposed in this paper (Figure 11c) reconstructs the absolute phase surface with the smoothest and most continuous profile, producing clear object contours and no noticeable phase jumps even at the edges where jumps are most likely to occur.
Figure 12 shows the extracted single-row absolute phase under different methods, from which it can be seen that there are obvious differences in the accuracy and continuity of the three methods in extracting the single-row absolute phase of the bearing. There are obvious jumps in the phase curve of the traditional method (Figure 12a), especially at the edges of the object; the method in reference [10] (Figure 12b) achieves better phase correction in some areas compared with the traditional method, but there are still local phase jumps; the absolute phase calculated by the method (Figure 12c) in this paper is coherent and smooth without obvious jumps and can truly restore the phase change trend of the bearing cross-section structure.
From the global absolute phase ratio shown in Figure 13 under different methods, the traditional method (Figure 13a) shows obvious phase jumps in the reconstruction results, and the overall shape is blurred, which cannot accurately reflect the real phase characteristics of the bearing; although the method in reference [10] (Figure 13b) suppresses the problem of phase jumps to a certain extent, and the basic contour of the bearing is recognizable, the edge phases are still markedly jumped and broken; the method in this paper (Figure 13c) realizes continuous, smooth, and complete phase solving in the whole bearing region, which not only has clear details but also has a natural edge transition. Figure 14 shows the reconstructed point cloud images of three kinds of synchronous wheels, cup covers, and flanges.
Figure 14 shows the reconstructed point cloud images of three typical industrial samples, i.e., a synchronizer wheel, cup cover, and bearing, under the method in this paper. As a whole, the 3D point clouds show good density distribution and geometric continuity, which can completely restore the shape contour and key structural details of the sample parts. The tooth shape of the synchronous wheel in Figure 14a is clearly distinguishable, with flat edges and a symmetrical distribution of the center hole and tooth groove structure, indicating that the point cloud has high accuracy in contour extraction and depth reconstruction; the step shape and screw hole structure of the cup cover shown in Figure 14b are completely presented, especially in the curved area, which also maintains good continuity and smoothness, indicating that the method is still robust in dealing with the structures with a high degree of ups and downs and curvature changes. The bearing in Figure 14c shows a clear hierarchical structure and uniform groove distribution in the inner and outer rings, with a natural transition on the surface of the point cloud and no obvious breakage or noise interference at the edges. Overall, the method in this paper is able to obtain the 3D topographic information of complex workpieces with high quality and has strong universality, which is suitable for high-precision measurement and inspection scenarios.

4.2. Accuracy Verification

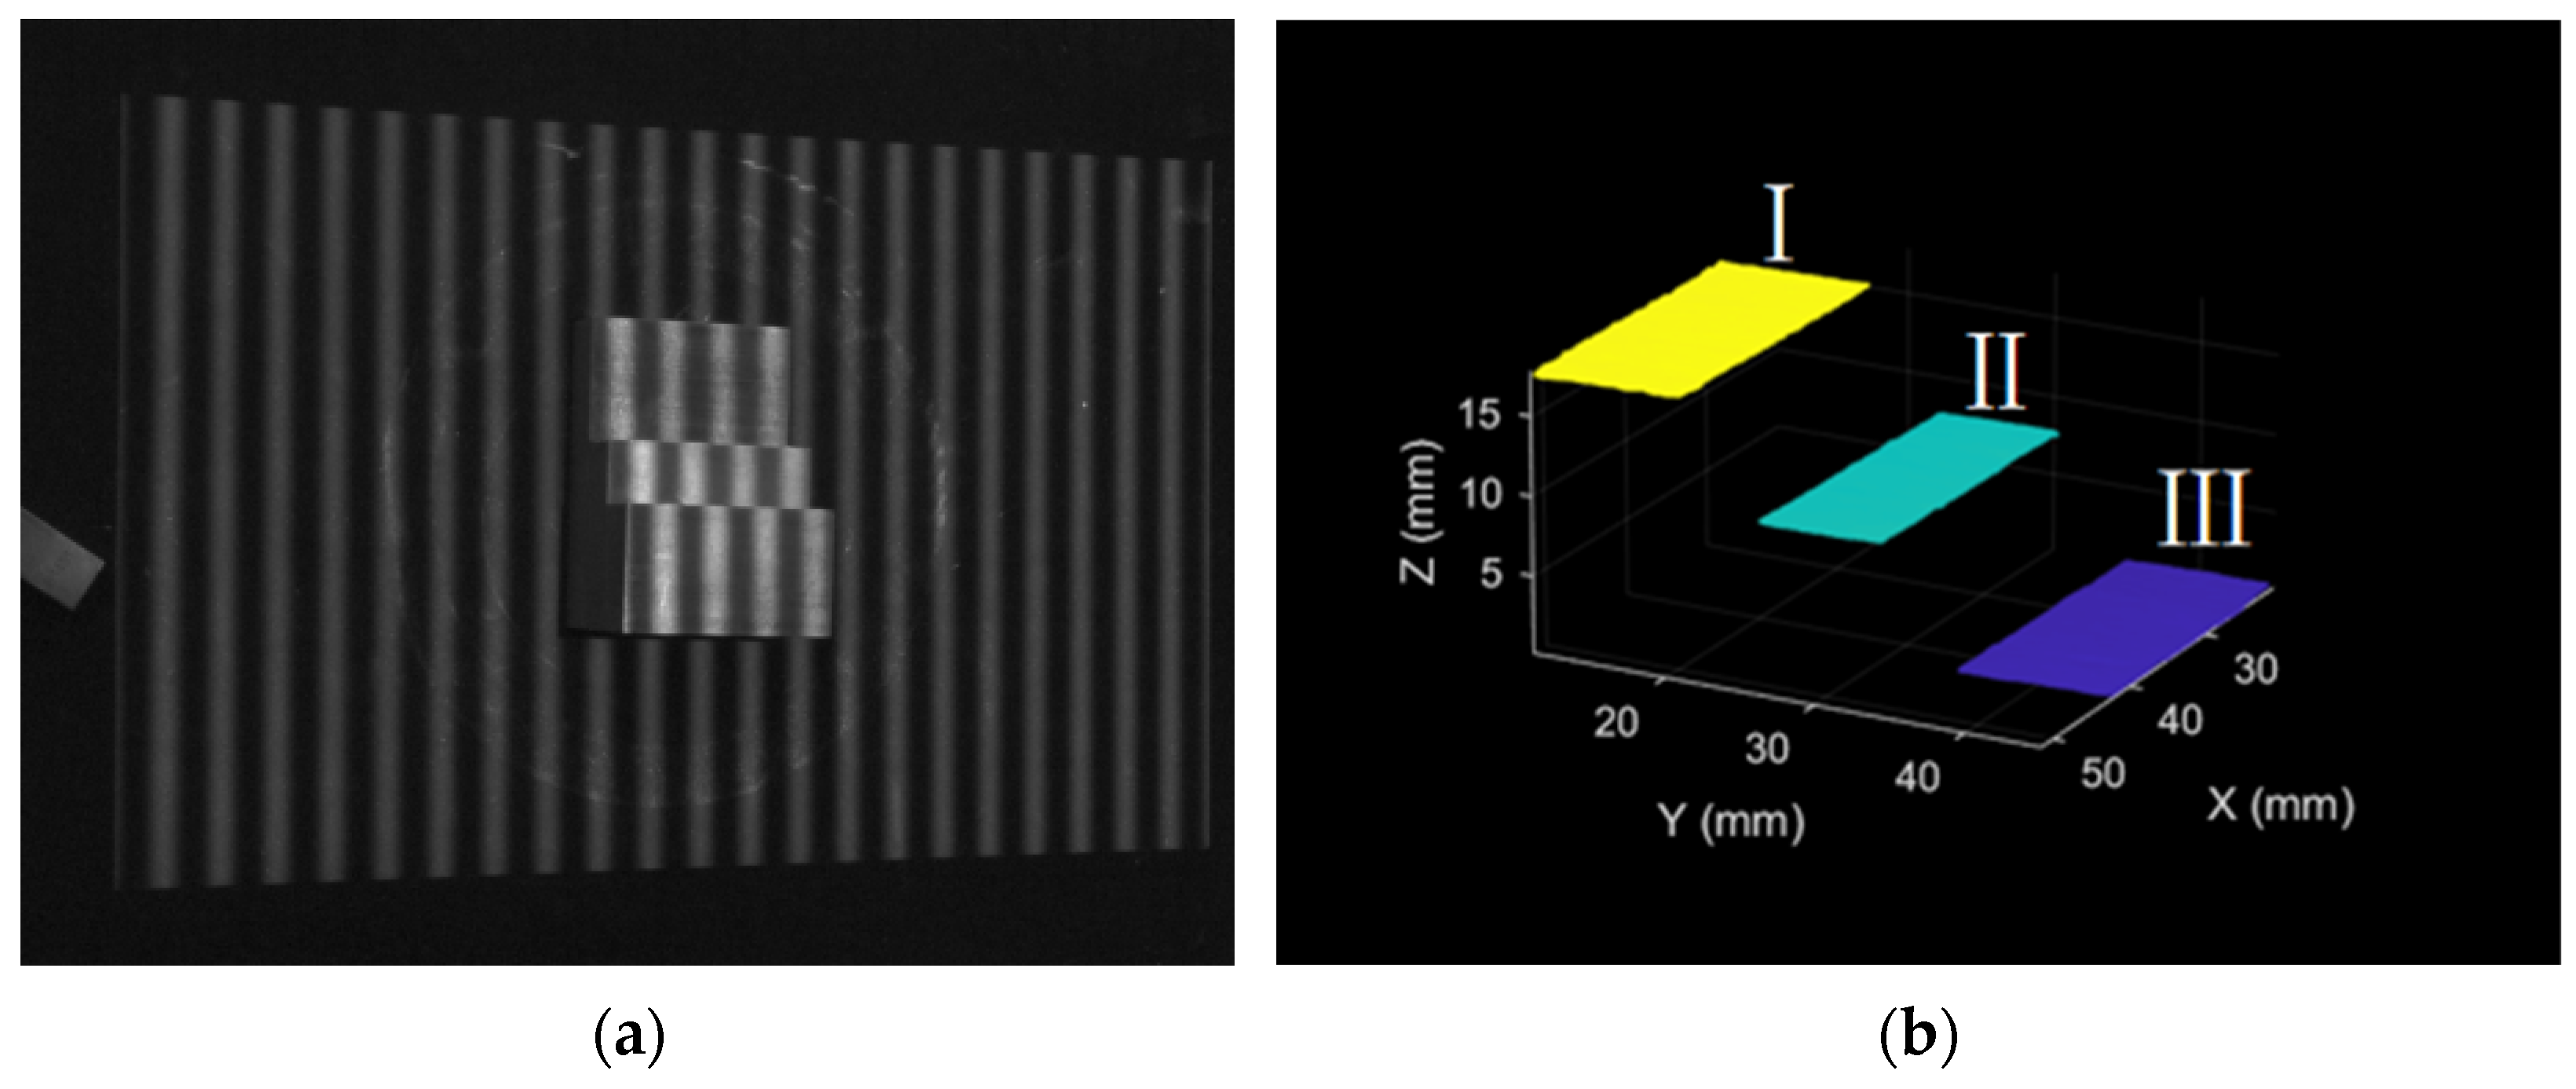
To verify the accuracy of the proposed method, three standard blocks with a height of 10 mm were stacked to form a step block and a measurement experiment was carried out. Figure 15a shows the fringe projection image acquired during the experiment, in which the projected stripe patterns are clearly modulated by the step structure of the blocks. The three reconstructed layers are distinguished as yellow (Layer I), green (Layer II), and blue (Layer III), respectively. For each layer, five different regions were selected to calculate the average height, and the differences and absolute errors between the three layers were analyzed. Figure 15b illustrates the point cloud result of one representative measurement, in which the step structure of the blocks can be clearly observed.
Figure 14 and Table 1 present the measurement results and accuracy analysis of the proposed method on a standard three-step block. The three layers in the figure are clearly distinguishable by color, and the step edges are smooth, indicating high-quality point cloud reconstruction. Table 1 lists the height differences and absolute errors between Layer I and Layer II and between Layer II and Layer III across five measurements. The measured height differences closely match the theoretical values, with absolute errors consistently controlled within 0.05 mm and the minimum reaching 0.0301 mm and the maximum not exceeding 0.0477 mm. These results demonstrate that the proposed method effectively suppresses phase jumps while exhibiting good repeatability and stable accuracy, meeting the practical requirements of industrial measurement.

5. Conclusions

For the phase jumping problem that occurs when solving the phase with a dual-frequency outlier, this paper proposes a method based on the combination of column correction and row correction to optimize the absolute phase map. The algorithm first identifies the main value interval of the phase by columns and interpolates and repairs the anomalies that deviate from the main value so as to make the phase distribution smoother in the column direction; it then processes the non-zero passages by rows one by one, detects and corrects the local mutation points, and maintains the continuity of the phase in the row direction so as to improve the completeness and accuracy of the absolute phase diagram overall. The experiment shows that by this way of using columns, mentioning the main value, and row fixing the jumps, the effective correction of jump points, mutation edges, and other abnormal areas in the whole phase diagram is realized, which significantly reduces the jump error of the phase unwrapping. The accuracy measured by the standard ladder block is less than 0.05 mm, suggesting potential for engineering integration under the tested conditions.

Author Contributions

Conceptualization, Y.Y.; methodology, Y.Y.; software, Y.Y.; validation, Y.Y., Q.Z. and P.F.; formal analysis, L.Q.; investigation, Q.Z.; resources, C.L.; data curation, Y.Y.; writing—original draft preparation, Y.Y.; writing—review and editing, Q.Z.; visualization, C.L.; supervision, Y.Y.; project administration, L.Q.; funding acquisition, Y.Y. All authors have read and agreed to the published version of the manuscript.

Funding

This research was funded by the Anhui Provincial Department of Education University Research Project, grant number (2024AH050508).

Data Availability Statement

The data that support the findings of the study are available from the first author and the corresponding author upon reasonable request.

Conflicts of Interest

The authors declare no conflict of interest.

References

  1. Xu, J.; Zhang, S. Status, challenges, and future perspectives of fringe projection profilometry. Opt. Lasers Eng. 2020, 135, 106193. [Google Scholar] [CrossRef]
  2. Zonghua, Z.; Yanling, L.; Feng, G.; Nan, G.; Zhaozong, M.; Xiangqian, J. Phase unwrapping technology for structured light three-dimensional measurement: A review. Infrared Laser Eng. 2023, 52, 20230126-1–20230126-23. [Google Scholar] [CrossRef]
  3. Suqin, W.; Taiqin, C.; Feng, Z.; Min, S.; Dengming, Z. High-precision 3D reconstruction method for topography measurement of complex mechanical parts. Infrared Laser Eng. 2022, 51, 20210730-1–20210730-11. [Google Scholar]
  4. Chuangwei, G.; Yang, W.; Wenzhe, Z.; Yuqing, G.; Yujie, Z.; Liqin, L.; Zhishan, G.; Lihua, L. Study of phase correction method based on multi-frequency heterodyne principle. Infrared Laser Eng. 2023, 52, 20220697-1–20220697-8. [Google Scholar]
  5. Chen, S.L.; Zhao, J.; Xia, R. Improvement of the phase unwrapping method based on multi-frequency heterodyne principle. Acta Opt. Sin. 2016, 36, 147–157. [Google Scholar]
  6. Liu, F.; Li, J.; Lai, J.; He, C. Full-frequency phase unwrapping algorithm based on multi-frequency heterodyne principle. Laser Optoelectron. Prog. 2019, 56, 011202. [Google Scholar]
  7. Liu, Q.; Li, L.L.; Huang, X.J.; Zhang, H.; Yue, X.B. Hierarchical phase unwrapping for dual-wavelength digital holographic microscopy. J. Opt. 2020, 22, 045701. [Google Scholar] [CrossRef]
  8. Yan, L.P.; Zhang, H.Y.; Zhang, R.; Xie, X.; Chen, B.Y. A robust phase unwrapping algorithm based on reliability mask and weighted minimum least-squares method. Opt. Lasers Eng. 2019, 112, 39–45. [Google Scholar] [CrossRef]
  9. Zhang, A.; Sun, Y.; Gao, N.; Meng, Z.; Zhang, Z. Fringe projection profilometry by ternary-gray encoded phase unwrapping method. Opt. Precis. Eng. 2022, 30, 518–526. [Google Scholar] [CrossRef]
  10. Gu, Q.; Lv, S.; Jiang, M.; Zhang, L.; Zhang, F.; Sui, Q. Wrapped phase demodulation algorithm based on dual-frequency heterodyne and phase-shifting method for structured light imaging. Instrum. Technol. Sens. 2020, 3, 105–109. [Google Scholar]
  11. Xu, Z.; Forsberg, E.; Guo, Y.; Cai, F.; He, S. Light-sheet microscopy for surface topography measurements and quantitative analysis. Sensors 2020, 20, 2842. [Google Scholar] [CrossRef] [PubMed]
  12. Luo, L.; Chen, X.; Xu, Z.; Li, S.; Sun, Y.; He, S. A parameter-free calibration process for a Scheimpflug LIDAR for volumetric profiling. Prog. Electromagn. Res. 2020, 169, 117–127. [Google Scholar] [CrossRef]
  13. He, X.; Kemao, Q. A comparative study on temporal phase unwrapping methods in high-speed fringe projection profilometry. Opt. Lasers Eng. 2021, 142, 106613. [Google Scholar] [CrossRef]
  14. Ha, M.; Xiao, C.; Pham, D.; Ge, J. Complete grid pattern decoding method for a one-shot structured light system. Appl. Opt. 2020, 59, 2674–2685. [Google Scholar] [CrossRef] [PubMed]
  15. Chen, Y.; Han, X.; Zhang, P.; Fu, Y.; Zhong, K.; Zhang, W. 3D measurement method based on S-shaped segmental phase encoding. Opt. Laser Technol. 2020, 121, 105781. [Google Scholar] [CrossRef]
  16. Wu, B.; Liu, K. Few-image projected fringe profilometry using frequency encoding. Laser Optoelectron. Prog. 2024, 61, 2011024-1–2011024-9. [Google Scholar]
  17. Liu, Y.; Wu, Y.; Liu, F. Study on class imbalance based on wrapped optical phase. Opt. Optoelectron. Technol. 2021, 19, 37–44. [Google Scholar]
  18. Deng, G.; Wu, S.; Zhou, S.; Chen, B.; Liao, Y. A robust discontinuous phase unwrapping based on least-squares orientation estimator. Electronics 2021, 10, 2871. [Google Scholar] [CrossRef]
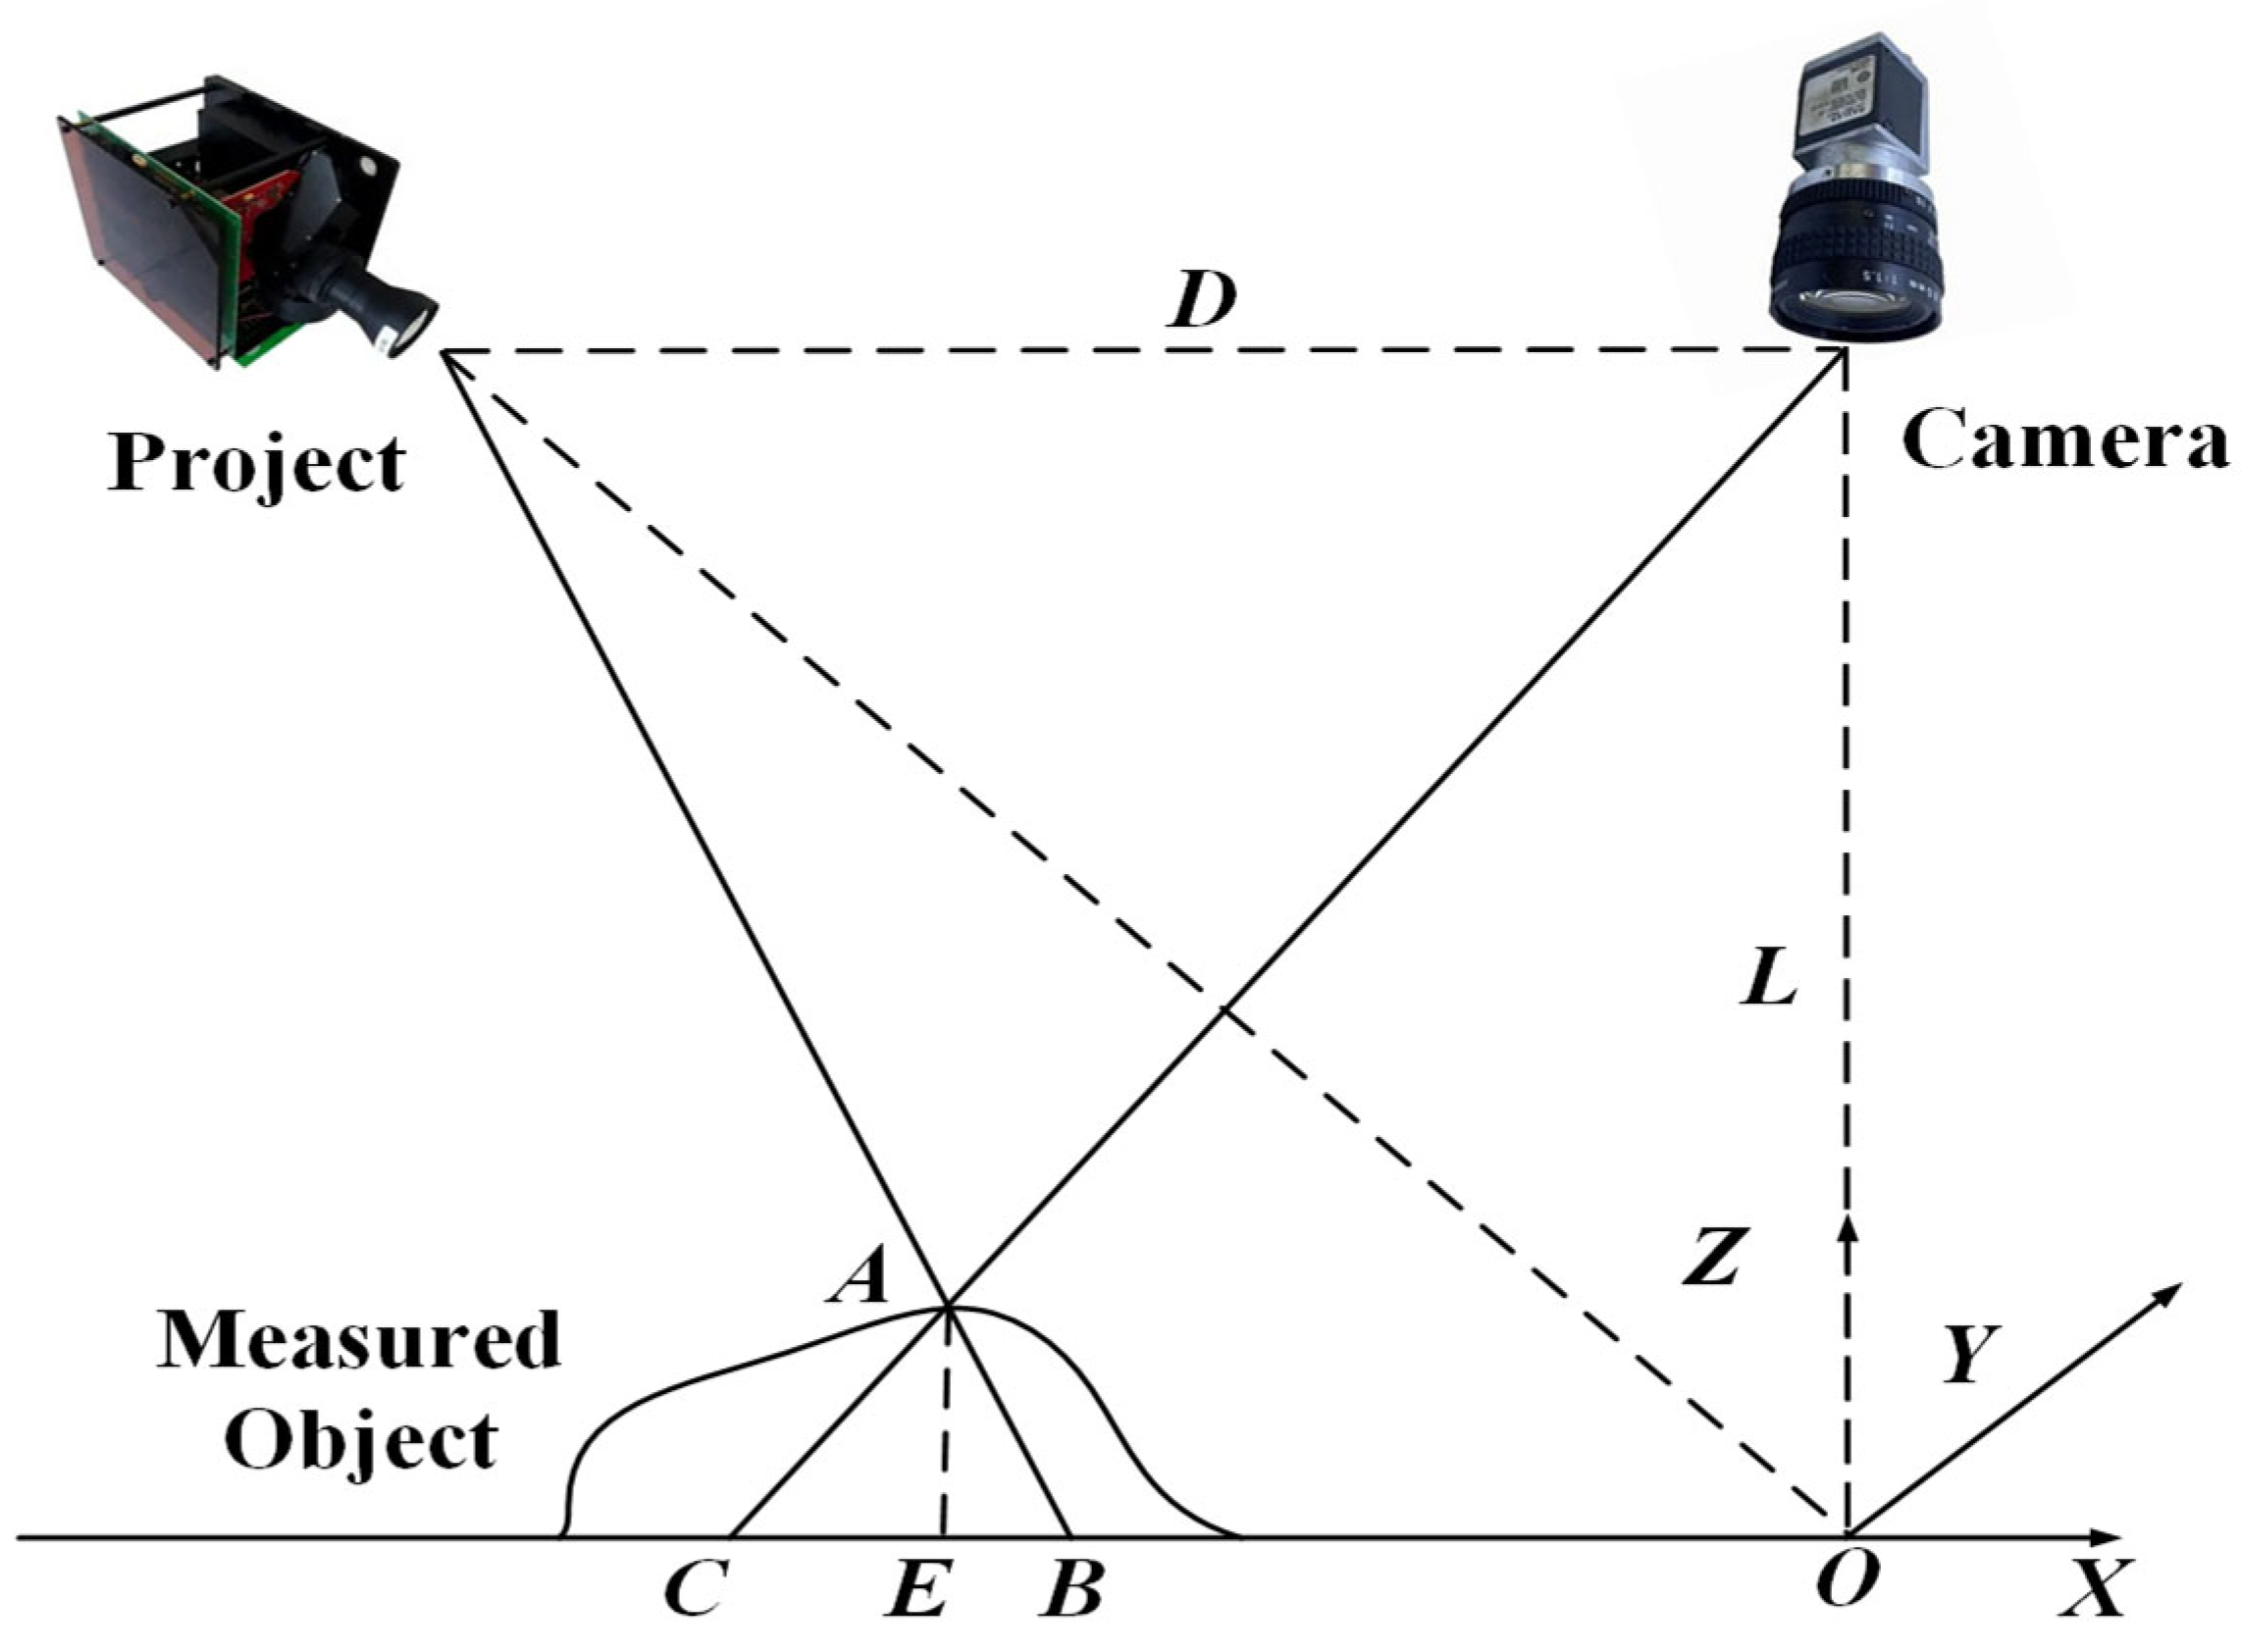
Figure 1. Grating projection measurement system.2.2. Dual-Frequency Outlier Principle.
Photonics 12 00956 g001
Figure 2. Dual-frequency outlier principle.
Photonics 12 00956 g002
Figure 3. Absolute phase map. (a) Global phase distribution; (b) absolute phase on the 500th row; (c) absolute phase on the 500th column.
Photonics 12 00956 g003
Figure 4. Comparison of phase unwrapping after column correction only. (a) Original phase unwrapping; (b) phase unwrapping after column change.
Photonics 12 00956 g004
Figure 5. Comparison of phase unwrapping after column–row correction. (a) Original phase unwrapping; (b) phase unwrapping after column change; (c) phase unwrapping after column–row change.
Photonics 12 00956 g005
Figure 6. The projected fringe profilometry physical system.
Photonics 12 00956 g006
Figure 7. Three samples. (a) Synchronous wheel; (b) cup cover; (c) bearing.
Photonics 12 00956 g007
Figure 8. Single-row absolute phase of synchronous wheels under different methods. (a) Traditional methods; (b) methods in [10]; (c) methods in this paper.
Photonics 12 00956 g008
Figure 9. Global absolute phase of synchronous wheels under different methods. (a) Traditional methods; (b) methods in [10]; (c) methods in this paper.
Photonics 12 00956 g009
Figure 10. Single-row absolute phase of cup covers under different methods. (a) Traditional methods; (b) methods in [10]; (c) methods in this paper.
Photonics 12 00956 g010
Figure 11. Global absolute phase of cup covers under different methods. (a) Traditional methods; (b) methods in [10]; (c) methods in this paper.
Photonics 12 00956 g011
Figure 12. Single-row absolute phases of bearings under different methods. (a) Traditional methods; (b) methods in [10]; (c) methods in this paper.
Photonics 12 00956 g012
Figure 13. Global absolute phase of bearings under different methods. (a) Traditional methods; (b) methods in [10]; (c) methods in this paper.
Photonics 12 00956 g013
Figure 14. Reconstructed point cloud images of the three samples under the method in this paper. (a) Synchronizer wheel; (b) cup cover; (c) bearing.
Photonics 12 00956 g014
Figure 15. Experimental results of the step block. (a) Fringe projection image of the step block; (b) point cloud of the step block.
Photonics 12 00956 g015
Table 1. Accuracy of three-layer step block.
12345
Difference in height between I and II/mm9.95449.96359.957910.03519.9691
Absolute error between I and II/mm0.04560.03650.04210.035110.0301
Difference in height between II and III/mm9.969310.04779.96279.97639.9574
Absolute error between II and III/mm0.03070.04770.03730.02370.0426
Disclaimer/Publisher’s Note: The statements, opinions and data contained in all publications are solely those of the individual author(s) and contributor(s) and not of MDPI and/or the editor(s). MDPI and/or the editor(s) disclaim responsibility for any injury to people or property resulting from any ideas, methods, instructions or products referred to in the content.