Article

Improving the High-Pressure Sensing Characteristics of Y2MoO6:Eu3+ Using a Machine Learning Approach

Institute of Physics Belgrade, University of Belgrade, 11080 Belgrade, Serbia
*
Authors to whom correspondence should be addressed.
Photonics 2025, 12(10), 1024; https://doi.org/10.3390/photonics12101024
Submission received: 12 August 2025 / Revised: 8 October 2025 / Accepted: 14 October 2025 / Published: 16 October 2025

Abstract

In this study, we explore the potential of applying machine learning (ML) to enhance high-pressure luminescence sensing. We investigate the luminescence behavior of Y2MoO6:Eu3+, synthesized via a self-initiated, self-sustained reaction. Emission spectra were collected under varying pressures using a 405 nm laser diode and an AVANTES AvaSpec 2048TEC USB2 spectrometer. An analysis of the pressure-dependent curve, based on the intensities of two key peaks, indicates a possible crystal phase transition or another underlying physical phenomenon. Moreover, the non-unique relationship between pressure and peak intensity limits its effectiveness for precise sensing. To overcome this challenge, we employ an ML-based approach, combining Uniform Manifold Approximation and Projection (UMAP) for data visualization with a deep neural network to estimate pressure directly from the full luminescence spectrum. This strategy significantly extends the usable pressure range of Y2MoO6:Eu3+ up to 12 GPa, representing a marked improvement over conventional methods.

1. Introduction

The growing interest in using luminescent materials for high-pressure measurement, often doped with rare earths, highlights their potential in various industrial and scientific applications where the monitoring of this crucial physical parameter is essential [1,2,3,4,5,6,7,8,9].
This paper reports on a machine learning analysis of the high-pressure luminescence properties of Y2MoO6:Eu3+. The material, known for its excellent thermal and chemical stability due to the presence of Eu3+ ions in non-centrosymmetric sites [10,11,12], was prepared using a self-initiated and self-sustained reaction method, as detailed in a previous study [13]. Both the Y2MoO6:Eu3+ material and the R1 emission line of ruby can be excited by blue light, which makes Y2MoO6:Eu3+ a promising candidate for high-pressure measurements.
According to the Judd–Ofelt (J-O) theory, materials doped with the Eu3+ ion are excellent candidates for optoelectronic devices because the luminescence of Eu3+ is highly sensitive to its local crystal environment [8,10,14,15]. For this reason, the Eu3+ ion is frequently used as a probe to monitor subtle changes in a material’s crystalline structure [8,16].
The unique properties of the Eu3+ ion are a direct result of its 4 f electrons. In a centrosymmetric structure, the outer shell electrons shield the 4 f electrons from the environment, which forbids f f electric dipole transitions and allows only magnetic dipole transitions. Conversely, in a non-centrosymmetric structure, electric dipole transitions can occur due to an interaction with an odd-parity crystal field [8,14,15].
High-pressure techniques offer a powerful way to systematically alter a crystal’s structure by changing interatomic bond lengths, bond angles, and atomic positions [17]. As Halevy et al. proposed, increasing external pressure has a similar effect on the host’s crystal structure as when increasing temperature [18]. This manipulation of the crystal field directly impacts the luminescence properties of the material, which is why high pressure is used as a tool to study and tune these characteristics [8,16].
Since the discovery of pressure measurement via the luminescence shift of ruby (Cr3+:Al2O3) [19], the ruby sensor has become a widely used pressure gauge in a variety of experiments. Although proposed long ago, the ruby sensor is still being analyzed and improved. In [20], the authors propose a calibration of ruby, samarium-doped strontium tetraborate (Sm2+:SrB4O7), and samarium-doped yttrium aluminum garnet (Sm3+:YAG) using Raman and fluorescence spectra, with measurements conducted over the temperature range of 296–850 K and pressure range of 0–55 GPa. In [21], the authors measured the luminescence shifts of the ruby’s R1- and R2-lines and the line of (5D07F0) from Sm2+:SrFCl corresponding to the melting pressure of mercury.
A comprehensive review and comparison of various high-pressure sensors is provided in [22], which clearly demonstrates that the search for improved high-pressure sensors is still ongoing. The high thermal and chemical stability of Y2MoO6:Eu3+ is a necessary performance feature for its use as a pressure sensor, since such sensors are often employed under extreme conditions.
While recent studies in high-pressure sensing have largely concentrated on developing new luminescent probes, advancements in spectral data analysis methods have been comparatively limited. This gap highlights a promising opportunity for machine learning (ML) algorithms, which have seen a surge of interest for investigating various scientific and social data sources in recent publications [23,24,25,26] and the references therein.
Machine learning (ML) is increasingly being employed to analyze luminescence, near-infrared, and other spectral data [27,28,29,30,31,32,33,34,35,36]. Traditional analysis methods, however, typically rely on a single, empirically chosen spectral parameter. While this approach is widely used for remote thermometry, publications on high-pressure measurements using luminescence are less numerous. Both fields, however, often share this same calculation method, highlighting a common limitation in their analytical techniques.
The advantage of the ML approach lies in its ability to account for all features of the measured signal within the selected spectral range, including peak intensity, intensity ratios, and spectral shifts. In this sense, regardless of the material analyzed, ML offers a more comprehensive solution compared to individual calculation techniques.
While our previous research on the SrCeO4:Eu3+ phosphor [37] successfully used a single spectral feature (e.g., intensity ratio or spectral shift) for thermometric and high-pressure measurements, this approach inherently limits accuracy and resolution by only partially utilizing the available spectral data. The method was effective in that specific case because the phosphor did not undergo a phase transition.
However, a similar single-parameter approach is insufficient for the Y2MoO6:Eu3+ phosphor studied here, as a simple calibration curve fails to provide accurate results across the full measurement range.
In contrast, the deep learning neural network approach developed by the authors of [36] demonstrates the potential to fully exploit temperature-dependent spectral data by extracting multiple features, an approach that is necessary to overcome the challenges presented by our current material.
Our study investigates the pressure effects on the optical properties of a Y2MoO6:Eu3+ nanophosphor, with a focus on improving the accuracy of high-pressure measurements using a machine learning (ML) approach. To our knowledge, this is the first time ML has been applied to enhance high-pressure measurements in this manner. For our analysis, we used the Uniform Manifold Approximation and Projection (UMAP) method for initial data visualization and a deep learning artificial neural network to predict pressure intensity based on luminescence spectral data.

2. Materials and Methods

The Y2MoO6:Eu3+ powder was synthesized using a self-initiated and self-sustained reaction method [13]. To ensure full crystallinity, the material was then calcined at different temperatures, as detailed in [13]. The Y2MoO6 examined in this study was doped with 5 at.% Eu3+ and sintered at 800 °C. The resulting material exhibits an average grain size of 30–50 nm, and all synthesized samples correspond to single-phase monoclinic Y2MoO6 (JCPDS card 00-057-0517) [13]. The photoluminescence emission spectrum was recorded using a 405 nm laser diode for excitation and an AVANTES AvaSpec 2048TEC USB2 spectrometer (Lafayette, CO, USA) for detection, providing a wavelength resolution of 0.11 nm. Measurements were acquired with an integration time of 30 ms and averaged over five scans, and all spectra were radiometrically corrected. The spectrometer features a 12-bit analog-to-digital resolution. The laser output power was 5 mW, with an estimated 3 mW reaching the sample. Given a spot size of 10 µm, the corresponding power density was approximately 7639 W/cm2. The pressure dependence of the Y2MoO6:Eu3+ emission spectrum was then measured, and a pressure-dependent plot was constructed based on the intensity ratio of two prominent peaks.
While the experimental setup for luminescence measurements as a function of temperature and pressure is described in [37], we will now focus specifically on the setup used for high-pressure measurements.

2.1. Experimental Setup for High-Pressure Measurements

High pressure was generated using a Membrane Diamond Anvil Cell (MDAC) manufactured by BETSA, which featured a 300 μm culet diameter which employed two 300 micron culet diameter diamonds (see Figure 1). The fundamental principle of a Diamond Anvil Cell (DAC) is to create very high pressures by applying a reasonable mechanical force to a tiny surface area (the culet). While earlier DAC models used a screw to apply this force, the MDAC achieves fine control and adjustment through pressurized helium, which presses a circular membrane against a piston.
The powdered sample, along with a pressure transmitting fluid and a small ruby sphere, was placed inside a metal gasket. The gasket was pre-indented between the diamond anvils to create a secure, leak-proof seal. The gasket diameter is D = 100 μm and thickness t = 60 μm. The ruby sphere has a diameter of 10 μm. We used a 4:1 mixture of methanol and ethanol as the pressure transmitting medium to ensure a uniform pressure distribution on the sample.
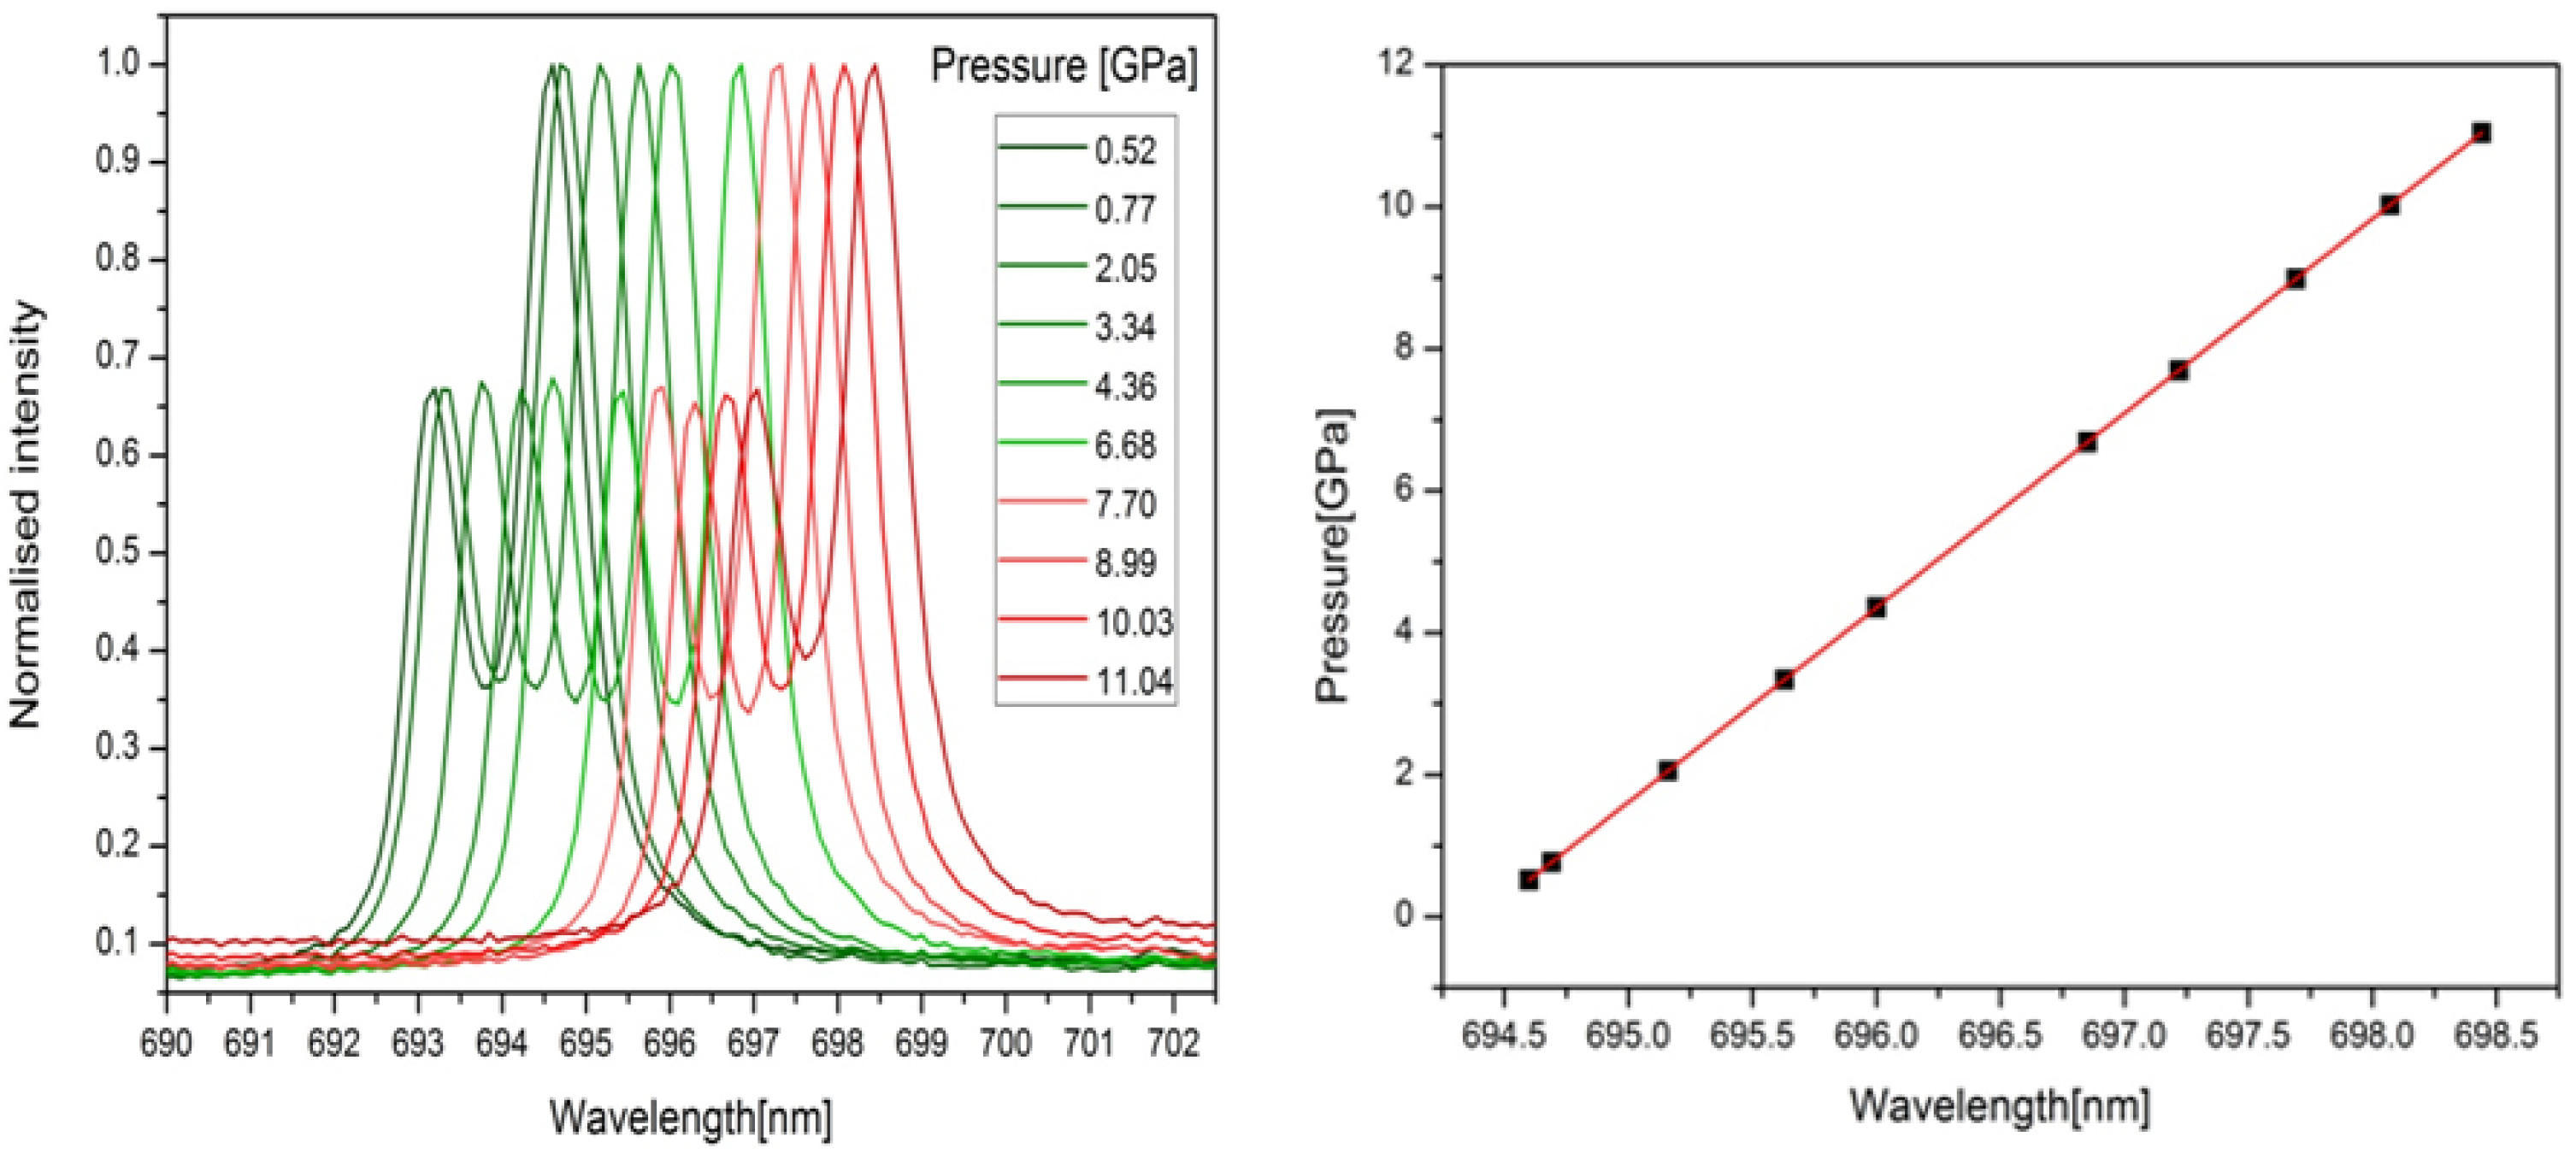
Since the diamond anvils are optically transparent in this pressure range, we were able to perform optical measurements on the pressurized sample. The applied pressure was accurately determined by measuring the redshift of the ruby R1 luminescence line. In our experimental setup, the pressure-induced red shift of ruby luminescence is shown in Figure 2. The ruby pressure scale was originally established decades ago [19], and in this work, we adopt the calibration provided in Figure 1 of [38]. We assume a linear dependence of wavelength shift on pressure, with a coefficient of 0.3246 nm/GPa, and an associated uncertainty of approximately 5% as reported in [38].

2.2. Machine Learning Analysis

To perform our machine learning (ML) analysis, we used the Solo+Mia software package (Version 9.1, Eigenvector Research Inc., Manson, WA, USA) [39,40]. This user-friendly software was chosen for its accessibility, allowing individuals without programming expertise to analyze data.
Early on, we determined that our number of measurements was insufficient for effective ML training. To overcome this, we employed an image data augmentation technique, as surveyed in [41], to expand our training dataset. Specifically, we generated new data by adding random noise to the original measured samples, a method we successfully utilized in a previous study [42]. Numerous techniques exist to achieve pattern recognition that is robust to variations in lighting, viewing angles, and distances. In contrast, spectral data recognition is considerably simpler; therefore, we introduced only random noise.

3. Results

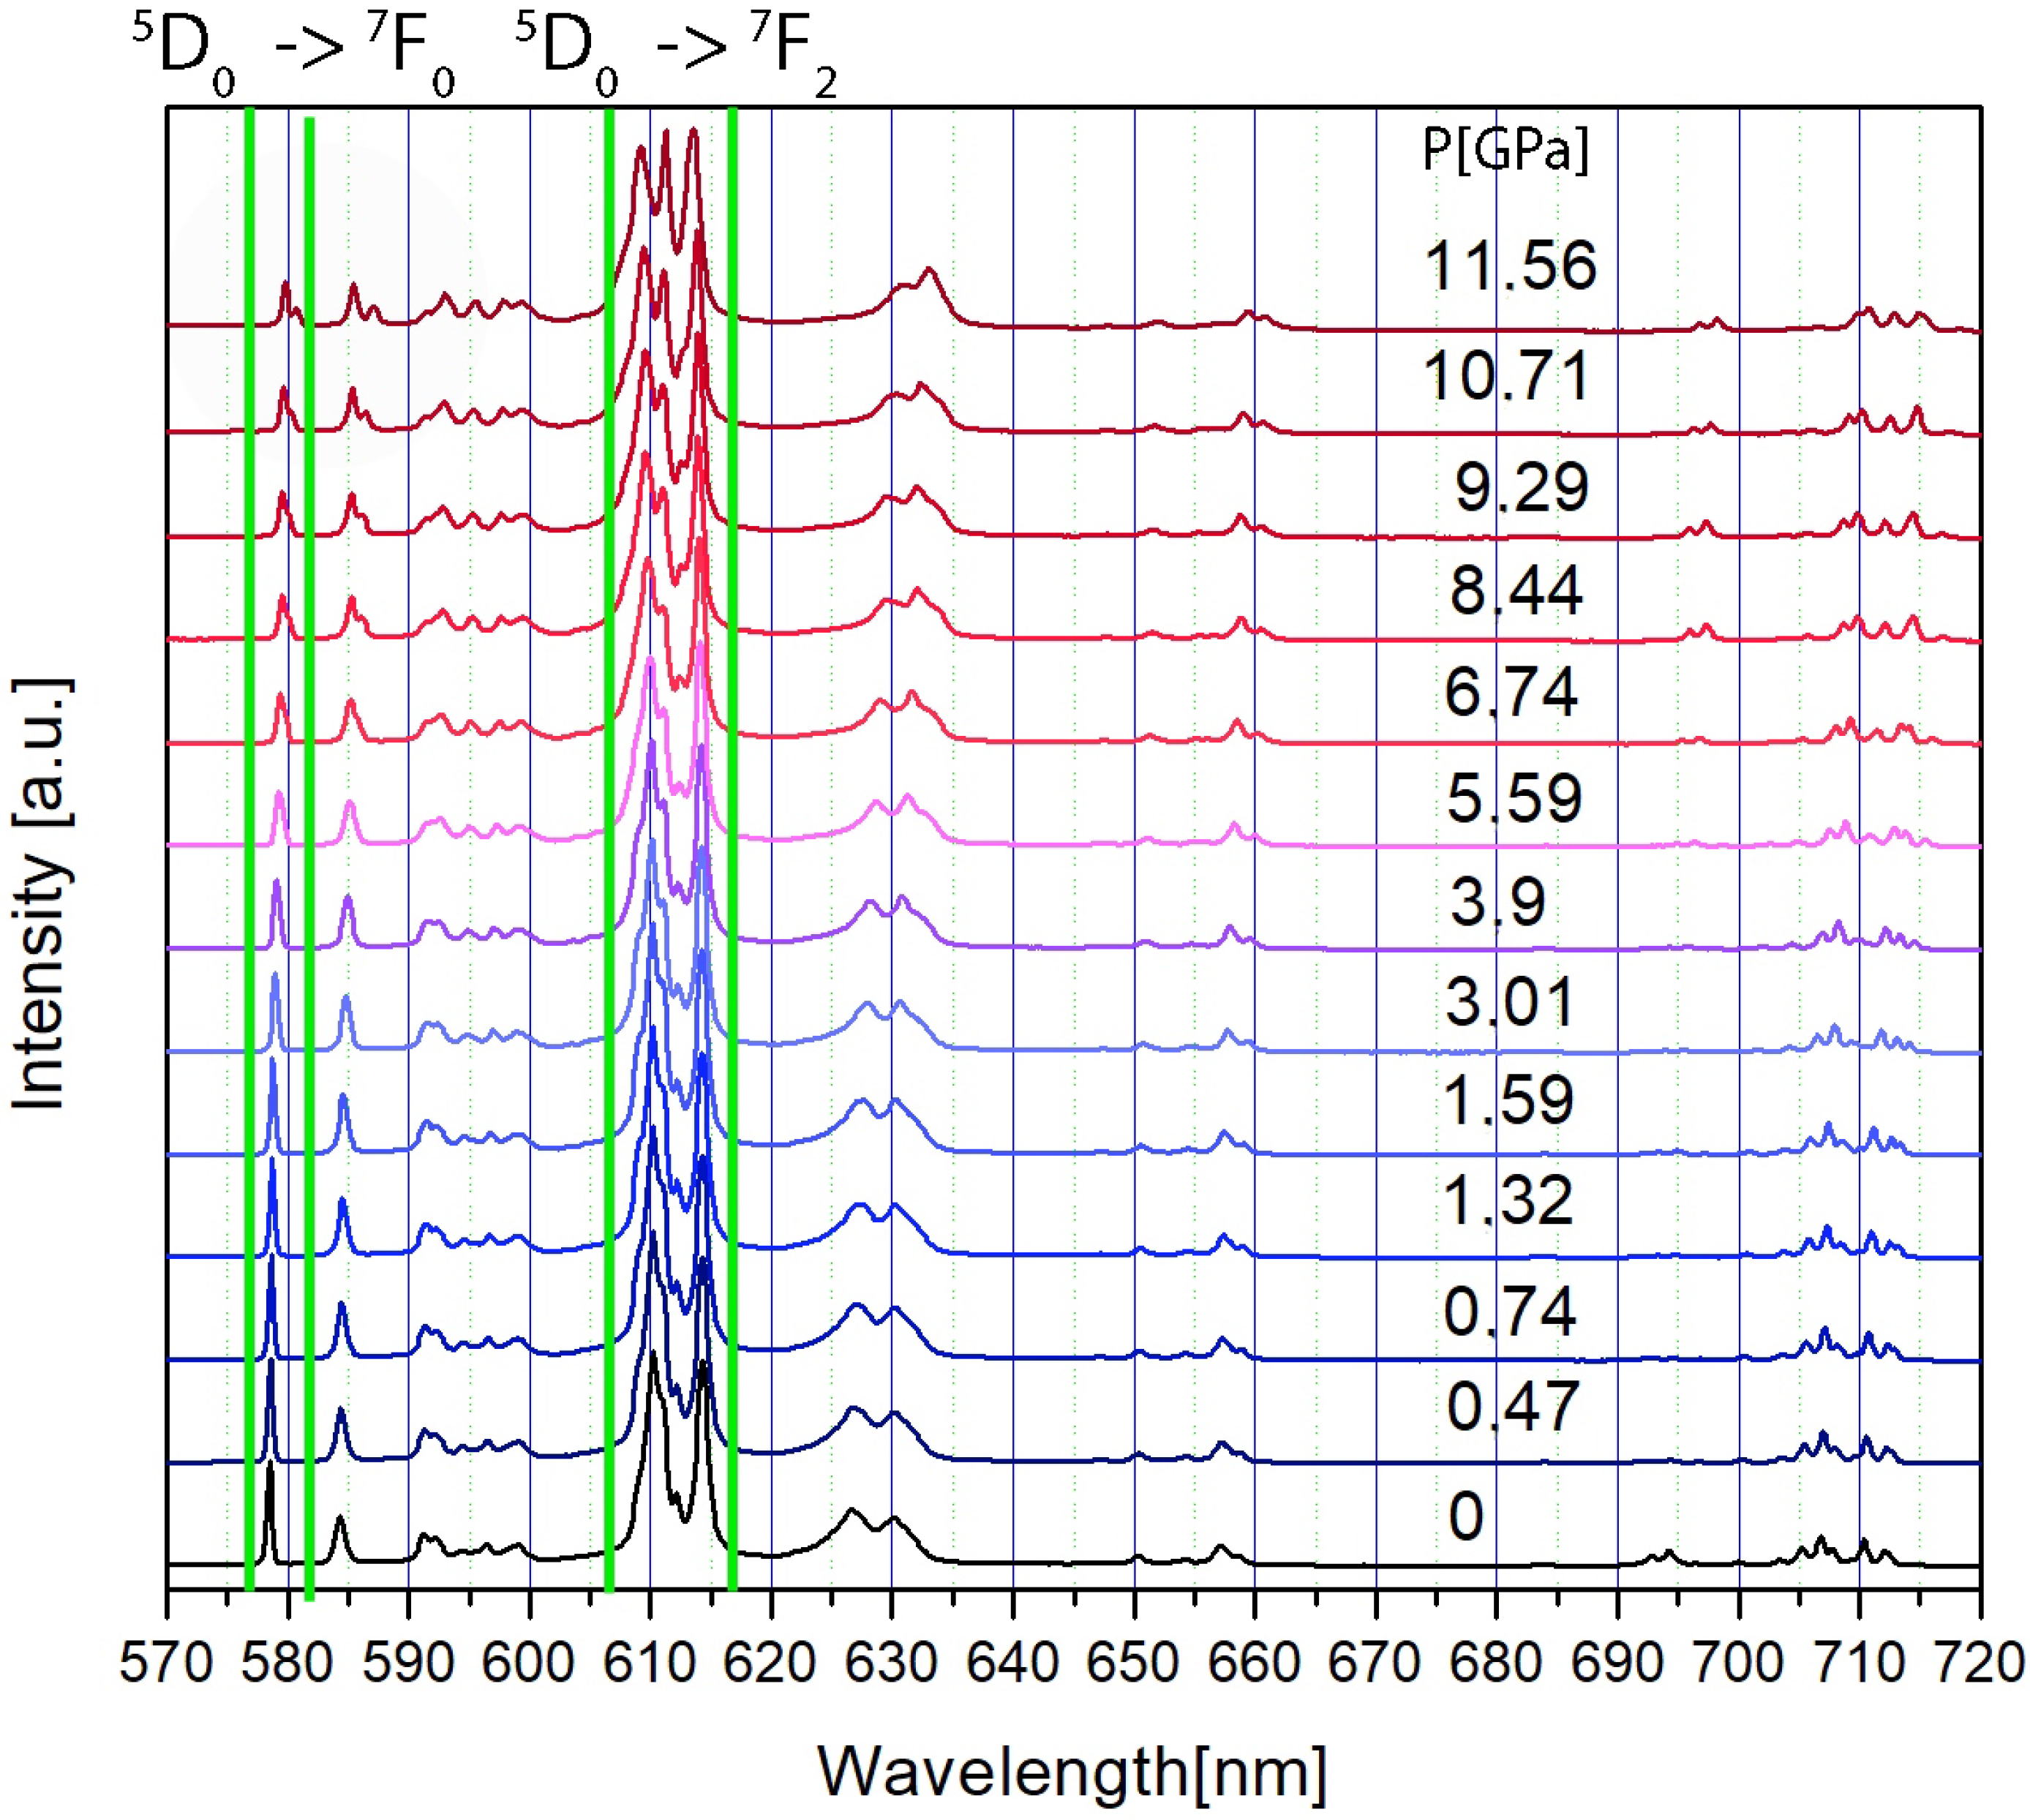
To analyze how high pressure affects the photoluminescence emission of the Y2MoO6:Eu3+ nanophosphor, we measured its spectral responses at various pressures. The resulting luminescence spectra are presented in Figure 3. The green lines in Figure 3 indicate the region of interest for calculating the intensity ratio. From the outset, we selected the peak at 578 nm (at atmospheric pressure) for all calculations due to its higher intensity. Accordingly, the intensity ratio was calculated using the peaks at 578 nm and 614 nm (referenced to their positions at atmospheric pressure), and their intensities were tracked as they shifted under pressure.
Rare earth ions are well known for their high sensitivity to local symmetry, which makes any change in the crystal structure observable in their luminescence spectra [43]. The paper by Zhang et al. [8] provides a detailed explanation of how pressure-induced phase transitions in a crystal structure affect the luminescence of the Eu 3 + ion.
Specifically, as pressure increases, two key changes occur in the luminescence spectrum:
Red shift of emissions: This is attributed to the expansion of the Eu 3 + 4 f orbital [8].
Change in relative intensity ratio: This variation is caused by a change in the crystal field, which is a direct consequence of the applied pressure [8].
Both of these effects could be seen in Figure 3.
Pressure-induced changes to the crystal lattice parameters also disturb the energy level positions, particularly those of the 5D1 and 5D0 states. This variation, along with changes in the charge transfer region, increases the probability of non-radiative transitions. As shown in Figure 3, the applied pressure predominantly affects the 5D0 level.
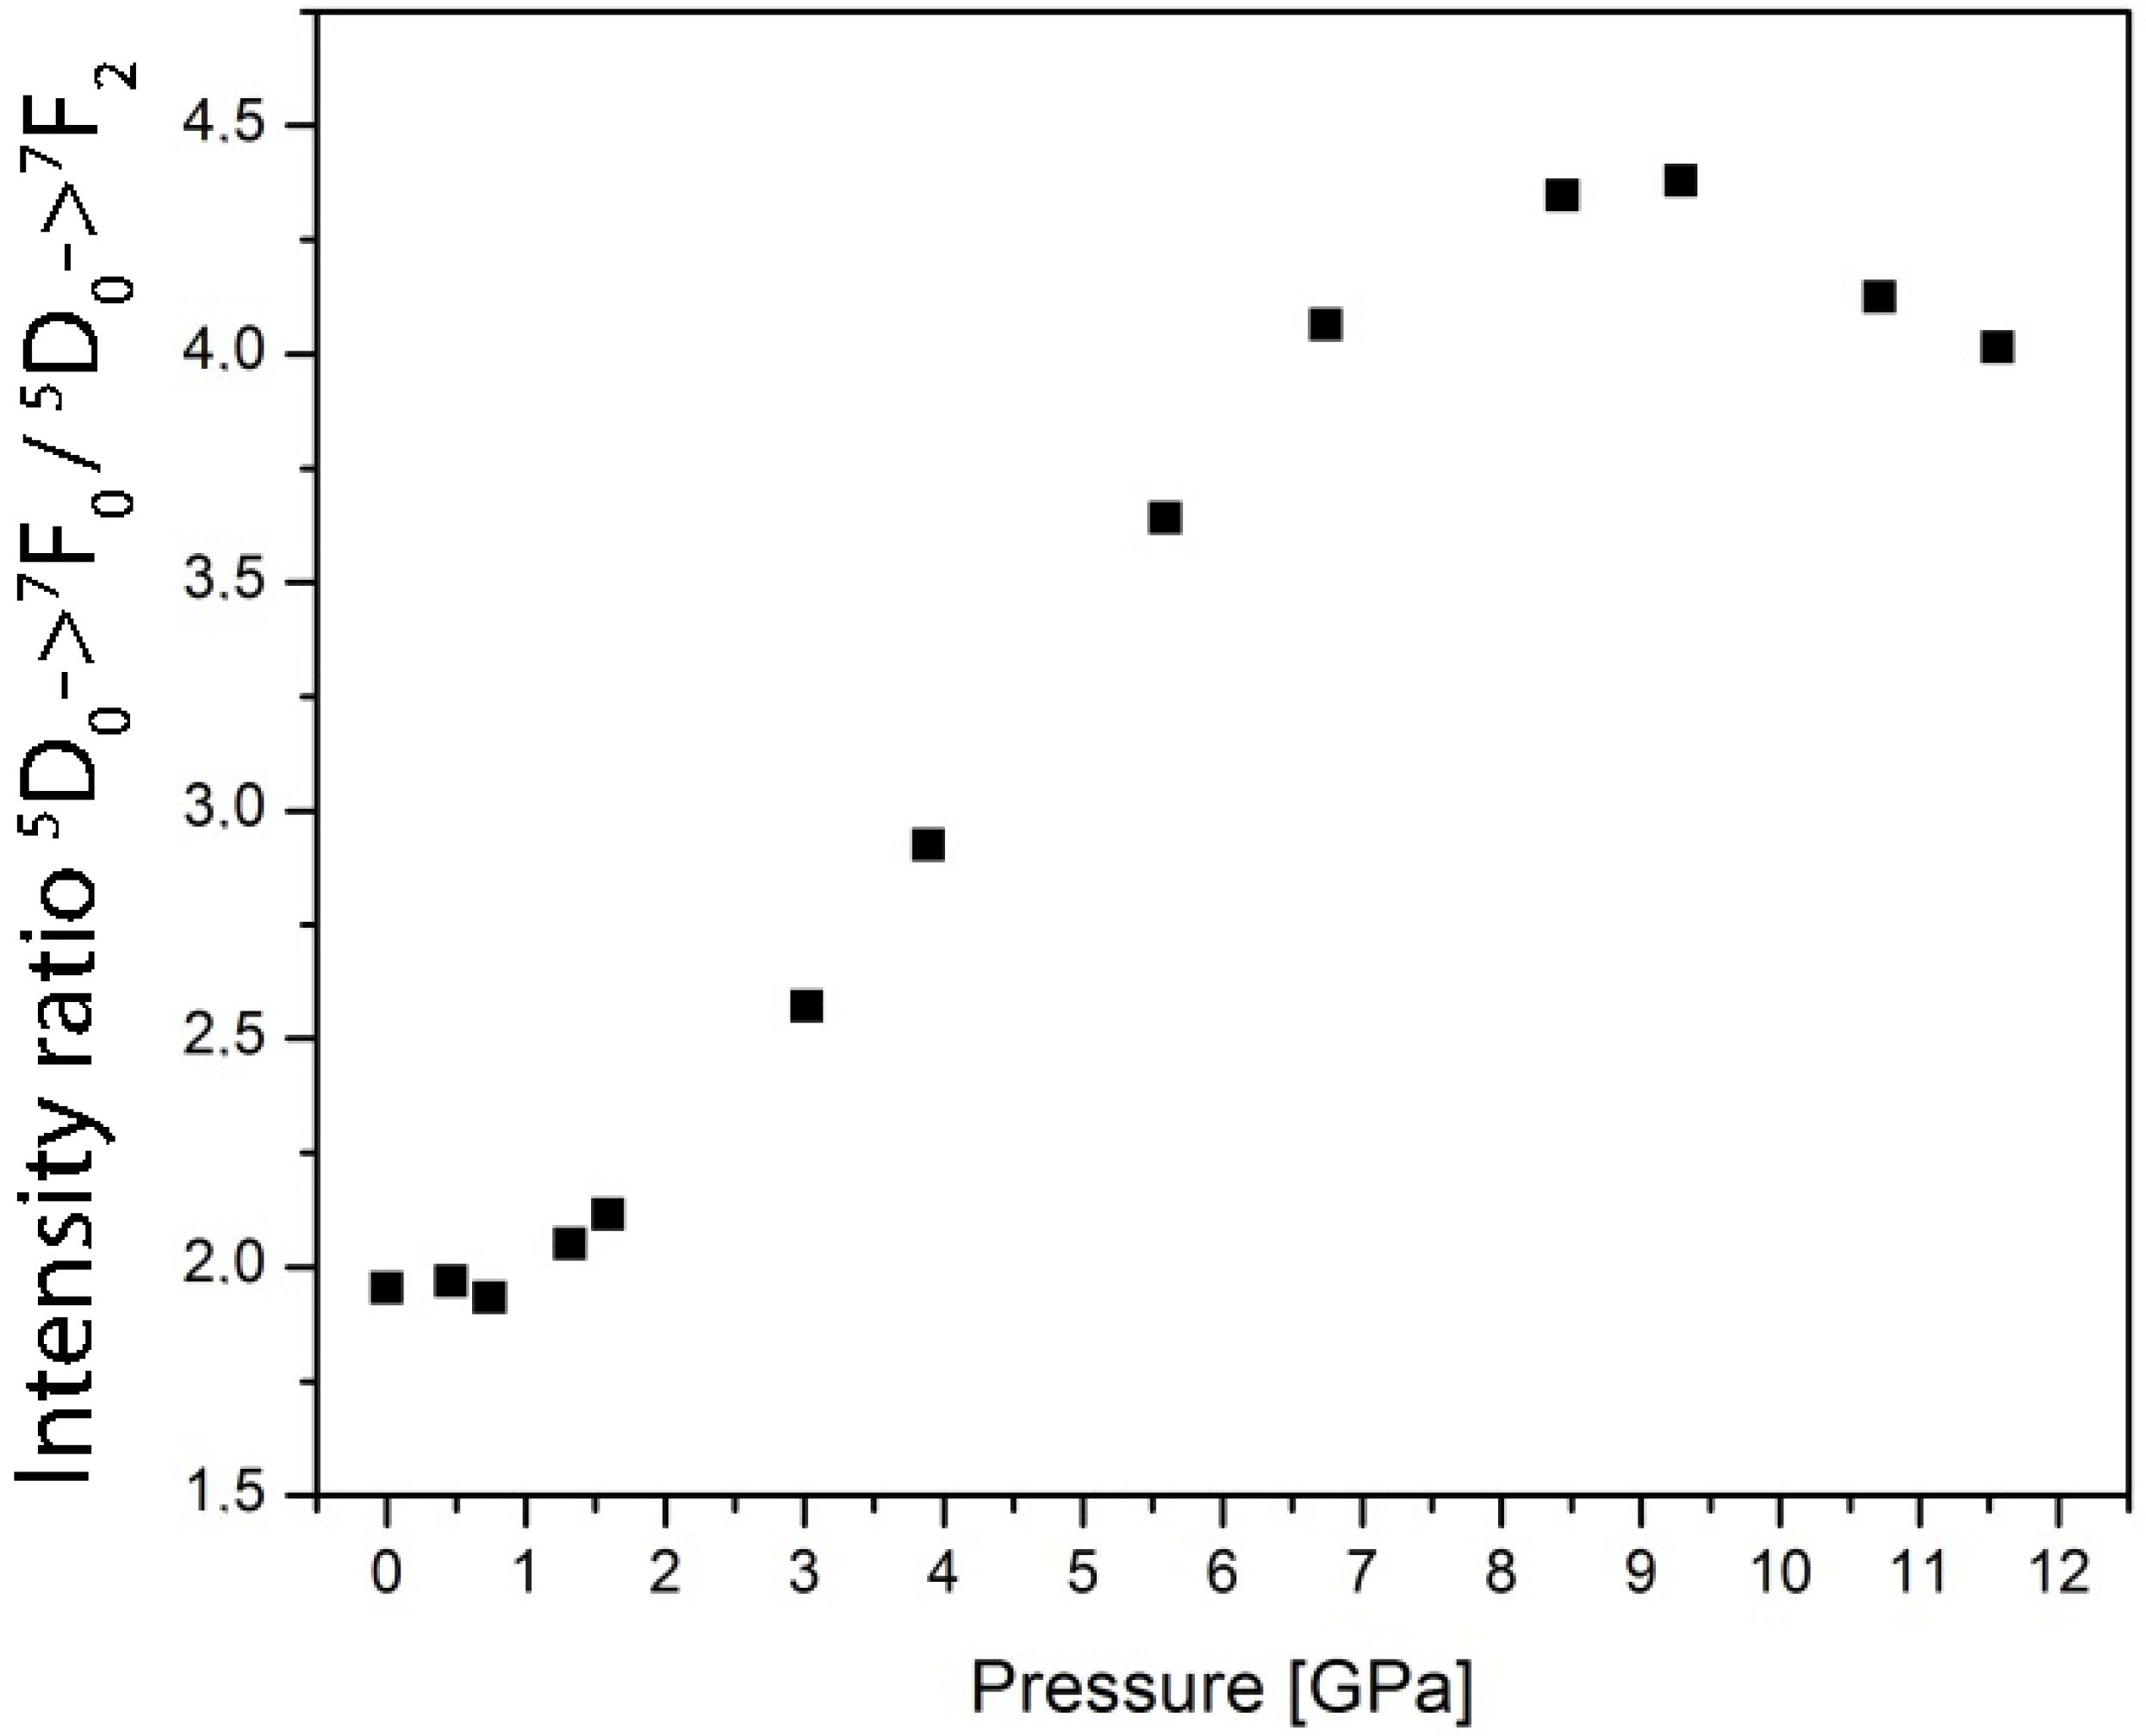
The exact positions of the luminescence peaks used for calculating intensity ratios are at 578 nm (5D07F0) and 614 nm (5D07F2) at atmospheric pressure. A slight variation in the intensity of the most prominent 5D07F2 transition line can also be observed in Figure 3. The resulting intensity ratios of the emission lines from the 5D0 states are presented in Figure 4.
The spectra shown in Figure 3 clearly exhibit peak shifts. For calculating the intensity ratio, we used the peaks at 578 nm and 614 nm (corresponding to their positions at atmospheric pressure) and tracked their intensities as they shifted under pressure.
A change in the luminescence spectrum, such as a deformation or discontinuity, indicates that a single physical behavior model is insufficient to describe the data. Such discrepancies become evident when the measured points cannot be accurately fitted with a single curve, suggesting that different segments of the data correspond to distinct physical models.
As shown in Figure 4, the intensity ratio calibration data for the Y2MoO6:Eu3+ nanophosphor exhibits these discrepancies across the measured pressure range. Consequently, the resulting curve lacks a unique and consistent relationship between the peak intensities and pressure, making it unsuitable for a reliable calibration method.
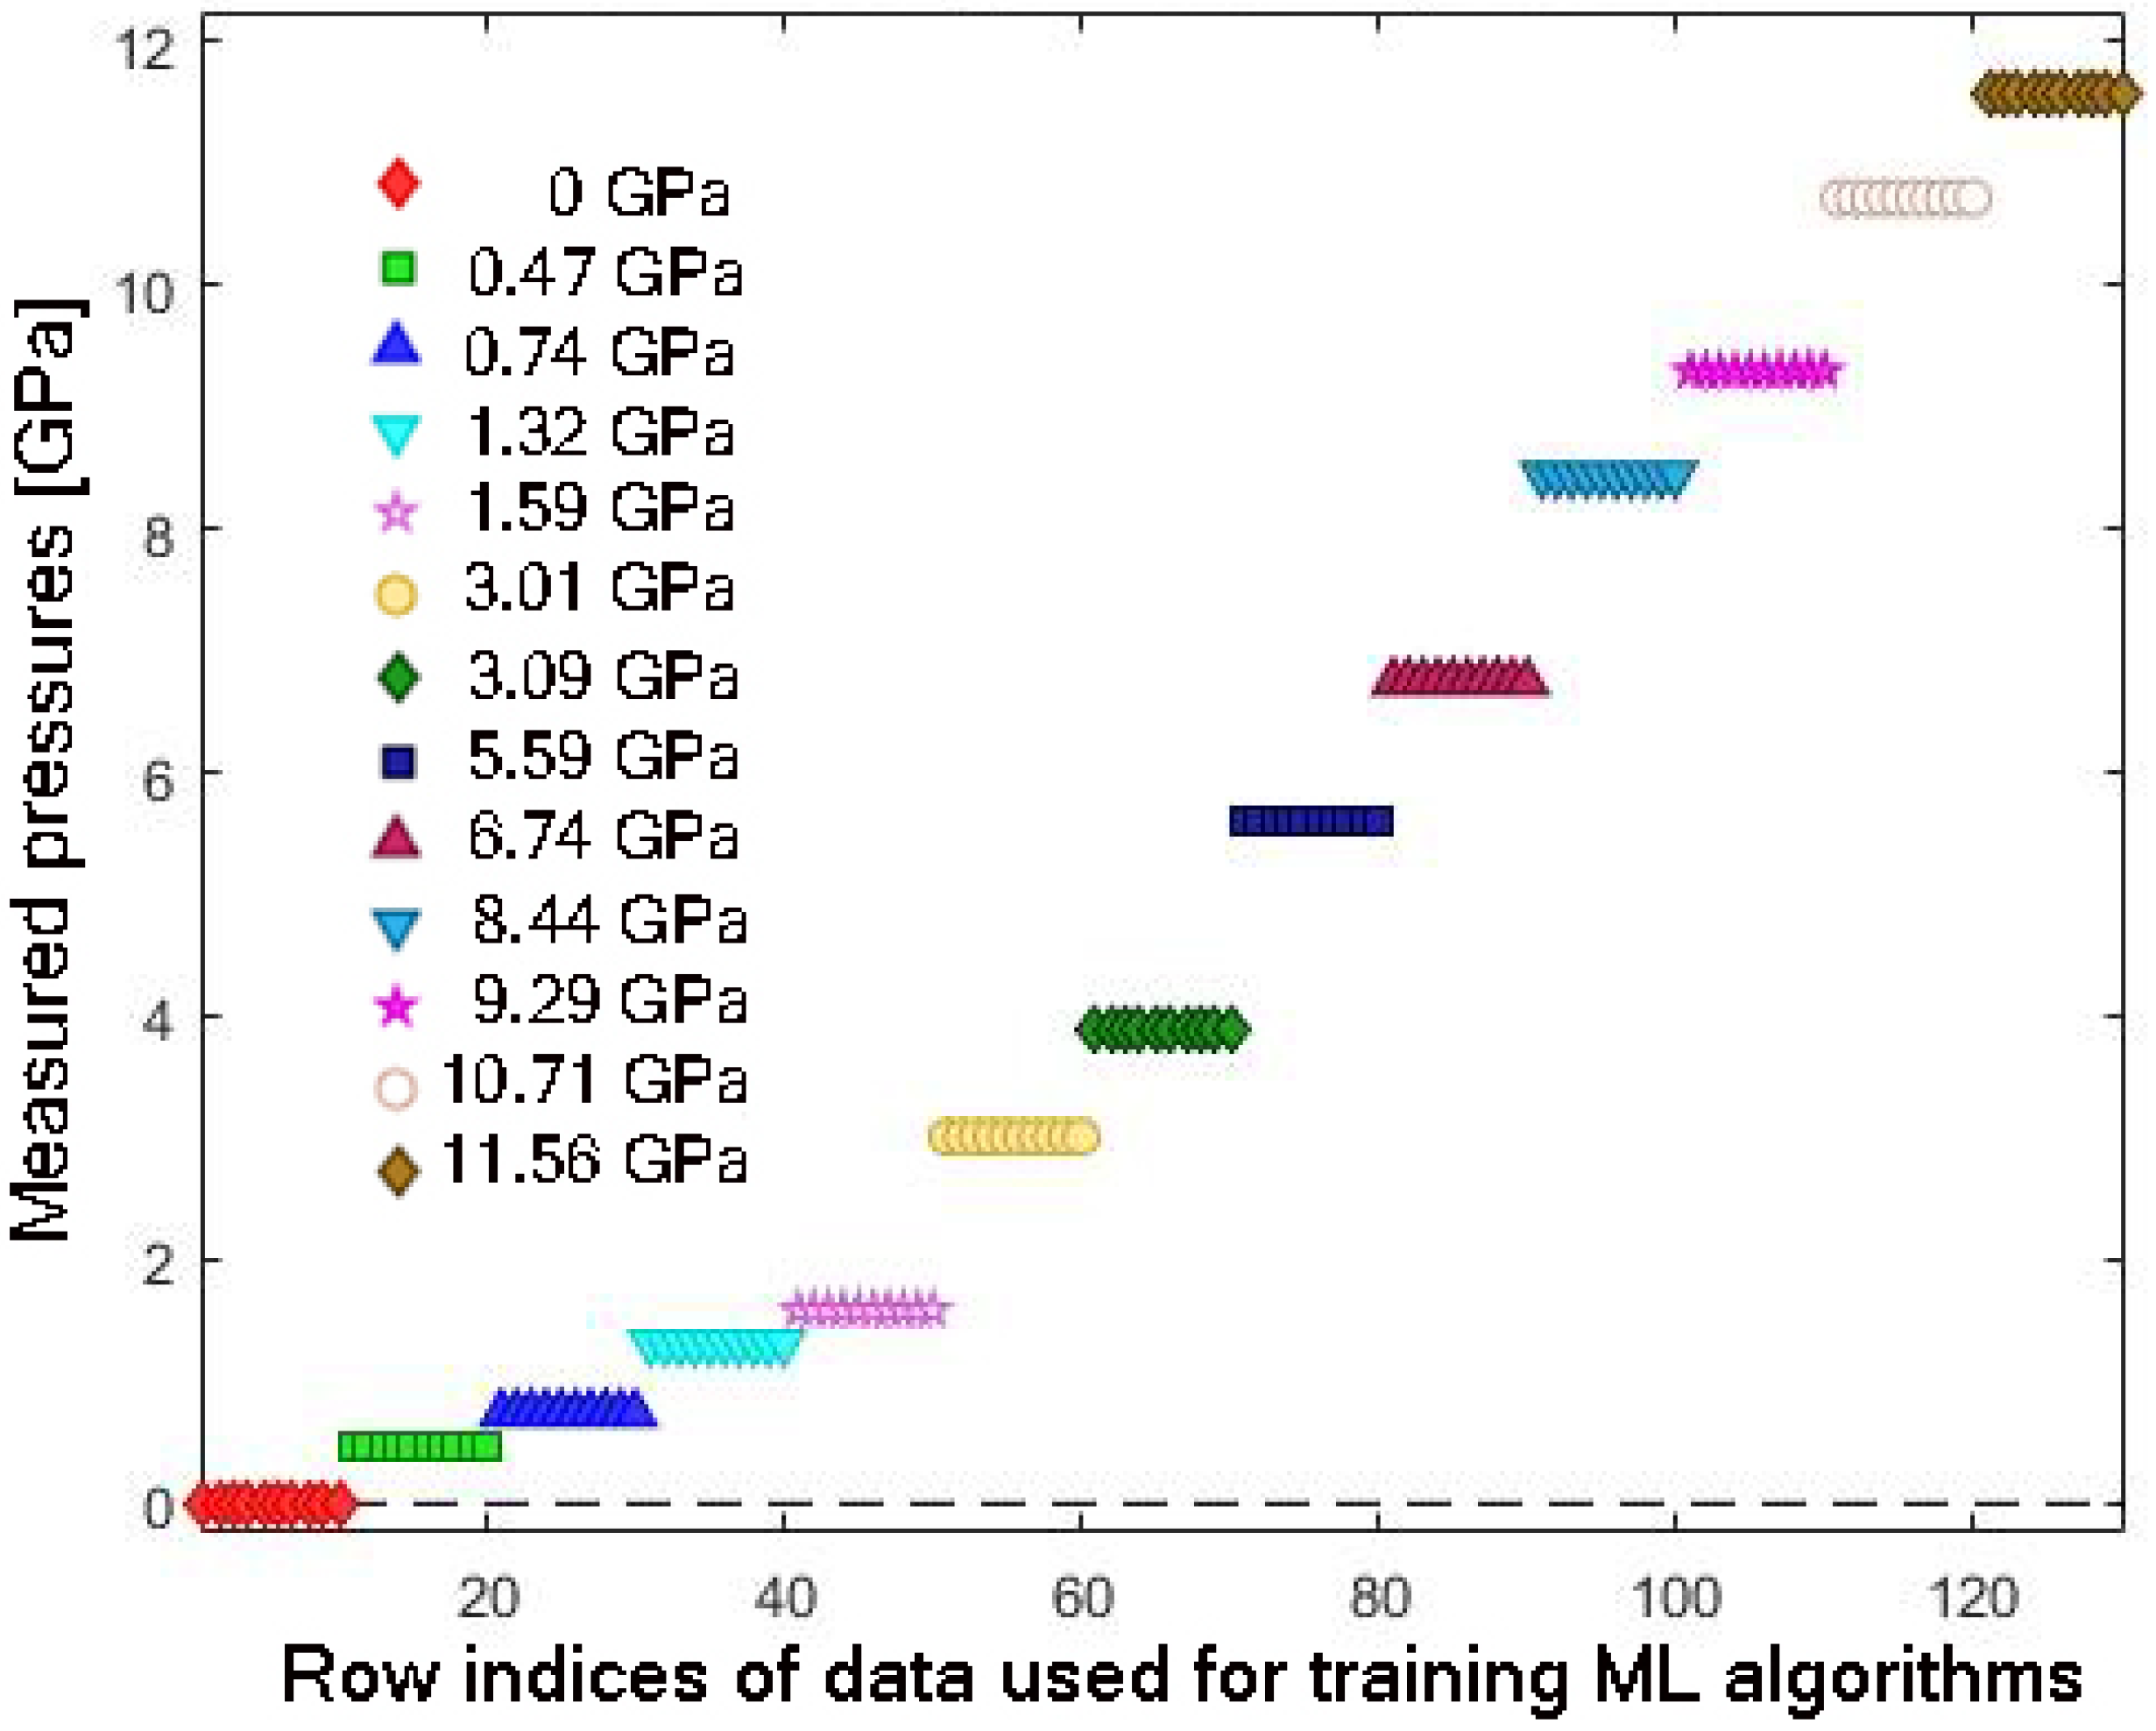
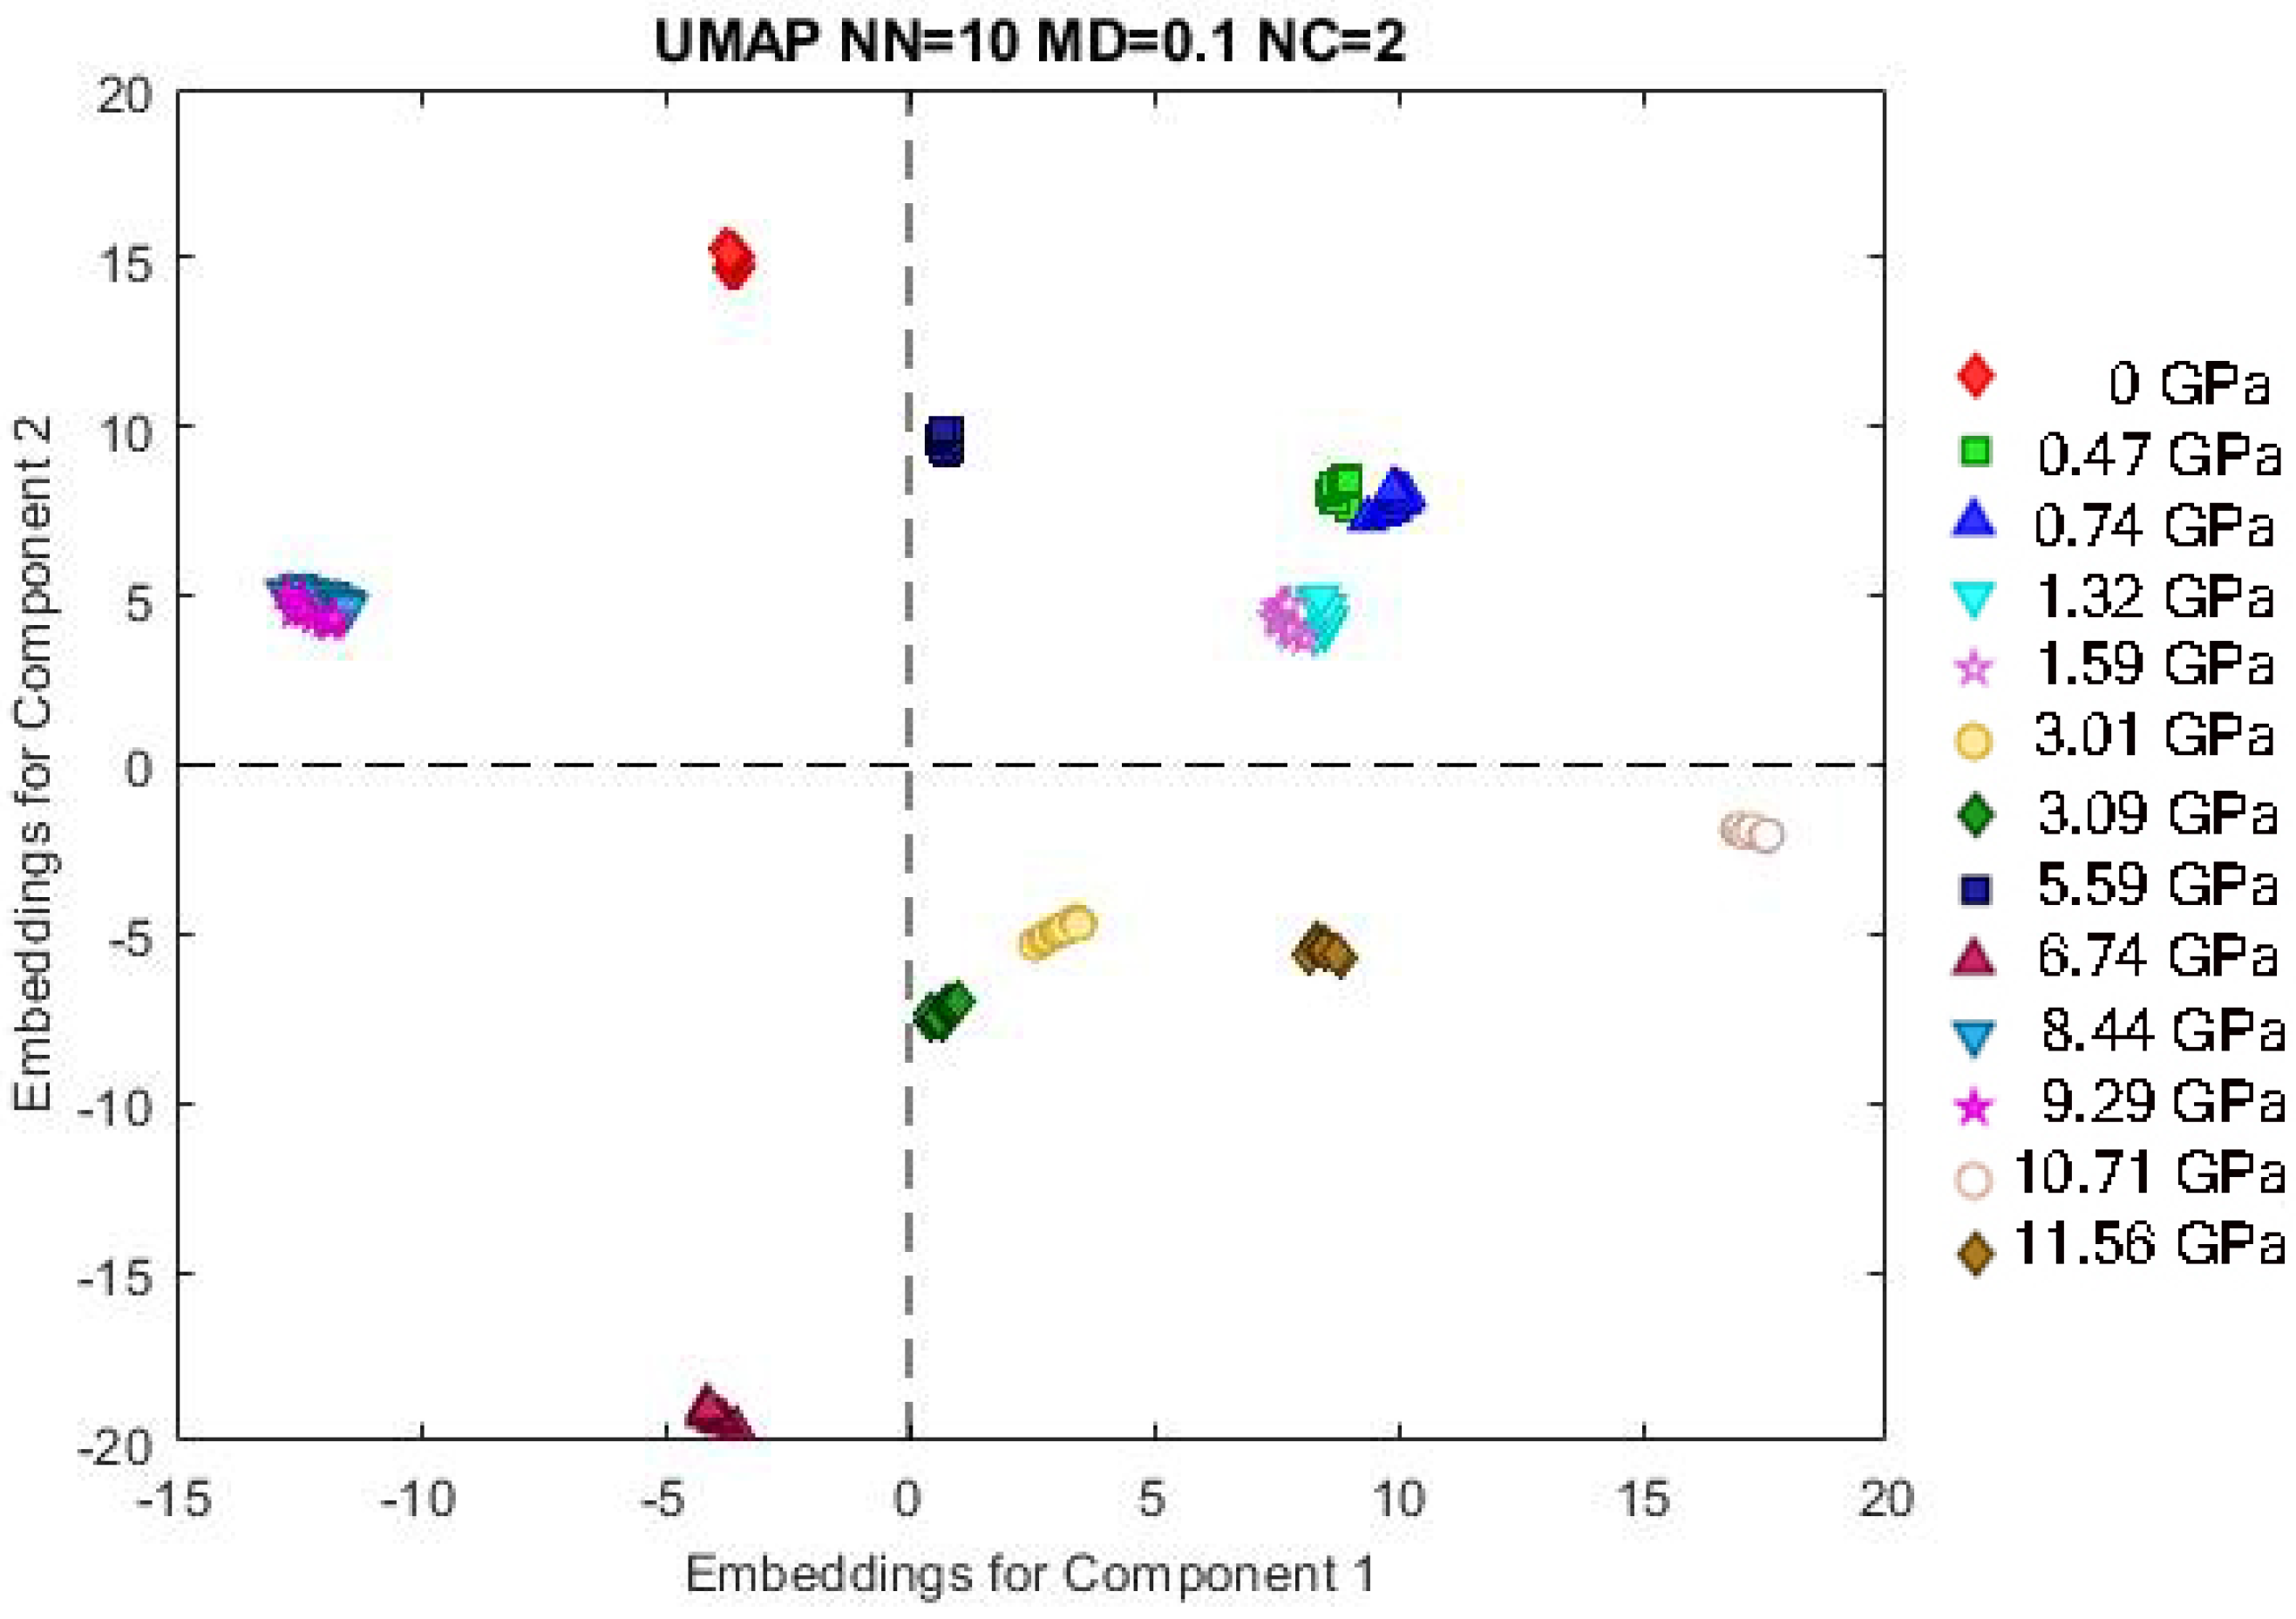
To enhance our analysis, we applied machine learning techniques to the data. For a clearer visualization of the results from the UMAP [44] and deep learning methods, we employed a color-coding system. Figure 5 shows the specific color scheme used to represent the different measured pressures of the Y2MoO6:Eu3+ sample. The training data is structured as a matrix, with each row representing a spectrum measured at a specific pressure.
To evaluate the effectiveness of the constructed training set and the actual diversity of the data, we applied several visualization techniques. These visualization techniques are based on dimensionality reduction in the data. The best results were obtained using UMAP, so only UMAP clustering is presented here.
Figure 6 shows the UMAP clustering of the high-pressure data for the Y2MoO6:Eu3+ sample. The data points are clearly grouped, with a strong correlation between the proximity of points in the intensity ratio data (from Figure 4) and their arrangement in the UMAP embeddings plot. While it is important to note that UMAP, unlike methods such as Principal Component Analysis, does not have a direct physical analogy, we have consistently found it to be the most effective visualization method for this type of spectral data in both this and our previous studies.
After successfully visualizing our data with UMAP, we began using a deep learning neural network to model the measured spectra. If the data points are not well clustered in Figure 6, training the deep learning artificial neural network would be ineffective.

3.1. Model and Training Configuration

The deep learning artificial neural network (ANNDL) implementation in SOLO can utilize either the SciKit or TensorFlow Python 3.9.13 packages. In our study, we selected TensorFlow, which leverages GPU acceleration for highly efficient computations.
The core concept of high-pressure estimation using ANNDL involves training the network with sample spectra paired with corresponding pressure measurements. During training, the network iteratively minimizes the error between predicted and actual pressures. Since the region of interest in the measured spectra spans 575.05–640.08 nm, and given the resolution of the spectrometer, the input layer of the deep learning network contains 548 nodes. The output node provides predicted pressure.
Following a period of trial and error, we found that a network with two hidden layers, each containing 100 neurons, provided the best results.
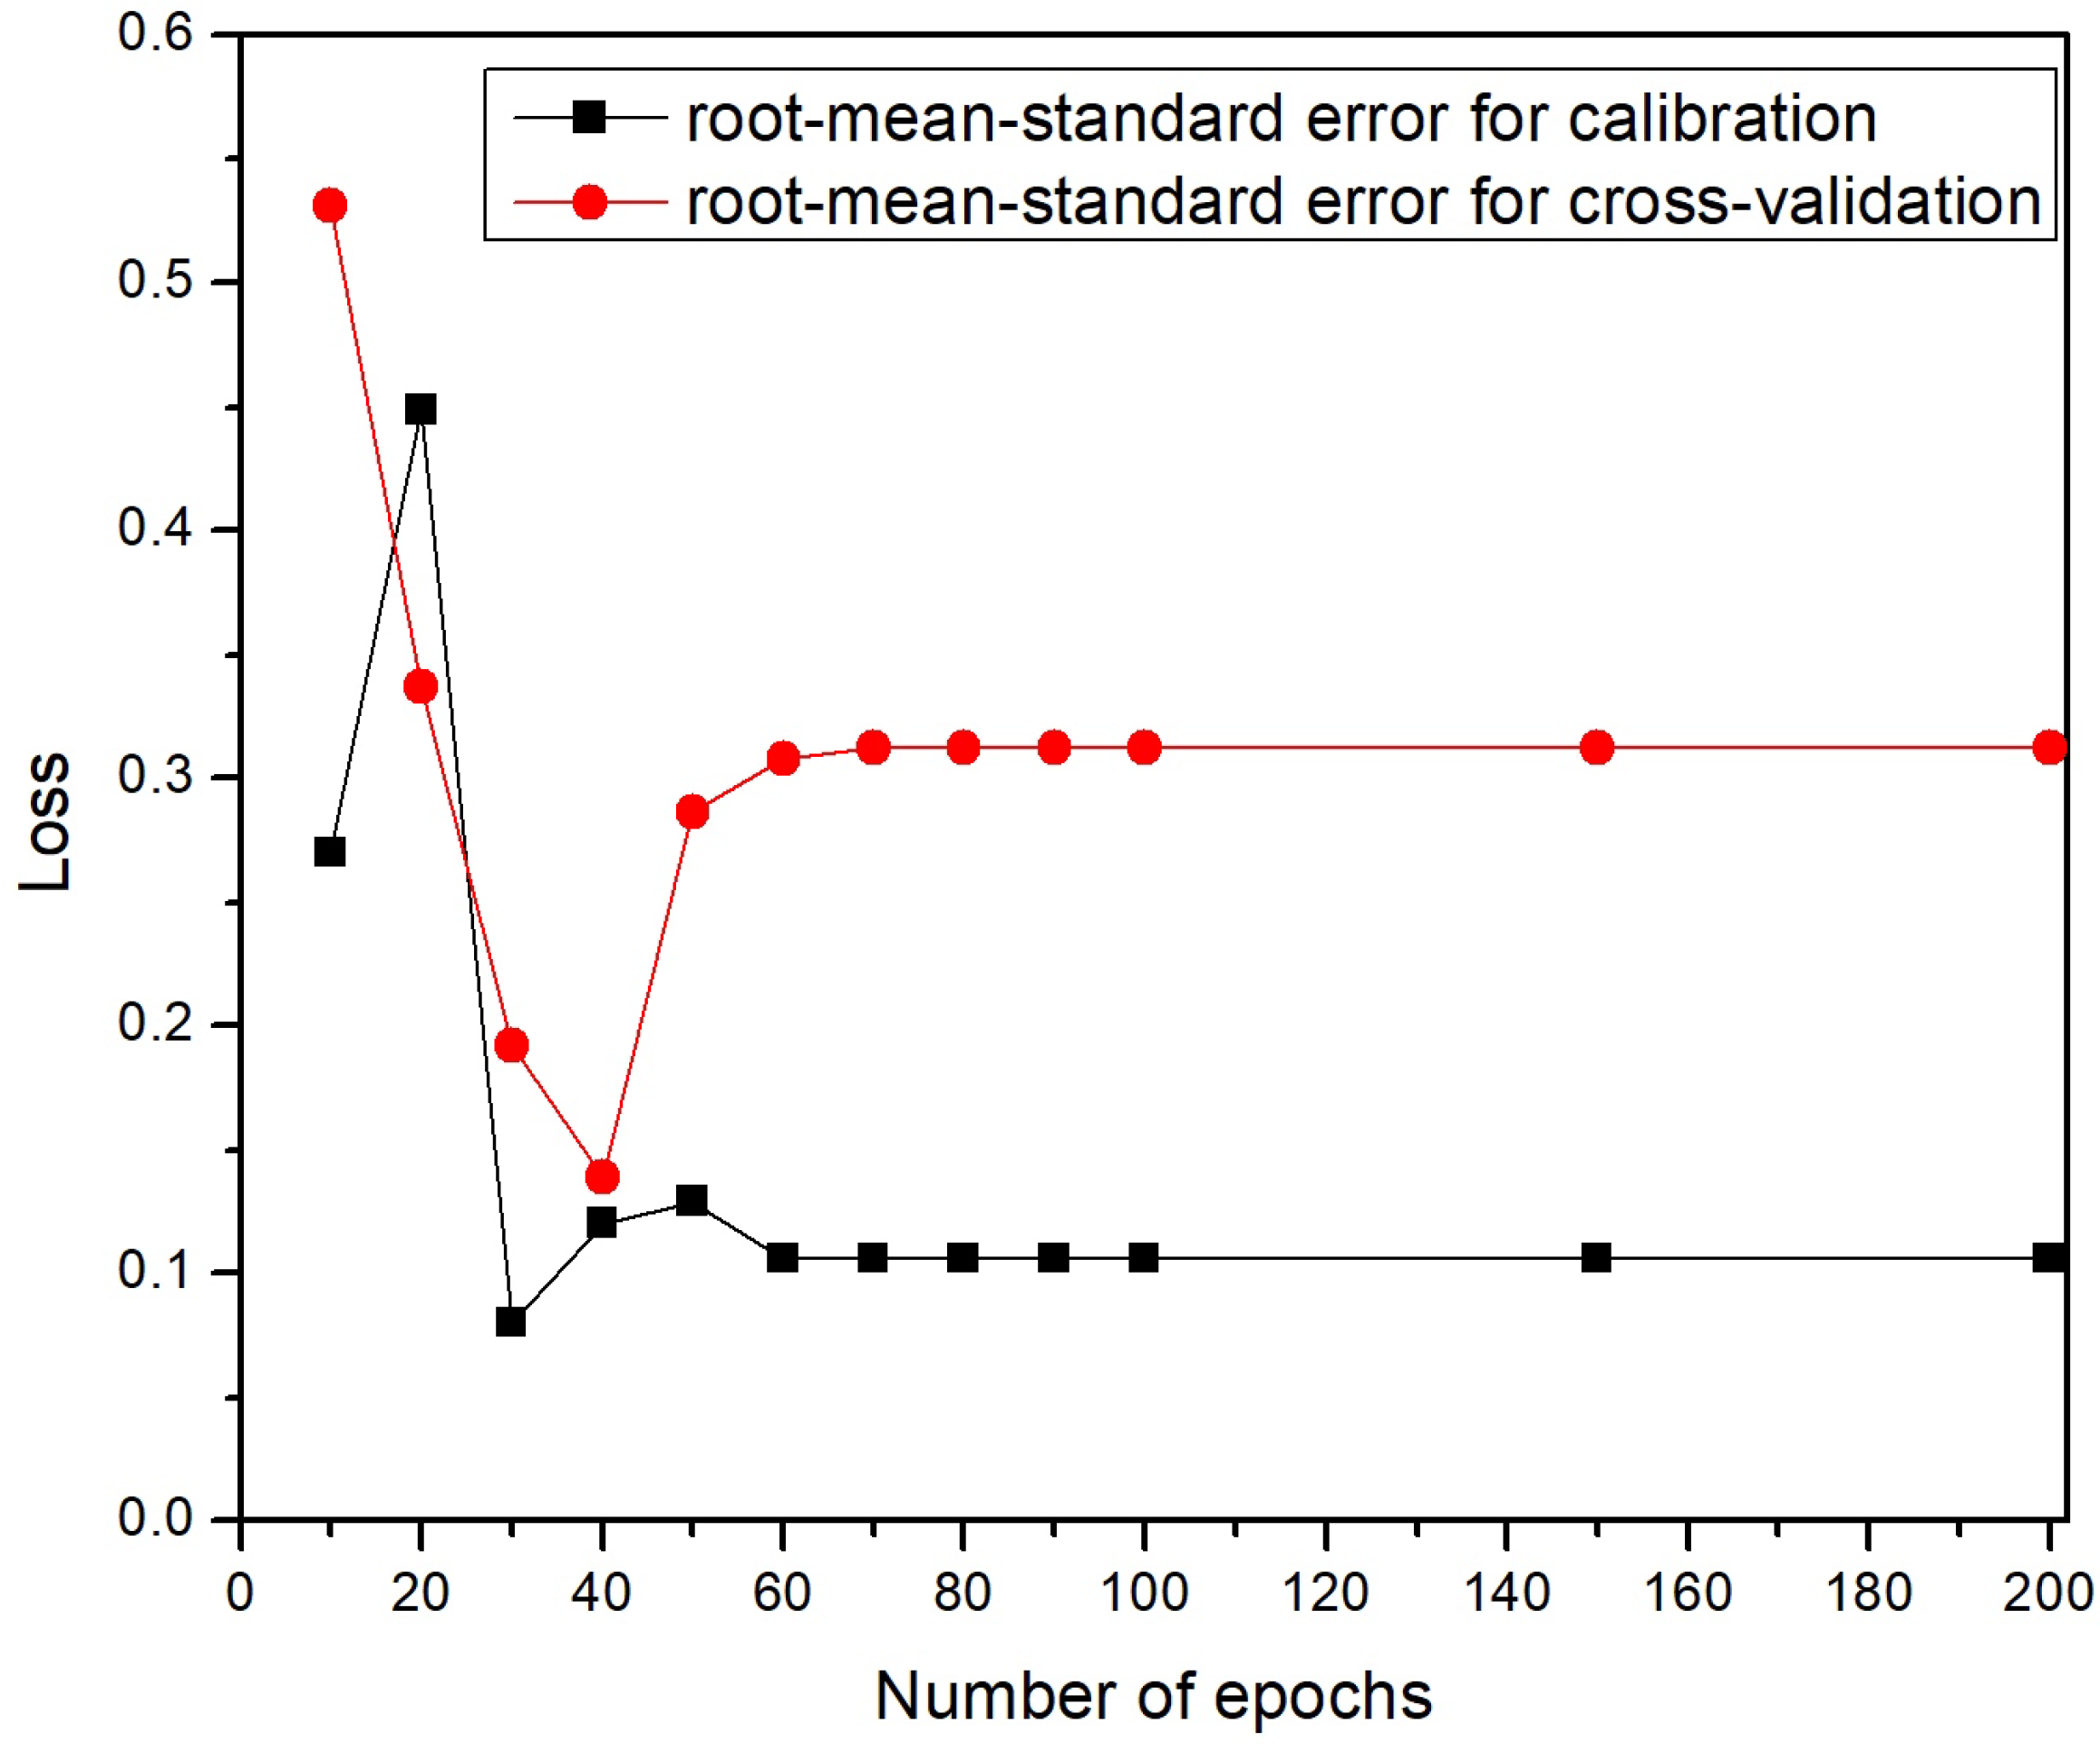
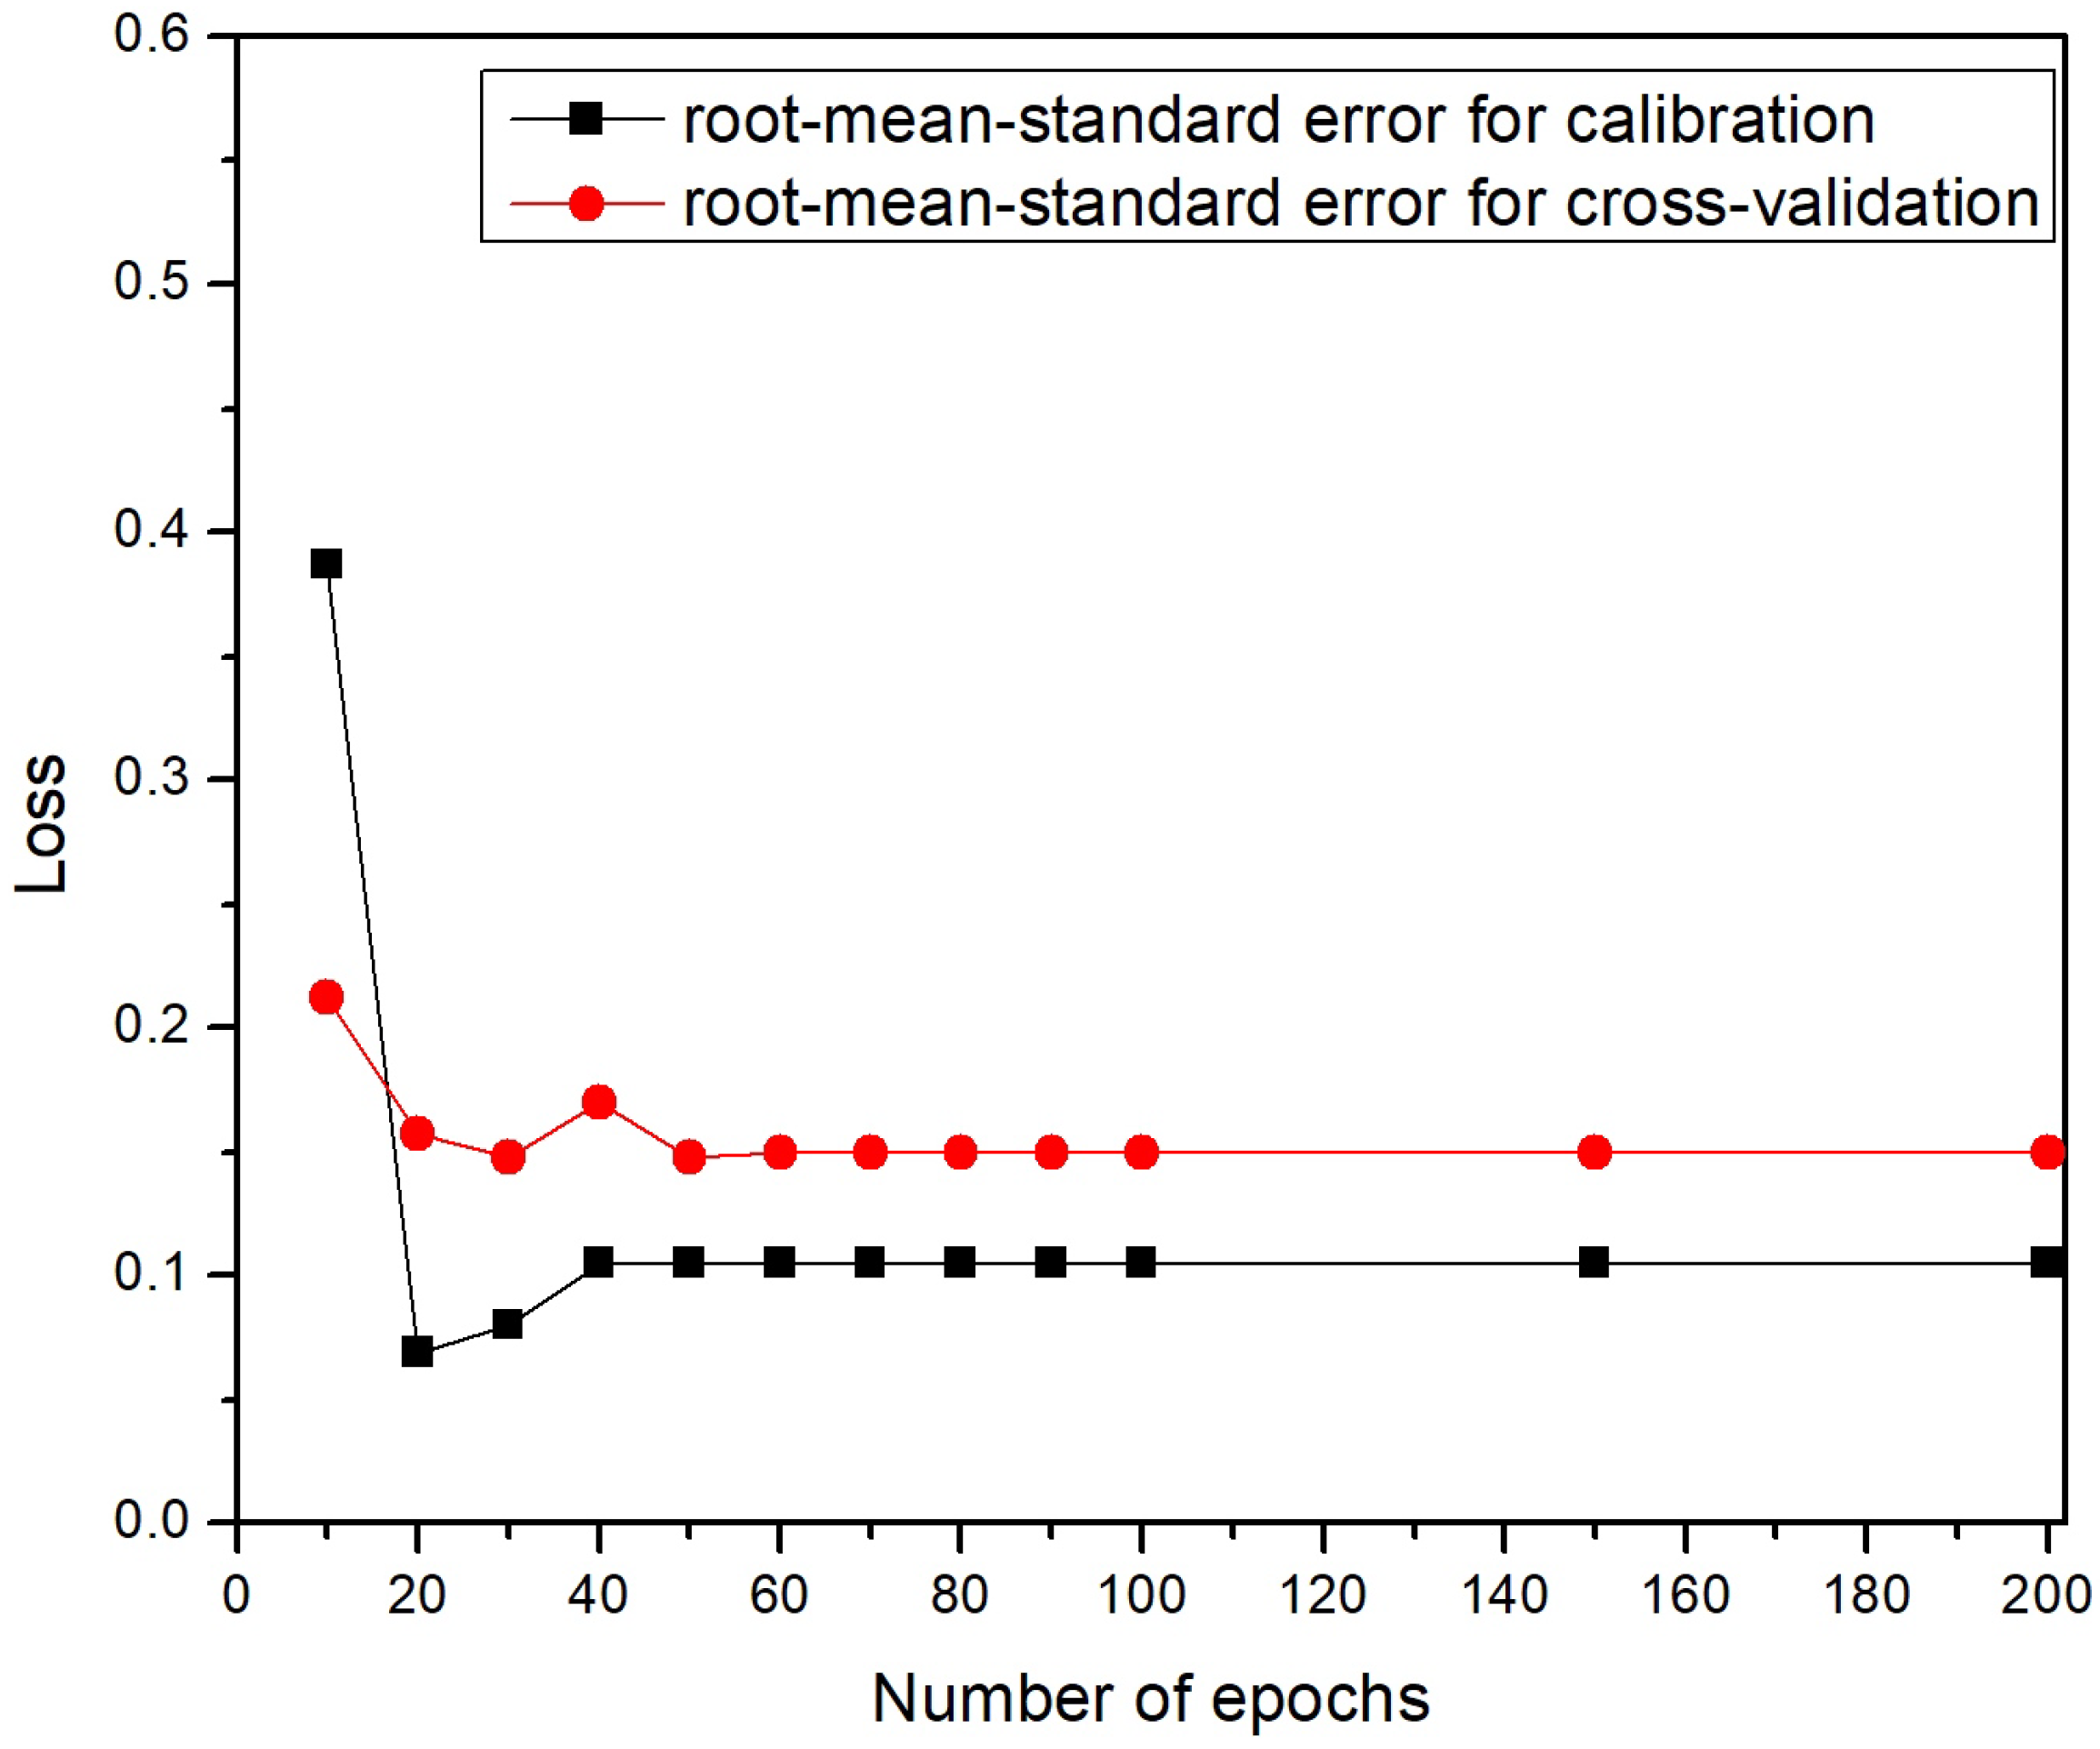
After extensive experimentation, we configured our deep learning model using the Relu activation function. We found that the Adam and Adamax optimizers performed best, with Adamax showing a slight edge in performance. Based on the learning curves in Figure 7 and Figure 8, we set the number of epochs to 60 for the Adam optimizer and 50 for Adamax. The learning curve for Adamax demonstrated a slightly more consistent and stable convergence pattern compared to the one for Adam.
We used a Venetian blind cross-validation method [40] with a 10-fold split, meaning 90% of the data was used for training and 10% for validation in each sub-validation experiment. The data structure is shown in Figure 5. After augmentation [41], each pressure value is represented by 10 spectra, resulting in a total of 130 spectra. Each test set was determined by selecting every tenth spectrum from the dataset, starting with spectrum number 1 and continuing through all spectra. In practice, 10% of the data (corresponding to the same pressure) (corresponding to one spectrum per pressure, i.e., 13 spectra) was treated as unknown, while the remaining 90% was used for training. In each of the 10 sub-validation experiments, a different 10% of the data was set aside as unknown to the computer. This is a standard feature of the SOLO machine learning software, designed for situations of this kind. After further testing, we selected a batch size of 10, a value different from the default setting in the Solo software (Version 9.1).

3.2. Data Preprocessing

Before training, the data underwent a two-step preprocessing procedure using built-in options in the SOLO software. First, 1-Norm (area = 1) normalization was applied to the dataset. The data was then smoothed using a Savitzky–Golay filter with a width of 5, a polynomial order of 0, and weighted tails.
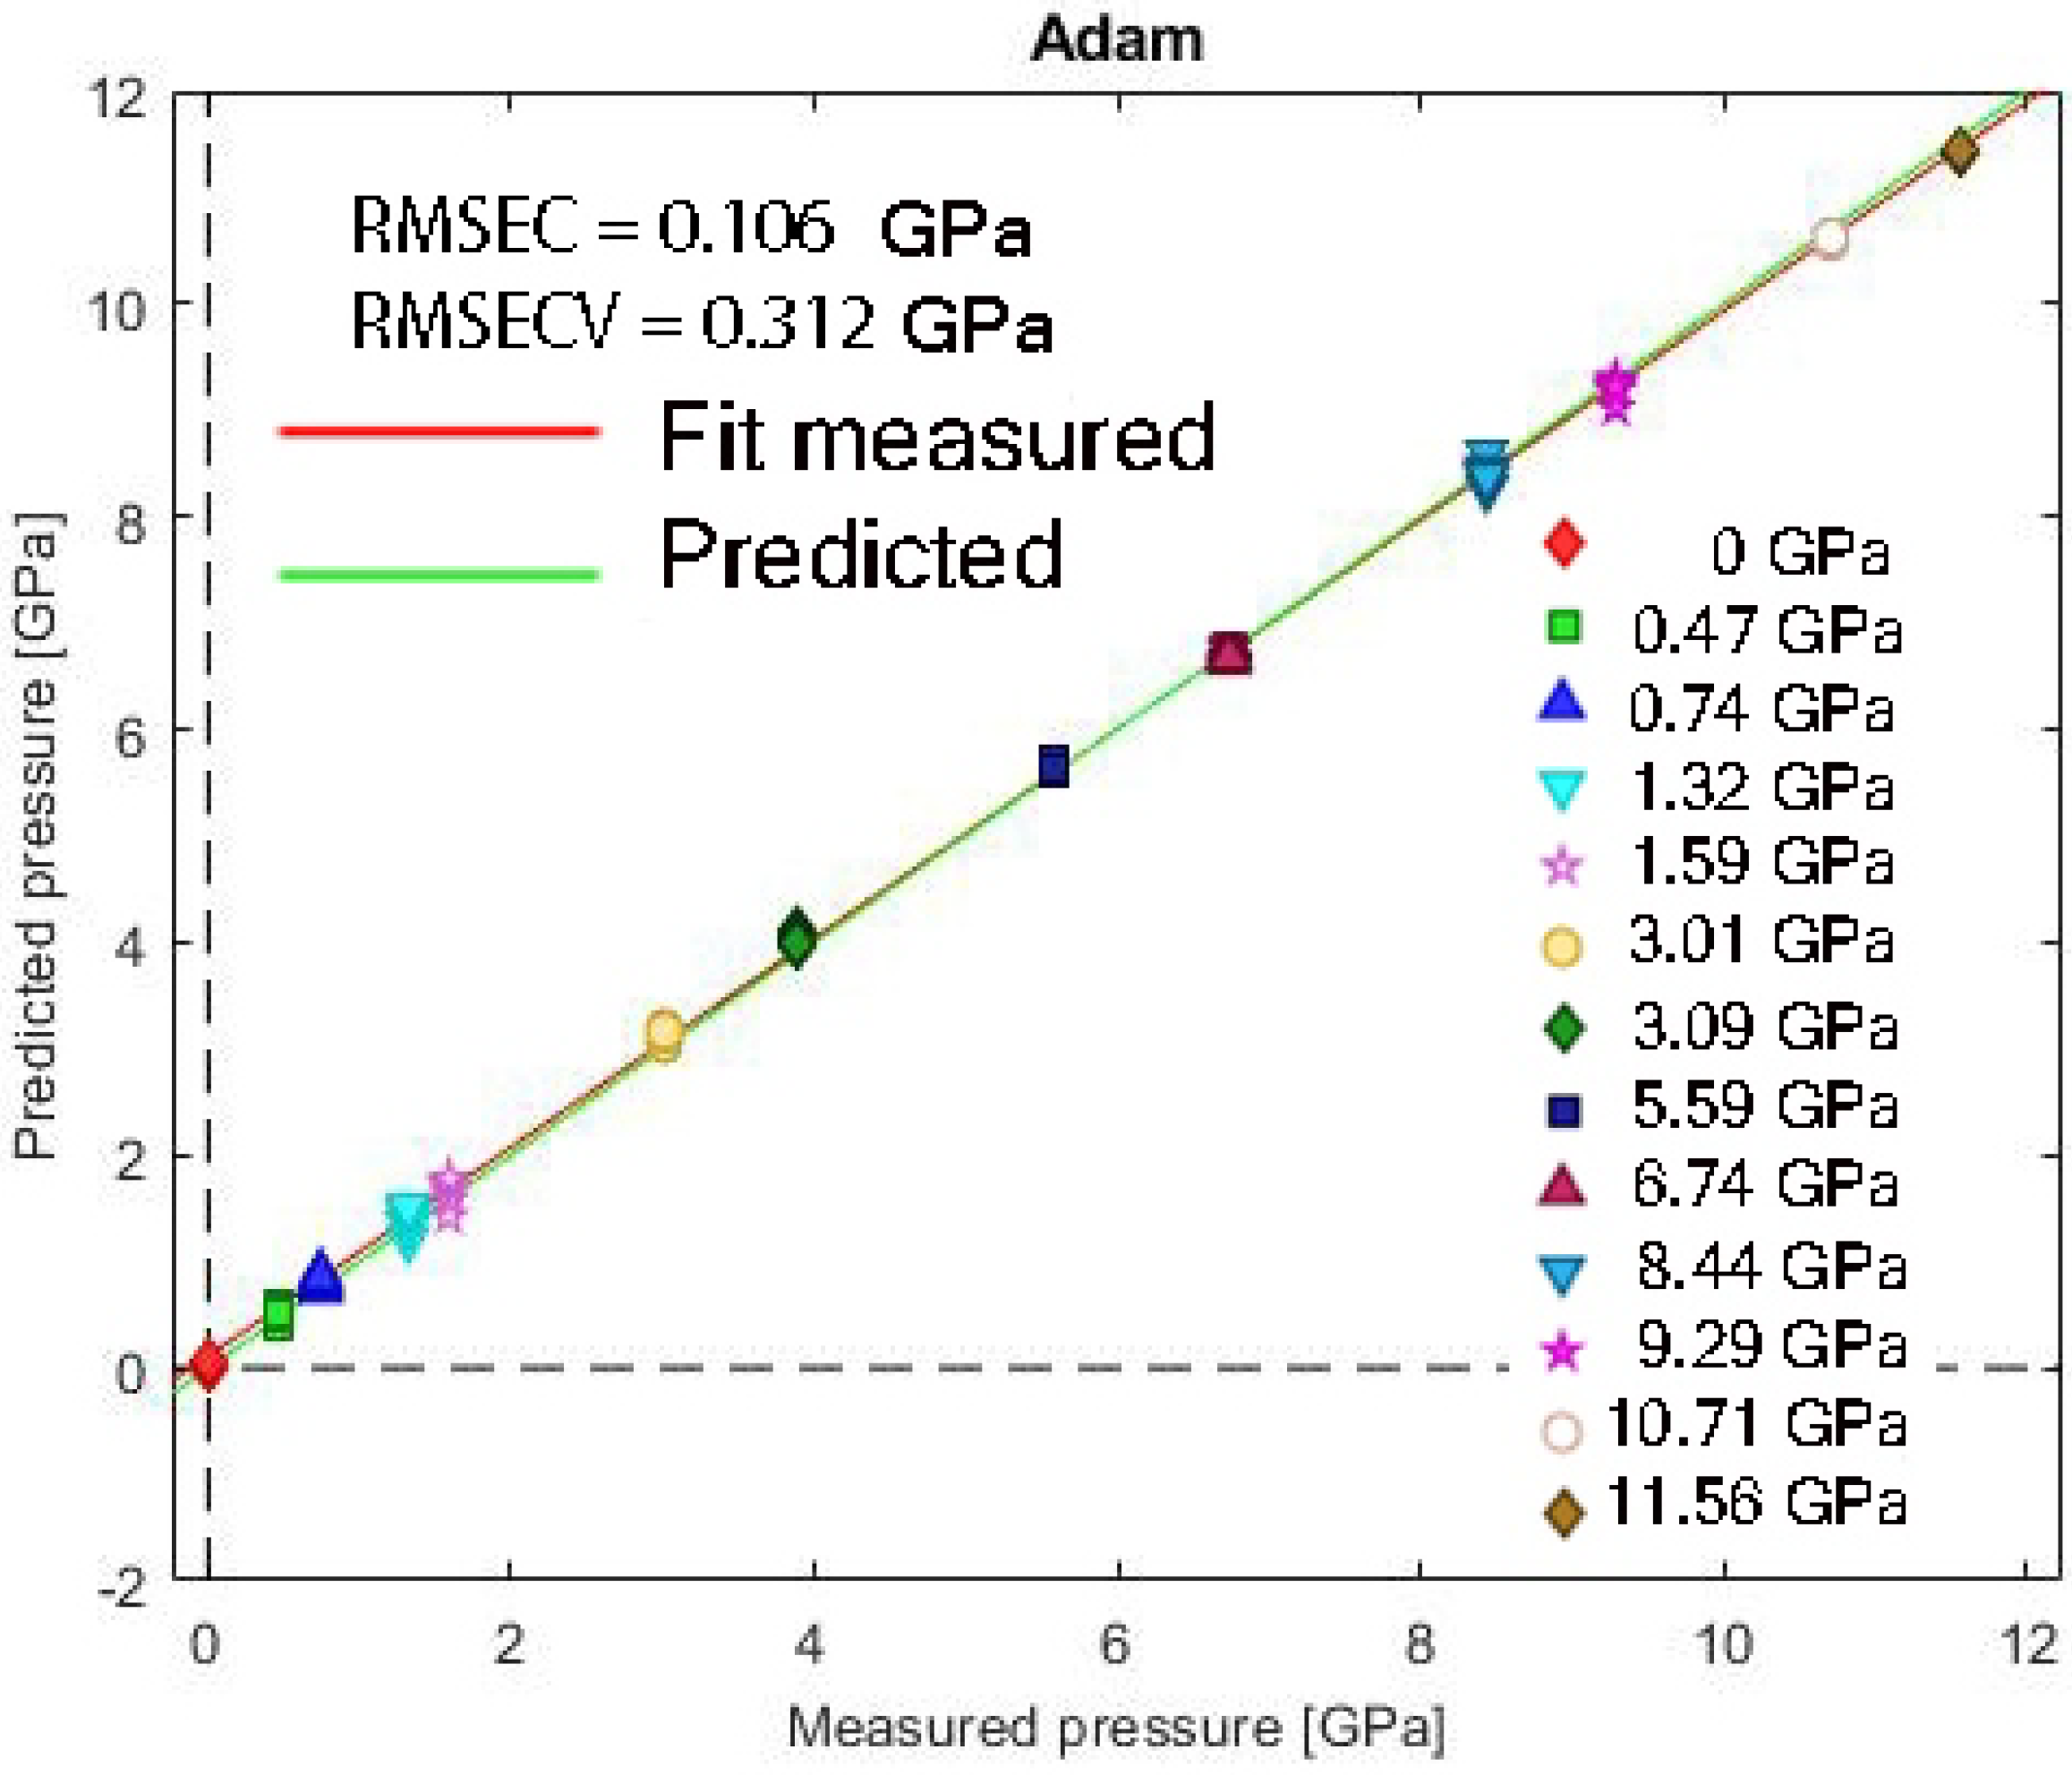
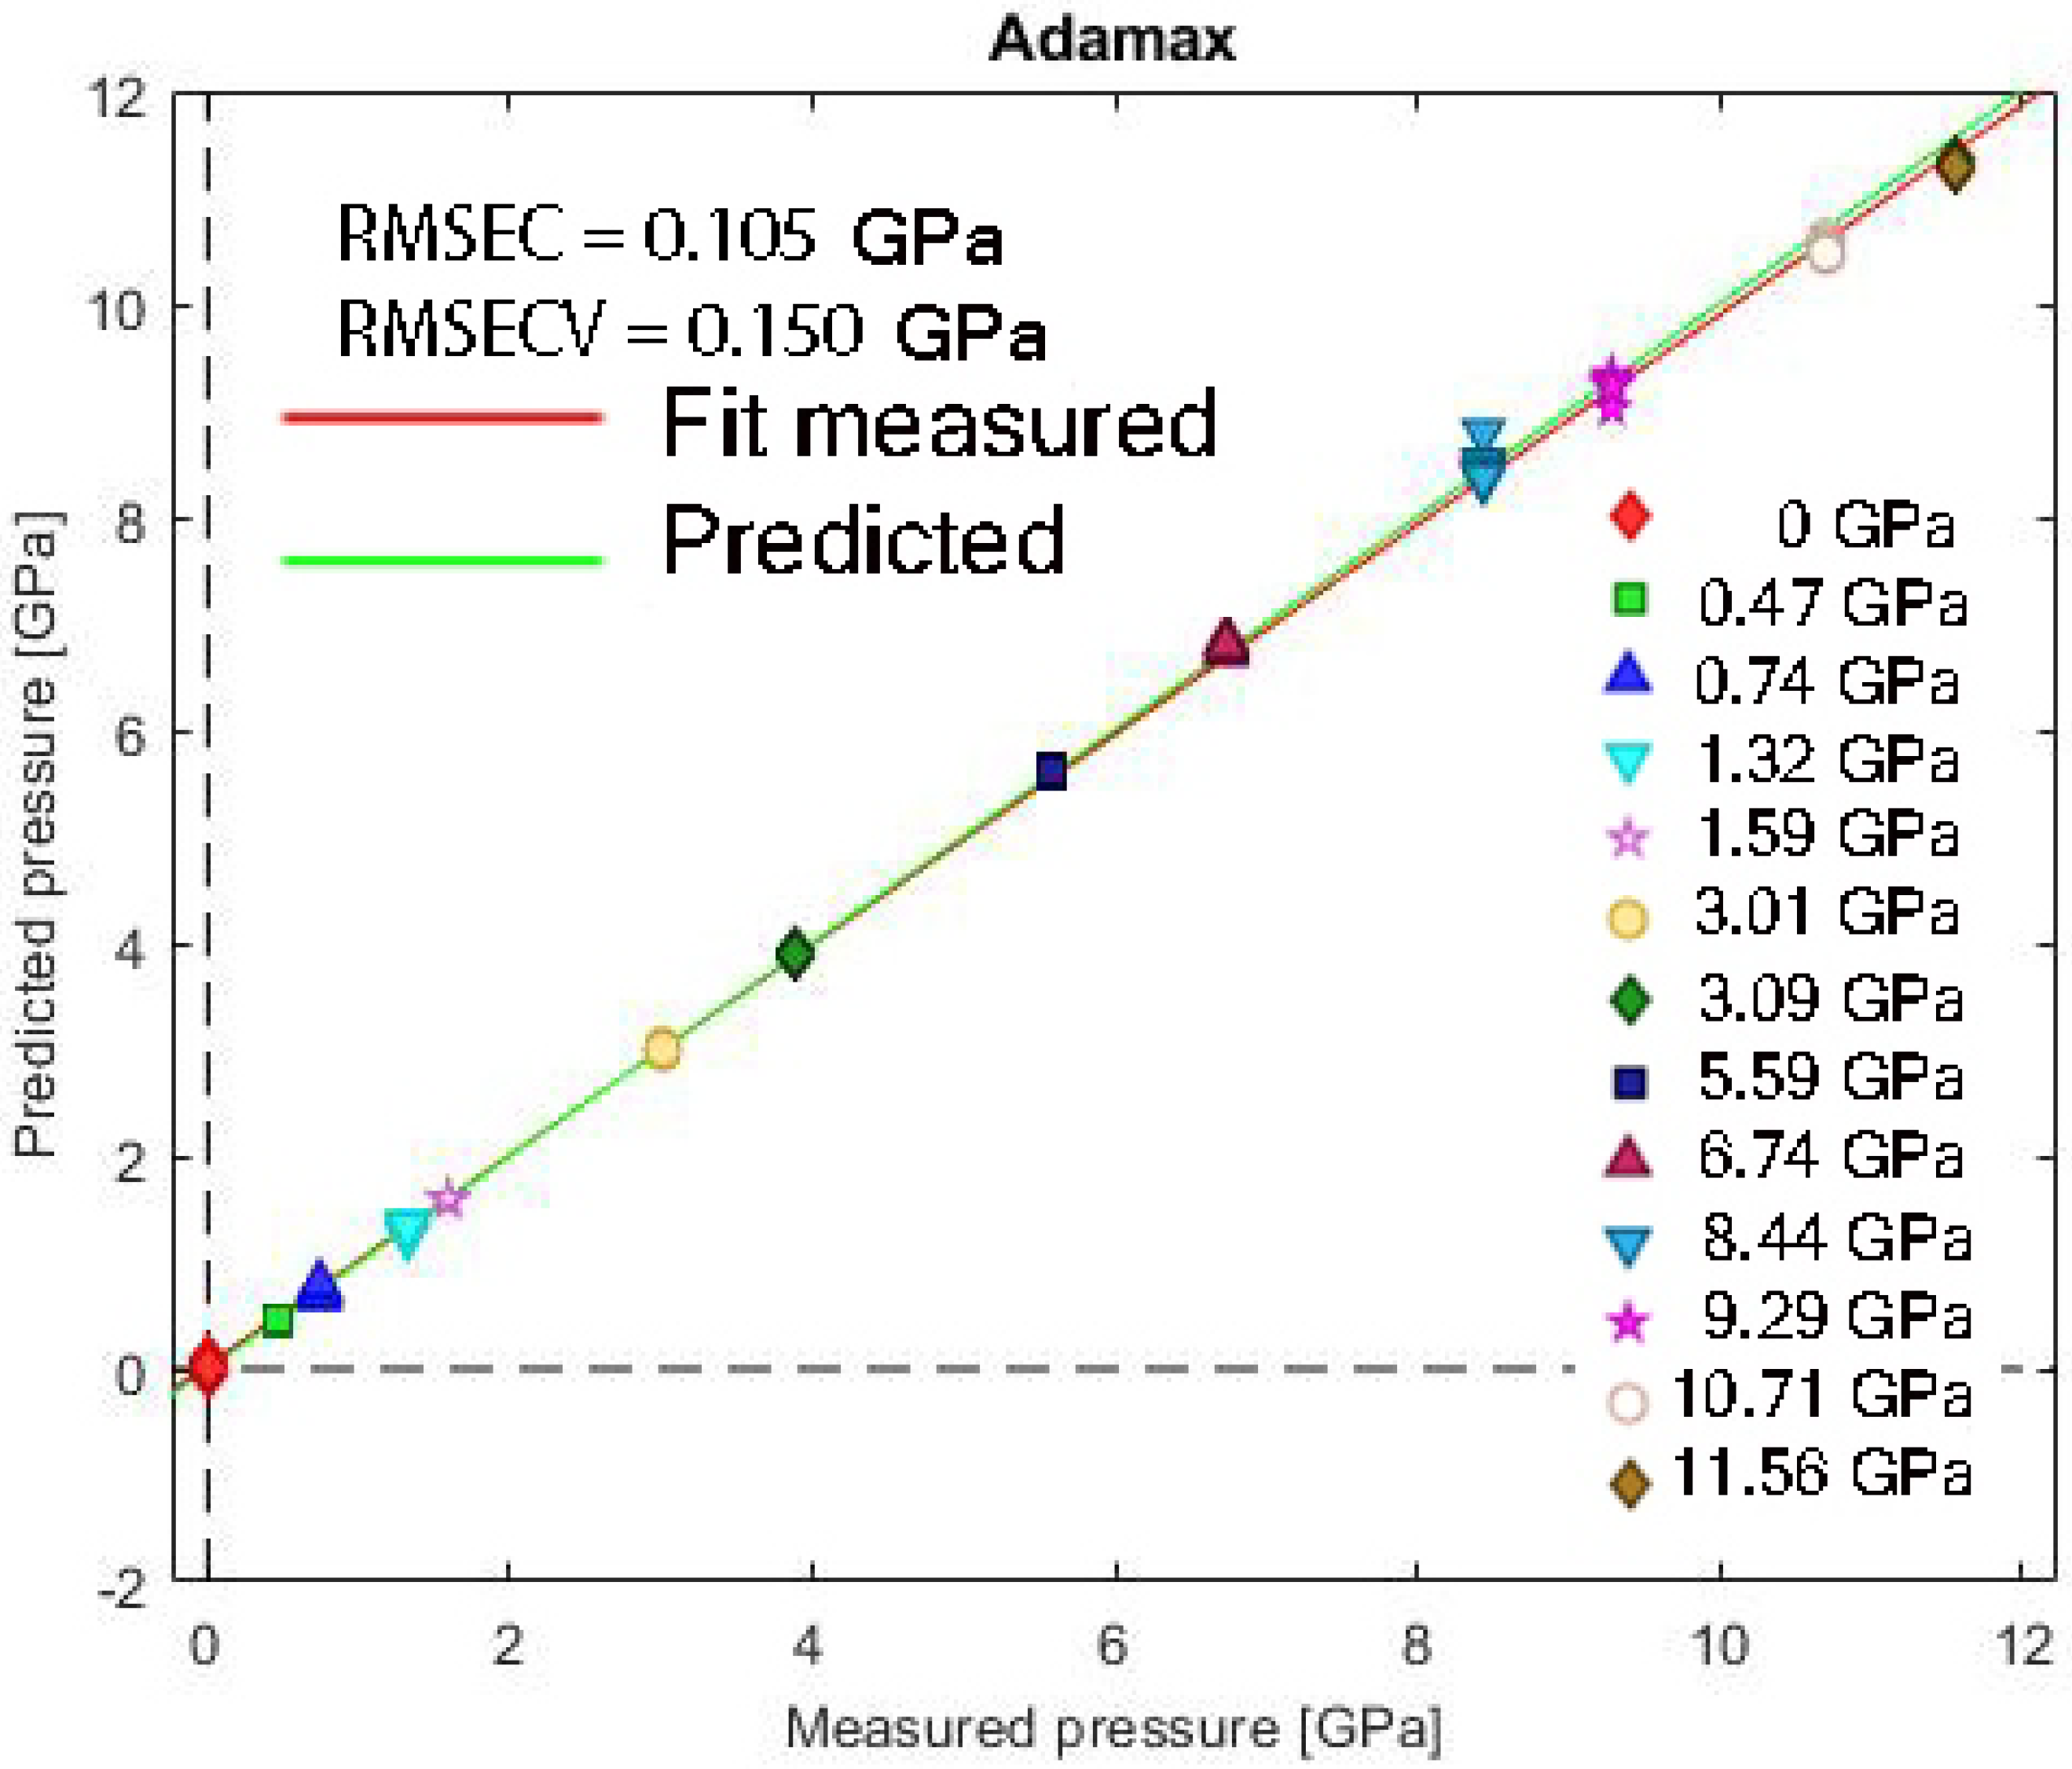
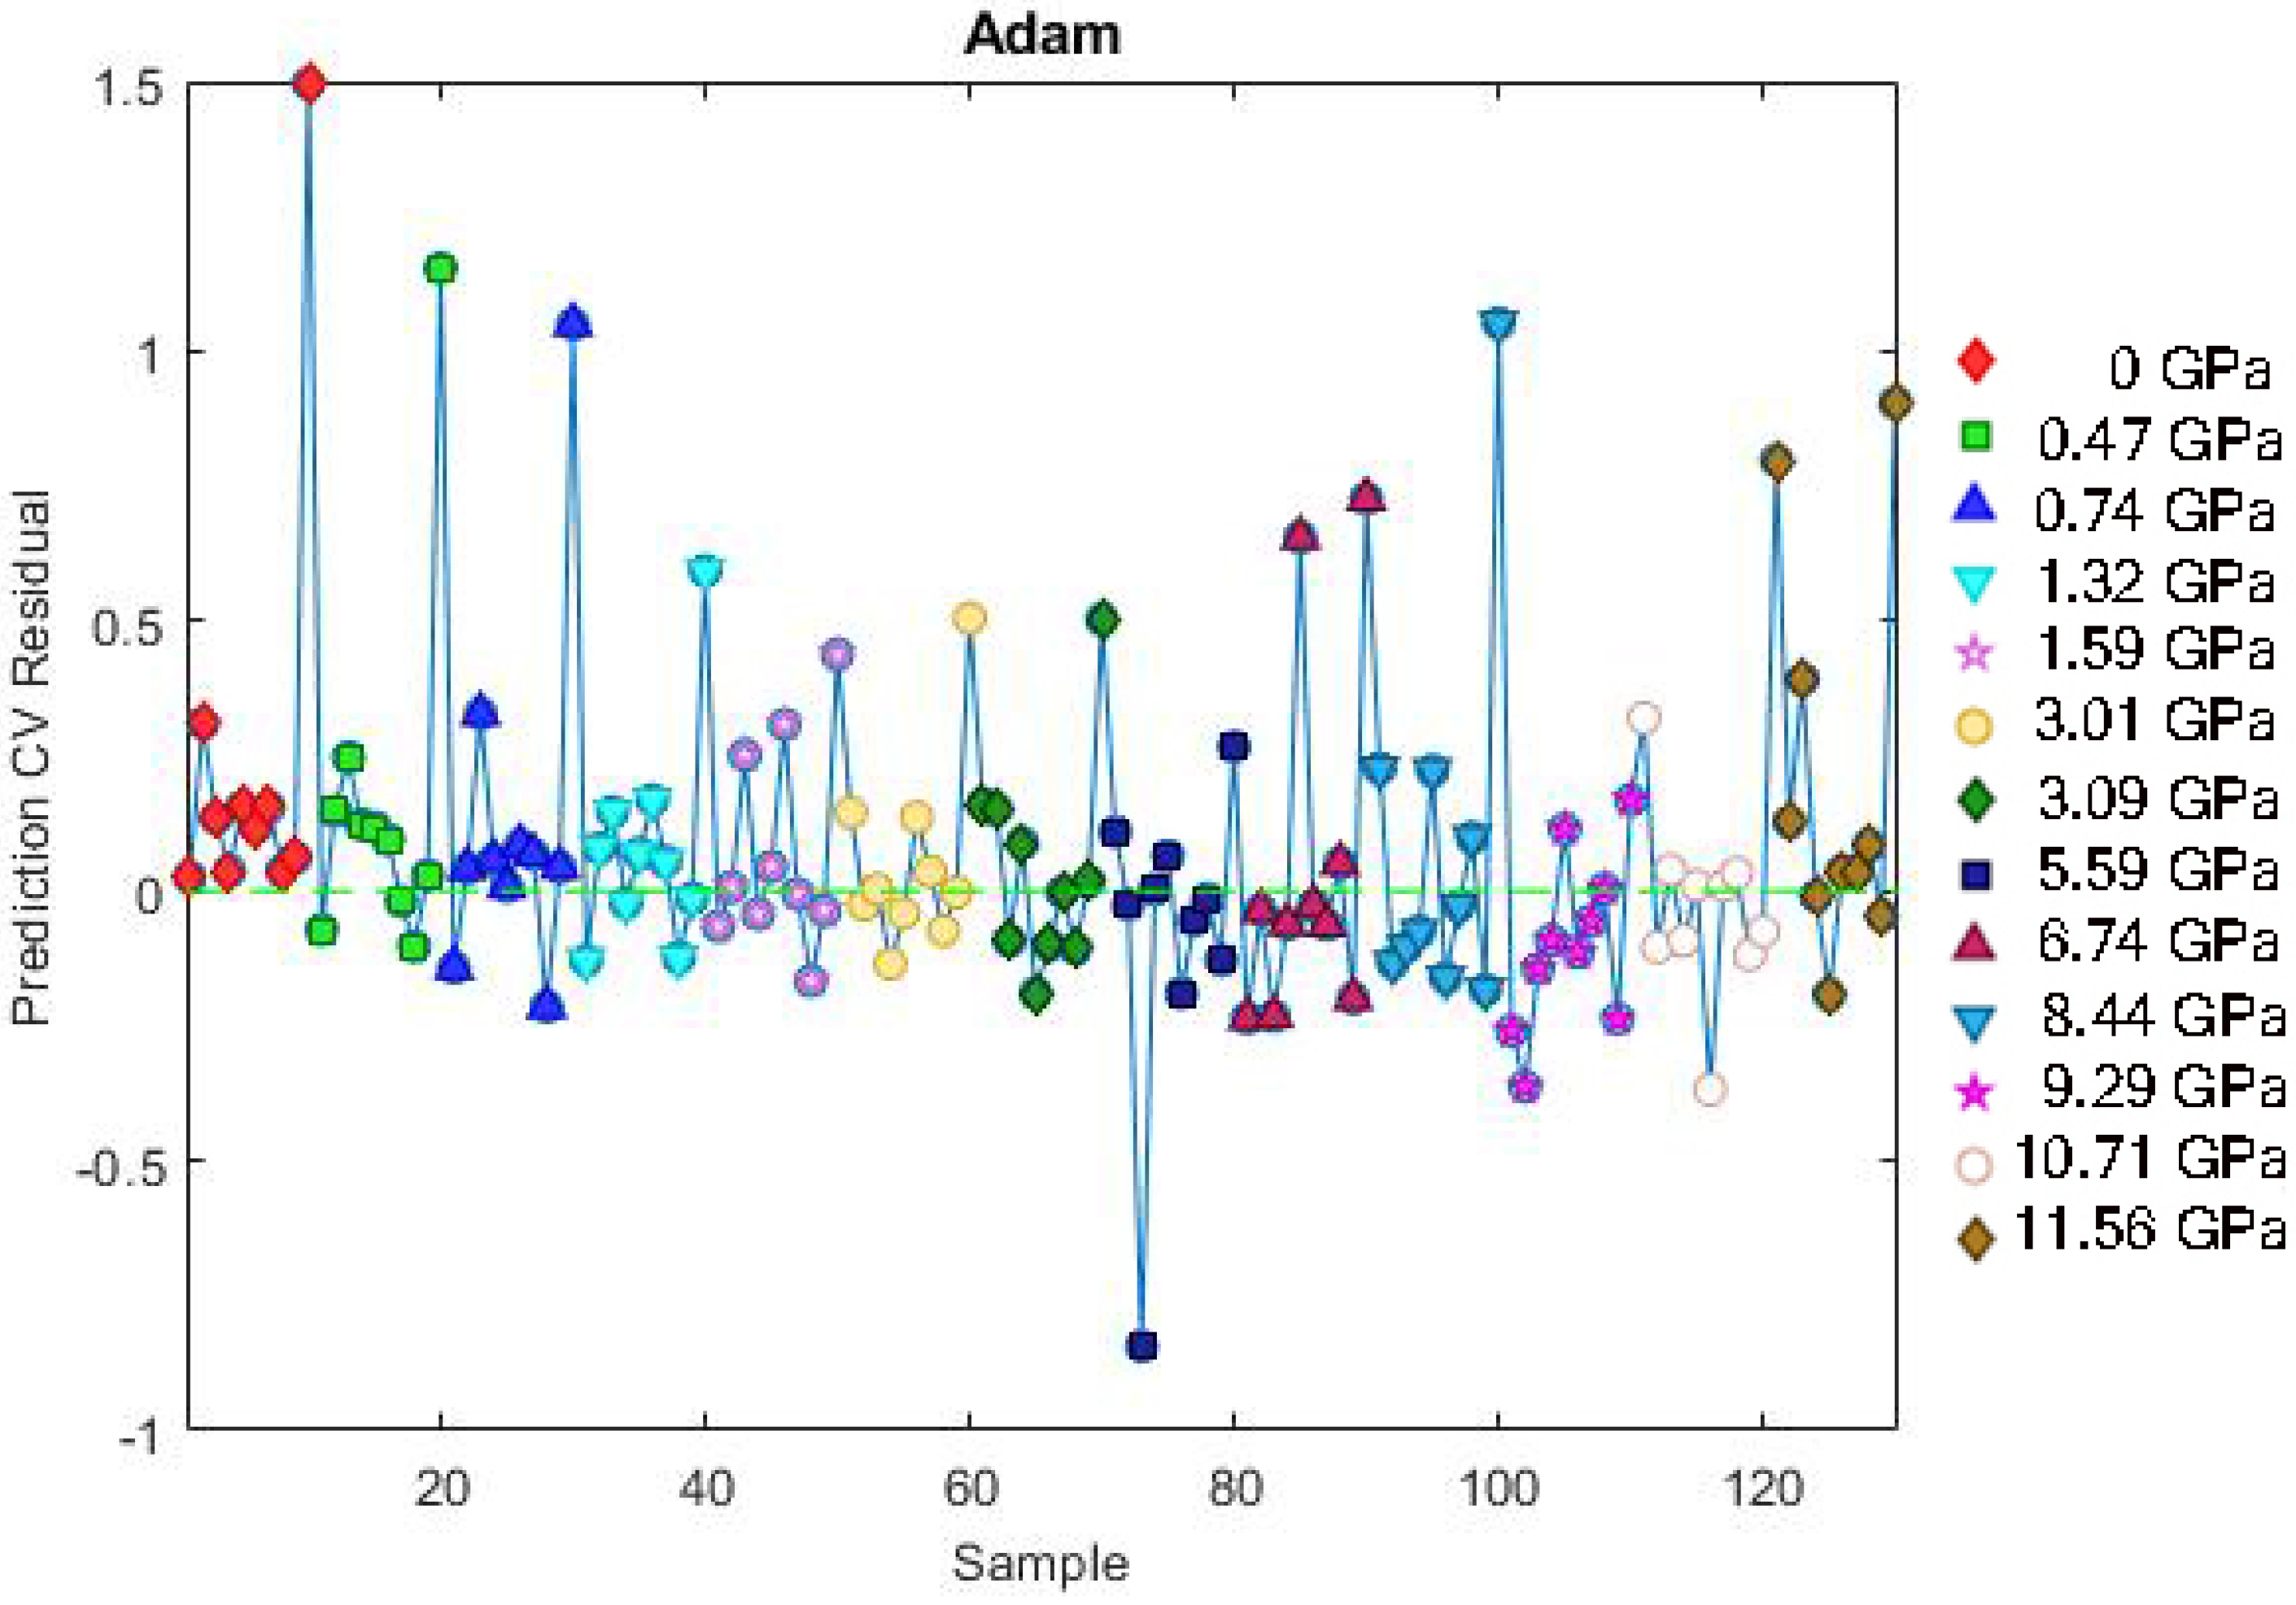
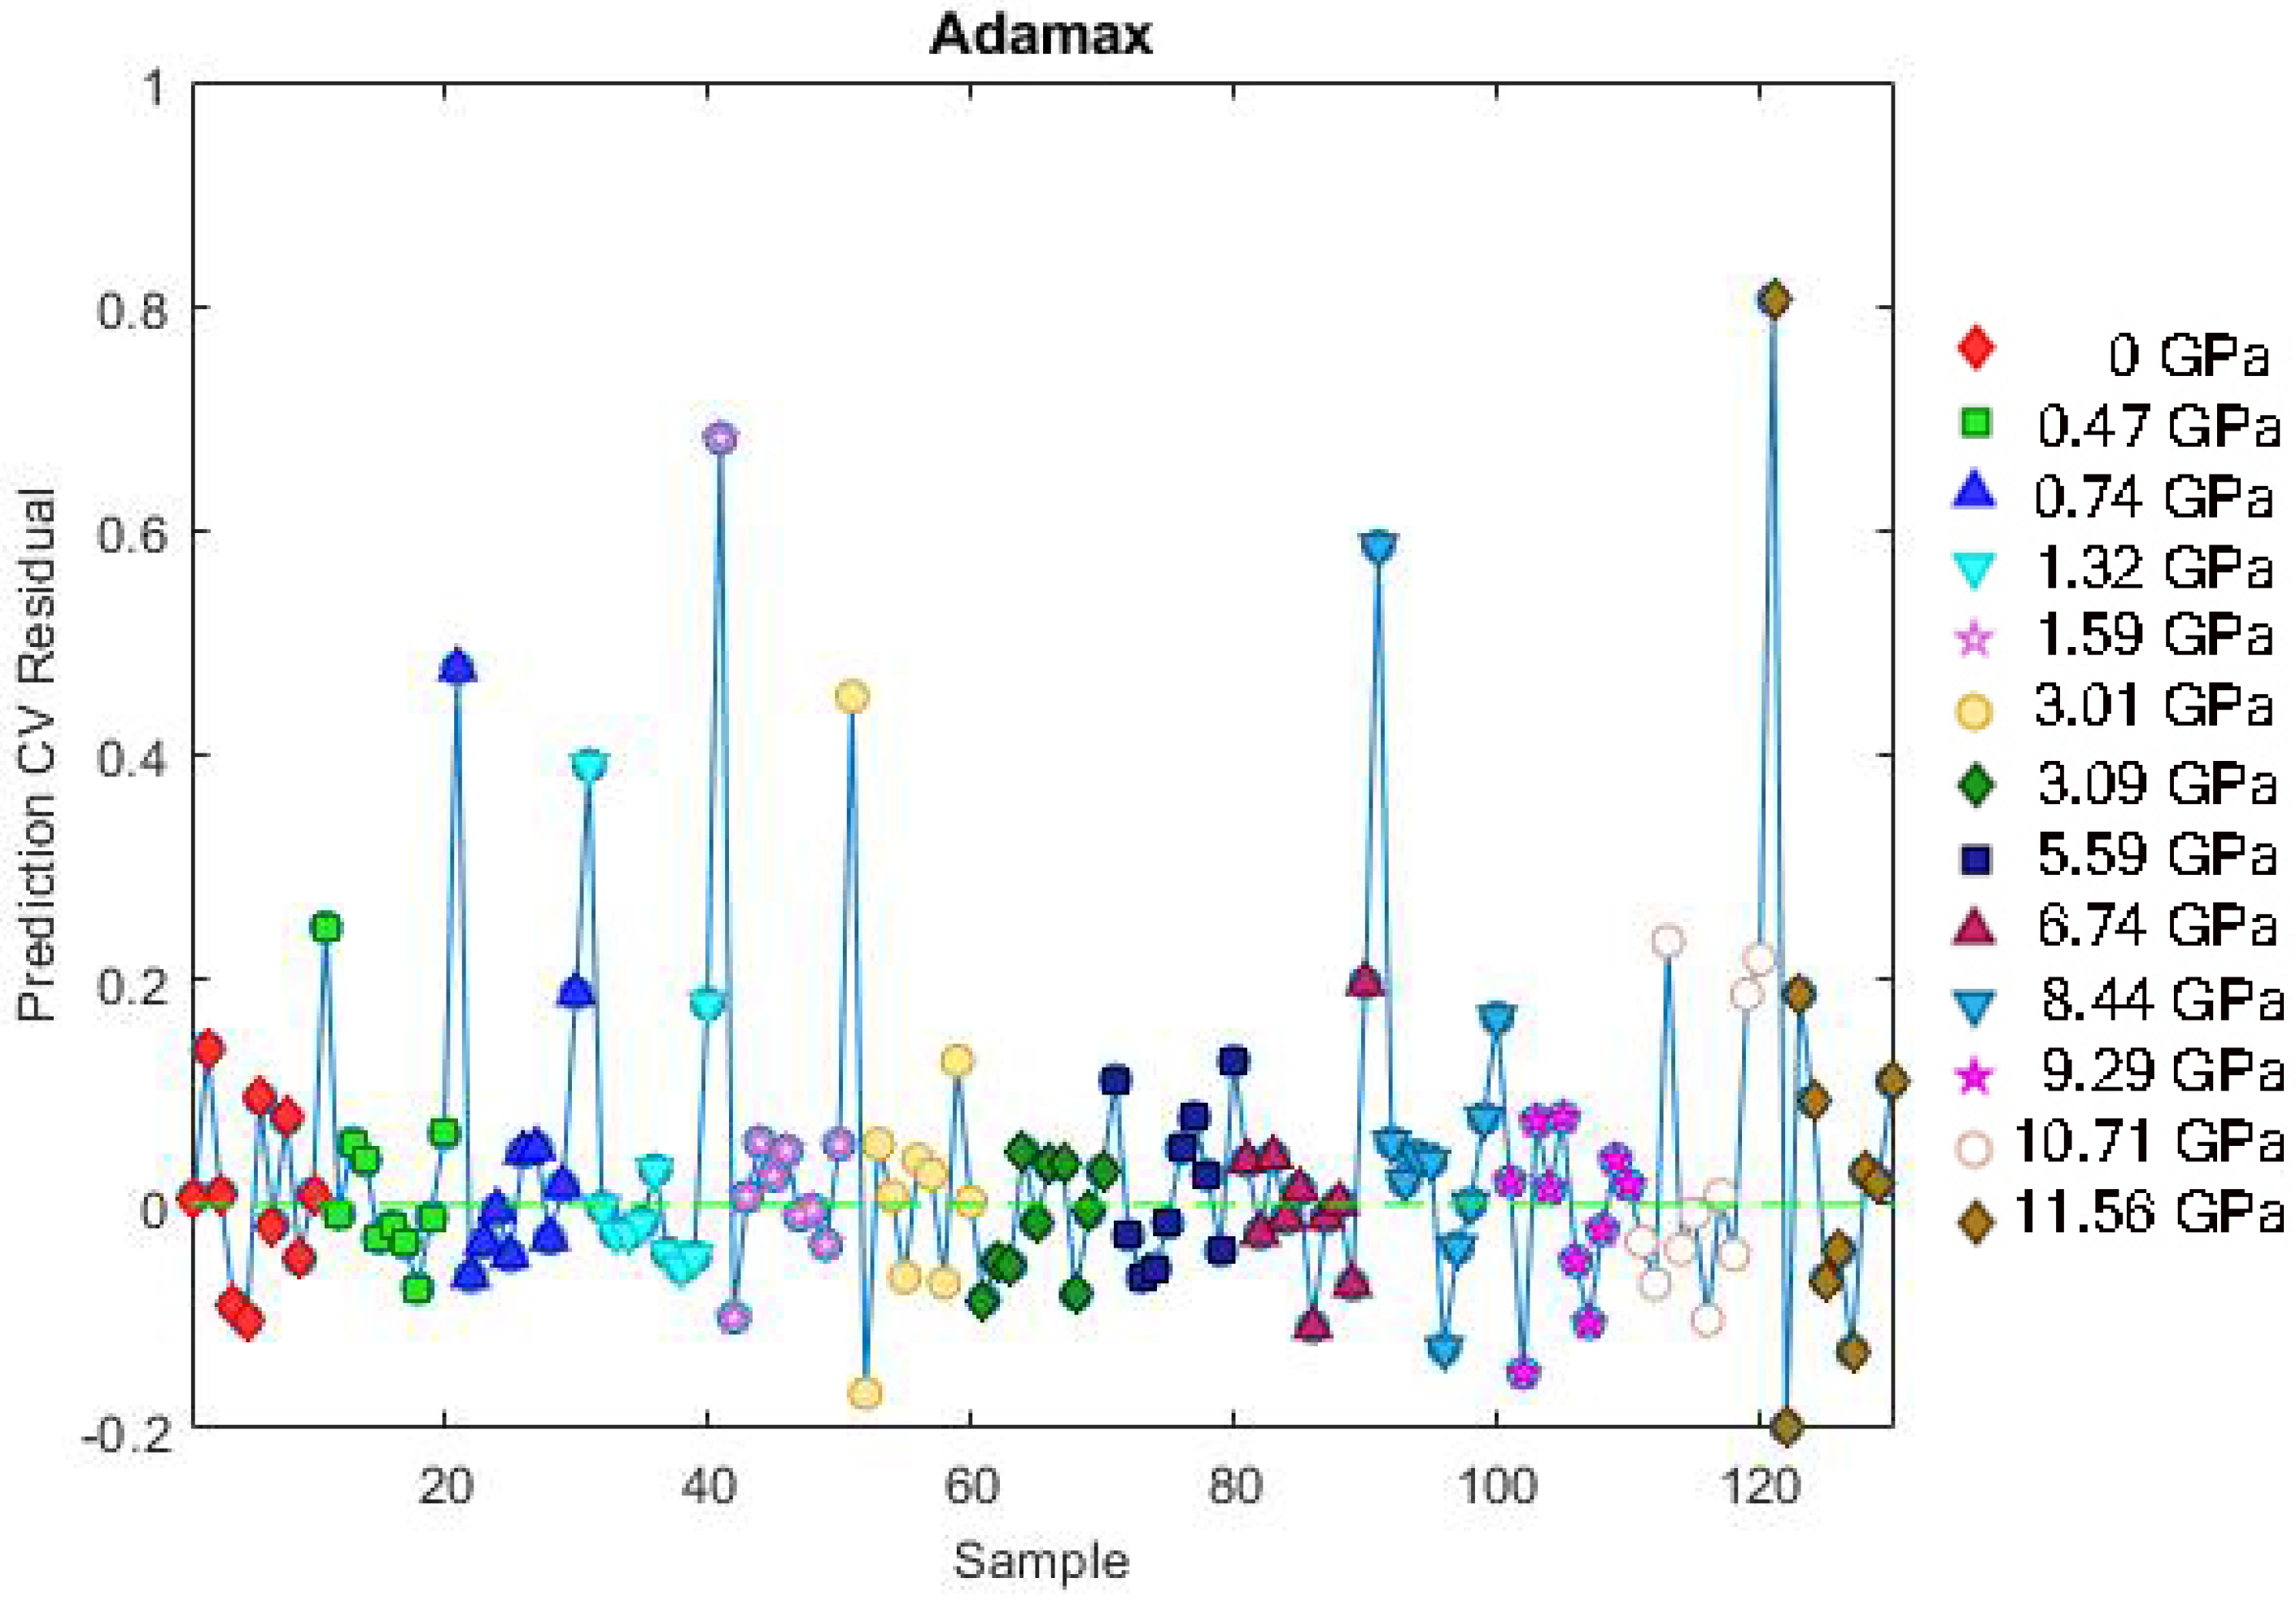
Figure 9 and Figure 10 display the deep learning model’s predictions versus the measured pressures for the Adam and Adamax optimizers. The performance metrics for Adam are RMSEC (root mean standard error of calibration) = 0.106 GPa and RMSECV (root mean standard error of cross-validation) = 0.312 GPa. The Adamax optimizer demonstrated superior performance, achieving a slightly better RMSEC of 0.105 GPa and a significantly lower RMSECV of 0.150 GPa. This indicates that while both optimizers behaved similarly on the training data, Adamax showed a marked advantage in its ability to generalize and make accurate predictions on new, unseen data. These errors are quite satisfactory, as visually confirmed by the plots.
To further visually analyze the model’s accuracy, the residuals—which represent differences between the pressures used for training and the pressures predicted by the deep learning network—are shown in Figure 11 and Figure 12. The high residuals correspond to data outside the training set.

4. Discussion

Although the Y2MoO6:Eu3+ nanomaterial employed in this study exhibits a narrower measurement range than some host–dopant systems reported in the literature [1,3,5,6,7,8,9], its performance is somewhat superior to others [2,4]. Nevertheless, our primary objective was not to maximize the measurement range, but rather to develop a method that leverages the full information contained in the measured spectra, allowing for a more comprehensive and accurate analysis within the material’s effective range.
It should be noted that the comprehensive review and comparison of high-pressure sensors presented in [22] indicates that there are many sensors superior to the Y2MoO6:Eu3+ nanomaterial. At the same time, this review highlights that the search for improved high-pressure sensors is still ongoing. Moreover, it inspired the idea of using a streak camera, as employed in our previous publications, to determine the pressure dependence of the lifetime for candidate high-pressure sensors.
We did not include plots of the material’s behavior during decompression. It is known that some Eu3+-doped materials do not preserve their cycling characteristics [45,46,47]. We acknowledge the possibility of differing behavior during decompression; however, as shown in our earlier work [37], the compression and decompression curves are nearly identical. Since no hysteresis was observed in the high-pressure calibration curves during decompression, this data was neither recorded nor incorporated into the ML analysis.
We also considered the hydrostatic limit of the 4:1 methanol–ethanol pressure medium, which is around 10–11 GPa [48]. Consequently, it is unclear whether the observed change at 9 GPa reflects the onset of a phase transition or arises from non-hydrostatic effects. In addition, only a single ruby sphere was used, preventing us from evaluating potential stress gradients by comparing measurements from multiple ruby spheres placed at different positions within the diamond anvil cell.
In a previous study [49], the authors reported that monoclinic Y2MoO6 shows no phase transition up to 34.5 GPa. We do not have the technical capabilities to verify the crystalline phase at higher pressures. As shown in Figure 4, around 9 GPa, the intensity ratio changes, which we interpret as a possible structural transformation. According to [8], such transformations are not abrupt, and there exists a pressure range where two phases coexist. It is also worth noting that [49] employed the same 1:4 ethanol–methanol mixture as a pressure-transmitting medium, which could be used beyond 10–11 GPa if stress gradients were monitored using multiple ruby spheres. Finally, our Y2MoO6:Eu3+ sample was sintered at 800 °C, whereas in [49], the material was sintered at 1400 °C; this difference may explain the variation in observed behavior.

5. Conclusions

In this study, we successfully demonstrated the potential of using machine learning (ML) to improve high-pressure luminescence sensing. The UMAP visualization method confirmed that our augmented experimental data could be effectively grouped by pressure, validating its suitability for ML analysis. We then showed that a deep learning neural network could accurately predict the applied pressure based on the measured luminescence spectra. To our knowledge, this is the first study to present such a machine learning-based improvement for high-pressure sensing.
While the Y2MoO6:Eu3+ nanomaterial used in this research has a more limited measurement range compared to some other hosts and dopants in the literature [1,3,5,6,7,8,9], its performance is slightly superior to others [2,4]. Our primary goal, however, was not to maximize the measurement range but to provide a method that fully utilizes all available information from the measured spectra, enabling a more complete and accurate analysis within the working range of the material.
We employed a machine learning (ML) approach to improve high-pressure measurements from the optical spectra of Y2MoO6:Eu3+. This method moves beyond the conventional technique of using only the intensity ratio or spectral shift of select spectral peaks. Instead, we trained a computer model to recognize the complete spectral signature associated with different pressures, which allowed us to incorporate both peak intensity ratios and spectral shifts. This advanced analysis successfully extended the useful pressure range of the Y2MoO6:Eu3+ material to 12 GPa, representing a significant improvement over traditional methods.

Author Contributions

Conceptualization, D.S., M.S.R. and M.G.N.; methodology, D.S., M.S.R. and M.G.N.; software, D.S. and M.S.R.; formal analysis, D.S., M.S.R. and M.G.N.; investigation, D.S., M.S.R. and M.G.N.; resources, M.G.N.; writing—original draft preparation, D.S. and M.S.R.; writing—review and editing, D.S. and M.S.R. All authors have read and agreed to the published version of the manuscript.

Funding

This research was funded by the Institute of Physics Belgrade through a grant from the Ministry of Science, Technological Development and Innovations of the Republic of Serbia.

Data Availability Statement

The original contributions presented in the study are included in the article, and further inquiries can be directed to the corresponding authors.

Conflicts of Interest

The authors declare no conflicts of interest. The funders had no role in the design of the study; in the collection, analyses, or interpretation of data; in the writing of the manuscript; or in the decision to publish the results.

References

  1. Lv, Q.; Wang, C.; Chen, S.; Zheng, H.; Dong, E.; Zhu, G. Ultrasensitive Pressure-Induced Optical Materials: Europium-Doped Hafnium Silicates with a Khibinskite Structure for Optical Pressure Sensors and WLEDs. Inorg. Chem. 2021, 61, 3212–3222. [Google Scholar] [CrossRef]
  2. Runowski, M.; Zheng, T.; Woźny, P.; Du, P. NIR emission of lanthanides for ultrasensitive luminescence manometry—Er3+-activated optical sensor of high pressure. Dalton Trans. 2021, 50, 14864–14871. [Google Scholar] [CrossRef] [PubMed]
  3. Antoniak, M.A.; Zelewski, S.J.; Oliva, R.; Żak, A.; Kudrawiec, R.; Nyk, M. Combined Temperature and Pressure Sensing Using Luminescent NaBiF4:Yb,Er Nanoparticles. ACS Appl. Nano Mater. 2020, 3, 4209–4217. [Google Scholar] [CrossRef]
  4. Goderski, S.; Runowski, M.; Woźny, P.; Lavín, V.; Lis, S. Lanthanide Upconverted Luminescence for Simultaneous Contactless Optical Thermometry and Manometry–Sensing under Extreme Conditions of Pressure and Temperature. ACS Appl. Mater. Interfaces 2020, 12, 40475–40485. [Google Scholar] [CrossRef]
  5. Runowski, M.; Woźny, P.; Stopikowska, N.; Guo, Q.; Lis, S. Optical Pressure Sensor Based on the Emission and Excitation Band Width (fwhm) and Luminescence Shift of Ce3+-Doped Fluorapatite—High-Pressure Sensing. ACS Appl. Mater. Interfaces 2019, 11, 4131–4138. [Google Scholar] [CrossRef] [PubMed]
  6. Runowski, M.; Woźny, P.; Lavin, V.; Lis, S. Optical pressure nano-sensor based on lanthanide doped SrB2O4:Sm2+ luminescence—Novel high-pressure nanomanometer. Sens. Actuators B Chem. 2018, 273, 585–591. [Google Scholar] [CrossRef]
  7. Matovic, B.; Nikolic, M.; Prekajski Djordjevic, M.; Dmitrovic, S.; Lukovic, J.; Maletaskic, J.; Jelenkovic, B. Luminescence Properties of Eu3+ Doped Mayenite Under High Pressure. J. Innov. Mater. Extrem. Cond. 2020, 1, 12–14. [Google Scholar]
  8. Zhang, J.; Cui, H.; Zhu, P.; Ma, C.; Wu, X.; Zhu, H.; Ma, Y.; Cui, Q. Photoluminescence studies of Y2O3:Eu3+ under high pressure. J. Appl. Phys. 2014, 115, 023502. [Google Scholar] [CrossRef]
  9. Baran, A.; Mahlik, S.; Grinberg, M.; Zych, E. High pressure and time-resolved luminescence spectra of Ca3Y2(SiO4)3 doped with Eu2+ and Eu3+. J. Phys. Condens. Matter 2013, 25, 025603. [Google Scholar] [CrossRef]
  10. He, X.; Bian, D.; Wang, H.; Xu, J. Eu3+ activated Y2MoO6 A narrow band red-emitting phosphor with strong near-UV absorption. Luminescence 2013, 28, 973–976. [Google Scholar] [CrossRef]
  11. Han, B.; Zhang, J.; Wang, Z.; Liu, Y.; Shi, H. Investigation on the concentration quenching and energy transfer of red-light-emitting phosphor Y2MoO6:Eu3+. J. Lumin. 2014, 149, 150–154. [Google Scholar] [CrossRef]
  12. Wu, L.; Tian, X.; Deng, K.; Liu, G.; Yin, M. Site selective spectroscopic study of an efficient red-emitting phosphor Y2MoO6:Eu. Opt. Mater. 2015, 45, 28–31. [Google Scholar] [CrossRef]
  13. Stankovic, N.; Nikolic, G.M.; Jelenkovic, B.; Daneu, N.; Maletaskic, J.; Prekajski DJordjevic, M.; Matovic, B. Luminescence properties of Eu3+ activated Y2MoO6 powders calcined at different temperatures. Process. Appl. Ceram. 2020, 14, 71–76. [Google Scholar] [CrossRef]
  14. Ofelt, G.S. Intensities of Crystal Spectra of Rare-Earth Ions. J. Chem. Phys. 1962, 37, 511–520. [Google Scholar] [CrossRef]
  15. Judd, B.R. Optical Absorption Intensities of Rare-Earth Ions. Phys. Rev. 1962, 127, 750–761. [Google Scholar] [CrossRef]
  16. Yu, L.; Song, H.; Lu, S.; Liu, Z.; Yang, L.; Kong, X. Luminescent Properties of LaPO4:Eu Nanoparticles and Nanowires. J. Phys. Chem. B 2004, 108, 16697–16702. [Google Scholar] [CrossRef]
  17. Zhong, S.; Wang, S.; Liu, Q.; Wang, Y.; Wang, S.; Chen, J.; Xu, R.; Luo, L. Y2O3:Eu3+ microstructures: Hydrothermal synthesis and photoluminescence properties. Mat. Res. Bull. 2009, 44, 2201–2205. [Google Scholar] [CrossRef]
  18. Halevy, I.; Carmon, R.; Winterrose, M.L.; Yeheskel, O.; Tiferet, E.; Ghose, S. Pressure-induced structural phase transitions in Y2O3 sesquioxide. J. Phys. Conf. Ser. 2010, 215, 012003. [Google Scholar] [CrossRef]
  19. Forman, R.A.; Piermarini, G.J.; Barnett, J.D.; Block, S. Pressure measurement made by the utilization of ruby sharp-line luminescence. Science 1972, 176, 284–285. [Google Scholar] [CrossRef]
  20. Wei, Y.; Zhou, Q.; Zhang, C.; Li, L.; Li, X.; Li, F. Fluorescence pressure sensors: Calibration of ruby, Sm2+:SrB4O7, and Sm3+: YAG to 55 GPa and 850 K. J. Appl. Phys. 2024, 135, 105902. [Google Scholar] [CrossRef]
  21. Shen, G.; Smith, J.S.; Kenney-Benson, C.; Klotz, S. Calibration of ruby (Cr3+:Al2O3) and Sm2+:SrFCl luminescence lines from the melting of mercury: Constraints on the initial slopes. High Press. Res. 2021, 41, 175–183. [Google Scholar] [CrossRef]
  22. Marciniak, L.; Woźny, P.; Szymczak, M.; Runowski, M. Optical pressure sensors for luminescence manometry: Classification, development status, and challenges. Coord. Chem. Rev. 2024, 507, 215770. [Google Scholar] [CrossRef]
  23. Sangiorgio, M. Deep Learning in Multi-Step Forecasting of Chaotic Dynamics; Special Topics in Information Technology; Springer International Publishing: Cham, Switzerland, 2022. [Google Scholar]
  24. Scalia, G. Machine Learning for Scientific Data Analysis; Special Topics in Information Technology; Springer International Publishing: Cham, Switzerland, 2022. [Google Scholar]
  25. Sayin, B.; Krivosheev, E.; Yang, J.; Passerini, A.; Casati, F. A review and experimental analysis of active learning over crowdsourced data. Artif. Intell. Rev. 2021, 54, 5283–5305. [Google Scholar] [CrossRef]
  26. Yu, H.; Li, J.; Wu, Z.; Xu, H.; Zhu, L. Two-step learning for crowdsourcing data classification. Multimed. Tools Appl. 2022, 81, 34401–34416. [Google Scholar] [CrossRef]
  27. Chatzidakis, M.; Botton, G.A. Towards calibration-invariant spectroscopy using deep learning. Sci. Rep. 2019, 9, 2126. [Google Scholar] [CrossRef] [PubMed]
  28. Weng, S.; Yuan, H.; Zhang, X.; Li, P.; Zheng, L.; Zhao, J.; Huanga, L. 2020 Deep learning networks for the recognition and quantitation of surface-enhanced Raman spectroscopy. Analyst 2020, 145, 4827–4835. [Google Scholar] [CrossRef]
  29. Ranamukhaarachchi, S.A.; Peiris, R.H.; Moresoli, C. Fluorescence spectroscopy and principal component analysis of soy protein hydrolysate fractions and the potential to assess their antioxidant capacity characteristics. Food Chem. 2017, 217, 469–475. [Google Scholar] [CrossRef]
  30. Dramicanin, T.; Zekovic, I.; Perisa, J.; Dramicanin, M.D. The Parallel Factor Analysis of Beer Fluorescence. J. Fluoresc. 2019, 29, 1103–1111. [Google Scholar] [CrossRef]
  31. Ximendes, E.; Marin, R.; Carlos, L.D.; Jaque, D. Less is more: Dimensionality reduction as a general strategy for more precise luminescence thermometry. Light Sci. Appl. 2022, 11, 237. [Google Scholar] [CrossRef]
  32. Barbon, S.; da Costa Barbon, A.P.A.; Mantovani, R.G.; Barbin, D.F. Machine Learning Applied to Near-Infrared Spectra for Chicken Meat Classification. J. Spectrosc. 2018, 2018, 8949741. [Google Scholar] [CrossRef]
  33. Geronimo, B.C.; Mastelini, S.M.; Carvalho, R.H.; Barbon Júnior, S.; Barbin, D.F.; Shimokomaki, M.; Ida, E.I. Computer vision system and near-infrared spectroscopy for identification and classification of chicken with wooden breast, and physicochemical and technological characterization. Infrared Phys. Technol. 2019, 96, 303–310. [Google Scholar] [CrossRef]
  34. Junior, S.B.; Mastelini, S.M.; Barbon, A.P.A.; Barbin, D.F.; Calvini, R.; Lopes, J.F.; Ulrici, A. Multi-target prediction of wheat flour quality parameters with near infrared spectroscopy. Inf. Process. Agric. 2020, 7, 342–354. [Google Scholar] [CrossRef]
  35. Nolasco Perez, I.M.; Badaró, A.T.; Barbon, S.; Barbon, A.P.A.; Pollonio, M.A.R.; Barbin, D.F. Classification of Chicken Parts Using a Portable Near-Infrared (NIR) Spectrophotometer and Machine Learning. Appl. Spectrosc. 2018, 72, 1774–1780. [Google Scholar] [CrossRef] [PubMed]
  36. Cui, J.; Xu, W.; Yao, M.; Zheng, L.; Hu, C.; Zhang, Z.; Sun, Z. Convolutional neural networks open up horizons for luminescence thermometry. J. Lumin. 2023, 256, 119637. [Google Scholar] [CrossRef]
  37. Vlasic, A.; Sevic, D.; Rabasovic, M.S.; A Krizan, J.; Savic-Sevic, S.; Rabasovic, M.D.; Mitric, M.; Marinkovic, B.P.; Nikolic, M.G. Effects of temperature and pressure on luminescent properties of Sr2CeO4:Eu3+ nanophosphor. J. Lumin. 2018, 199, 285–292. [Google Scholar] [CrossRef]
  38. Chijioke, A.D.; Nellis, W.J.; Soldatov, A.; Silvera, I.F. The ruby pressure standard to 150GPa. J. Appl. Phys. 2005, 98, 114905. [Google Scholar] [CrossRef]
  39. Wise, B.M.; Gallagher, N.B.; Bro, R.; Shaver, J.M.; Windig, W.; Koch, R.S. Chemometrics Tutorial for PLS Toolbox and Solo; Eigenvector Research, Inc.: Manson, WA, USA, 2006; ISBN 0-9761184-1-6. [Google Scholar]
  40. Wise, B.M.; Gallagher, N.B.; Bro, R.; Shaver, J.M.; Windig, W.; Koch, R.S. Solo Software User’s Guide Version 1.1; Eigenvector Research, Inc.: Manson, WA, USA, 2010; Available online: https://www.software.eigenvector.com/user/Solo_Software_UsersGuide.pdf (accessed on 13 October 2025).
  41. Shorten, C.; Khoshgoftaar, T.M. A survey on Image Data Augmentation for Deep Learning. J. Big Data 2019, 6, 60. [Google Scholar] [CrossRef]
  42. Jelic, J.Z.; Dencevski, A.; Rabasovic, M.D.; Krizan, J.; Savic-Sevic, S.; Nikolic, M.G.; Aguirre, M.H.; Sevic, D.; Rabasovic, M.S. Improving the Two-Color Temperature Sensing Using Machine Learning Approach: GdVO4:Sm3+ Prepared by Solution Combustion Synthesis (SCS). Photonics 2024, 11, 642. [Google Scholar] [CrossRef]
  43. Blasse, G.; Grabmaier, B.C. A general introduction to luminescent materials. In Luminescent Materials; Springer: Berlin/Heidelberg, Germany, 1994; pp. 1–9. [Google Scholar]
  44. McInnes, L.; Healy, J.; Melville, J. UMAP: Uniform Manifold Approximation and Projection for Dimension Reduction. arXiv 2018, arXiv:1802.03426. [Google Scholar] [CrossRef]
  45. Mei, S.; Guo, Y.; Lin, X.; Dong, H.; Sun, L.D.; Li, K.; Yan, C.H. Experimental and simulation insights into local structure and luminescence evolution in Eu3+-doped nanocrystals under high pressure. J. Phys. Chem. Lett. 2020, 11, 3515–3520. [Google Scholar] [CrossRef]
  46. Zhang, C.C.; Zhang, Z.M.; Dai, R.C.; Wang, Z.P.; Zhang, J.W.; Ding, Z.J. High-pressure raman and luminescence study on the phase transition of GdVO4: Eu3+ microcrystals. J. Phys. Chem. C 2010, 114, 18279–18282. [Google Scholar] [CrossRef]
  47. Wang, C.; Li, Y.; Chen, S.; Li, Y.; Lv, Q.; Shao, B.; Zhao, L. A novel high efficiency and ultra-stable red emitting europium doped pyrophosphate phosphor for multifunctional applications. Inorg. Chem. Front. 2021, 8, 3984–3997. [Google Scholar] [CrossRef]
  48. Chen, X.; Lou, H.; Zeng, Z.; Cheng, B.; Zhang, X.; Liu, Y.; Xu, D.; Yang, K.; Zeng, Q. Structural transitions of 4:1 methanol–ethanol mixture and silicone oil under high pressure. Matter Radiat. Extrem. 2021, 6, 038402. [Google Scholar] [CrossRef]
  49. Cheng, X.; Wang, Z.; Zhang, H.; Ren, Y.; Zhu, X.; Yang, K. Structural stability and phonon anharmonicity of Y2MoO6 Raman spectroscopic and XRD studies. Phys. B Condens. Matter 2017, 521, 43–48. [Google Scholar] [CrossRef]
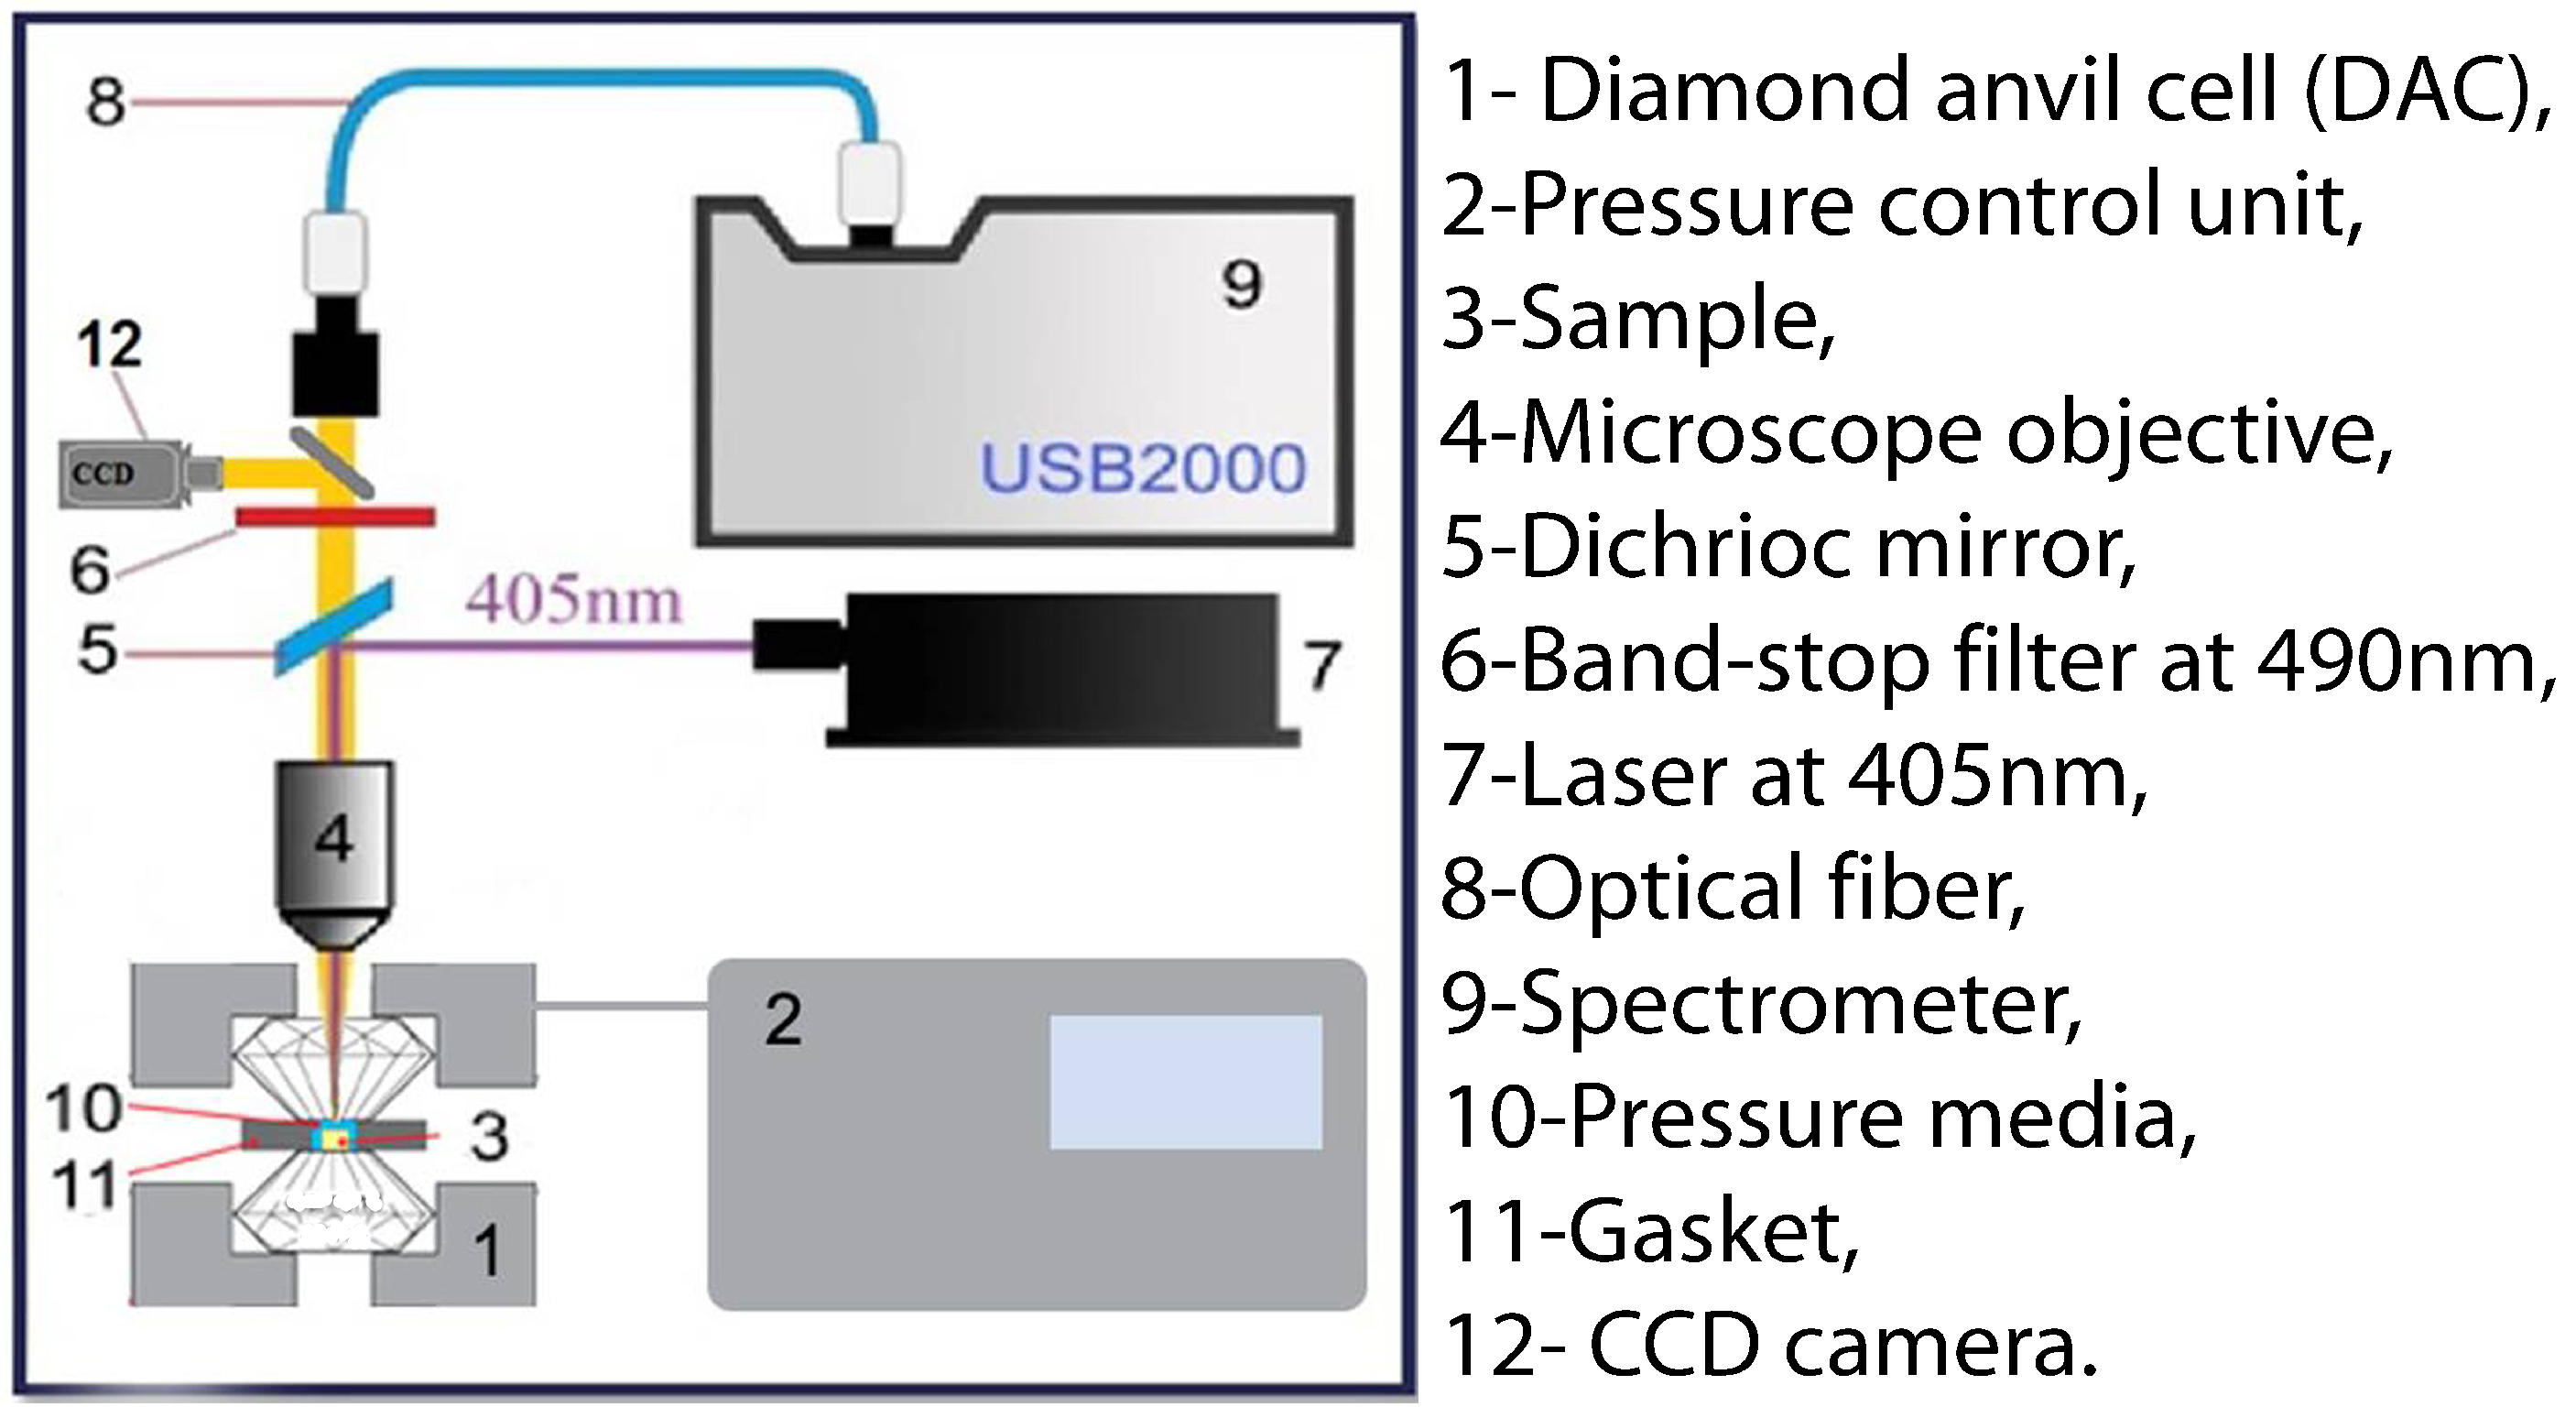
Figure 1. Pressure measurement with DAC up to 100 GPa (1 Mbar).
Photonics 12 01024 g001
Figure 2. Ruby luminescence red shift at high pressure.
Photonics 12 01024 g002
Figure 3. Luminescence spectra of Y2MoO6:Eu3+ at various pressures. (Continuous laser diode excitation at 405 nm). The green lines denote the region of interest for calculating the intensity ratio.
Photonics 12 01024 g003
Figure 4. High-pressure sensing intensity ratio calibration data drawn from luminescence spectra of Y2MoO6:Eu3+ nanophosphor. The points could not be reasonably fitted with a single curve.
Photonics 12 01024 g004
Figure 5. Color coding of measured pressures of Y2MoO6:Eu3+ sample.
Photonics 12 01024 g005
Figure 6. Uniform Manifold Approximation and Projection (UMAP) clustering of Y2MoO6:Eu3+ spectra at different pressures. NN denotes nearest neighbour, MD denotes minimum distance and NC denotes number of components.
Photonics 12 01024 g006
Figure 7. The learning curves depicting the training progress of the ANNDL model using the ADAM optimizer.
Photonics 12 01024 g007
Figure 8. The learning curves depicting the training progress of the ANNDL model using the ADAMAX optimizer.
Photonics 12 01024 g008
Figure 9. Plot of predicted pressures using the training set of 10 samples for each pressure. RMSEC = 0.106 GPa refers to the root mean standard error of calibration; RMSECV = 0.312 GPa refers to the root mean standard error of cross-validation (Adam optimizer).
Photonics 12 01024 g009
Figure 10. Plot of predicted pressures using the training set of 10 samples for each pressure. RMSEC = 0.105 GPa refers to the root mean standard error of calibration; RMSECV = 0.150 GPa refers to the root mean standard error of cross-validation.
Photonics 12 01024 g010
Figure 11. Residuals plot for Adam optimizer.
Photonics 12 01024 g011
Figure 12. Residuals plot for Adamax optimizer.
Photonics 12 01024 g012
Disclaimer/Publisher’s Note: The statements, opinions and data contained in all publications are solely those of the individual author(s) and contributor(s) and not of MDPI and/or the editor(s). MDPI and/or the editor(s) disclaim responsibility for any injury to people or property resulting from any ideas, methods, instructions or products referred to in the content.