Abstract
This study presents a Raman-spectroscopy-based quantitative analysis technique for measuring strain in Kevlar single fibers embedded in concrete. By irradiating the fibers with a laser, the researchers established a linear relationship between Raman scattering intensity and the fibers’ cross-sectional area, linking spectral parameters (e.g., peak position, half-width, intensity, and area) to mechanical strain. Experiments on DuPont Kevlar 49 fibers involved axial tensile loading using a micro-loading device, with Raman spectra (785 nm laser) captured at each displacement step. The results showed that the G’ peak position (1610 cm−1) shifted linearly with strain, while the peak area provided the most reliable correlation. Scanning electron microscopy (SEM) validation confirmed the method’s accuracy for early-stage strain measurements (maximum deviation: 7.31%), although excessive loading caused surface damage and signal distortion. The study demonstrates the feasibility of Raman spectroscopy for micro-scale strain analysis in fiber-reinforced concrete, despite sensitivity to experimental conditions (e.g., laser intensity, optical alignment).
1. Introduction
Fiber-reinforced concrete is widely applied in daily life as a new building material. These low-dimensional materials with unique mechanical properties exhibit macroscopically different surface and interface physical phenomena. Driven by the needs of housing construction, structural engineering, and manufacturing technology, production technologies and fundamental theories for fiber-reinforced concrete continue to advance. This progress is broadening its applications, thereby making the reliability of these composites a critical concern. It is of great significance to study the micro-scale mechanical behavior of fiber-reinforced concrete structures. Fiber materials with a variety of high-quality mechanical properties as reinforced concrete materials are used to enhance the performance of the materials. The performance of the reinforced material can complement that of the substrate material. The main varieties of fiber concrete include asbestos cement, steel fiber concrete, glass fiber concrete, polypropylene fiber concrete, carbon fiber concrete, plant fiber concrete, and synthetic fiber concrete with high elastic moduli. The development and improvement of these composites require a deep understanding of the mechanical properties and nature of fiber-reinforced concrete. The quest for this understanding often relies on robust modeling techniques to predict composite behavior [1]. Therefore, it is very important to develop a method and technique for measuring the strain of concrete fibers quickly and accurately. Aramid fiber has a strength five times that of the strength of steel, yet its density is only one-fifth that of steel (Kevlar density of 1.44 g per cubic centimeter, steel density of 7.859 g per cubic centimeter), arousing a lot of attention [2]. Compared with carbon or glass fibers, Kevlar exhibits different interfacial bonding and deformation mechanisms when embedded in concrete, which remain insufficiently understood. While Raman spectroscopy has been widely applied to measure strain in carbon, glass, and polymer fibers, the case of Kevlar/concrete composites has rarely been studied. Therefore, focusing on Kevlar provides unique engineering significance and complements existing studies. Kevlar is widely used to reinforce concrete, enhancing its tensile strength, flexural strength, impact resistance, elongation, and toughness. Although many attempts have been made to study the tensile strain measurement of this concrete organic fiber, they are all constrained in the field of theoretical derivation and finite element simulation and are seldom able to accurately measure internal fiber stress transfer, tensile strength, and other issues. Therefore, it is necessary for us to further study the deformation and morphology of the fiber concrete. In the 1920s, Indian physicists discovered the phenomenon of photo-elastic scattering, namely, the Raman effect, which explains the wavelength shift of a small radiation part caused by molecular scattering of light with a different frequency than the incident light [3,4].
Since the 1960s, advancements in lasers, weak signal detection, computing, and instrumentation have spurred the rapid development of Raman spectroscopy. This has led to its widespread application across diverse fields, including materials science, chemistry, archaeology, and environmental science [5,6,7,8,9,10], making remarkable achievements in various fields. It has been seen as a great contribution to the development of human scientific research and social progress. As a newly non-destructive analysis and detection technique, Raman spectroscopy is mainly applied in the fields of molecular structure analysis, bond state characterization, and qualitative identification [11,12,13,14]. Some scholars have studied the strain of fibers in fiber-reinforced concrete using optical techniques [15,16,17]. However, most of these studies focused on theoretical modeling or on fibers such as carbon and glass, leaving Kevlar-reinforced concrete largely unexplored. This gap motivates our present work. Raman spectroscopy belongs to molecular vibrational spectroscopy, which is caused by the inelastic scattering of photons or molecules. The physical basis of Raman spectroscopy applied to micro-scale mechanics measurement is that Raman scattering reflects the vibrational energy of the crystal lattice. Lattice deformation leads to changes in the peak of the Raman characteristics, and the strain (or stress) can be measured by detecting Raman line changes [18]. When a single fiber in concrete is subjected to an axial load, the characteristics of the Raman spectra in the concrete exhibit obvious changes. The stress and strain on the fibers in the concrete can be obtained by calculating with the spectral theory by measuring the peak height, peak area, and frequency shift of the Kevlar single-fiber Raman peaks in the concrete. In this article, we propose a Raman spectroscopy quantitative analysis technique, which is different from traditional qualitative analysis techniques, for Kevlar fiber strain measurement, where the contribution of the change in the scattering of Raman spectrum signals can be described by introducing a quantitative analysis parameter. The basic formula for strain measurement describes and validates the Kelvar 49 monofilament tension force using Raman spectroscopy. The quantitative analysis technique based on Raman spectroscopy is mainly applied to the analysis of aqueous solution samples because the Raman scattering intensity is related to the sample concentration and is minimally affected by the moisture content. The Raman scattering signal of the sample is relatively strong. However, these methods have some drawbacks; for example, they require a lot of time to calculate the fiber strain, and the calculation data are too large to measure the surface strain of a single fiber on a large scale. Different Raman scattering efficiencies of different materials and the influence of the test conditions on Raman scattering intensities make it impractical for relating Raman scattering directly with the concentration or mass; thus, Raman spectroscopy has long been considered infeasible in quantitative analysis. Wopenka et al. proposed a Raman intensity normalization theory, laying the theoretical foundation for the quantitative analysis of Raman spectra based on the intensity ratio, and they developed the Raman spectroscopic analysis technique quantitatively [19]. The intensity of the Raman scattering appears to be linear with the concentration; however, the Raman scattering intensity is also influenced by the test conditions (excitation light intensity, optical configuration of the device, sample calibration, etc.), making it impossible to directly relate the scattering intensity to the amount of the test object. So, the influence of the test conditions must be eliminated. The basis of the fiber strain measurement analysis in the fiber concrete composite using spectroscopy is that there exists a linearly proportional relationship between the measured Raman peak height of the analytes and the amount of Kevlar fibers involved in the Raman scattering.
In recent years, distributed fiber optic sensing has emerged as a powerful non-destructive testing technique for civil engineering materials. For example, Brillouin and Rayleigh backscattering-based distributed optical fiber sensors have been applied to monitor strain and cracks in reinforced concrete structures [20,21]. Fiber Bragg gratings (FBGs) have also been widely employed for high-precision strain monitoring under various loading conditions [22,23]. These optical sensing methods provide valuable large-scale monitoring capabilities, but their resolution at the micro-scale fiber–matrix interface is still limited. The quantitative method based on Raman spectroscopy proposed in this study can directly and quickly detect strain transfer within Kevlar single fibers embedded in concrete, thereby supplementing distributed and fiber-Bragg-grating-based methods and providing unique insights into the micromechanics of fiber-reinforced composite materials.
2. Basic Principles
When a laser beam irradiates a sample of a Kevlar single fiber in concrete, the experimental sample of the fabricated fiber concrete is shown in Figure 1.
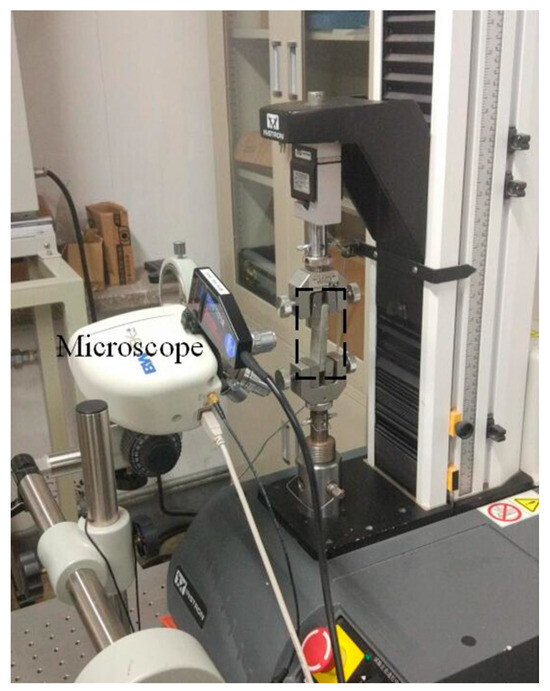
Figure 1.
Spectrum signal acquisition of fiber-reinforced concrete.
The portable Raman spectrometer model used in the experiment is B&W Tek Prime T, and the laser wavelength used is 785 nm, the laser power is 10 mW, the spectral scanning range is 1550 cm−1–1650 cm−1, and the objective magnification is 10×. Among them, the circular diameter of the laser spot is 120 μm, and the single fiber size is 12 μm. Environmental conditions are as follows: room temperature ≈25 °C and relative humidity ≈40%. The laser polarization direction is parallel to the direction of the Kevlar single fiber. The Raman signal is the sum of all lattice scatterings on a single Kevlar fiber. The Raman scattering intensity of a Kevlar single fiber is proportional to the number of molecules in the scattering lattice.
The Kevlar single-fiber Raman scattering information is proportional to the cross-sectional area of the Kevlar single fiber irradiated, and its Raman scattering intensity I can be expressed as
where is the Raman scattering cross-section per unit area; is the small area element; is the integrating the fiber area illuminated by the laser spot; and C is a constant correlated with the optical absorption coefficient and optical transmission depth parameters. For example, Il is the laser intensity counted in photons per second; si is the scattering cross-sectional area of the ith molecule, expressed in cm2. is the sum of the scattering cross-sectional areas of all N molecules irradiated by the laser, equal to the cross-sectional area D of the irradiated Kevlar single fiber. Visibly, under the same test conditions involving laser intensity, irradiation time, optical spectrometer, and sample, the Raman scattering intensity of the object is linear with the irradiated area. Therefore, if the laser intensity and the focal spot area remain unchanged, the deformation of the Kevlar single fiber in the laser focusing spot would change the molecular number of the scattering lattice; thus, the ratio of the intensity of Raman scattering light before and after deformation of the irradiated Kevlar single fiber can be expressed as
I0 and I1 are the Raman scattering intensities of the Kevlar single fibers before and after deformation, respectively. D0 and D1 are the cross-sectional areas of the irradiated Kevlar single fibers before and after deformation, respectively.
Figure 2 is an enlarged view of the area outlined by the black square in Figure 1. The laser spot diameter is much larger than that of the single Kevlar fiber (as shown in Figure 2 and Figure 3) and “negligible collection efficiency and radial position variation”, the Raman intensity can be approximately proportional to the cross-sectional area of the fiber.
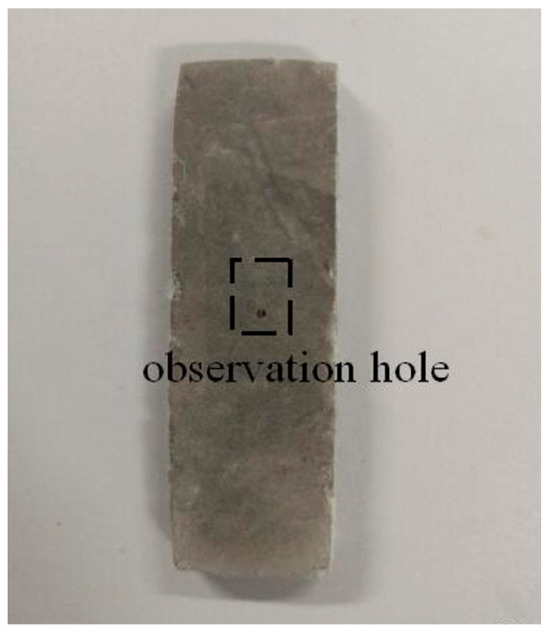
Figure 2.
Fiber-reinforced concrete sample with observation holes.
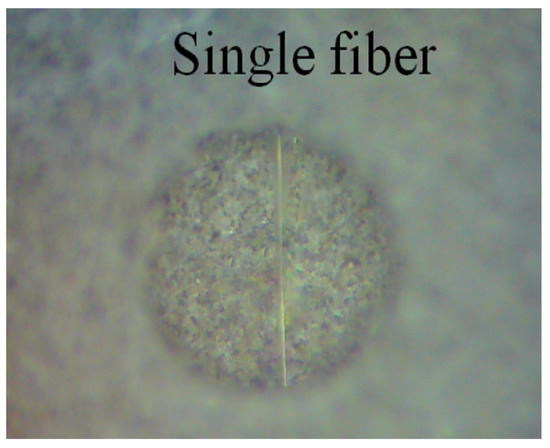
Figure 3.
Single fiber with observation holes.
The cross-sectional area of the Kevlar single fiber can be derived from the geometric relationship, where r is the radius of the Kevlar single fiber, R is the laser spot radius, and β is the central angle formed by the intersection of the fiber and the laser spot. In general, the laser spot diameter 2R is much larger than the fiber diameter 2r, so the irradiation cross-sectional area of the fiber is approximately equal to the rectangular area, namely
It is assumed that the elongation of a single Kevlar monofilament is Δl when a tensile load is applied along the Kevlar monofilament. Because of the Poisson effect, the horizontal shrinkage of the fiber is Δr when the single Kevlar fiber after deformation is still in the laser focus spot, and the irradiation cross-sectional area becomes
Further, according to the definition of Poisson’s ratio, the amount of lateral shrinkage Δr can be written as
where µ is Poisson’s ratio and remains constant during the elastic deformation phase. l is the length of the Kevlar single fiber in the laser irradiation zone and is equal to the laser spot diameter, that is, l = 2R. Equation (5) can be taken into Equation (4) for simplification, and the irradiation cross-sectional area of the single Kevlar fiber after deformation is
Taking Equations (3) and (6) into Equation (2), the Raman scattering light intensity ratio of the fiber after deformation becomes
In the actual measurement, I0, I1, Δl, and R are known quantities; then, from the above formula, Poisson’s ratio of the single Kevlar fiber can be obtained
Finally, the axial strain and transverse strain of the single fiber are expressed as follows
It can be seen from Equations (9) and (10) that given the tensile displacement of a single Kevlar fiber, and with the laser intensity and the focal spot area being constant, the Poisson’s ratio parameters and strain can be calculated by the change in Raman intensities.
3. Experiments
3.1. Single-Fiber Test Process
Experiments were conducted using DuPont Kelvar49 (Wilmington, DE, USA) fiber samples; the length of the fiber was about 40 mm, and the fiber diameter was about 12 mm. Kevlar single fiber ends were glued to the micro-loading device, a self-made stretching device was used, and a number of displacement steps were applied to stretch along the axial direction of the fiber.
The displacement load was 0.1 mm per step. As shown in Figure 4, the Raman laser polarization was parallel to the Kevlar monofilament axis, in alignment with the loading direction at each load step.
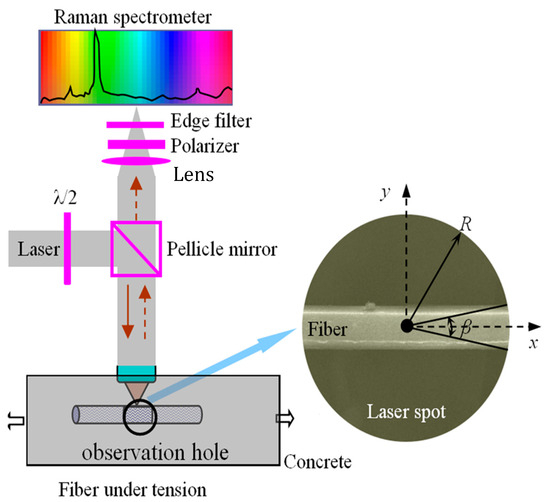
Figure 4.
Schematic diagram of spectrum signal acquisition for fiber-reinforced concrete and Raman scattering area in laser spot.
A portable Raman apparatus (B & W Tek Prime T, Newark, DE, USA), as seen in Figure 5a, was used to obtain the Raman spectrum of the Kevlar single-fiber surface with back-illuminated Charge-Coupled Device Camera (CCD) (AVT Guppy F080B, Allied Vision Technologies GmbH, Stadtroda, Germany) collecting the Raman scattered light. Figure 5b shows a handheld micro-force stretcher. Figure 5c shows a single fiber placed on a micro-force stretcher.
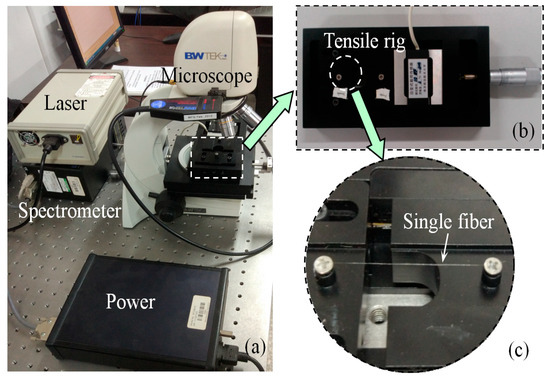
Figure 5.
(a) Setup system of Raman spectroscopy; (b) a handheld micro- force stretcher; (c) a single fiber placed on a micro- force stretcher.
The laser wavelength was 785 nm, the laser power was 10 mW, the magnification of the objective lens was 10×, and the spectral scanning range was from 1550 cm−1 to 1650 cm−1.
3.2. Raman Spectroscopy
The axial strain of the Kevlar 49 single fiber and its 1610 cm−1 frequency shift value of the Raman characteristic peak changed linearly, that is
ω and are the frequency shift at the characteristic peak of 1610 cm−1 before and after deformation, respectively, Δω is the increment of the frequency shift, and ε is the axial strain of the single Kevlar fiber. The constant factor that characterizes the linear relationship between the axial strain of the single Kevlar fiber and the Raman shift is defined as the axial strain frequency shift factor, ϕ
Figure 6 shows a typical Raman spectrum of Kevlar 49 aramid fibers. The strongest G’ peak is located around 1610 cm−1, corresponding to the tensile vibration mode of the C = C bond of the benzene ring. In the 1590 cm−1 to 1630 cm−1 spectral line, the G’ peak can be fitted to the unimodal Raman spectrum using the Gauss function and the WiRE 3.2 software.
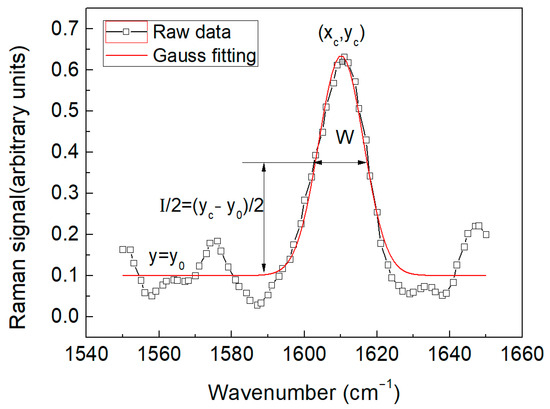
Figure 6.
Typical Raman spectra of Kevlar 49 fiber without applied strain.
The Raman spectrum characteristic peaks of the material can be represented by the Gauss function, expressed in Equation (13), namely
A = 1.06R*W/2, where y0 is the baseline, A is the area under the Gauss curve, W is the width at half height, xc is the wave number of the G’ peak, and I = yc − y0 is the G’ peak intensity. The Gaussian function describes the Raman spectral characteristic curve of the Kevlar 49 single Kevlar fiber as
where x is the horizontal coordinate of the frequency shift in the spectral curve, xc is the frequency shift at the 1610 cm−1 characteristic peak, W is the frequency shift at the 1610 cm−1 characteristic peak, R is the scattering intensity at the 1610 cm−1 characteristic peak, and I represents the peak of the spectral curve function y with setting = 0, ignoring the impact of ambient light. Assuming N strands are contained in the sample spot, as shown in Figure 3, the distance from the ith fiber to the spot center is θ, the corresponding axial strain results in the Raman shift, and Equation (14) above becomes
Taking the above formula into Equation (14) gives
The spectral data collected by the Raman experiment are the multiple responses (superposition) of the Raman spectrum information of all the fibers in the sampling point and can be numerically simplified to the linear superposition of all the fiber spectral curves
Using Equations (13) and (15), the area under the Raman peak can be described as
Equation (15), with the objective of making the treated spectral curve coverage area 1, is normalized as follows
Because
And
are the normalized functions, so we have
Thus,
Similarly, the normalization of IALL (x) is carried out
Visibly,
is numerically equal to the sum of the areas covered by all the fiber spectral curves within the focusing point
Therefore, Z(x) can be regarded as a linear superposition of N mutually independent Gaussian distributions /2). When the tested object is deformed under load, it causes a change in the atomic spacing of the tested object, resulting in a change in the Raman spectral characteristic peak waveform, as shown in Figure 7. Next, experiments need to be conducted to analyze the sensitivity of various Raman waveform parameters to the load.
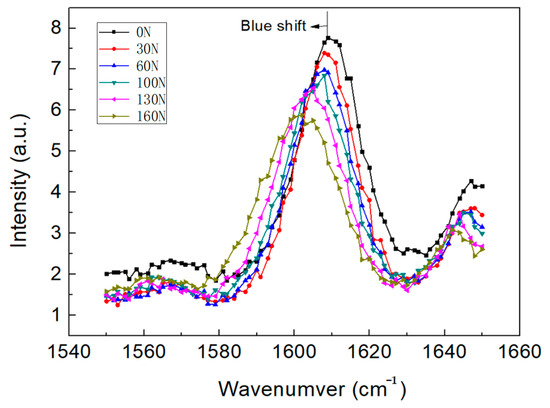
Figure 7.
Raman blue shift of yarn under different load levels.
It can be seen that when the Kevlar yarn is subjected to an axial tensile load, the C = C bond of the benzene ring is elongated, and the Raman spectrum parameters corresponding to the G’ peak change (Blue shift), including the G’ peak position, the width at half height, light intensity, and area parameters.
4. Results and Discussions
4.1. Relationship Between Raman Spectral Parameters and Strains of Single Kevlar Fiber
The Gaussian function was used to fit the Kevlar single-fiber G′ unimodal Raman spectra under different strains to obtain the relationship between the regularization parameters and load, as shown in Figure 7. It can be seen that all the four parameters of the Raman spectrum, such as the G′ peak position xc, width at half height W, light intensity I, and area A, tend to increase with strain. The R-Square metric is used to measure the linear correlation between each parameter of the Raman spectra and the strain. The relationship between normalized Raman parameters and strain is also given, as shown in Figure 8. Judging from the two indicators, the optimal spectral parameter that characterizes the strain is the peak position xc, the area A is the second parameter, whereas the width at half height W comes last. Therefore, in this article, the peak position G′ is used as a spectral parameter to relate to the strain. When the Kevlar single fiber is subjected to an axial strain, the Raman spectrum line corresponding to the peak position G′ shows a Raman shift ∆.
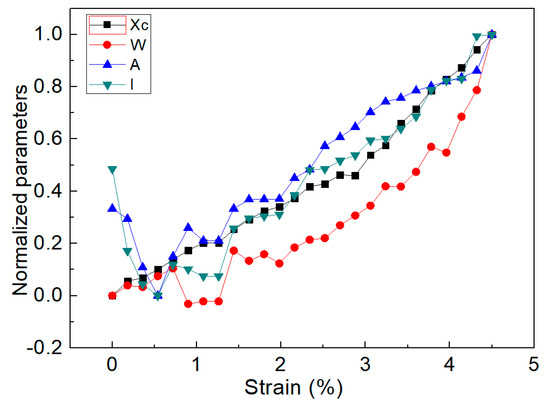
Figure 8.
Relationship between normalized Raman parameters and strain.
xc and x′c are the G′ peak positions before and after the deformation of the single fiber, respectively. According to Figure 8, the relationship between the Raman frequency, corresponding to the single fiber, and strain is obtained, as is shown in Figure 9 below.
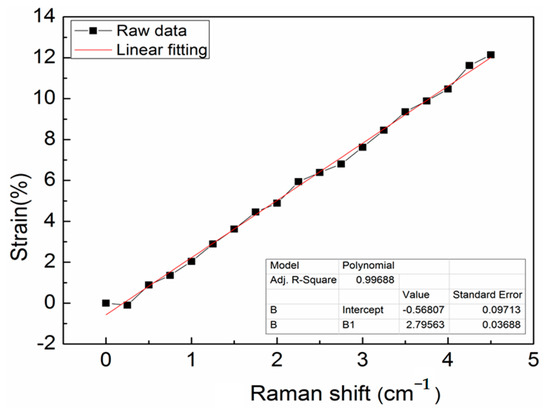
Figure 9.
Linear fitting curve between Raman frequency shift and single fiber strain.
4.2. Relationship Between Spectral Parameters and Strain of Single Fiber in Concrete
The integral function of the Raman scattering signal intensity is the integral light intensity of the incident laser light irradiated at the Kevlar single fiber region. After the Kevlar single fiber under laser irradiation undergoes tensile deformation, the measured scattering Raman peak intensity of the fiber will change. The correlation between the fiber radiation area and the Raman spectra can be derived from the above principle formula. In the characteristic peak spectrum section (1590–1630 cm−1), there is a highly linear correlation between the fiber irradiated area and the Raman spectra, which reaches a maximum at 1610.1651 cm−1. To further reveal the relationship between them, the relationship between the tensile length of the single fiber in the laser region and the Raman characteristic point (1610.1 cm−1) intensity is shown in Figure 10; the related curve of the analyte Raman peak intensity (cumulative wave number) and the analyte concentration is a straight line.
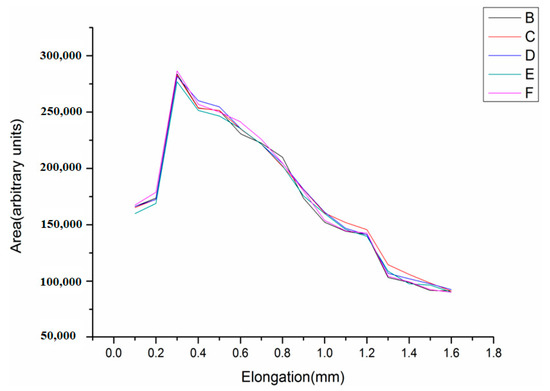
Figure 10.
The relationship between the Raman intensity of the fiber and expanded area.
The linear relationship between the Raman intensity of the fiber and expanded area of the fiber measured by Raman spectroscopy is obtained. The Kevlar single-fiber Raman peak intensity curve, after fitting, is in line with the function curve description. By analyzing the Raman spectra of Kevlar single fibers at different tensile lengths, the corresponding relationship between the Raman peak intensities and the tensile lengths was derived. It can be seen that the tensile strength of the Kevlar 49 single fibers in three-dimensional space is basically linear with the Raman peak intensity. The single-fiber Raman experimental data were imported into the origin software; after processing, the characteristic peak fitting function was obtained, which could be used to calculate the characteristic peak intensity and area under the peak.
Therefore, the Raman data of 0%, 0.5%, 1.0%, 1.5%, 2.0%, and 2.5% strains were imported into the origin software, respectively, the relationship between the Raman spectra curves with different strains and the characteristic peak intensities was obtained. The data are displayed in Figure 11.
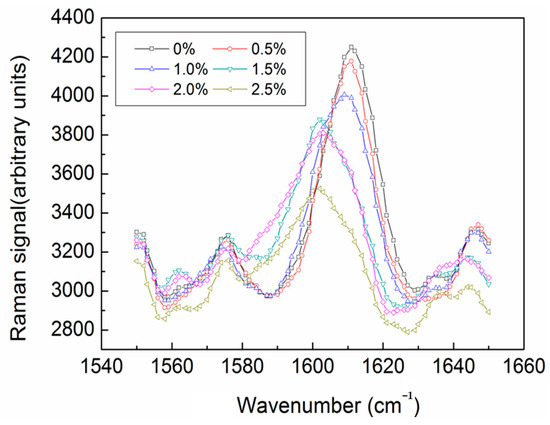
Figure 11.
The relationship between Raman spectral curves and different strains.
Therefore, according to the experimental results, the area under the peak serves as a more convincing parameter that establishes a linear relationship with the single-fiber strain. The area under the 1610 cm−1 characteristic peaks with five samples of different strains was calculated; thus, the corresponding data of the area of the Raman irradiated region of the single fiber and the peak intensity of the Raman spectra are shown in Figure 12.
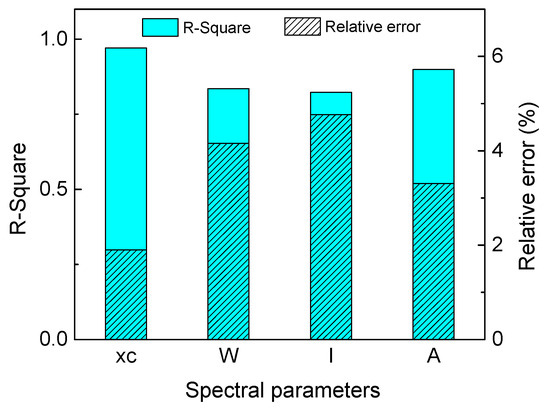
Figure 12.
R-Square and relative error for each spectral parameter.
The R-Square metric is a statistical measure of the goodness of fit of the linear correlation curve between various Raman spectral parameters and the load. It also provides a relative error metric for the goodness of fit of the parameters’ linear correlation, as shown in Figure 12. By judging from these two indicators, it can be concluded that the optimal spectral parameter for characterizing the load applied to the fiber is the peak position xc, while the goodness of fit of the linear correlation between the Raman spectral parameters and the load is ranked second for the area under the Raman spectral characteristic peak A, and the goodness-of-fit value of the Raman characteristic peak at half width W is the worst.
Therefore, utilizing the area under the Raman spectral characteristic peak A value of the Raman spectral characteristic peaks has high sensitivity and a strongly linear relationship with the load, and it is necessary to further establish the proportional factor between the area under the Raman spectral characteristic peak A and the stress of the single fiber.
In Figure 10, it can be seen that the Raman intensities increase in 1 to 3 steps and decrease in 4 to 16 steps during loading, which is somewhat inconsistent with the previous theory that the intensity of Raman peaks drops directly with the fiber tensile peak intensity. The reason for this phenomenon is that when the Kevlar single fiber is pulled, the surface of the fiber is pulled as well, the surface wrinkles of the fiber becomes smaller, the scales are attached to the single fiber, and the surface becomes smoother, resulting in an increase in the fiber Raman scattering intensity. Therefore, this peak can be used to calibrate fiber surface roughness during the fiber production process. With the first three steps omitted, elastic deformation of the Kevlar single fiber was obtained from the fourth step. Linear fittings were performed for the remaining curves to obtain a linear equation. From the linear distributions of the data in Figure 13, it can be proven that the previous reasoning process is correct, indicating that the data obtained were valid for the following analysis.
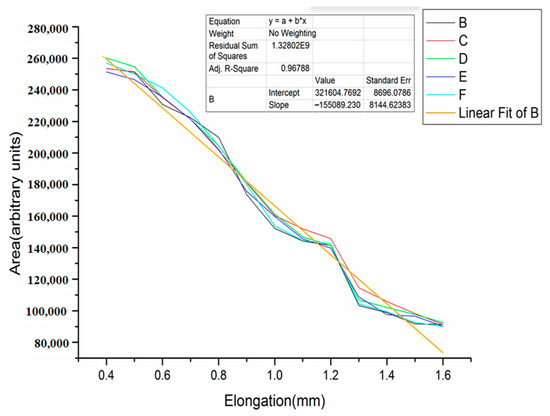
Figure 13.
Fitting curves.
The data in Table 1 were incorporated in Equation (10). The fiber transverse strains at each load step could be acquired. The average of five areas under the peaks were then incorporated in Equation (14) with a fiber length of 40 mm. The horizontal strain at each stage is given in Table 1. SEM verification scanning electron microscopy (SEM) can be directly used to form microscopic imaging by virtue of the fiber’s surface properties. Through a higher magnification, the single-fiber sample surface microstructure can be directly observed. With the aid of an in situ tension meter built in the scanning electron microscope, real-time observations of the material and micro-area imaging of the surface can be achieved simultaneously, so the accuracy of the quantitative analysis for the Kevlar monofilament strains can be tested by data comparison. An SEM image of a Kevlar single fiber arranged in the in situ tensile gauge is shown in Figure 14.

Table 1.
Data of Raman irradiated area and peak area.
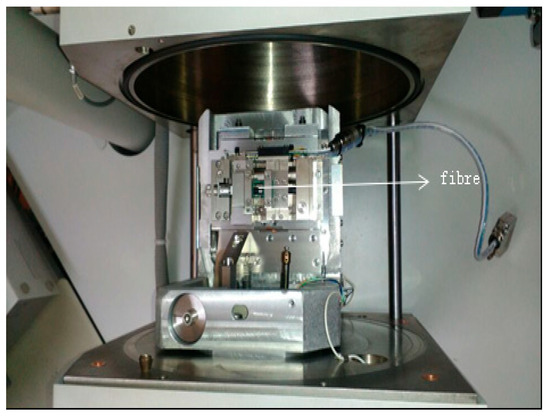
Figure 14.
Electron microscope and in situ stretching instrument.
In situ scanning imaging was performed on Kevlar single fibers in a scanning electron microscope. The Kevlar single fibers were tensioned on the in situ tensile/compression testing platform using a scanning electron microscope.
The displacement sensor and the 0%, 0.5%, and 1% tension–compression sensor constituted the load displacement signal detection and control unit, making the fiber tensile step consistent with the Raman micro-loading device to obtain the fiber morphology and SEM pictures of diameters under different axial strains, as shown in Figure 15 and Figure 16. Exclusion calculation was conducted, the data are shown in the following Table 2.
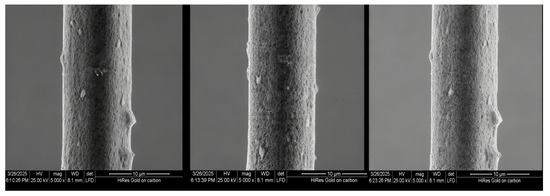
Figure 15.
Scanning electron micrographs of fiber strains.
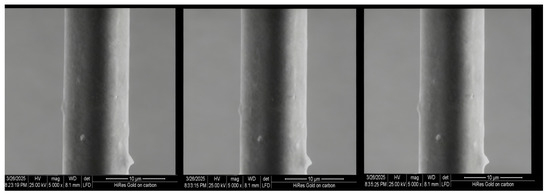
Figure 16.
Scanning electron micrographs of fiber strains with 1%, 2%, and 2.5%.

Table 2.
Data of fiber irradiated area and Raman peak area.
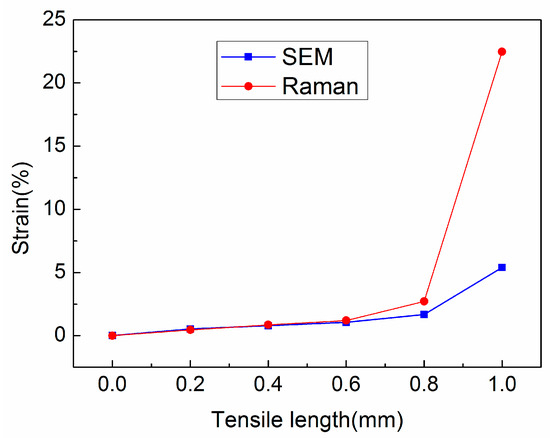
As is seen in Figure 17, it was found that in the early stage of fiber stretching, the transverse strain of the single fiber obtained by Raman quantitative analysis is closer to the accurate value, and the maximum deviation rate is 7.31%, yet the data in the latter stage are almost distorted. We also included standard deviation and confidence interval calculations from multiple repeated measurements, which support the robustness of the reported maximum deviation of 7.31%.
Specifically, we now explain that the observed maximum deviation arises from three primary sources:
- Laser intensity fluctuation during repeated measurements;
- Fiber surface heterogeneity (wrinkles and defects affecting scattering efficiency);
- The surface of fiber being broken after being excessively loaded and the Raman reflection signal intensity being disturbed.
The specific situations are complicated.
5. Conclusions
This study confirms the feasibility of using Raman spectroscopy for strain measurement in Kevlar single fibers, thereby establishing a new approach for micro-scale mechanical characterization. Unlike conventional methods such as fiber Bragg gratings (FBGs), which require sensor embedding and lack sub-millimeter resolution, or Digital Image Correlation (DIC), which is limited by surface pattern and optical magnification, the Raman method provides direct, non-contact measurement of molecular-level strain with high spatial resolution. This makes it uniquely suited for investigating fundamental fiber mechanics, interfacial behavior in micro-composites, and stress transfer in miniaturized devices. Although the measurement reliability can be influenced by factors such as excitation light intensity, optical configuration, and sample calibration, these do not undermine the fundamental accuracy of the method. It is acknowledged that the conclusions are primarily drawn from a limited set of single-fiber tests. Future work should therefore expand to multiple fibers, larger sample sizes, and varied loading conditions to enhance statistical robustness and broaden the applicability of this technique.
Author Contributions
Conceptualization, F.Q., X.F., Y.W., and Z.D.; validation, J.Z., Z.D., Y.W., W.Q., J.S., and X.Z.; investigation, F.Q., X.F., and Z.D.; resources, F.Q., X.F., J.Z., and Z.D.; writing—original draft preparation, F.Q., X.F., and Y.W.; writing—review and editing, F.Q., X.F., and J.Z.; visualization X.Z., W.W., Q.W., Y.M., and F.S.; supervision, F.Q., X.F., and Z.D.; funding acquisition, F.Q. and X.F. All authors have read and agreed to the published version of the manuscript.
Funding
This work was supported by the the 2024 Weifang Science and Technology Development Plan Project (2024GX018). This research was funded by the Shandong Province Key Research and Development Program (Science and Technology Smes Innovation Ability Improvement Project) (grant no. 2024TSGC0553) and the Weifang Science and Technology Development Program (Competitive Innovation Platform) (grant no. 2024JZ0021).
Data Availability Statement
The raw data supporting the conclusions of this article will be made available by the authors on request.
Conflicts of Interest
The authors declare that they have no known competing financial interests or personal relationships that could have appeared to influence the work reported in this paper.
References
- Toapanta, O.G.; Paredes, J.; Meneses, M.; Salinas, G. Validation of DOE Factorial/Taguchi/Surface Response Models of Mechanical Properties of Synthetic and Natural Fiber Reinforced Epoxy Matrix Hybrid Material. Polymers 2024, 16, 2051. [Google Scholar] [CrossRef]
- Yuan, Z.; Li, Y.; Zhang, Y.; Wang, Z.; Zhang, Z. A quantitative assessment of the rehabilitative impact of Kevlar liners on offshore pipelines. Eng. Fail. Anal. 2024, 164, 108616. [Google Scholar] [CrossRef]
- Yoshikawa, M.; Mori, Y.; Maegawa, M.; Katagiri, G.; Ishida, H.; Ishitani, A. Raman scattering from diamond particles. Appl. Phys. Lett. 1993, 62, 3114–3116. [Google Scholar] [CrossRef]
- McCreery, R.L.; Cooper, J.B. Raman Spectroscopy for Chemical Analysis. Appl. Spectrosc. 2001, 55, 295–308. [Google Scholar] [CrossRef]
- Kothari, D.; Reddy, V.R.; Sathe, V.; Gupta, A.; Banerjee, A.; Awasthi, A. Raman scattering study of polycrystalline magnetoelectric BiFeO3. J. Magn. Magn. Mater. 2008, 320, 548–552. [Google Scholar] [CrossRef]
- Schedin, F.; Lidorikis, E.; Lombardo, A.; Kravets, V.G.; Geim, A.K.; Grigorenko, A.N.; Novoselov, K.S.; Ferrari, A.-C. Surface Enhanced Raman Spectroscopy of Graphene. ACS Nano 2010, 4, 5617–5626. [Google Scholar] [CrossRef]
- Liang, L.Y.; Liu, Z.M.; Cao, H.T.; Yu, Z.; Shi, Y.Y.; Chen, A.H.; Zhang, H.Z.; Fang, Y.Q.; Sun, X.L. Phase and Optical Characterizations of Annealed SnO Thin Films and Their p-Type TFT Application. J. Electrochem. Soc. 2010, 157, H598–H602. [Google Scholar] [CrossRef]
- Kalbac, M.; Reina-Cecco, A.; Farhat, H.; Kong, J.; Kavan, L.; Dresselhaus, M.S. The influence of strong electron and hole doping on the Raman intensity of chemical vapor-deposition graphene. ACS Nano 2010, 4, 6055–6063. [Google Scholar] [CrossRef] [PubMed]
- Stock, G.; Woywod, C.; Domcke, W.; Swinney, T.; Hudson, B.S. Resonance Raman spectroscopy of the S1 and S2 states of pyrazine: Experiment and first principles calculation of spectra. J. Chem. Phys. 1995, 103, 6851–6860. [Google Scholar] [CrossRef]
- Bergholt, M.S.; Zheng, W.; Lin, K.; Ho, K.Y.; Teh, M.; Yeoh, K.G.; So, J.B.Y.; Huang, Z. Characterizing variability in in vivo Raman spectra of different anatomical locations in the upper gastrointestinal tract toward cancer detection. J. Biomed. Opt. 2011, 16, 037003. [Google Scholar] [CrossRef]
- Malfait, W.J.; Zakaznova-Herzog, V.P.; Halter, W.E. Quantitative Raman spectroscopy: High-temperature speciation of potassium silicate melts. J. Non-Cryst. Solids 2007, 353, 4029–4042. [Google Scholar] [CrossRef]
- El-Abassy, R.M.; Eravuchira, P.J.; Donfack, P.; von der Kammer, B.; Materny, A. Fast determination of milk fat content using Raman spectroscopy. Vib. Spectrosc. 2011, 56, 3–8. [Google Scholar] [CrossRef]
- Samek, O.; Al-Marashi, J.F.M.; Telle, H.H. The potential of Raman spectroscopy for the identification of biofilm formation by Staphylococcus epidermidis. Laser Phys. Lett. 2010, 7, 378–383. [Google Scholar] [CrossRef]
- Peike, C.; Kaltenbach, T.; Wei, K.A.; Koehl, M. Non-destructive degradation analysis of encapsulants in PV modules by Raman Spectroscopy. Sol. Energy Mater. Sol. Cells 2011, 95, 1686–1693. [Google Scholar] [CrossRef]
- Haheim, M.L.; Echtermeyer, A.T. Measuring changing strain fields in composites with Distributed Fiber-Optic Sensing using the optical backscatter reflectometer. Compos. Part B Eng. 2015, 74, 138–146. [Google Scholar]
- Dyshlyuk, A.V.; Makarova, N.V.; Vitrik, O.B.; Kul’chin, Y.N.; Babin, S.A. Features of Monitoring Deformation Processes in Ferro-Concrete Designs with Application of the Reflectometer Method of Recording Signals of Fiber Bragg Gratings. Meas. Tech. 2017, 60, 701–705. [Google Scholar] [CrossRef]
- Almubaied, O.; Chai, H.K.; Islam, M.R.; Lim, K.S.; Tan, C.G. Fiber-Optic Sensor and Deep Learning-Based Structural Health Monitoring of Concrete Pipe Under Cyclic Loading. IEEE Trans. Instrum. Meas. 2017, 60, 701–705. [Google Scholar]
- Wang, Y. Experimental Study on Fiber Micromechanics. Master’s Thesis, Dalian University of Technology, Dalian, China, 2014. [Google Scholar]
- Wopenka, B.; Freeman, J.J.; Nikischer, T. Micro-Raman Spectroscopy of a Carbonaceous ‘Carrot’ from the Chondritic Breccia Acfer 182: A New Matrix Mineral Phase or a Shock-Induced Product? Appl. Spectrosc. 1998, 52, 54. [Google Scholar] [CrossRef]
- Huang, L.; Zuyuan, H.E.; Fan, X. Simplified single-end Rayleigh and Brillouin hybrid distributed fiber-optic sensing system. Chin. Sci. Inf. Sci. 2023, 66, 2. [Google Scholar] [CrossRef]
- Tangudu, R.; Sahu, P.K. Review on the Developments and Potential Applications of the Fiber Optic Distributed Temperature Sensing System. IETE Tech. Rev. 2022, 39, 553–567. [Google Scholar] [CrossRef]
- Xu, S.; Liu, B.; Wei, Z.; Wang, T.; Peng, P.; Erdenechimeg, T.; Li, X.; Liu, H. Fabrication of High-Sensitivity Flexible Fiber Bragg Gratings Pressure Sensors for Comprehensive Plantar Pressure Monitoring. IEEE Sens. J. 2024, 24, 32150–32163. [Google Scholar] [CrossRef]
- Hu, Y.; Xu, W.; Ding, G.; Chang, L. Fiber bragg grating sensing-based torsional performance monitoring system for carbon fiber reinforced plastic drive shafts. Proc. SPIE 2024, 13226, 9. [Google Scholar]
Disclaimer/Publisher’s Note: The statements, opinions and data contained in all publications are solely those of the individual author(s) and contributor(s) and not of MDPI and/or the editor(s). MDPI and/or the editor(s) disclaim responsibility for any injury to people or property resulting from any ideas, methods, instructions or products referred to in the content. |
© 2025 by the authors. Licensee MDPI, Basel, Switzerland. This article is an open access article distributed under the terms and conditions of the Creative Commons Attribution (CC BY) license (https://creativecommons.org/licenses/by/4.0/).
