Article

Tunable Graphene Plasmonic Sensor for Multi-Component Molecular Detection in the Mid-Infrared Assisted by Machine Learning

1
Department of Optoelectronic Information Science and Engineering, School of Science, Jiangsu University of Science and Technology, Zhenjiang 212100, China
2
School of Optical and Electronic Information, Huazhong University of Science and Technology, Wuhan 430074, China
*
Authors to whom correspondence should be addressed.
Photonics 2025, 12(10), 1000; https://doi.org/10.3390/photonics12101000
Submission received: 26 August 2025 / Revised: 1 October 2025 / Accepted: 8 October 2025 / Published: 11 October 2025
(This article belongs to the Special Issue Applications and Development of Optical Fiber Sensors)

Abstract

Mid-infrared molecular sensing faces challenges in simultaneously achieving high-resolution qualitative identification and quantitative analysis of multiple biomolecules. To address this, we present a tunable mid-infrared sensing platform, integrating the simulation of a single-layer graphene square-aperture array sensor with a machine learning algorithm called principal component analysis for advanced spectral processing. The graphene square-aperture structure excites dynamically tunable localized surface plasmon resonances by modulating the graphene’s Fermi level, enabling precise alignment with the vibrational fingerprints of target molecules. This plasmon–molecule coupling amplifies absorption signals and serves as discernible “molecular barcodes” for precise identification without change in the structural parameters. We demonstrate the platform’s capability to detect and differentiate carbazole-based biphenyl molecules and protein molecules, even in complex mixtures, by systematically tuning the Fermi level to match their unique vibrational bands. More importantly, for mixtures with unknown total amounts and different concentration ratios, the principal component analysis algorithm effectively processes complex transmission spectra and presents the relevant information in a simpler form. This integration of tunable graphene plasmons with machine learning algorithms establishes a label-free, multiplexed mid-infrared sensing strategy with broad applicability in biomedical diagnostics, environmental monitoring, and chemical analysis.

1. Introduction

Molecular detection in the mid-infrared (MIR) spectral region is critically important in fields such as biomolecular identification, environmental monitoring, and chemical sensing [1,2,3,4]. Plasmonic sensing technology has emerged as a powerful approach for achieving highly sensitive MIR molecular detection, which leverages the interactions between surface plasmons (SPs) and molecular vibrational modes [5,6]. SPs are collective oscillations of free electrons at the interface between a conductor (e.g., graphene) and a dielectric, coupled to electromagnetic waves [7,8]. They enable subwavelength light confinement and strong local field enhancement, making them ideal for enhancing light–matter interactions in nanophotonic sensors. When the resonance position of the SP is tuned to match the molecular vibration band, a strong coupling occurs, leading to significant enhancement in the molecular absorption signal. In general, traditional noble metal materials (e.g., gold and, silver) are mainly used to excite SPs, which have exhibited significant utility in molecular detection [9,10,11,12]. However, traditional plasmonic materials (e.g., gold and, silver) face critical challenges: (i) their resonance wavelengths are fixed by nanostructure geometry, limiting post-fabrication tunability; (ii) high ohmic losses in the mid-infrared (MIR) region lead to broad resonance linewidths and low quality factors (Q-factors); and (iii) limited dynamic wavelength tunability across the MIR spectrum. These drawbacks hinder multiplexed detection of analytes with distinct vibrational fingerprints, such as biomolecules and organic compounds.
The search for alternative materials with dynamically tunable plasmonic properties is, therefore, imperative. In recent years, two-dimensional graphene has emerged as a promising candidate [13,14,15,16,17], especially the tunable graphene SPs in MIR without structural reconstruction. Its exceptional electrical tunability depends on its Fermi level [18,19,20,21], which can be altered through additional voltage or chemical doping, thereby dynamically adjusting its SP resonance response. Furthermore, graphene plasmons offer superior field confinement compared to metals, enabling stronger light–matter interactions [22]. These combined advantages make graphene an ideal platform for addressing the molecular detection challenge inherent to traditional plasmonic sensors. Great efforts have been devoted to achieving biosensing with graphene [23,24,25,26,27,28,29,30]. For instance, Li et al. (2014) first showed molecular signal enhancement via coupling in graphene nanoribbons [21]. Altug et al. modulated coupling strength with protein molecules by tuning plasmon peaks via bias voltage [16]. Rodrigo et al. leveraged graphene’s tunability for mid-infrared biosensing of lipid membranes [20], and Liu et al. demonstrated strong light–matter coupling in 2D crystals [23]. Wu et al. reported a graphene plasmon nanocavity integrated with a perfect absorber that enables and significantly enhances vibrational strong coupling with organic molecules [28]. For the mixed analyte containing more than one kind of molecule, the dynamic tunability of graphene plasmons enables the sequential matching of their resonance peaks with distinct molecular vibrational bands, thereby making the simultaneous detection of multiple molecular species feasible.
However, when multiple distinct biomolecular species coexist in analytes, the challenge of achieving convenient simultaneous detection and quantification remains significant. Specifically, for the molecules with more than one vibrational band, the vibration bands of different molecules may have spectral overlaps, which obscure individual features in transmission spectra, making it difficult to resolve distinct molecular signatures through visual inspection. Moreover, beyond merely confirming molecular presence, quantitative determination of concentration ratios for each component in mixed systems—information not directly recognizable from raw transmission spectra—is essential for practical applications such as clinical diagnostics. To address these dual challenges, we introduce a machine learning algorithm—principal component analysis (PCA)—,which can help extract the key information from spectral complexity in multi-molecular detection.
In this paper, we achieve simultaneous qualitative and quantitative identification of mid-infrared molecules by integrating the simulation of a single-layer graphene square-aperture (GSA) array structure with the PCA algorithm. It is found that the GSA structure can excite localized surface plasmon (LSP) resonance, which can be tuned dynamically by adjusting the Fermi level of graphene. When the LSP resonance peak precisely aligns with the vibrational band of a specific biomolecule, their strong coupling occurs, leading to a distinct molecular absorption-enhancement signal in the transmission spectrum. Meanwhile, we further simulate the simultaneous detection of the mixed molecules by utilizing the GSA structure. Finally, with the assistance of a versatile method, the PCA algorithm, the corresponding concentration of each kind of molecule can be detected quantitatively.

2. Materials and Methods

Figure 1 illustrates the schematic diagram of the proposed single-layer GSA array. The periodic graphene square--aperture array is placed at the top of the structure, with the unit cell periods in the x and y directions Px and Py, respectively. The side length of the square aperture is L. The substrate consists of a silicon dioxide (SiO2) dielectric layer with thickness t1 and a silicon (Si) substrate with thickness t2 in sequence. In a practical device, the Fermi level of the graphene layer is tuned by applying a gate voltage between metallic contacts fabricated on the graphene and the heavily doped silicon substrate, which acts as a back-gate electrode. Our GSA structure was confirmed feasible in the experiment, with the guide for detailed fabrication procedures in reference [27]. It is assumed that a Transverse Magnetic (TM) polarized incident wave illuminates the structure. Although all results in this study focus on TM incidence, the symmetric design simultaneously supports resonances for both TM and TE polarization, and the biomolecules to be detected are spread on the surface of the GSA structure.
The finite element method (FEM) was applied to calculate the optical responses and the electric-field distributions of the GSA structure. The FEM is a commonly used numerical technique in simulations, which can discretize the differential form of Maxwell’s equations and solve them using computational means. In practical computation, the principle of FEM is to decompose the geometric structure into several triangular or quadrilateral mesh elements. If it is a three-dimensional model, it is divided into tetrahedral or hexahedral elements. The field within each element is then interpolated using basis functions, and the approximate solution of the entire region to be solved is calculated using boundary conditions. The general steps of the FEM include selecting the physics field, building the geometry, setting material parameters and boundary/port conditions, meshing, choosing an appropriate solver, and post-processing. The optical responses of the proposed structure were numerically investigated using FEM implemented in the Wave Optics Module within COMSOL Multiphysics 5.6, specifically employing the Electromagnetic Waves, Frequency Domain (ewfd) study type. A wavelength sweep from 5 to 8.5 μm was performed to obtain the transmission spectra. The simulation domain comprised a single-unit cell with a layered structure along the z direction: a 3-micrometer-thick Perfectly Matched Layer (PML) at the top, serving as the radiation boundary for the incident wave, followed by a 3-micrometer-thick air layer, the graphene square-aperture array modeled as an infinitely thin sheet, a 280-nanometer-thick SiO2 layer, a 500-nanometer-thick Si substrate, a 3-micrometer-thick air layer, and a final 3-micrometer-thick bottom PML. The excitation source was a normalized, TM-polarized plane wave incident normal to the surface. Floquet periodicity boundary conditions were applied along the x and y directions of the unit cell to simulate an infinite array, while ports for a TM-polarized plane wave were defined at the top and bottom air–PML interfaces to calculate transmittance as T = |S21|2, where S21 is the scattering parameter between the two ports. A non-uniform meshing strategy ensured computational efficiency and accuracy: an extremely fine boundary layer mesh (~1 nm minimum size) resolved the strong field enhancement at the graphene aperture edges; a refined tetrahedral mesh was applied to the SiO2 and near-field air regions; and a coarser mesh was used for the Si substrate and far-field air regions. Graphene was modeled using a Surface Current Density node with its conductivity described by the Kubo formula. A TM plane wave impinges on the GSA with incident angle θ. Periodic boundary conditions along the x and y directions are applied to simulate the infinite planar array. The computational domain of the graphene nanoribbon structure is meshed with a user-defined triangular grid. The transmittance of the structure can be expressed as T = |S21|2, where the S21 parameter can be directly obtained from the defined z-direction port. The parameters of SiO2 and Si are taken from Reference [30]. To improve work efficiency and reduce the number of meshes in the simulation, the single-layer graphene can be set as a thickness-free two-dimensional conductive surface, and this assumption was proved to be feasible [31]. The conductivity of graphene could be fitted to the Kubo formulas, and in the mid-infrared region, Kubo formulas can be simplified as follows [30]:
σ g = i e 2 E F π 2 ω + i τ 1
where e is the electron charge; ħ is the reduced Planck constant;, and τ is the electron relaxation time, which is generally taken as τ = 125 fs according to the experiment from Ref. [29]. Therefore, the surface conductivity of graphene is related to the angular frequency ω and the Fermi level EF. Moreover, the Fermi level of graphene can be adjusted by chemical doping, external electric fields, magnetic fields, etc., thereby regulating the conductivity of graphene and changing its electromagnetic response characteristics. Generally, the Fermi level EF of graphene can range from 0 to 1.0 eV [18,29]. It is important to note that the relaxation time τ used in the Kubo formula is derived from experimental measurements [31,32], and effectively incorporates scattering mechanisms, including electron-edge scattering. This ensures that edge effects—particularly relevant in nanoscale apertures like our GSA—are implicitly accounted for in the dielectric function of graphene, as validated in prior works on graphene plasmonics [31,32]. Thus, our model reliably captures the plasmonic response and field enhancement at the aperture edges without requiring explicit atomic-scale modeling. Also, our model assumes a linear optical response of graphene, as described by the Kubo–Drude formalism, which is valid under the low-intensity illumination conditions used here. This approach is consistent with prior works in graphene plasmonic sensing [33,34,35], where nonlinear effects are negligible within the operational power range.
For identifying and quantifying composite vibrational fingerprints of multiple biomolecules, we select (a) the carbazole-based biphenyl (CBP) molecules with one vibrational peak at 6890 nm, (b) the protein molecules with two vibrational peaks at 5995 nm and 6527 nm, and (c) the mixture containing these two molecules as the analytes. They are spread on our GSA structure and almost overlap with hot spots caused by the GSA. Absorption of these vibrational bands is nearly a Lorentzian line-shape; thus, the molecular permittivity can be fitted to the Lorentz model [20,36,37]:
ε = n 2 + k = 1 N A k ω k 2 ω k 2 ω 2 i ω γ k
The molecules will introduce not only the vibrational resonances (the sum term) but also the non-dispersive background with the increased effective index n 2 = 2.08 (the first term). N represents the number of vibrational band terms of each kind of molecule; ωk, γk, and Ak denote the resonance frequency, damping rate, and oscillation strength of each vibrational term, respectively. When it comes to the CBP molecule, its permittivity εC contains only one vibrational band, so N = 1, with the other parameters ω1 = 6.89 μm, γ1 = 0.00194 μm, and A1 = 0.0102 μm. The permittivity of protein molecules εp contains two vibrational bands with parameters N = 2, ω2 = 5.99 μm, γ2 = 0.0028 μm, A2 = 0.0764 μm, ω3 = 6.53 μm, γ3 = 0.0043 μm, and A3 = 0.0852 μm. These parameters are from experimental research in Refs. [20,36,37]. The permittivity of the mixed molecules can be described as ε = ε C + ε P .
In data processing for the quantitative detection of molecules, we utilize the built-in PCA function in MATLAB 2022 for data dimension reduction and simplification. It converts a group of possibly correlated variables into a group of linearly uncorrelated variables through orthogonal transformation, which are called the principal components (PCs). The basic usage of the PCA function is as follows:
[ C O E F F s c o r e l a t e n t ] = p c a ( X )
where, X is the input original m-dimensional data; “score” is the output low-dimensional processed data—that is the projection of the original data onto the principal component space; “COEFF” is the coefficient of the principal component (also known as the feature vector), which reveals how X is simplified into “score”; “latent” is the variance of each principal component.

3. Results and Discussion

3.1. Surface Plasmon Properties of Single-Layer GSA Arrays

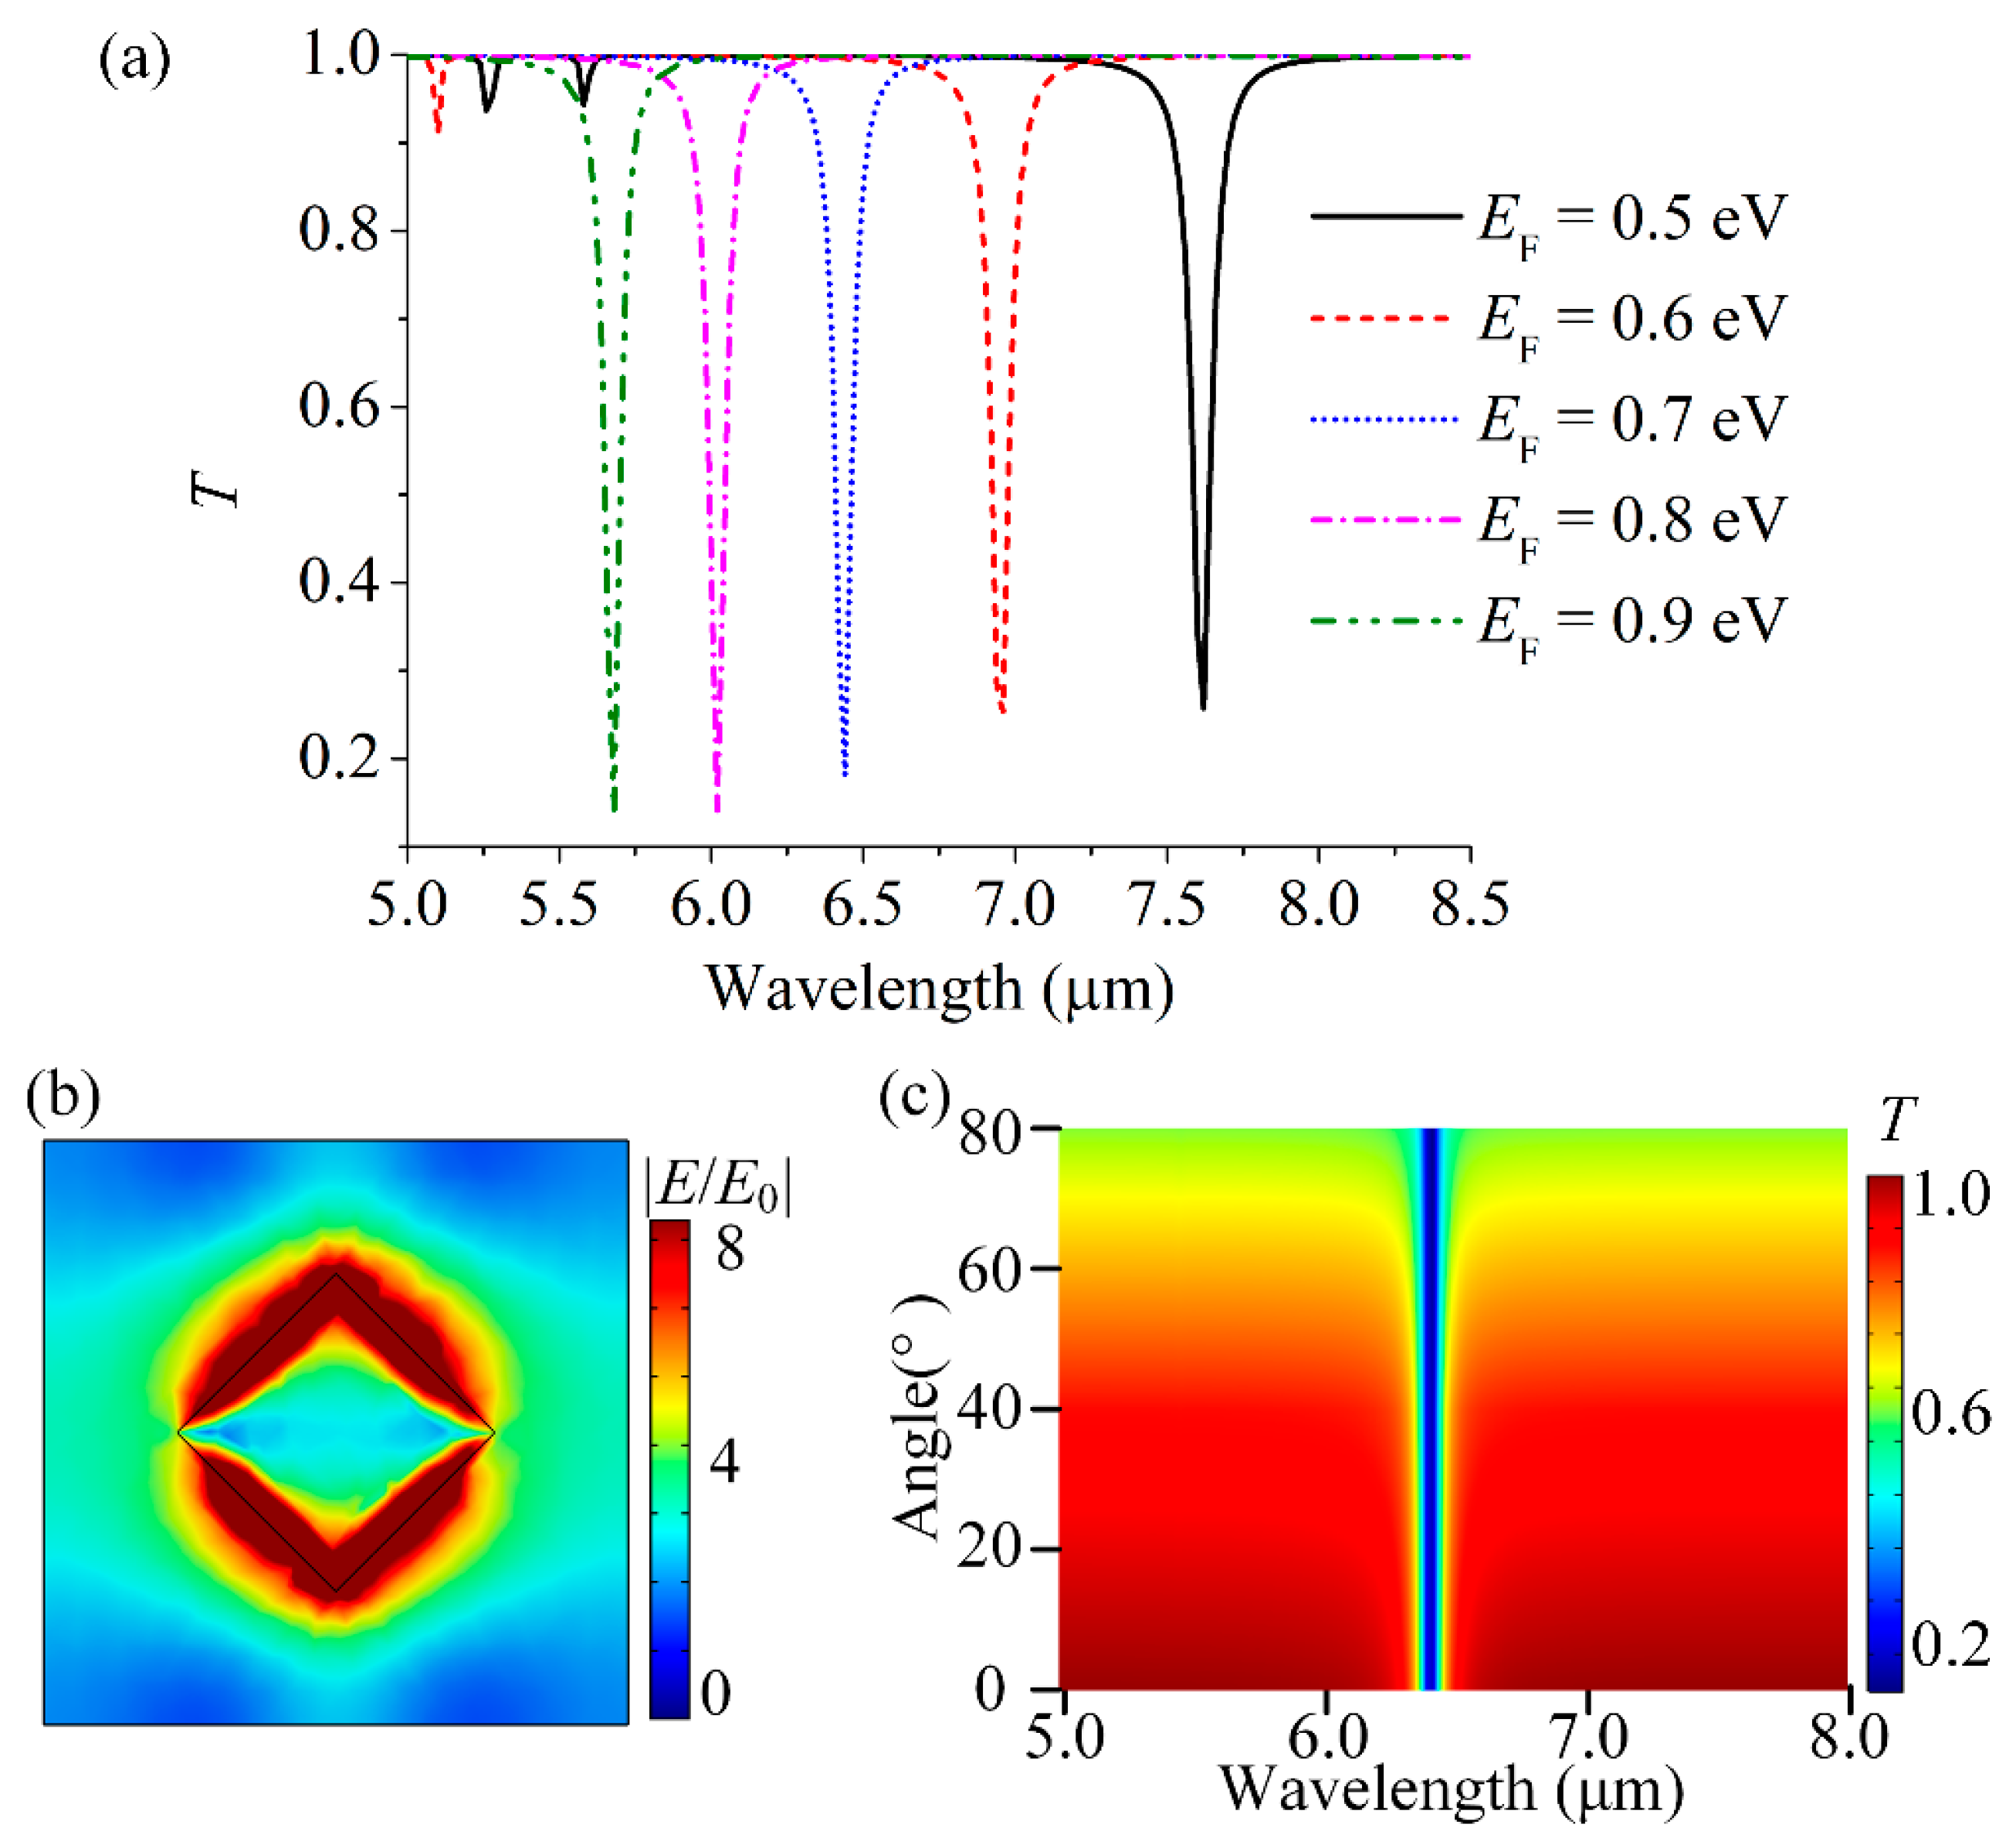
Unlike noble metal materials, even if the geometric structure of GSA is fixed, its surface plasmon properties can still be dynamically regulated through the Fermi energy level, EF. Figure 2a presents the simulated transmission spectra of the GSA structure under different Fermi energy levels EF, where the periods in the x and y directions Px = Py = 130 nm and the side length of the square aperture L = 50 nm. When EF is 0.5 eV, a strong transmission dip appears at approximately 7.6 μm in the transmission spectrum of the GSA, which originates from the LSP of graphene [15]. With the increase in EF, the transmission dip induced by LSP blue-shifts from 7.6 μm to 5.6 μm. It has been reported that the LSP resonance frequency of graphene is proportional to the square root of its Fermi energy level, EF. Thus, the LSP resonance shifts to a higher frequency (shorter wavelength) as the Fermi energy level EF increases from 0.5 eV to 0.9 eV [38,39]. Figure 2b shows the near-field enhancement distribution of the GSA structure at EF = 0.7 eV. It can be observed that the electric field on the graphene surface is significantly enhanced, especially at the edges of the graphene square-aperture array, providing an increased effective sensing area for the detected molecules. The above discussion is based on the normal incidence of TM waves. In practical biosensing applications, the incident angle robustness of the structure is also crucial [40,41,42,43], meaning that the LSP resonance characteristics of the GSA should remain stable under large incident angles. Therefore, with other parameters of the system kept unchanged, we investigate the influence of different incident angles θ of TM waves on the LSP peak position. As shown in Figure 2c, the LSP resonance wavelength is insensitive to different θ when the incident angle ranges from 0° to 80°. We further evaluate the robustness of the GSA array against potential fabrication tolerances. Variations of up to ±10% in the period P and aperture side length L resulted in LSP resonance shifts of less than 200 nm. Importantly, these shifted wavelengths remain within the wide tuning range (5.6–7.6 μm) achievable by Fermi--level adjustment. Therefore, the sensor’s ability to dynamically match molecular vibrational peaks is not compromised, indicating good tolerance to typical nanofabrication uncertainties.

3.2. Molecular Qualitative Detection Based on the GSA Arrays

By utilizing the flexible tunability of graphene and the localized electric-field enhancement on its surface, we investigate the capability of the GSA structure for biomolecular detection by simulating the case of molecules covering the GSA. It is worth noting that the transmission spectrum of the uncoupled GSA here already takes the dielectric non-dispersive background n 2 = 2.08 of the molecule’s permittivity into account.
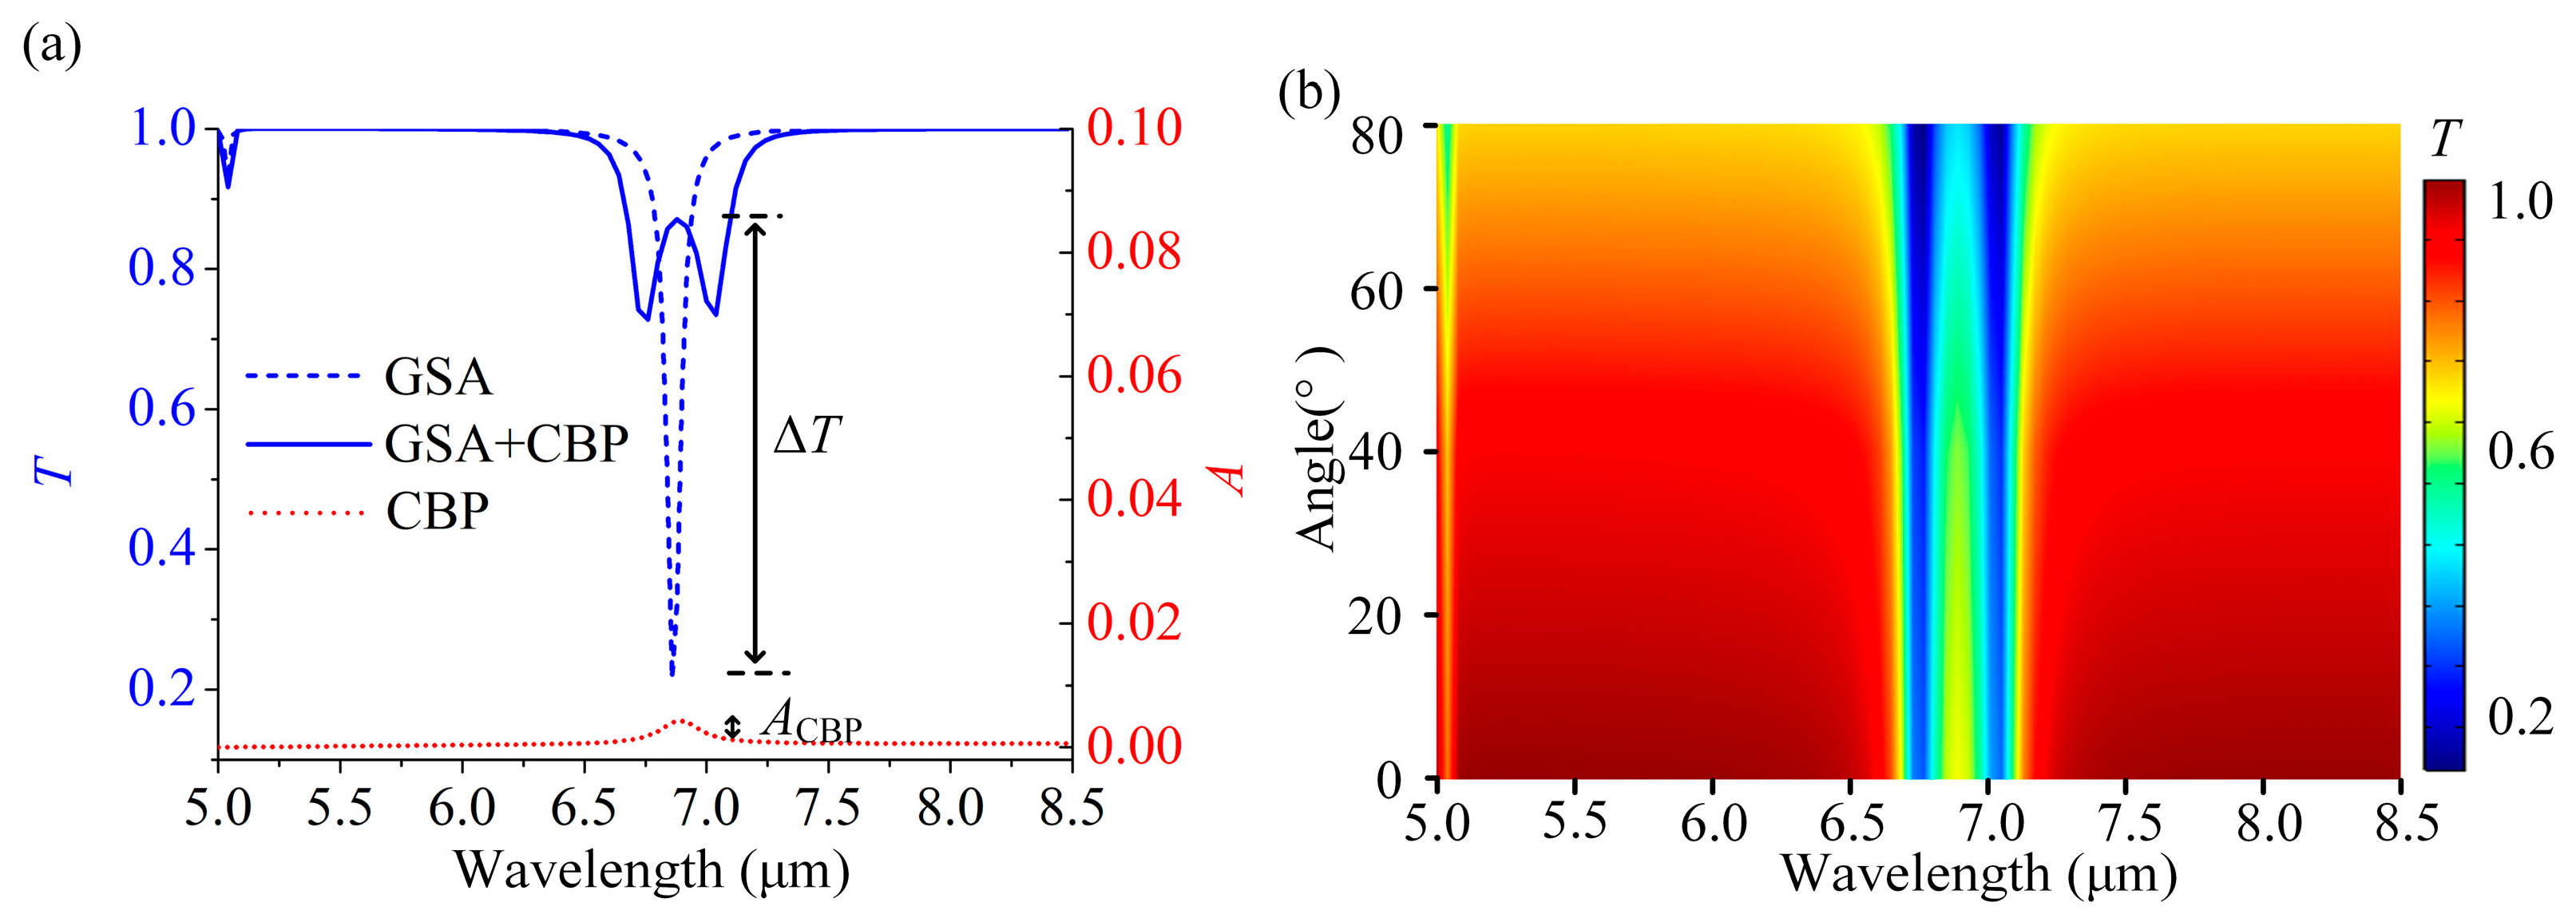
When the GSA structure is covered by CBP molecules with a weak vibration band at 6890 nm, the optical responses of the bare GSA, the pure CBP molecules, and the coupled GSA-CBP system are simulated, respectively. We first take the desired case into account. As shown in Figure 3a, when the Fermi energy level is approximately 0.64 eV, the LSP resonance of GSA is at ~6.89 μm (the dashed line) under normal incidence, coinciding exactly with the vibrational band of CBP molecules (the dotted line). This gives rise to the strongest coupling between the LSP resonance of the GSA and the vibrational mode of the CBP molecules. Thus, the original LSP transmission dip splits into two dips (the solid line), which is called Rabi splitting. In this case, there is a distinct peak at ~6.89 μm, which corresponds to the CBP molecular signal. The transmission difference between the GSA-CBP coupled system and the bare GSA is ΔT ≈ 0.63 at molecular vibration (~6.89 μm). Compared to the absorption of the same CBP molecule layer without graphene (~ 0.004), it has an enhancement factor of 0.63/0.004 ≈ 155 times. As shown in Figure 3b, under oblique incidence, the two bands caused by the split of the strong coupling are still evident, as well as the molecular signal between the two bands.
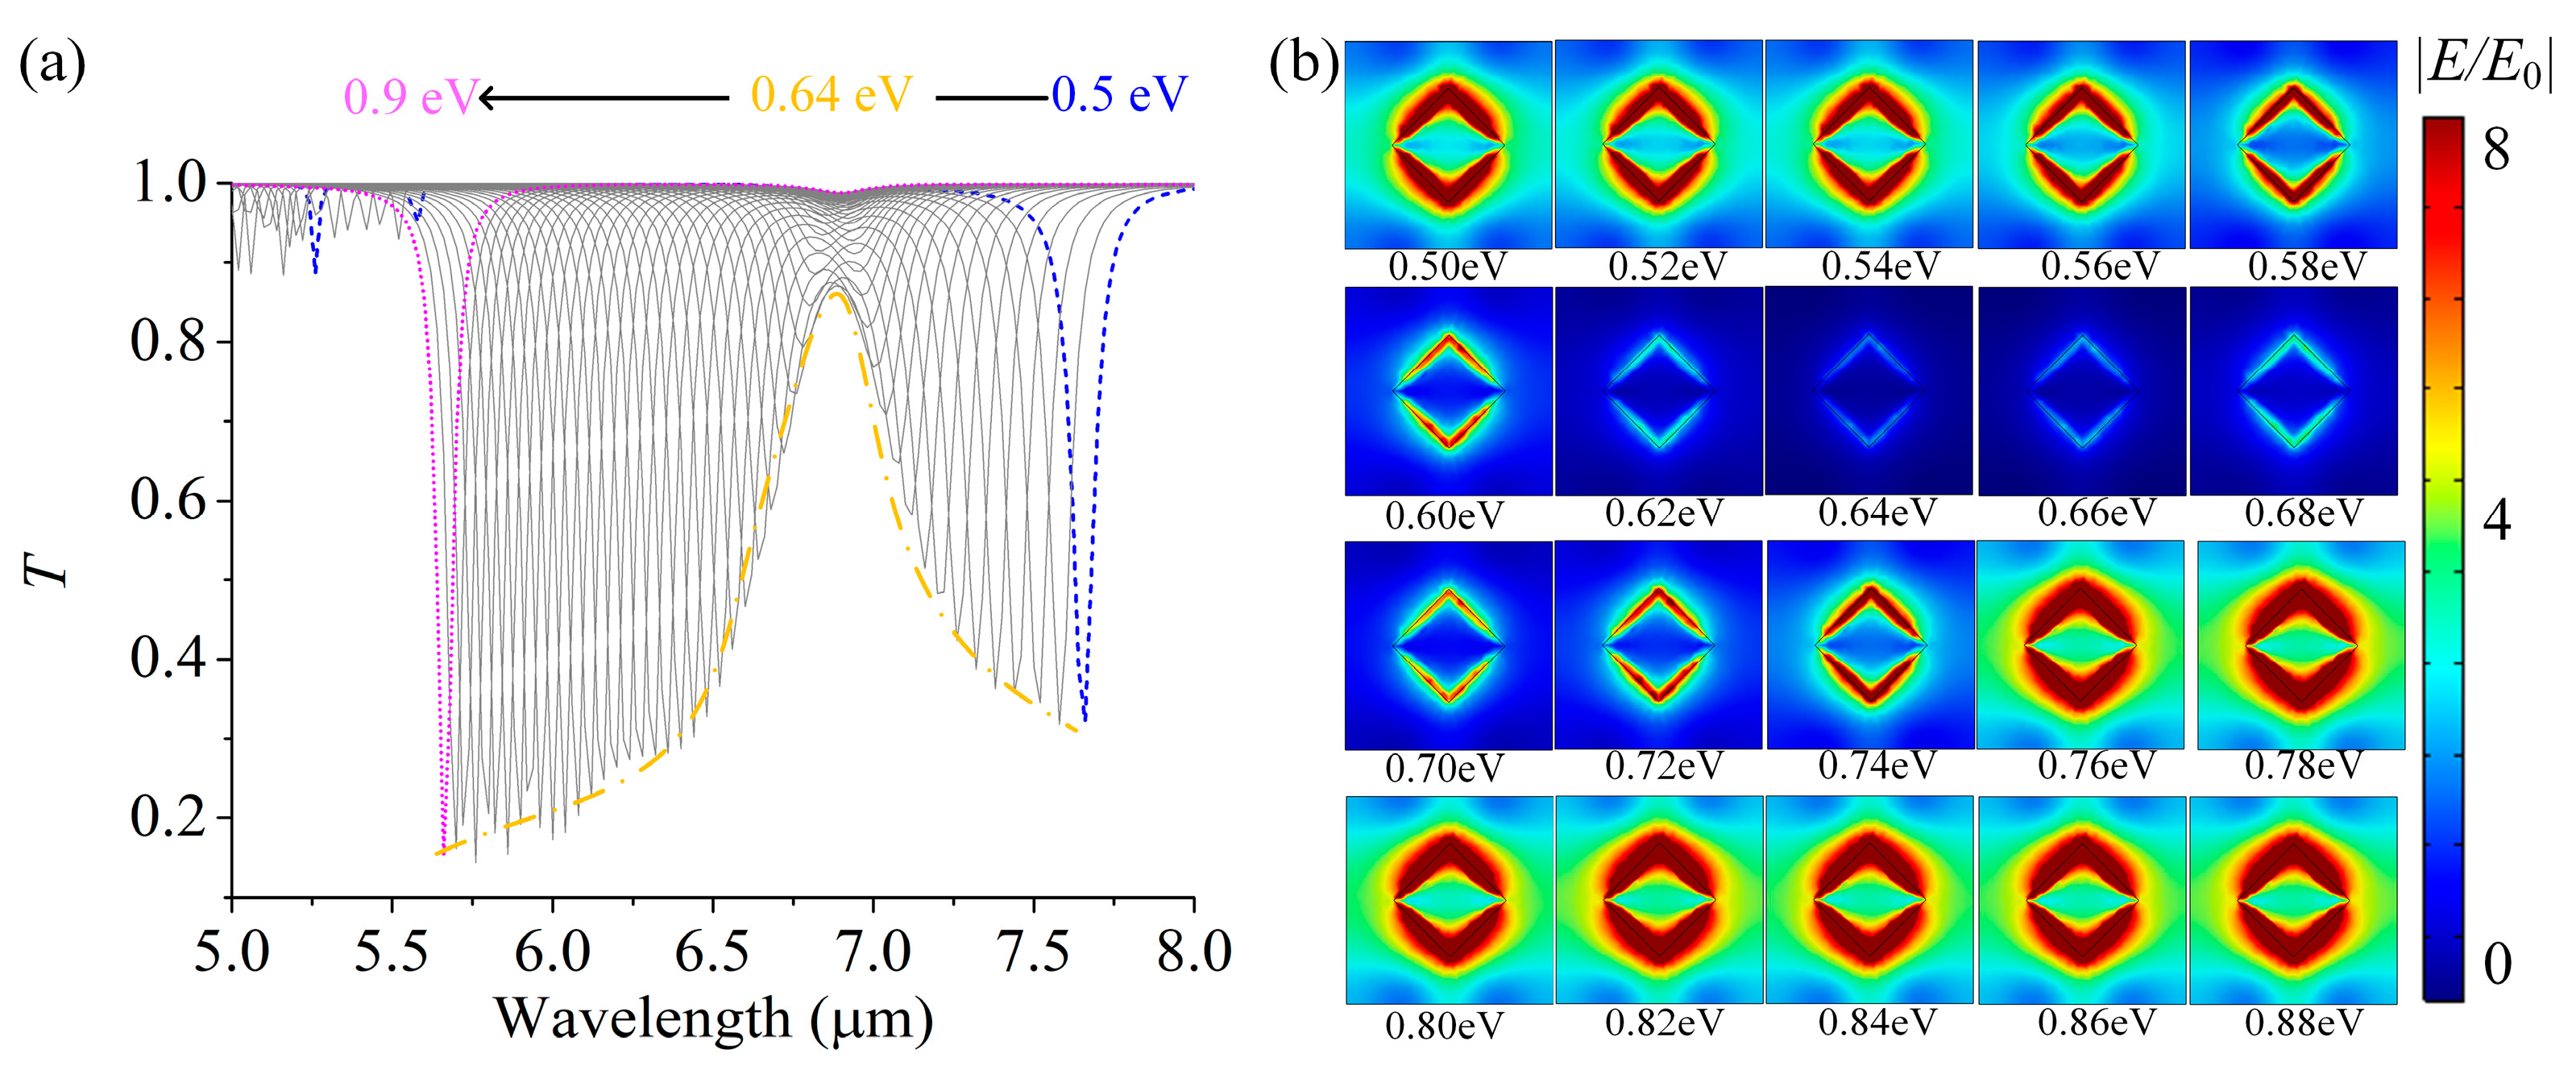
Then, the transmission spectra of the coupled system varying with the Fermi levels Ef are simulated, as shown in Figure 4a. As mentioned earlier, when the Fermi energy level Ef increases gradually from 0.5 eV to 0.9 eV with a step of 0.02 eV, the LSP resonance of the GSA structure blue-shifts from ~7.6 μm to ~5.6 μm, moving across the vibrational band of CBP molecules. When the LSP mode is far from the CBP molecular vibration, such as at EF = 0.5 eV (dashed line) and EF = 0.9 eV (dotted line), the coupling between LSP and CBP molecules is weak, resulting in little change in the transmission spectrum compared to the original LSP resonance. Meanwhile, in the above two spectra, the absorption of CBP molecules that are slightly coupled with LSP at ~6.9 μm is extremely weak and barely distinguishable. By combining these transmission spectra of variable EF from 0.5 eV to 0.9 eV together, a greatly enhanced CBP molecular signal is clearly presented. It’ is worth mentioning that the GSA structure exhibits narrower linewidths than conventional metallic nanostructures, caused by intrinsic losses. This narrowband advantage enhances the detection accuracy of molecular signals. The sharp and moving resonance of the GSA structure helps amplify molecular vibrational signatures, allowing even weak absorption signals from molecules to be clearly resolved. Figure 4b shows the electric--field distribution of the coupled GSA structure at different EF. It can be observed that the electric--field intensity decreases first and then increases with the increase in EF, reaching a minimum value at EF = 0.64 eV, which corresponds to the LSP resonance that matches up with the vibrational band of the CBP molecules. This pattern acts as a visual fingerprint for the sensing of CBP. The closer the wavelength of LSP resonance is to the CBP molecular vibration peak, the stronger the interaction between LSP resonance and CBP molecules, leading to greater energy exchange. Thus, the absorption of CBP molecules is enhanced, and the remaining electric field of the coupled GSA is reduced. This forms a unique “molecular barcode” of CBP molecules, in which each Fermi energy level corresponds to a distinguishable spatial configuration—resonance wavelength. Therefore, we can also determine the vibrational peak wavelength of the target molecule by tracing the Fermi energy level corresponding to the minimum electric--field intensity. The enhanced and distinct signals facilitated by high-Q resonances, combined with the spatial “barcode” patterns, allow for reliable detection.
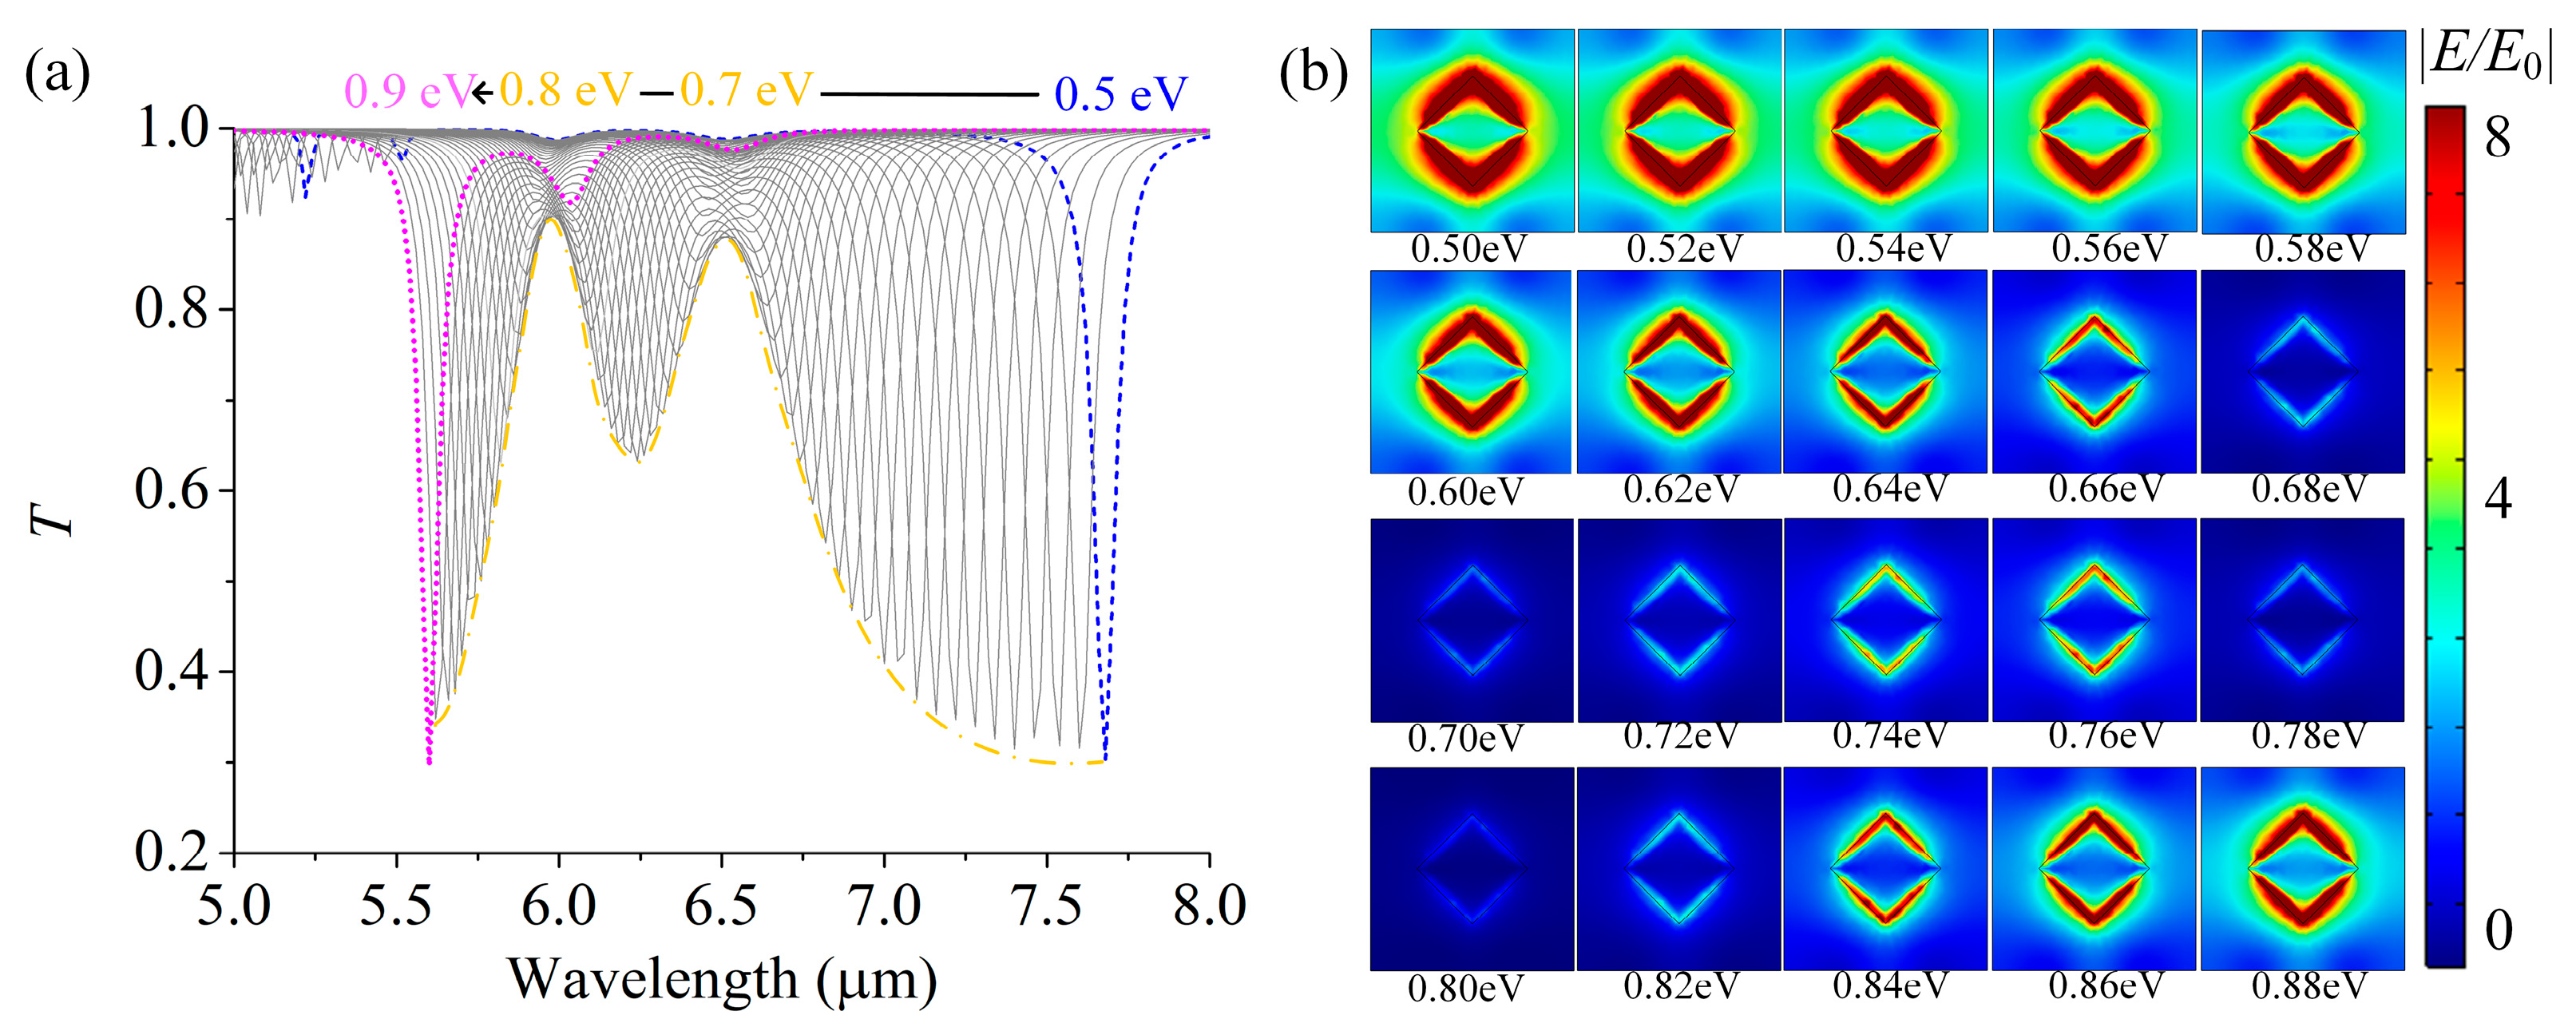
We further simulate the optical response of the GSA structure covered by protein molecules with two vibrational modes at 5995 nm and 6527 nm. It is noted that when the Fermi energy level EF is at ~0.7 eV and ~0.8 eV, the LSP resonance positions coincide with these two vibrational bands of protein molecules, respectively. As shown in Figure 5a, when the Fermi energy level increases from 0.5 eV to 0.7 eV, the graphene LSP resonance peak coincides with the first vibration of protein molecules (~6.5 μm), achieving maximum coupling and resulting in an obvious absorption enhancement in molecules. When the Fermi energy level further increases from 0.7 eV to 0.8 eV, the LSP resonance peak continues to blue-shift to the position of the second vibration of protein molecules (~6.0 μm), and the coupling between them reaches the maximum again, leading to a second absorption enhancement. As the LSP continues to blue-shift, it moves further away from both vibrational peaks of the molecules, and the interaction becomes increasingly weak. Thus, during the increase in the Fermi energy level from 0.5 eV to 0.9 eV, the LSP couples with the two vibrational peaks of protein molecules successively, resulting in two absorption-enhancement positions. When Ef is at 0.5 eV (dashed line) or 0.9 eV (dotted line), the coupling between them is weak, leading to little change in the transmission spectrum after the molecules are introduced into the structure. Figure 5b shows the near-field distribution of the molecule-adsorbed GSA structure under different Fermi energy levels. It can be seen that the electric-field intensity reaches minima at Ef = 0.7 eV and Ef = 0.8 eV. At these values, the graphene LSP resonance peak coincides exactly with the molecular vibrational peak, resulting in maximum coupling strength. Therefore, there is more energy exchanged between the two, thereby causing a significant enhancement in molecular absorption.
To further explore the capability of the proposed GSA structure for detecting multiple biomolecules, we used a 1:1 mixture of CBP molecules and protein molecules as the target molecular mixture. The transmission spectrum in Figure 6a clearly reflects three vibrational signals of the two types of molecules, corresponding to the CBP molecule at ~6.9 μm and the protein molecules at ~6.5 μm and ~6.0 μm. The electric-field distribution in Figure 6b also clearly shows three minima when the Fermi energy levels are 0.64 eV, 0.7 eV, and 0.8 eV, representing the existence of three vibrational bands. Therefore, it is noteworthy that the GSA array structure, by leveraging its tunable LSP resonance, exhibits remarkable versatility: whether multiple molecules coexist or a single molecule has multiple vibrational peaks, all their characteristic signals can be accurately identified and clearly distinguished. The combination of this excellent multi-channel detection capability with the barcode-like features presented in its spectral response provides strong support for the qualitative identification of molecules in complex systems.

3.3. Molecular Quantitative Detection Based on the GSA Arrays and PCA Algorithm

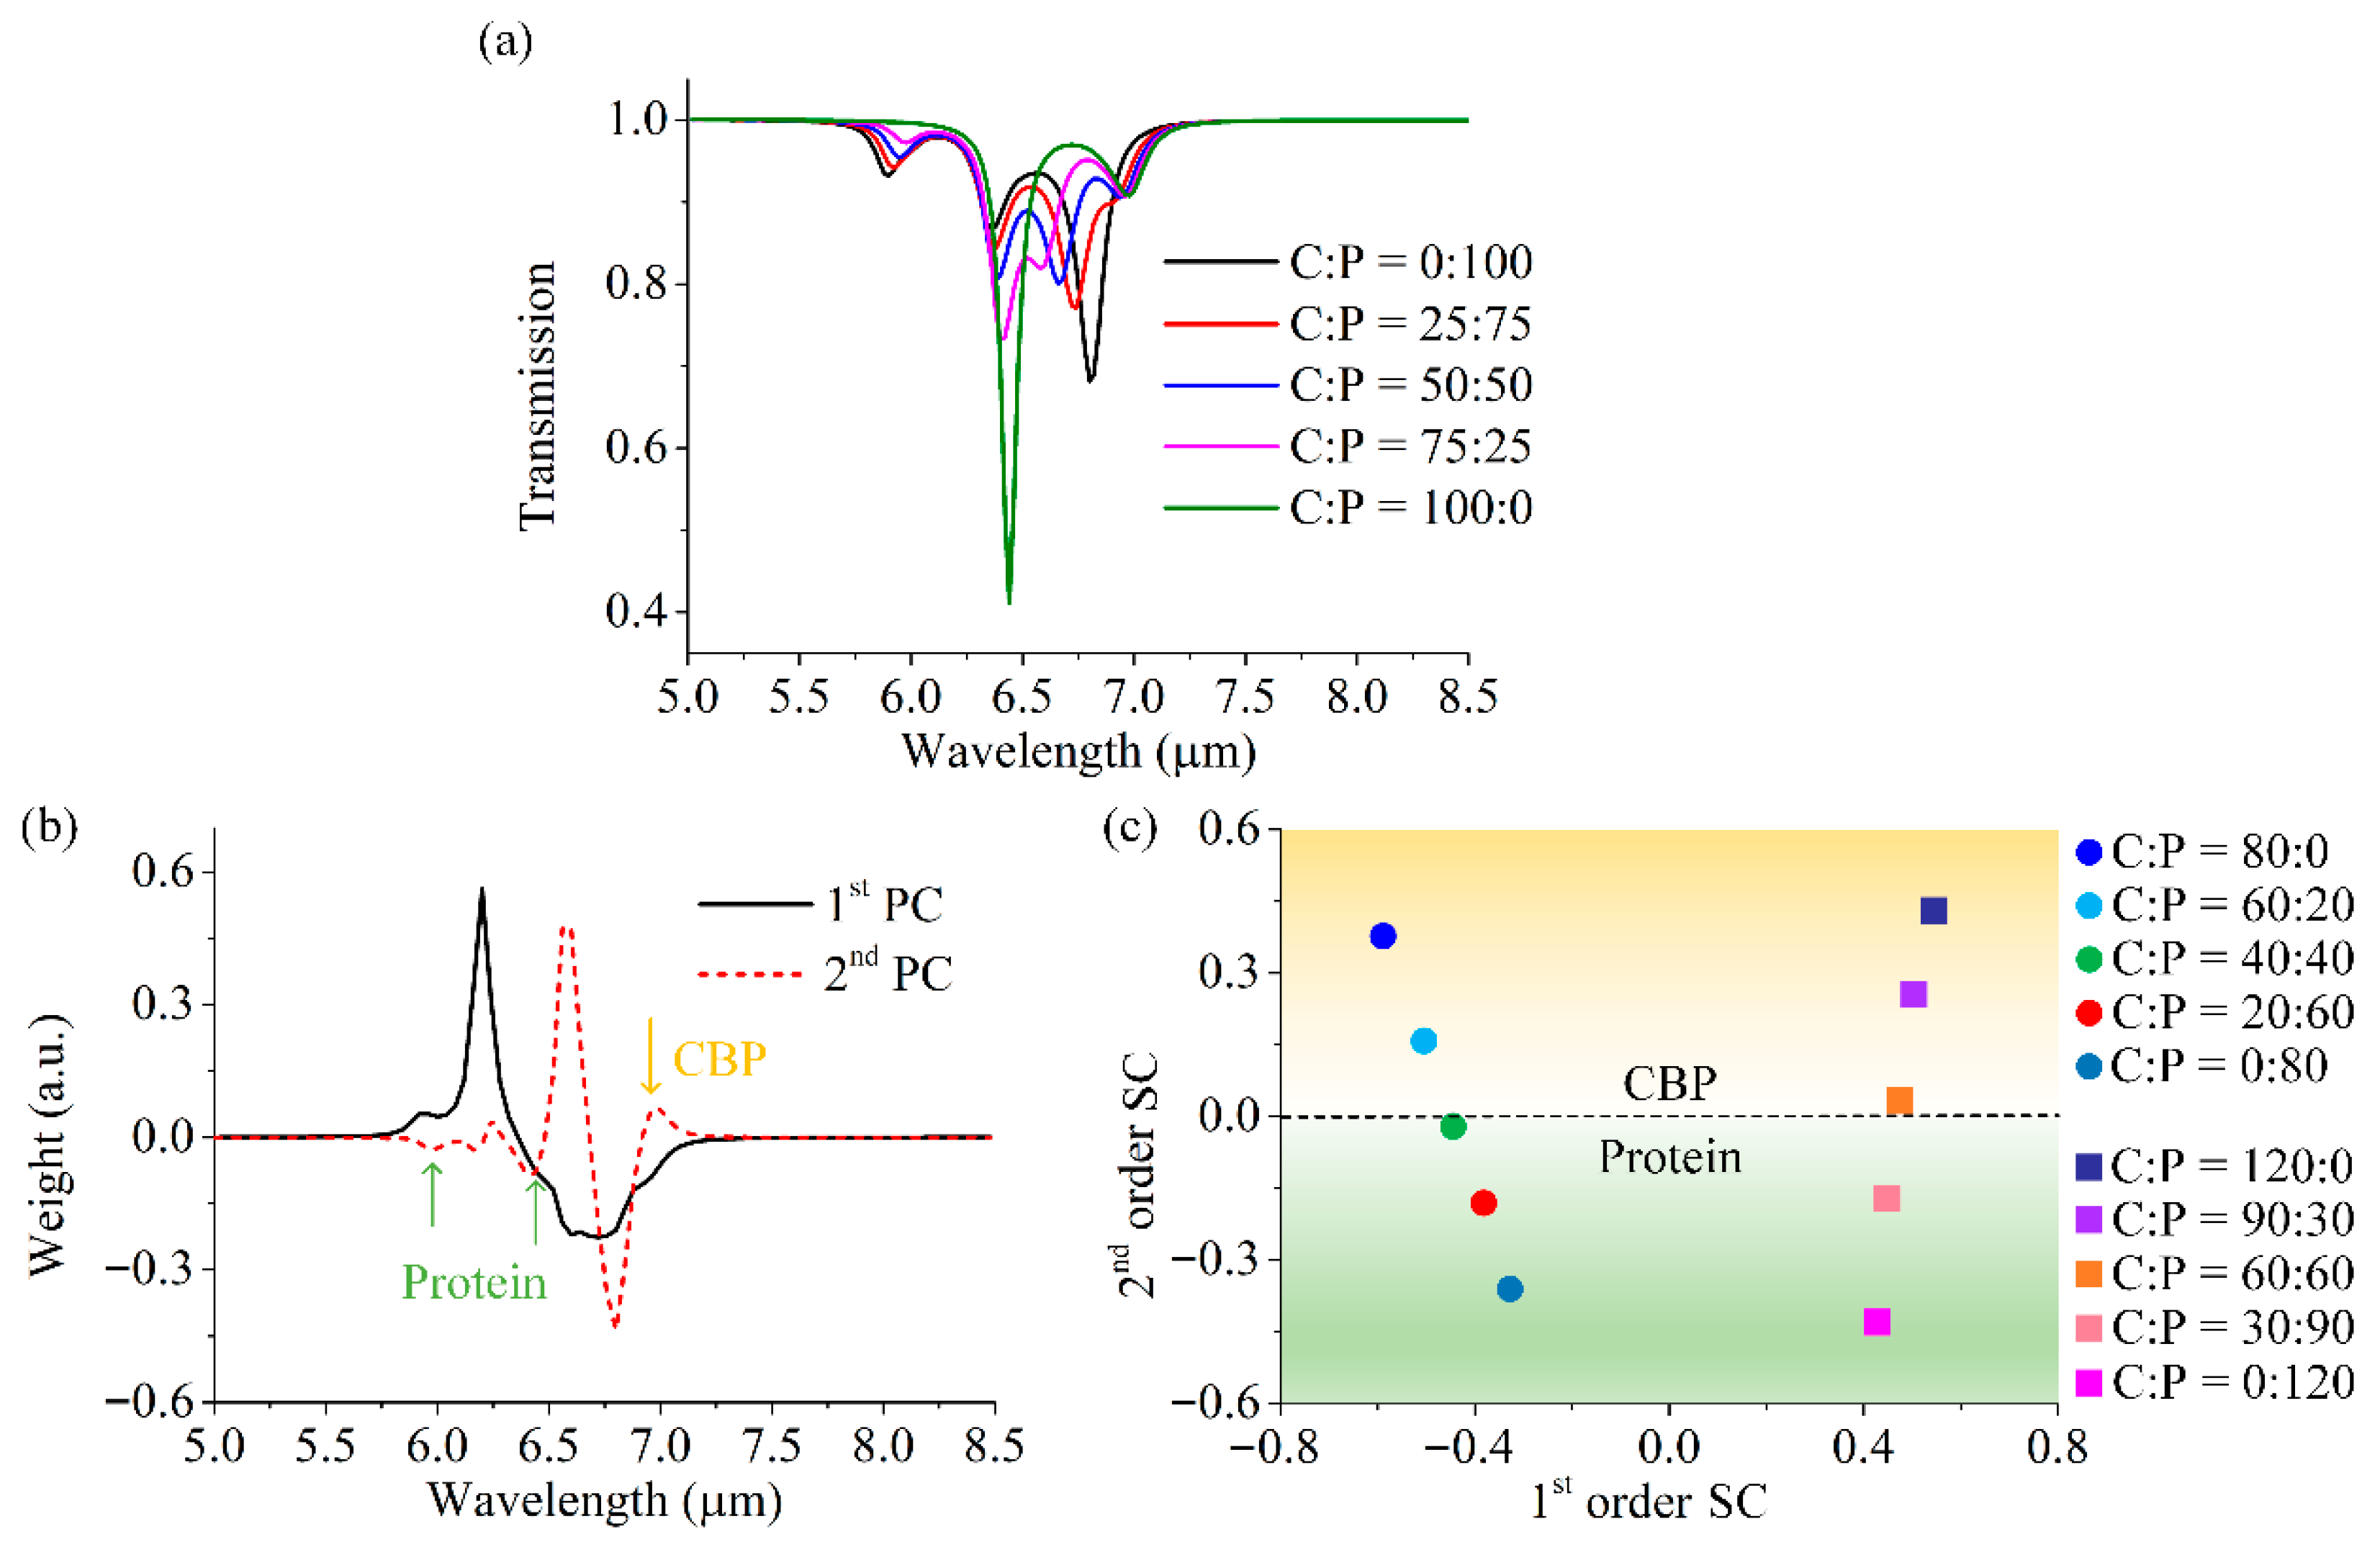
For mixed solutions containing multiple molecules, it is crucial not only to detect the presence of specific molecules but also to quantitatively analyze the concentration of each component. Next, we investigate the optical response of mixed CBP and protein molecules with varying mixing ratios on the GSA (assuming CBP molecules as “C” and protein molecules as “P”), as shown in Figure 7a. In simulation, the permittivity of the mixed molecules εm can be described by εm = c + (1 − f)εP, where f represents the ratio of CBP molecules. The structural parameters are fixed as P = 130 nm and L = 50 nm, with the Fermi level EF = 0.7 eV. When the Fermi level is fixed, the LSP cannot match up with all the vibrational bands simultaneously, and the transmission spectra of the coupled system are complicated for displaying molecules’ characteristics. Even if the Fermi level is tuned and sweeps across the molecular vibrational bands one by one, the different mixture ratios’ information cannot be directly and clearly distinguished by the naked eye. More importantly, when there are other types of molecules in the mixed system, the vibration peaks of different molecules may have spectral overlaps, resulting in the superposition of molecular signals, making it difficult for the human eye to distinguish the independent characteristics of each component from the transmission spectrum. Here, we introduce a data analysis algorithm—PCA. The PCA algorithm is a technique for simplifying datasets, mainly used for dimension reduction, that is, projecting sample data from a high-dimensional space to a low-dimensional space and retaining the important information as much as possible. Its goal is to extract key information from the original dataset and represent it as a set of new orthogonal eigenfunctions called PCs and eigenvalues SCs. In our case, it can help extract the connected information from the complicated transmission spectra with different mixing ratios and output the mixing ratio in a more simplified and obvious form. Moreover, when there are different total amounts of the mixed molecules (even if the mixing ratio of two kinds of molecules is the same), it can still be distinguished. Hence, we set 10 groups of the mixed molecules with different total amounts and ratios, composed of 5 sets whose total amount of mixed molecules was less than the standard value (80:0), (60:20), (40:40), (20:60), and (0:80), and the other 5 sets with total amounts of mixed molecules more than the standard value (120:0), (90:30), (60:60), (30:90), and (0:120). We assume the molecular total amount in Figure 6 is the standard value. Firstly, the transmission spectra in these 10 cases are simulated and then are converted into dataset matrix X. Each spectrum contains 176 transmission data points (wavelength-value increases from 5000 nm to 8500 nm with a step of 20 nm). Thus, the original data can be described by a 10 × 176 matrix X. PCA decomposes the original data X and expresses it in the form of PCs and SCs, which can be described as follows: X = SC∙PC + u, where, u is the average of data in matrix X. The utilized algorithm determines the PCs such that the first one contributes the highest variance and, thus, constitutes the largest contribution. Analogously, the second-order PC makes the second--largest contribution, and so forth. The correlation between individual datasets is more significant when fewer PCs are needed in order to describe the entire dataset. We set the target reduced dimension as two, meaning that PCA can reduce the original complex 10 × 176 matrix X to a two-dimensional matrix X’ (10 × 2). We utilized the built-in PCA function in MATLAB to perform PCA on the spectral dataset, which automatically performs the data standardization, covariance matrix calculation, eigenvalue decomposition, principal component selection and data transformation, and optimizing computational efficiency and numerical stability, particularly for large datasets.
The first two PCs and SCs of our data are shown in Figure 7b,c. It is noted that the PCs calculated by PCA, have no a priori physical interpretation [44]. The original ten sets of spectral data are simplified into ten data points in Figure 7c as a result of the dimension reduction. Firstly, ten data points are divided into two regions: Five points on the left-hand side (x < 0) are characterized by the same total amount of mixed molecules, which is below the established standard value; in addition, they have nearly the same x-value. The other five points are located on the right-hand side (x > 0), where the molecular total amount exceeds the standard value. It can be deduced that the first SCs (x-values) represent the total amount of mixed molecules: the larger the x-value, the higher the quantity of mixed molecules, and vice versa. The second SCs (y-values) are capable of differentiating the concentration ratio of specific molecules in mixed analytes. The second SCs also divide the data into two regions, where the yellow region (y > 0) represents CBP molecules that account for the majority, while the green region (y < 0) indicates a dominance of protein molecules. For different total amounts, the identical relative concentration ratios share nearly the same y-value, such as datasets (60:20) and (90:30). Now, it is possible to endow PCs in Figure 7b with a physical interpretation suitable for our case. The first PC has a resonance similar to the plasmonic resonance of the GSA, while the second PC carries all vibrational information of CBP and protein molecules, denoted by the yellow and green arrows, respectively. It is also observed that the two kinds of molecules’ vibrational bands display opposite directions, which correspond to the second SCs distributed at the two sides of the y-axis. Reasonably, the ten data points from the PCA algorithm match well with the physical interpretation. It is worth noting that, in our simulations, we assume a stable, ideal environment to isolate the sensor’s core behavior. The Fermi level is explicitly controlled via gate voltage, and material parameters are fixed based on standard references. If environmental factors vary, the plasmon resonance wavelengths and transmission spectra could shift, which might require adaptive tuning of the Fermi level to maintain accurate detection. For future work, it is vital to investigate the environmental effects on the sensor through experimental validation and more comprehensive simulations that include temperature and humidity effects. We will also explore the use of machine learning algorithms to compensate for environmental variations, enhancing the sensor’s practicality.

4. Conclusions

In summary, we have demonstrated a highly flexible and sensitive mid-infrared biosensing platform by integrating a tunable graphene square--aperture (GSA) array with machine learning-based spectral analysis. The key achievement of this work is the successful realization of simultaneous qualitative and quantitative identification of multiple biomolecules in complex mixtures. The specific advantages of our proposed GSA structure are threefold: firstly, its electrically tunable plasmonic resonance, spanning from 5.6 μm to 7.6 μm, enables selective matching with distinct molecular vibrational fingerprints without any structural alterations; secondly, it provides an unprecedented field confinement, leading to a signal enhancement of over 155 times for the CBP molecule compared to its intrinsic absorption; and thirdly, it exhibits remarkable angular robustness, maintaining stable performance up to 80° incidence. Most importantly, by synergizing the tunable graphene plasmons with the PCA algorithm, we quantitatively deconvoluted mixtures with unknown total amounts and concentration ratios, extracting the total molecular quantity and component ratio directly from complex transmission spectra. This synergistic strategy overcomes the limitations of fixed-resonance sensors and establishes a promising, versatile pathway for advanced analysis of complex biological analytes in biomedical diagnostics and environmental monitoring.

Author Contributions

Investigation, Z.Z. (Zhe Zhang) and Z.W.; methodology, simulation, data analysis, writing—original draft preparation, Z.Z. (Zhengkai Zhao) and Y.C.; resources, writing—review and editing, A.B., B.L. and Y.H. All authors have read and agreed to the published version of the manuscript.

Funding

This research was funded by the National Natural Science Foundation of China (NSFC), grant number 62305135.

Data Availability Statement

The data of our study are available upon request.

Conflicts of Interest

The authors declare no conflicts of interest.

References

  1. Rangel, G.F.; Martínez, L.D.D.; Walter, L.S.; Mizaikoff, B. Recent advances and trends in mid-infrared chem/bio sensors. Trends Anal. Chem. 2024, 180, 117916. [Google Scholar] [CrossRef]
  2. Brolo, A.G. Plasmonics for Future Biosensors. Nat. Photonics 2012, 6, 709–713. [Google Scholar] [CrossRef]
  3. Jain, P.K.; Huang, X.; El-Sayed, I.H.; El-Sayed, M.A. Noble metals on the nanoscale: Optical and photothermal properties and some applications in imaging, sensing, biology, and medicine. Acc. Chem. Res. 2008, 41, 1578–1586. [Google Scholar] [CrossRef]
  4. Qu, W.-G.; Deng, B.; Zhong, S.-L.; Shi, H.-Y.; Wang, S.-S.; Xu, A.-W. Plasmonic resonance energy transfer-based nanospectroscopy for sensitive and selective detection of 2,4,6-trinitrotoluene (TNT). Chem. Commun. 2011, 47, 1237–1239. [Google Scholar] [CrossRef]
  5. Willets, K.A.; Van Duyne, R.P. Localized Surface Plasmon Resonance Spectroscopy and Sensing. Annu. Rev. Phys. Chem. 2007, 58, 267–297. [Google Scholar] [CrossRef]
  6. Mayerhofer, T.G.; Popp, J. Periodic Array-Based Substrates for Surface-Enhanced Infrared Spectroscopy. Nanophotonics 2018, 7, 39–79. [Google Scholar] [CrossRef]
  7. Maleki, M.J.; Soroosh, M.; AL-Shammri, F.K.; Alkhayer, A.G.; Mondal, H. Design and Simulation of a Compact Subwavelength Graphene Based Switch for Surface Plasmon Polariton Transmission in Integrated Optoelectronic Circuits. Plasmonics 2025, 20, 3605–3617. [Google Scholar] [CrossRef]
  8. Mcoyi, M.P.; Mpofu, K.T.; Sekhwama, M.; Mthunzi-Kufa, P. Developments in Localized Surface Plasmon Resonance. Plasmonics 2025, 20, 5481–5520. [Google Scholar] [CrossRef]
  9. Mejía-Salazar, J.R.; Oliveira, O.N., Jr. Plasmonic biosensing: Focus review. Chem. Rev. 2018, 118, 10617–10625. [Google Scholar] [CrossRef] [PubMed]
  10. Neubrecht, F.; Huck, C.; Weber, K.; Pucci, A.; Giessen, H. Surface-enhanced infrared spectroscopy using resonant nanoantennas. Chem. Rev. 2017, 117, 5110–5145. [Google Scholar] [CrossRef] [PubMed]
  11. Jahn, M.; Patze, S.; Hidi, I.J.; Knipper, R.; Radu, A.I.; Mühlig, A.; Yüksel, S.; Peksa, V.; Weber, K.; Mayerhöfer, T.; et al. Plasmonic nanostructures for surface enhanced spectroscopic methods. Analyst 2016, 141, 756–793. [Google Scholar] [CrossRef] [PubMed]
  12. Aksu, S.; Yanik, A.A.; Adato, R.; Artar, A.; Huang, M.; Altug, H. High-throughput nanofabrication of infrared plasmonic nanoantenna arrays for vibrational nanospectroscopy. Nano Lett. 2010, 10, 2511–2518. [Google Scholar] [CrossRef]
  13. Zeng, S.; Sreekanth, K.V.; Shang, J.; Yu, T.; Chen, C.-K.; Yin, F.; Baillargeat, D.; Coquet, P.; Ho, H.-P.; Kabashin, A.V.; et al. Graphene-Gold Metasurface Architectures for Ultrasensitive Plasmonic Biosensing. Adv. Mater. 2015, 27, 6163–6169. [Google Scholar] [CrossRef]
  14. Xiao, S.; Wang, T.; Liu, Y.; Xu, C.; Han, X.; Yan, X. Tunable light trapping and absorption enhancement with graphene ring arrays. Phys. Chem. Chem. Phys. 2016, 18, 26661–26669. [Google Scholar] [CrossRef]
  15. Li, H.; Ji, C.; Ren, Y.; Hu, J.; Qin, M.; Wang, L. Investigation of multiband plasmonic metamaterial perfect absorbers based on graphene ribbons by the phase-coupled method. Carbon 2019, 141, 481–487. [Google Scholar] [CrossRef]
  16. Chen, K.; Adato, R.; Altug, H. Dual-band perfect absorber for multispectral plasmon-enhanced infrared spectroscopy. ACS Nano 2012, 6, 7998–8006. [Google Scholar] [CrossRef]
  17. Aouani, H.; Šipová, H.; Rahmani, M.; Navarro-Cia, M.; Hegnerová, K.; Homola, J.; Hong, M.; Maier, S.A. Ultrasensitive broadband probing of molecular vibrational modes with multifrequency optical antennas. ACS Nano 2013, 7, 669–675. [Google Scholar] [CrossRef]
  18. Bao, Q.; Loh, K.P. Graphene photonics, plasmonics, and broadband optoelectronic devices. ACS Nano 2012, 6, 3677–3694. [Google Scholar] [CrossRef]
  19. Liu, C.; Liu, P.; Yang, C.; Lin, Y.; Zha, S. Dynamic electromagnetically induced transparency based on a metal-graphene hybrid metamaterial. Opt. Mater. Express 2018, 8, 1132–1142. [Google Scholar] [CrossRef]
  20. Yan, H.; Low, T.; Zhu, W.; Wu, Y.; Freitag, M.; Li, X.; Guinea, F.; Avouris, P.; Xia, F. Damping pathways of mid-infrared plasmons in graphene nanostructures. Nat. Photonics 2013, 7, 394–399. [Google Scholar] [CrossRef]
  21. Li, Y.; Yan, H.; Farmer, D.B.; Meng, X.; Zhu, W.; Osgood, R.M.; Heinz, T.F.; Avouris, P. Graphene plasmon enhanced vibrational sensing of surface-adsorbed layers. Nano Lett. 2014, 14, 1573–1577. [Google Scholar] [CrossRef]
  22. Jablan, M.; Buljan, H.; Soljačić, M. Plasmonics in graphene at infrared frequencies. Phys. Rev. B 2009, 80, 245435. [Google Scholar] [CrossRef]
  23. Rodrigo, D.; Tittl, A.; John-Herpin, A.; Limaj, O.; Altug, H. Self-similar multiresonant nanoantenna arrays for sensing from near-to mid-infrared. CS Photonics 2018, 5, 4903–4911. [Google Scholar] [CrossRef]
  24. Liu, X.; Galfsky, T.; Sun, Z.; Xia, F.; Lin, E.-C.; Lee, Y.-H.; Kéna-Cohen, S.; Menon, V.M. Strong light–matter coupling in two-dimensional atomic crystals. Nat. Photonics 2015, 9, 30–34. [Google Scholar] [CrossRef]
  25. Zhang, Z.; Lee, Y.; Haque, M.F.; Leem, J.; Hsieh, E.Y.; Nam, S.W. Plasmonic sensors based on graphene and graphene hybrid materials. Nano Converg. 2022, 9, 28. [Google Scholar] [CrossRef]
  26. Yager, T.; Chikvaidze, G.; Wang, Q.; Fu, Y. Graphene Hybrid Metasurfaces for Mid-Infrared Molecular Sensors. Nanomaterials 2023, 13, 2113. [Google Scholar] [CrossRef]
  27. Wu, X.; Zhao, H.Y.; Pei, J.Y. Fabrication of nanopore in graphene by electron and ion beam irradiation: Influence of graphene thickness and substrate. Comput. Mater. Sci. 2015, 102, 258–266. [Google Scholar] [CrossRef]
  28. Wu, Z.; Liu, B.; Liao, S.; Xu, Z. Vibrational strong coupling of organic molecules embedded within graphene plasmon nanocavities facilitated by perfect absorbers. J. Chem. Phys. 2024, 161, 234703. [Google Scholar] [CrossRef] [PubMed]
  29. Han, Q.; Zhang, H.; Kaplan, A.; Fan, S.; Xu, Y.; Zhang, C.; Gao, W.; He, E.; Dong, J. Synthesis of flexible SERS sensing platform of graphene/Ag-popcorns/PMMA for ultrasensitive detection. Spectrochim. Acta A 2026, 347, 126888. [Google Scholar] [CrossRef] [PubMed]
  30. Cai, Y.; Hang, Y.; Zhou, Y.; Zhu, J.; Yang, J.; Wang, X. Graphene-based biosensors for detection of composite vibrational fingerprints in the Mid-infrared region. Nanomaterials 2019, 9, 1496. [Google Scholar] [CrossRef]
  31. Zhu, J.; Cheng, J.; Zhang, L.; Liu, Q. Modeling of 2D graphene material for plasmonic hybrid waveguide with enhanced near-infrared modulation. Mater. Lett. 2017, 186, 53–56. [Google Scholar] [CrossRef]
  32. Rodrigo, D.; Limaj, O.; Janner, D.; Etezadi, D.; García de Abajo, F.J.; Pruneri, V.; Altug, H. Mid-infrared plasmonic biosensing with graphene. Science 2015, 349, 165–168. [Google Scholar] [CrossRef]
  33. Zhang, H.; Liu, Y.; Liu, Z.Q.; Liu, X.S.; Liu, G.Q.; Fu, G.L.; Wang, J.Q.; Shen, Y. Multi-functional polarization conversion manipulation via graphene-based metasurface reflectors. Opt. Express 2021, 29, 70–81. [Google Scholar] [CrossRef]
  34. Guo, X.D.; Hu, H.; Zhu, X.; Yang, X.X.; Dai, Q. Higher order Fano graphene metamaterials for nanoscale optical sensing. Nanoscale 2017, 9, 14998–15004. [Google Scholar] [CrossRef]
  35. Jiang, X.P.; Zhang, Z.J.; Wen, K.; Li, G.F.; He, J.; Yang, J.B. A Triple-Band Hybridization Coherent Perfect Absorber Based on Graphene Metamaterial. Appl. Sci. 2020, 10, 1750. [Google Scholar] [CrossRef]
  36. Rodrigo, D.; Tittl, A.; Ait-Bouziad, N.; John-Herpin, A.; Limaj, O.; Kelly, C.; Yoo, D.; Wittenberg, N.J.; Oh, S.-H.; Lashuel, H.A.; et al. Resolving molecule-specific information in dynamic lipid membrane processes with multi-resonant infrared metasurfaces. Nat. Commun. 2018, 9, 2160. [Google Scholar] [CrossRef] [PubMed]
  37. Limaj, O.; Etezadi, D.; Wittenberg, N.J.; Rodrigo, D.; Yoo, D.; Oh, S.-H.; Altug, H. Infrared plasmonic biosensor for real-time and label-free monitoring of lipid membranes. Nano Lett. 2016, 16, 1502–1508. [Google Scholar] [CrossRef] [PubMed]
  38. Gao, W.; Shu, J.; Qiu, C.; Xu, Q. Excitation of plasmonic waves in graphene by guided-mode resonances. ACS Nano 2012, 6, 7806–7813. [Google Scholar] [CrossRef]
  39. Ju, L.; Geng, B.; Horng, J.; Girit, C.; Martin, M.; Hao, Z.; Bechtel, H.A.; Liang, X.; Zettl, A.; Shen, Y.R.; et al. Graphene plasmonics for tunable terahertz metamaterials. Nat. Nanotechnol. 2011, 6, 630–634. [Google Scholar] [CrossRef] [PubMed]
  40. Wan, W.; Yang, X.; Gao, J. Strong coupling between mid-infrared localized plasmons and phonons. Opt. Express 2016, 24, 12367–12374. [Google Scholar] [CrossRef]
  41. Pérez-González, O.; Aizpurua, J.; Zabala, N. Optical transport and sensing in plexcitonic nanocavities. Opt. Express 2013, 21, 15847–15858. [Google Scholar] [CrossRef]
  42. Chen, H.; Shao, L.; Woo, K.C.; Wang, J.; Lin, H.-Q. Plasmonic-molecular resonance coupling: Plasmonic splitting versus energy transfer. J. Phys. Chem. C 2012, 116, 14088–14095. [Google Scholar] [CrossRef]
  43. Balci, S.; Kucukoz, B.; Balci, O.; Karatay, A.; Kocabas, C.; Yaglioglu, G. Tunable plexcitonic nanoparticles: A model system for studying plasmon—Exciton interaction from the weak to the ultrastrong coupling regime. ACS Photonics 2016, 3, 2010–2016. [Google Scholar] [CrossRef]
  44. Kühner, L.; Semenyshyn, R.; Hentschel, M.; Neubrech, F.; Tarín, C.; Giessen, H. Vibrational sensing using infrared nanoantennas: Toward the noninvasive quantitation of physiological levels of glucose and fructose. ACS Sens. 2019, 4, 1973–1979. [Google Scholar] [CrossRef] [PubMed]
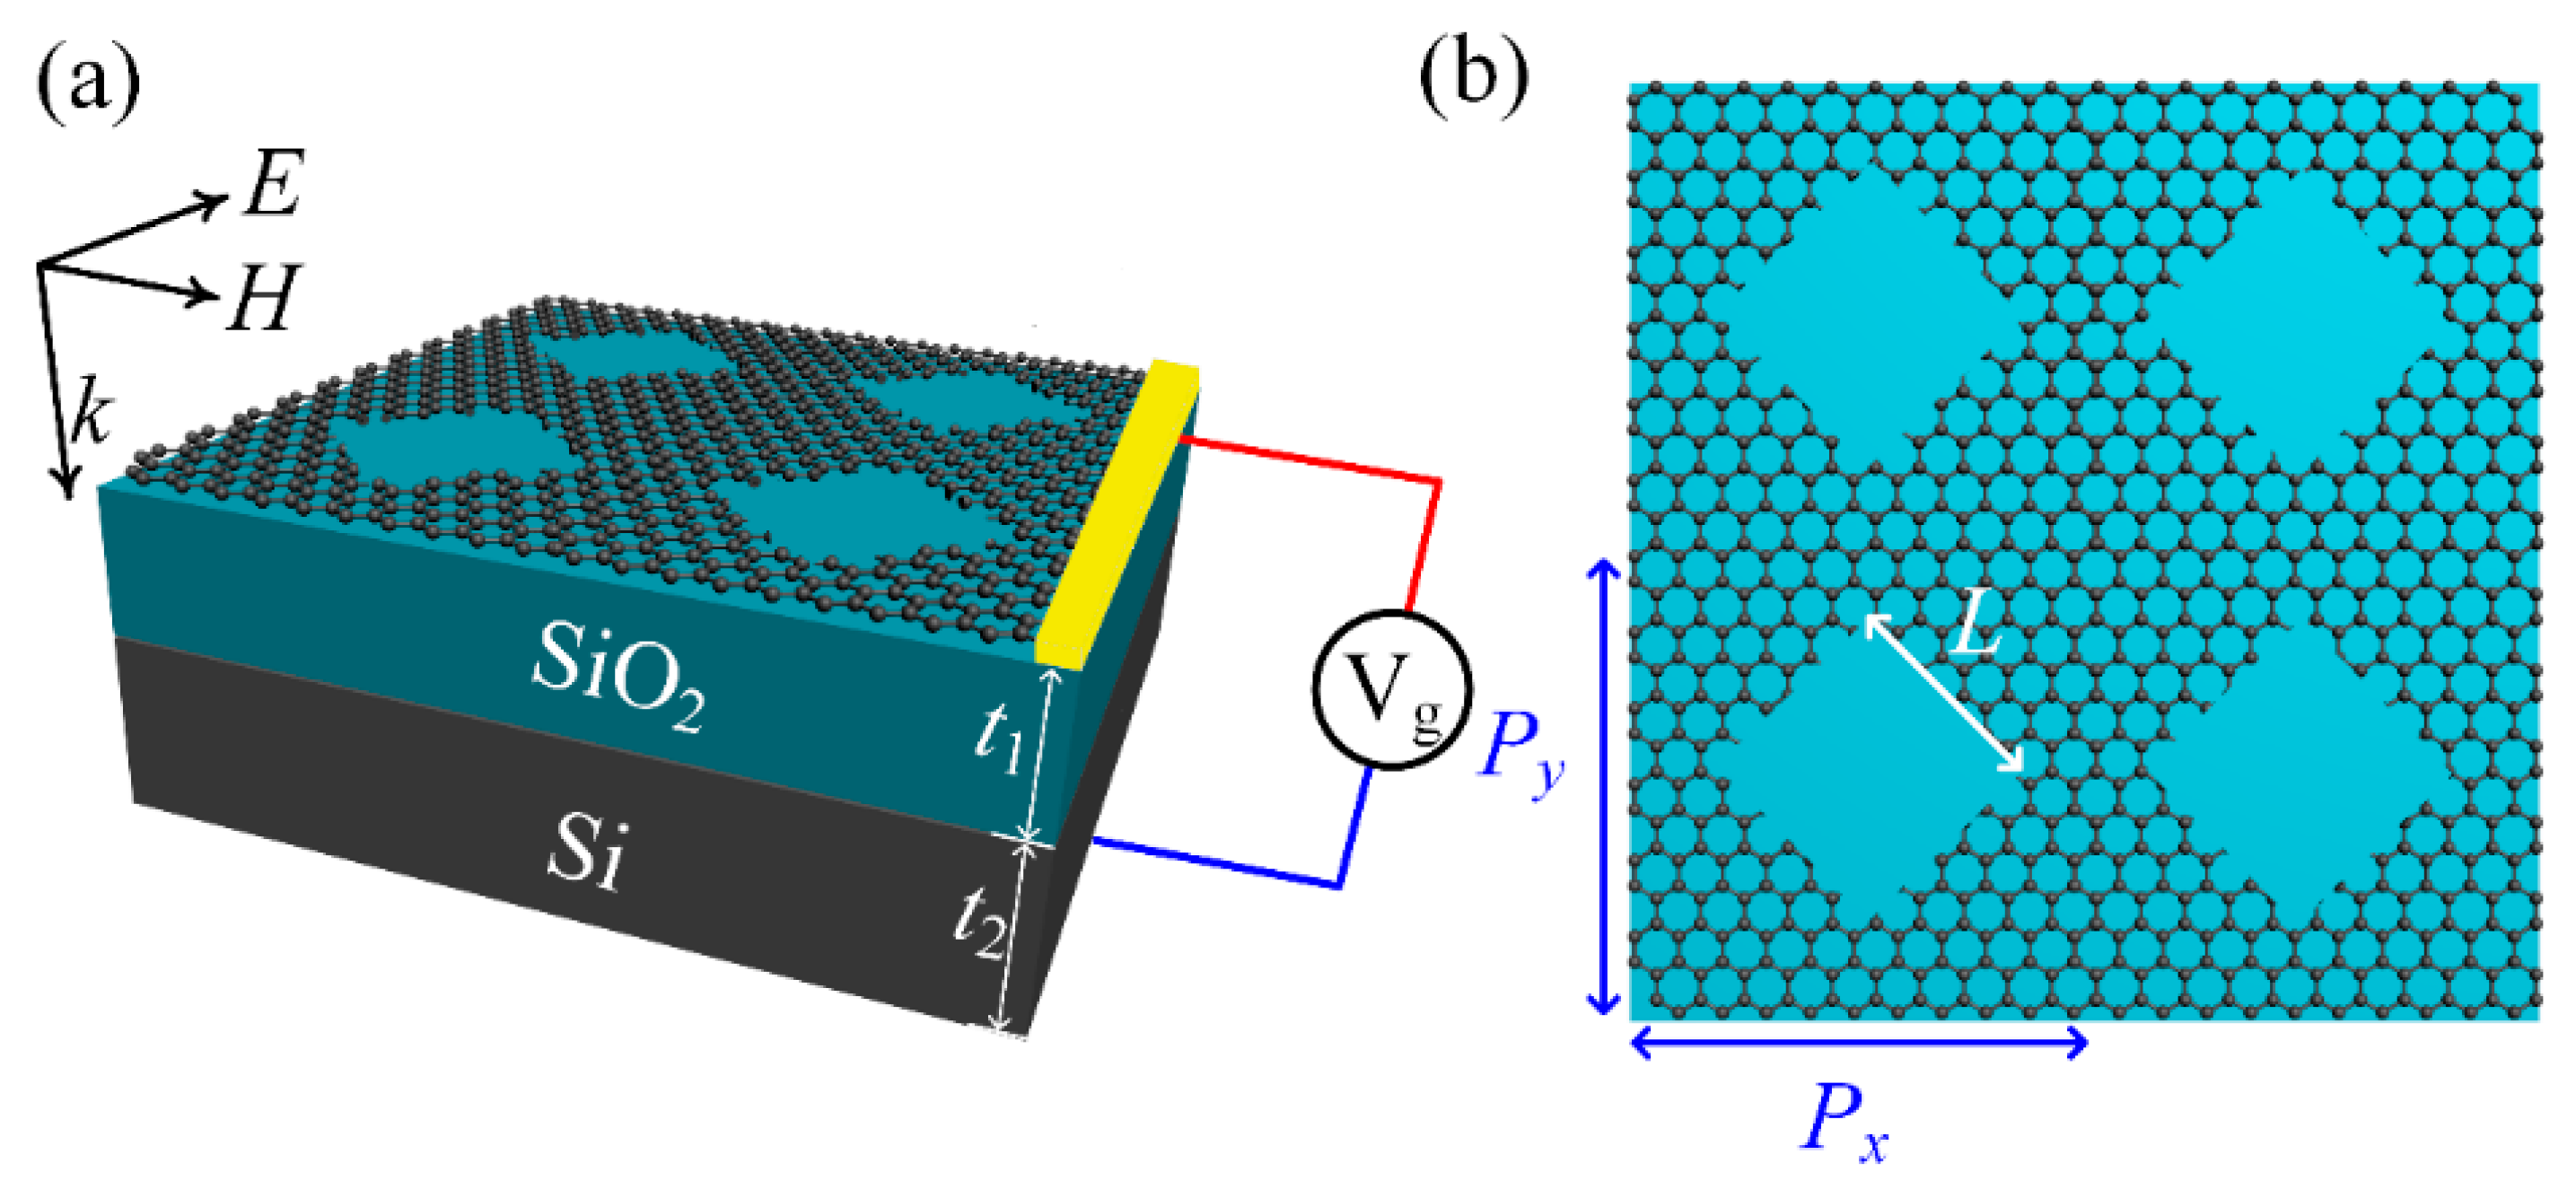
Figure 1. (a) Schematic of the structure of the single-layer GSA array with electrostatic tuning: a periodic graphene square-aperture array is placed at the top of the SiO2 and Si layer, and a bias voltage Vg is applied between the Au electrode and the Si substrate for Fermi-level modulation. (b) Top-view of the GSA structure. Here, Px and Py are the periods of the unit cell in the x and y directions, respectively. The side length of the square aperture is L. The thickness of the silicon dioxide (SiO2) dielectric layer and the silicon (Si) substrate are t1 and t2, respectively.
Photonics 12 01000 g001
Figure 2. (a) Transmission spectra of the LSP resonance caused by the GSA structure under normal incidence of TM waves with different Fermi energy levels from 0.5 eV to 0.9 eV. (b) Electric-field enhancement distribution of the GSA structure at a Fermi energy level of EF = 0.7 eV. (c) Transmission spectra of the GSA structure under different incident angles at a Fermi energy level of EF = 0.7 eV. Herein, the period P = 130 nm and the side length of the square aperture L = 50 nm. The color gradients represent enhanced field intensity (blue: low, red: high).
Photonics 12 01000 g002
Figure 3. (a) Optical response of the bare GSA structure, the pure CBP molecules, and the coupled GSA-CBP system under normal incidence. The blue dashed line represents the transmission of LSP resonance of the bare GSA structure at ~6.89 μm when the Fermi energy level is approximately 0.64 eV; the red dotted line denotes the absorption of the vibrational band of pure CBP molecules (~0.004); and the blue solid line shows the transmission of the GSA structure covered with the same CBP molecule, with a transmission difference ΔT of ~0.63. (b) Contour plot of the transmission spectra of the GSA-CBP coupled system under different incident angles at EF = 0.64 eV (where LSP resonance matches CBP vibrational band). Herein, the period P = 130 nm and the side length of the square aperture L = 50 nm.
Photonics 12 01000 g003
Figure 4. (a) Transmission spectra of the GSA structure covered with CBP molecules under different Fermi energy levels EF from 0.5 eV to 0.9 eV. The arrow indicates the direction of change in the Fermi level. (b) Electric-field distributions of the GSA structure covered with CBP molecules corresponding to different Fermi energy levels, Ef. Herein, the period P = 130 nm and the side length of the structure L = 50 nm. The color represents electric-field intensity (blue: low, red: high).
Photonics 12 01000 g004
Figure 5. (a) Transmission spectra of the GSA structure covered with protein molecules under different Fermi energy levels Ef from 0.5 eV to 0.9 eV. The arrow indicates the direction of change in the Fermi level. (b) Electric-field distributions of the GSA structure covered with protein with different Fermi energy levels, Ef. Herein, the period P = 130 nm and the length L = 50 nm. The color represents electric-field intensity (blue: low, red: high).
Photonics 12 01000 g005
Figure 6. (a) Transmission spectra of the GSA structure covered with both CBP molecules and protein molecules under different Fermi energy levels, Ef. (b) Electric-field distribution of the GSA structure covered with both CBP molecules and protein molecules corresponding to different Fermi energy levels, Ef. Herein, the period P = 130 nm and the length L = 50 nm. The color represents electric-field intensity (blue: low, red: high).
Photonics 12 01000 g006
Figure 7. (a) Transmission spectra of the GSA array with mixed CBP and protein molecules at different mixing ratios. (b) The first and second PC obtained from PCA. (c) The first and second SCs from PCA, denoting the total amount of the mixed molecules and the ratio of each type of molecule, respectively. The dashed line in indicates the discriminant boundary used to classify the two types of molecules.
Photonics 12 01000 g007
Disclaimer/Publisher’s Note: The statements, opinions and data contained in all publications are solely those of the individual author(s) and contributor(s) and not of MDPI and/or the editor(s). MDPI and/or the editor(s) disclaim responsibility for any injury to people or property resulting from any ideas, methods, instructions or products referred to in the content.