Article

Characterizing Normal and Tumour Blood Microcirculatory Systems Using Optical Coherence Tomography

by
Héctor A. Contreras-Sánchez
1,*,
William Jeffrey Zabel
1,
Costel Flueraru
2,
Lothar Lilge
1,3,
Edward Taylor
4,5 and
Alex Vitkin
1,3,4,5
1
Department of Medical Biophysics, University of Toronto, Toronto, ON M5G 1L7, Canada
2
Advanced Electronics and Photonics Research Center, National Research Council of Canada, Ottawa, ON K1A 0R6, Canada
3
Princess Margaret Cancer Centre, University Health Network, Toronto, ON M5G 2C4, Canada
4
Radiation Medicine Program, Princess Margaret Cancer Centre, Toronto, ON M5G 2M9, Canada
5
Department of Radiation Oncology, University of Toronto, Toronto, ON M5T 1P5, Canada
*
Author to whom correspondence should be addressed.
Photonics 2024, 11(9), 891; https://doi.org/10.3390/photonics11090891
Submission received: 15 August 2024 / Revised: 13 September 2024 / Accepted: 17 September 2024 / Published: 21 September 2024
(This article belongs to the Special Issue OCT Technology Advances and Their Applications in Disease Studies)

Abstract

:
Blood vessels transport blood and deliver essential molecules to cells. In cancer, the tumour vasculature evolves very differently from healthy tissue, not only in morphology but also in functionality. Comprehensive 3D in vivo imaging of the tumour microcirculatory system thus might lead to a clearer understanding of the vascular role in tumour growth and response to cancer therapy. Here, we employed two optical coherence tomography (OCT) extensions, speckle-variance and Doppler, to study the microvascular architecture and blood flow in normal murine and xenograft tumour tissue. We explored the biophysics of blood flow in microcirculation and extracted relevant quantification features such as vessel diameters and velocity histograms, and combined diameter–velocity plots. It was demonstrated that tumour microcirculation evolves in time and differs from healthy tissue, impacting tumour growth kinetics. This proof-of-principle study demonstrates the potential of OCT to provide an understanding of the temporal evolution of the tumour vasculature and its relationship with tumour development.

1. Introduction

The microcirculatory system is responsible for transporting oxygen, nutrients, and other chemicals for cell growth and maintenance. The spatial organization of the vascular network in normal tissues goes hand-in-hand with the distribution of blood flow (hemodynamics) to optimize nutrient delivery efficiency [1]. Blood vessels on the arterial side bifurcate and hierarchically decrease in size until reaching the capillaries, which must fill the available tissue space to provide nutrients to all cells. At the same time, there is also a hierarchical distribution of blood flow velocities through the vascular network: blood flow slows down in capillaries to ensure an efficient material exchange to surrounding cells [1,2,3,4]. In contrast to normal tissues, solid tumours often develop a chaotic and disorganized vascular network that fails to adequately transport blood to all the tumour microregions. The lack of blood supply induces physiological stress in cancer cells and subsequently alters the tumour microenvironment, primarily due to oxygen and nutrient deprivation, resulting in the formation of hypoxic regions, necrotic areas, and alterations in tumour metabolism and blood flow [5,6,7,8,9,10]. Further, the hydrodynamic resistance of tumours with such heterogeneous microvascular networks is highly variable and leads to anomalous microcirculatory patterns that are constantly evolving as tumours grow and develop [11]. They can significantly differ among cancer types and even within the same tumour type, whereas the unique characteristics of a healthy vascular network are often preserved to ensure optimal cellular function across different tissues [2].
The properties of the vascular network—flow and spatial architecture—thus play a critical role in tumour development and response to therapy. Both chemotherapy and radiotherapy require a minimally functioning vasculature to deliver drugs [12] and oxygen [13], respectively. The latter is needed to augment radiotherapy efficacy via the well-known oxygen enhancement effect. Understanding how the tumour vasculature evolves temporally in both the spatial and flow domains may be critical in predicting tumour growth and therapy response kinetics. Vascular hemodynamics can be examined through multiple methods [14], albeit frequently requiring contrast agents or restricting blood flow analysis to a few vessels, whereas the tumour physiological milieu is complex, and the presence of vasculature does not necessarily yield a functional blood supply [11]. Hence, the whole extent of the tumour microcirculation needs to be studied thoroughly, employing an imaging method capable of serially capturing vascular microarchitecture and blood flow as necessary.
Optical coherence tomography (OCT) [15] is a three-dimensional, non-invasive microscopic/mesoscopic imaging modality with broad applications in biomedicine and enormous capabilities to investigate tumour biology and cancer therapy efficacy in vivo [16,17,18,19,20]. Label-free visualization of blood vessels in the micrometric scale is a common implementation of OCT via numerous approaches [21,22]. Such is the case of speckle-variance OCT (svOCT), an OCT extension that uses time-dependent changes in the OCT speckle signal intensity caused by the motion of red blood cells (RBCs) to visualize tissue microvascular networks [23,24]. Several morphological microvascular properties (e.g., vessel diameter, tortuosity, fractal dimension, volumetric density, etc.) are derivable from svOCT images. However, most often, such quantitative analysis lacks functional blood flow information [16,17,18]. One prospective route for determining blood flow is Doppler OCT (DOCT) [25,26,27], but vascular functionality afforded by DOCT is challenged by the angle dependency of the Doppler effect and difficulties in detecting slow blood velocities. Substantial efforts have been made to retrieve absolute speed by determining the angle between the illumination beam and the flow vector (Doppler angle), which fall broadly within two main categories: (1) post-processing algorithms that rely on previous knowledge of the orientation of the vessels [28,29,30,31,32] and (2) the use of multiple beams or channel detection that enables the reconstruction of the flow vectors in 3D without prior knowledge of the Doppler angles’ geometries, although this necessitates increasing the OCT system complexity [33,34]. In the context of (1), combined OCT angiography and DOCT methods have been demonstrated to overcome the angle dependency in DOCT [35]. This combination could prove methodologically beneficial for accurate 3D Doppler angle determination from svOCT data but also biophysically useful for directly evaluating the complex interplay between blood flow and vessel morphology. For example, vascular spatial architecture and velocity distributions are connected by Poiseuille’s law: the resistance of a vessel scales as its diameter (to the power of −4), meaning that a steep energetic cost (cardiac power) is required to achieve the slowing down of flow in a space-filling network of progressively smaller vessels [1,2]. The distribution of vessel sizes and velocities in normal tissues results from the minimization of cardiac power to achieve efficient nutrient exchange (slow capillary blood velocity) and maximum distribution (space-filling capillary network) [2,3,4]. In addition, blood flow velocity is suggested to vary linearly with the diameter [36], resulting from the optimality principle of fluid transport in effective microvascular networks. The slope and correlation coefficient from this linear function could therefore serve as indicators of intravascular communication, vessel functionality, and the resistance properties of the microvascular network. Hence, evaluating these quantities can be advantageous for determining the distinctive perfusion properties of normal and tumour tissues [36,37]. The ability to quantify such basic aspects of branching flowing networks can also prove useful for identifying dysfunctional vessels, vascular stasis, and perfusion shunts in tumours [11,37], which is particularly relevant for longitudinal in vivo studies of tumour response during or post therapy.
In this study, we build upon the combined svOCT and DOCT approaches by describing a direct methodology to furnish an OCT platform with such dual functionality. Following validation in flow phantoms, a quantitative comparison between healthy skin and a xenograft model of pancreatic cancer (using the dorsal skin window chamber preparation) is presented and discussed. Monitoring the temporal evolution of the tumour microcirculation is also explored towards a comprehensive understanding of the complex tumour microcirculatory system and its role in tumour growth kinetics and therapeutic response monitoring.

2. Materials and Methods

2.1. Flow Phantom

A flow phantom, created for OCT calibration purposes, consisted of a 315 μm inner diameter tube (Masterflex RK-06417-11, Cole-Parmer Instrument Company, Vernon Hills, IL, USA) immersed in 89% (w/w) water, 10% gelatin (G2500-–500G; gel strength 300, Type A, Sigma Aldrich Co, St. Louis, MO, USA) and 1% intralipid (Fresenius Kabi Canada Ltd., Richmond Hill, ON, Canada). A 2% intralipid solution was injected at a constant speed into the tube using an electronic syringe pump (NE-1000, New Era Pump Systems, Inc., Farmingdale, NY, USA). In humans, and similarly, in mice, blood slows three orders of magnitude, from ~1 m/s in the aorta to ~1 mm/s in capillaries, to ensure sufficient transit time through the capillaries for nutrient extravasation to match their consumption in the surrounding tissues [38,39]. The flow rates thus tested ranged from 1 to 30 μL/min, corresponding to a linear flow range of 0.43 to 7 mm/s (max speed).

2.2. Mice

Immunocompromised NOD-Rag1null IL2rgnull (NRG) 7–8 week-old female mice were used for this study. All animal experiments and procedures were performed in accordance with relevant guidelines and regulations under a protocol approved by the University Health Network Institutional Animal Care and Use Committee in Toronto, Canada (AUP #3256). To study normal vasculature, 3D-printed custom-made window chambers were surgically sutured into the dorsal skin of mice (N = 3). For tumours (N = 3), ~2.5 × 10⁵ Ds-Red-labelled, human-derived pancreatic cancer cells (BxPC-3 cell line, AntiCancer Inc., San Diego, CA, USA) suspended in 1:1 PBS:Matrigel (BD, Biosciences, Mississauga, ON, Canada) were injected subcutaneously into the dorsal skin. Window chambers were installed after the tumours reached an ~3 mm-diameter size to avoid interrupting tumour growth dynamics. For experimental details on tumour inoculation, window chamber design, and surgery, see [40]. An epifluorescence microscope (Leica Microsystems MZ FLIII, Richmond Hill, ON, Canada) was used to obtain brightfield and Ds-Red (a 535 nm excitation, a 580 nm emission) fluorescence images of the window chamber (an 800 ms exposure time) to report on tumour lateral extent and viability, utilizing a 3D-printed mouse stage to maintain a fixed window chamber location. Mice anesthesia was initiated using 5% isoflurane and maintained with 1.5% isoflurane for OCT and fluorescence imaging. The administration of isoflurane and oxygen (0.5 L/min) in mice was kept constant to reduce confounding physiological effects in blood flow caused by anesthesia changes during OCT imaging [41]. The use of 1.5% isoflurane is suggested to be the most appropriate for stable cardiovascular function and similar physiological conditions relative to the conscious state of the animal [41]. The tumour mice were investigated on three different days: after surgery (referred to as the first imaging day, following the protocols as published [40]), six days later, and twelve days later, to monitor the temporal evolution of the tumour microcirculation.

2.3. Swept Source OCT (SS-OCT)

The OCT data were acquired with a previously described fibre-based SS-OCT system [42,43] consisting of a swept-source emitter (HS2000-HL, Santec, Komaki, Japan) with a 1310 nm central wavelength and 110 nm bandwidth. The average optical power was 10 mW with an A-scan rate of 20 kHz and 80% duty cycle. One percent of the light was used for recalibration. A Mach–Zehnder interferometer splits 90% of the light to the sample arm and 10% to the reference arm. Two balanced detectors were used in a quadrature detection setting, which allows for the extraction of both the real and imaginary components of the complex interferograms, and then digitized using a 16-bit resolution acquisition card (ATS9625, Alazartech, Montreal, QC, Canada). Two galvanometric mirrors (GVS-012, Thorlabs, NJ, USA) for fast (x) and slow (y) axis scanning enabled volumetric data acquisition. Axial and lateral resolutions were 8 μm and 15 μm in air, respectively. The sample arm incidence was slightly tilted (7°) to avoid specular reflection saturation at perpendicular incidence, yielding the Doppler angle θD = 83° for the phantom study. A homemade microstage was developed in the sample arm for animal handling. The system was operated using LabView 2015 software (National Instruments, Austin, TX, USA).
The parameters for volumetric imaging of the phantom were 4000 A-scans in a single B-scan (DOCT), two repetitions, and 180 B-scans along the slow axis covering a 1 mm2 field-of-view (FOV). The OCT data acquisition for normal mouse skin and human xenograft tumours consisted of two volumetric datasets for svOCT and DOCT, respectively. In the speckle-variance approach, a 6 × 6 mm2 FOV was imaged using a configuration of two sub-volumes of 1600 B-scans for the slow axis (400 A-scans per B-scan) and 24 repetitions per location for enhanced vessel segmentation. With the Doppler approach, the same FOV was acquired using three sub-volumes of 8000 A-scans covering 2 mm laterally, two repetitions, and 400 B-scans along the slow axis. This configuration provides 4000 A-scans/mm for an accurate velocity estimation. The data acquisition time was ≈20 min for the Doppler approach and ≈40 min for the svOCT approach, yielding an approximate imaging time of one hour. There was a slight overlap between the sub-volumes to account for stitching artefacts. These parameters can be adjusted depending on the OCT system capabilities and desired resolution/FOV/imaging speed demands, towards the minimization of imaging times for potential clinical implementations. The integration of all the OCT algorithms is summarized in Figure 1.

2.4. Phase-Resolved DOCT

Compared with time domain systems, Fourier domain OCT systems are preferred for Doppler studies [44]. Phase-resolved DOCT (PRDOCT) calculates the Doppler phase shift by measuring the phase difference Δ ϕ between spatially correlated A-scans arising from multiple A-scans acquired at the same position (oversampled B-scans). Because phase shifts are obtained in the Fourier domain, PRDOCT does not require a Hilbert transformation like time domain systems while maintaining high spatial and velocity resolution [44]. Additionally, averaging along lateral and depth dimensions improves the signal-to-noise ratio (SNR) [27]. The cross-correlation algorithm for phase shifts is as follows:
Δ ϕ = a r c t a n j = 1 J z = 1 Z I m A j + 1 , z R e A j , z I m A j , z R e A j + 1 , z j = 1 J z = 1 Z R e A j + 1 , z R e A j , z + I m A j , z I m A j + 1 , z
where A refers to an A-scan,   Δ ϕ is the four-quadrant phase shift between the j + 1 and j A-scans, and J and Z are the number of lateral A-scans and axial slices used for averaging (J = 32 and Z = 2 for the phantom and in vivo studies), respectively. To take advantage of the oversampled B-scans, an averaged phase shift Δ ϕ ¯ was obtained by measuring the phase shift signal Δ ϕ not only with its immediate j + 1 adjacent A-line but also with the next A-lines (e.g., j A-line with j + 1, j + 2, j + 3, etc.), following normalization and averaging [31]. This implementation increases SNR and sensitivity to low velocities by increasing the time difference between A-lines but also requires more computational time [31]. Further, a high-pass frequency filter was applied to the raw OCT data to suppress the static component signal of the OCT voxels and thus enhance the dynamic fluid signal, and a phase shift filter with the threshold set at the noise floor of the system (see Results section) was applied prior to the average phase measurements using Equation (1) to enhance RBC motion detection in in vivo settings [45].
The obtained phase shift Δ ϕ ¯ is proportional to the speed v according to:
v = Δ ϕ ¯   λ 0 4 π n Δ T c o s θ D
where 1/∆T is the A-scan rate of the system (20 kHz), n is the refractive index of the flowing fluid (1.37 for phantoms [46], 1.43 for in vivo experiments [47]), λ0 is the central wavelength of the laser (1310 nm), and θD is the Doppler angle. The latter was estimated using the svOCT approach.

2.5. svOCT Microvascular Segmentation and Doppler Angle Calculations

Optical angiography was performed using intensity-based svOCT [23,24], yielding the spatially resolved 3D microvasculature given by:
S V x y z = I x y z l I x y z l ¯ 2 ¯
where S V x y z is the intensity variance for a given voxel, Ixyzl is the intensity of the backscattered light, l is the number of B-scan repetitions and the overbar denotes the temporal average. The time difference between two repeated B-scans is 20 ms, which is sufficiently long to discriminate moving structures (RBCs in blood vessels) from the static tissue background based on differences in speckle decorrelation times [23,24]. The 3D microvascular map thus obtained is methodologically critical for accurately determining the geometry and morphology of the vessels within the examined tissue (for Doppler angle corrections) and biophysically critical for the combined analysis of the microvascular architecture and Doppler blood flow information. A semi-automated, custom-made code in MATLAB R2022b (MathWorks, Inc., Natick, MA, USA) was utilized for vascular segmentation, specifically adapted to the dorsal skin window chamber mouse model as described below.

2.5.1. Microvascular Segmentation Pipeline

As part of the pre-processing steps, the variation in the OCT speckle intensity signal for every voxel was calculated using Equation (3). The space between the surface of the tissue and the glass of the window chamber typically has some fluid buildup which appears bright on the svOCT image. This noise between the glass–tissue interface was manually segmented and removed. The maximum tissue depth for subsequent analysis was then selected up to 750 µm in depth. For the svOCT tumour volume determination, the 2D fluorescence image was coregistered to the svOCT dataset and used to create an en face binary tumour mask using the Otsu thresholding method, and all vessels outside of the mask were excluded from the analysis. Additionally, the tumour was manually 3D contoured using the depth information from the B-scans. A simple 2D en face square footprint was employed for healthy skin to create its volume of interest for vascular segmentation.
The vascular segmentation section consists of multiple processing filters [48] applied in two steps for considering small and large vessels. A low-pass filter for high-frequency noise removal, a top-hat filter for contrast enhancement, and a Gaussian filter to smooth out salt-and-pepper noise were implemented axially to the contoured svOCT volumes. In addition, an exponential filter was applied to remove shadowing artefacts in the cross-sectional svOCT scans caused by RBC forward scattering [24]. Blood vessels were segmented and binarized in every axial slice using the Otsu thresholding method, with the final output being a binary 3D function where the foreground represents a vessel and the background otherwise.

2.5.2. Doppler Angle Measurements

To retrieve the Doppler angle for every vessel, the morphological vessel information from the svOCT-segmented vessels was employed. Among the available methods for Doppler angle corrections [28,29,30,31,32], we adopted the Hessian matrix ( H ) approach proposed by You et al. [32] and defined by:
H = 2 f x 2 2 f x y 2 f x z 2 f x y 2 f y 2 2 f y z 2 f x z 2 f y z 2 f z 2
where f (x, y, z) is obtained by convolving the svOCT microvascular mask with a Gaussian function. The 3D longitudinal orientation of every vessel is then obtained by calculating voxel-by-voxel the eigenvector v = ( v x , v y , v z ) of H with the lowest eigenvalue (|λ|) [32,49]. Once determined, the Doppler angle is estimated as the dot product between the eigenvector and the vector describing the direction of the illumination beam:
cos   θ D x , y , z = v y cos 83 ° + v z sin 83 ° v x 2 + v y 2 + v z 2
As noted above, the particular choice of 83 ° accounts for the small tilt angle (7°) in the OCT system used for this study. The calculation of the Hessian matrix was a discrete process where the OCT voxel size determines the step size. After implementing Equation (5), a median filter was applied to smooth the obtained angle values.

2.6. Quantification of the Microcirculatory System

Implementing all methods, as depicted in Figure 1, generates morphological and physiological microvascular maps. For initial exploratory and validation purposes, a subset of vessels across branching points was selected, and representative velocity profiles for each vessel in the bifurcation were obtained by drawing a line passing through the vessel’s centre. The flow continuity equation: Q1 = Q2 + Q3, where Q = v ¯ A is the product of the mean velocity v ¯ passing through a cross-sectional region of area A, was further evaluated for every branching point. These parameters (mean ± SD across five distinct cross-sectional areas) were manually measured using the open-source programme ImageJ. Q2 and Q3 were treated as dependent variables, and as such the covariance was considered for error measurements [50] when the flow rates were added together. For microvascular quantification, a Euclidean distance transform was applied to the binarized vessel mask to compute the shortest distance of all foreground (vessel) voxels to the background, and vessels were also skeletonized to obtain the centrelines of the distance transform. This enables a centreline-to-background distance determination (twice that distance is the vessel diameter) and an estimate of centreline velocity. The distributions of values of these two quantities were used to derive the individual histograms and then generate diameter-velocity plots. Given the large number of OCT voxels often encountered in the diameter-velocity plots, the resultant data were analyzed in discrete subsets (window size = 30), and the median value was reported to eliminate noise and outliers. For the latter analysis of complete microvascular networks, only centreline (maximum) velocity was utilized, as it represents the region of maximum flow, offering higher sensitivity and detection. Figure 2 further illustrates how quantification is performed.

3. Results and Discussion

3.1. Validation of DOCT and Its Sensitivity in Flow Phantom

The microcirculation comprises a vast range of blood flow rates (in the order of mm/s), and thus to be a useful detector of tissue vascular functionality, DOCT must be able to detect flow rates well within this range. The detection capabilities of the OCT system to assess blood flow were characterized using a simple phantom outlined in Figure 3. Panel (a) displays a structural OCT scan of the phantom and its main constituents, and panel (b) summarizes the various flow rates tested in this experiment (within the dashed square “tube region” in (a)). The experimental velocity values derived from the Doppler effect were compared with the set flow rates by integrating the flow signal from 20 distinct cross-sectional scans. The resultant plot is shown in panel (c), demonstrating good agreement between the obtained and expected values (R2 = 0.99, m = 0.99 ± 0.03) but also deviating to some extent from the line of identity at slow flow rates.
To determine the sensitivity of the OCT in the lower range, a static region covering 1000 A-scans laterally and 50 points in depth was taken to obtain the phase noise histogram shown in panel (d). Phase noise is normally distributed, with standard deviation σ = 13.7 mrad and hence a FWHM = 2 2 l n 2     σ = 32.3 mrad. The latter frequently denotes the floor noise and thus, the minimum detectable speed in the system, which was found to be ~±200 μm/s for the OCT system used in this study. Commonly reported values of this lower limit are within tens of milliradians [51,52,53]. A three-dimensional segmented flow tube section, obtained by using the svOCT mask and the DOCT flow signal, is shown in panel (e) using the Python viewer tool napari [54]. The results of this phantom experiment merely help determine the OCT flow detection capabilities in more challenging in vivo settings. The phase noise limit is of marked significance for flow detection at the smaller capillaries, and as such, this detection limit was considered for the interpretation of the results in the following sections.

3.2. Blood Velocity Measurements in Healthy Skin

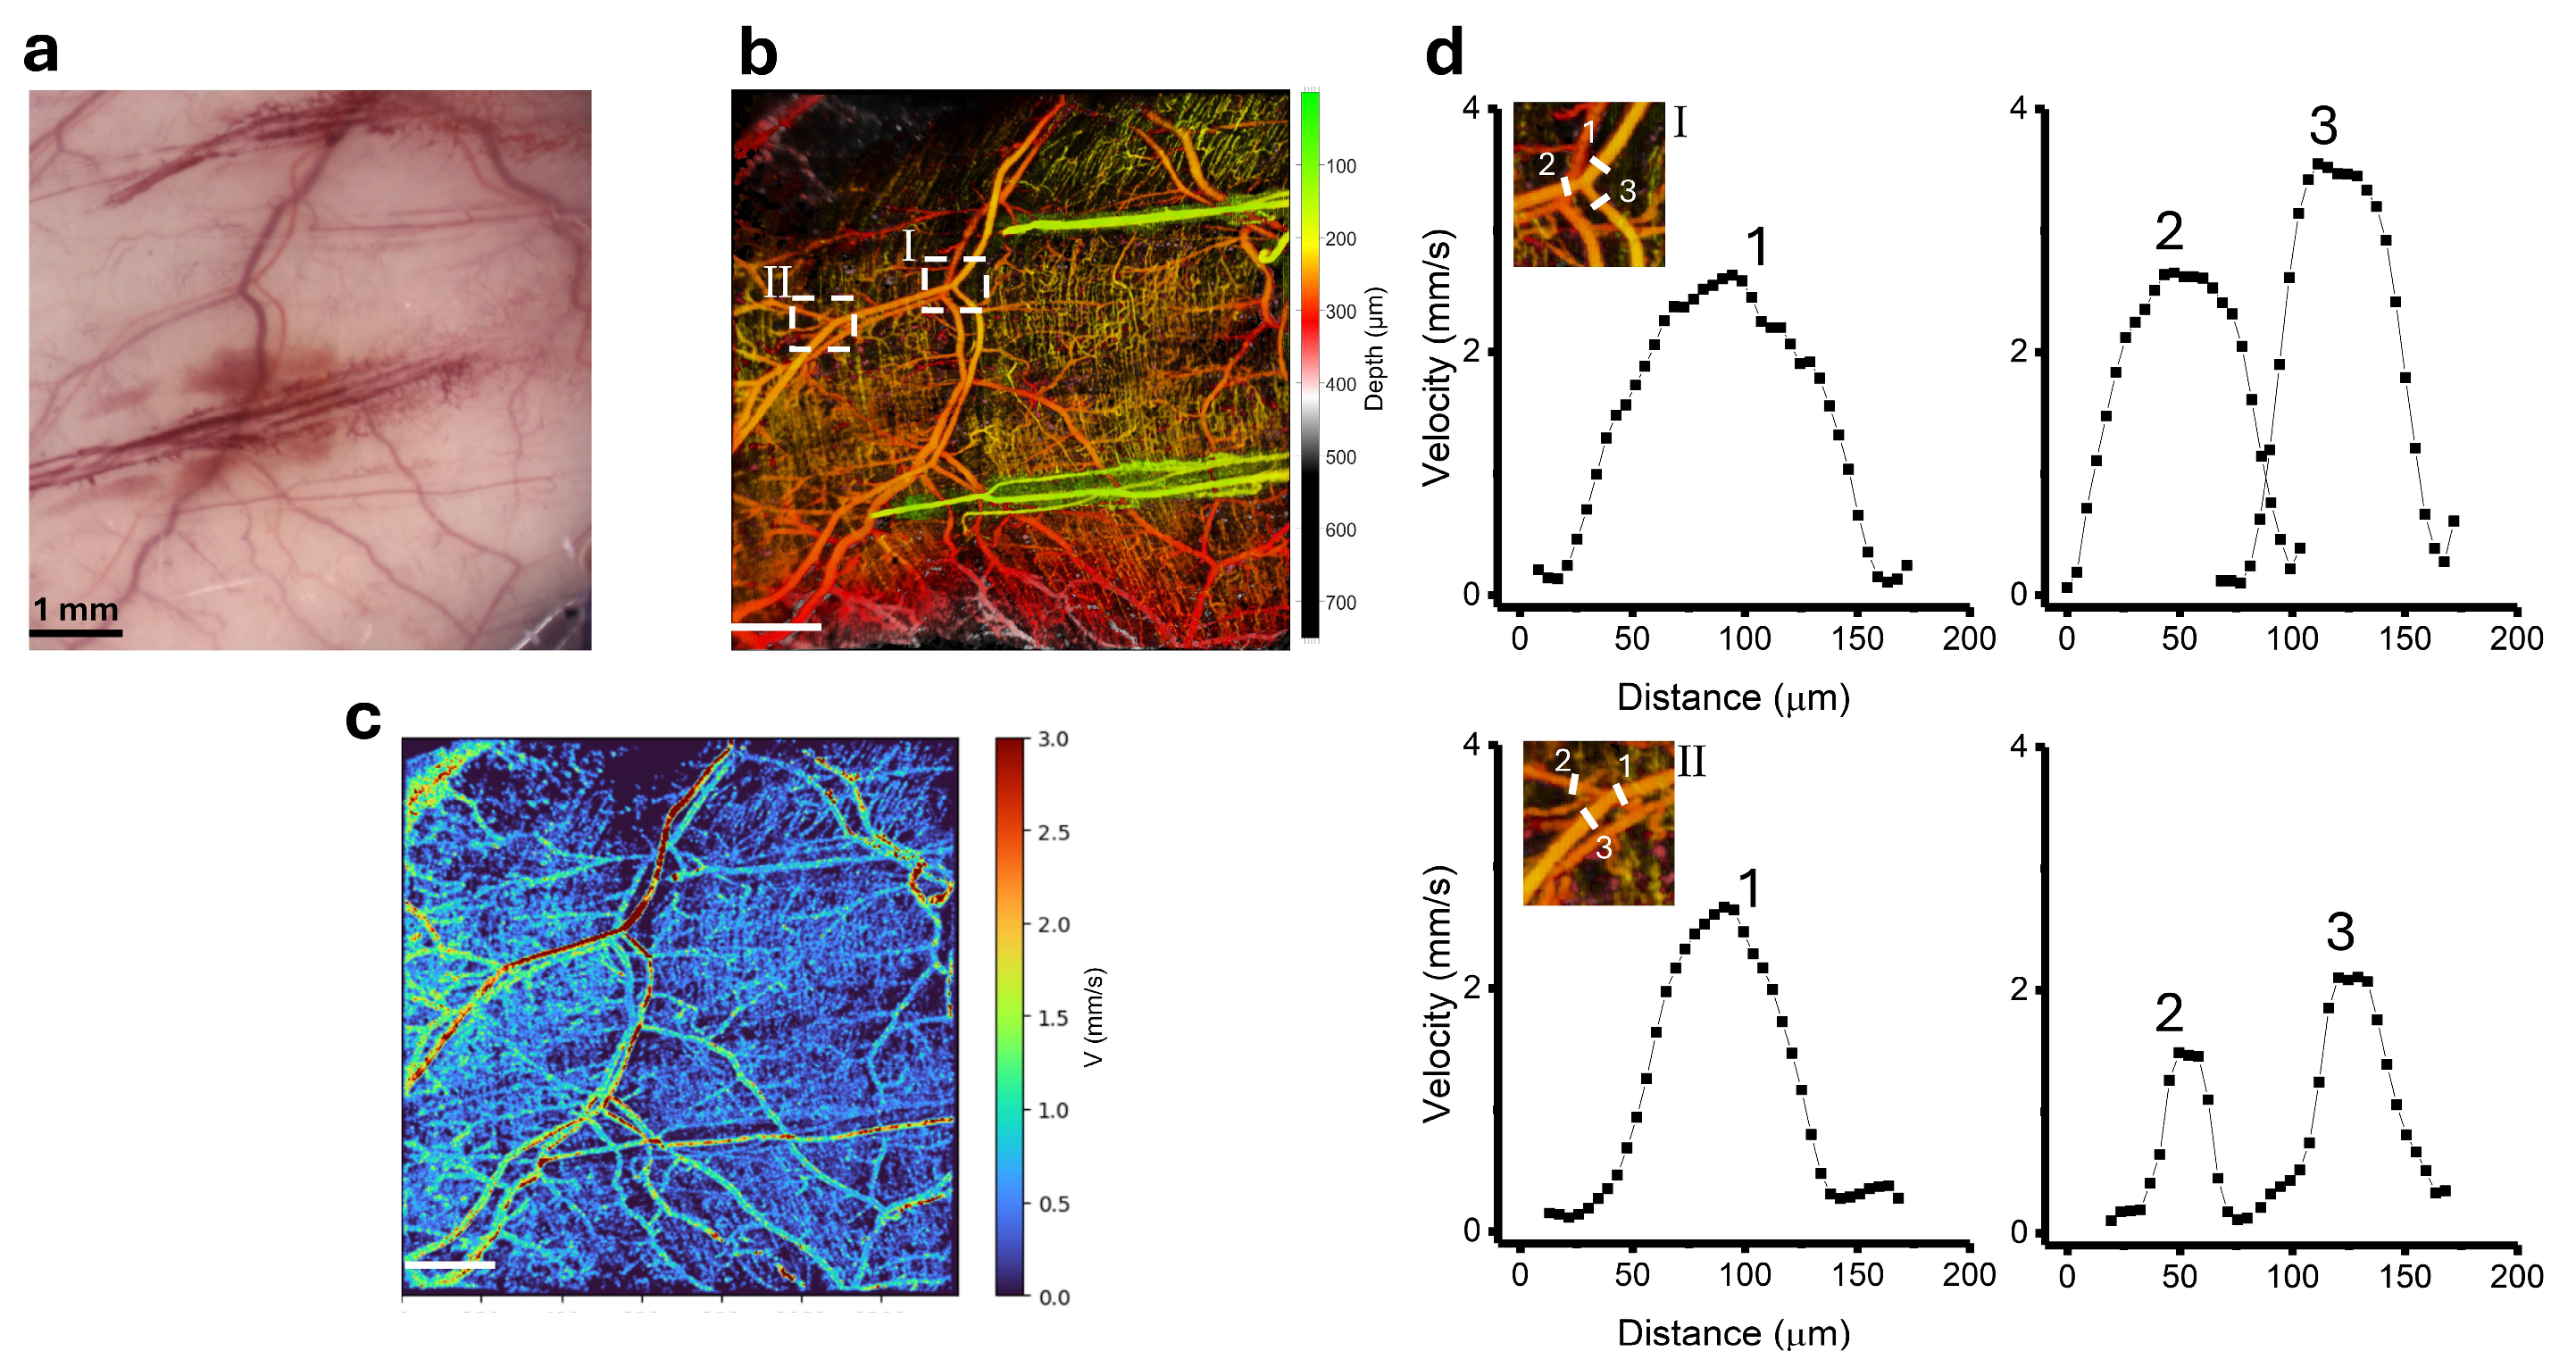
The architecture and resultant blood flow pattern of a healthy microvascular network are optimized for an adequate exchange of nutrients and oxygen to the tissue cells while minimizing the resistance of the vascular network (and hence, cardiac power output) [1,2,3,4]. Studies in normal mouse skin were performed next, with representative images displayed in Figure 4. Panel (a) shows the brightfield image of the window chamber and panel (b) the coloured depth-encoded microvascular image of the healthy skin obtained from the svOCT microvascular segmentation pipeline. The vessels are visually very organized, as expected for a well-perfused tissue; their capacity to transport and diffuse materials to proximal cells is further governed by the behaviour of blood flow through them. In panel (c), the blood flow velocities obtained from DOCT supplement the structural vessel information in (b), yielding a clearer representation of the mass transport system where the distribution of blood and RBCs is influenced by both vessel spatial architecture and blood flow velocity.
To assess the accuracy of the experimental flow measurements and understand the biophysics of blood flow in the microvasculature, two different branching points were selected (dashed squares regions in (a)) to examine blood flow in the mother (one upstream) and daughter (two downstream) vessels. The velocity profiles in panel (d) show that blood flow through these healthy vessels generally exhibits parabolic-like profiles. Since the Reynolds numbers of blood at the microcirculatory level are low (<<1), inertial effects can be ignored, and parabolic Poiseuille flows are expected [3]. However, blood is not a homogeneous fluid, and RBCs tend to migrate to the vessel’s centre and create a cell-free (boundary) layer of blood plasma adjacent to the vessel wall [3,4]. Within the context of OCT detecting backscattered RBC signal, the weak OCT signal and low flows arising from the lubricant plasma layers likely account for the observed blunted parabolas.
The selected branching points also permit validation of the flow conservation in the microcirculation’s network. Resultant measurements of the vessel cross-sectional area, mean and max velocity, and flow are reported in Table 1. For the first branching point, it was found that Q1 = (12.9 ± 1.0) × 106 µm3/s and Q2 + Q3 = (16.5 ± 5.2) × 106 µm3/s (+22% increase). For the second branching point, these values were found to be Q1 = (4.0 ± 1.7) × 106 µm3/s and Q2 + Q3 = (4.4 ± 2.1) × 106 µm3/s (+9% increase). Both results are largely within their respective error ranges, and comparable to the literature reports in similar OCT studies [55], mostly attributed to non-continuum effects (e.g., pulsatile flow), periodic vessel dilation, and limited statistical analysis.

3.3. Blood Velocity Measurements in Tumour

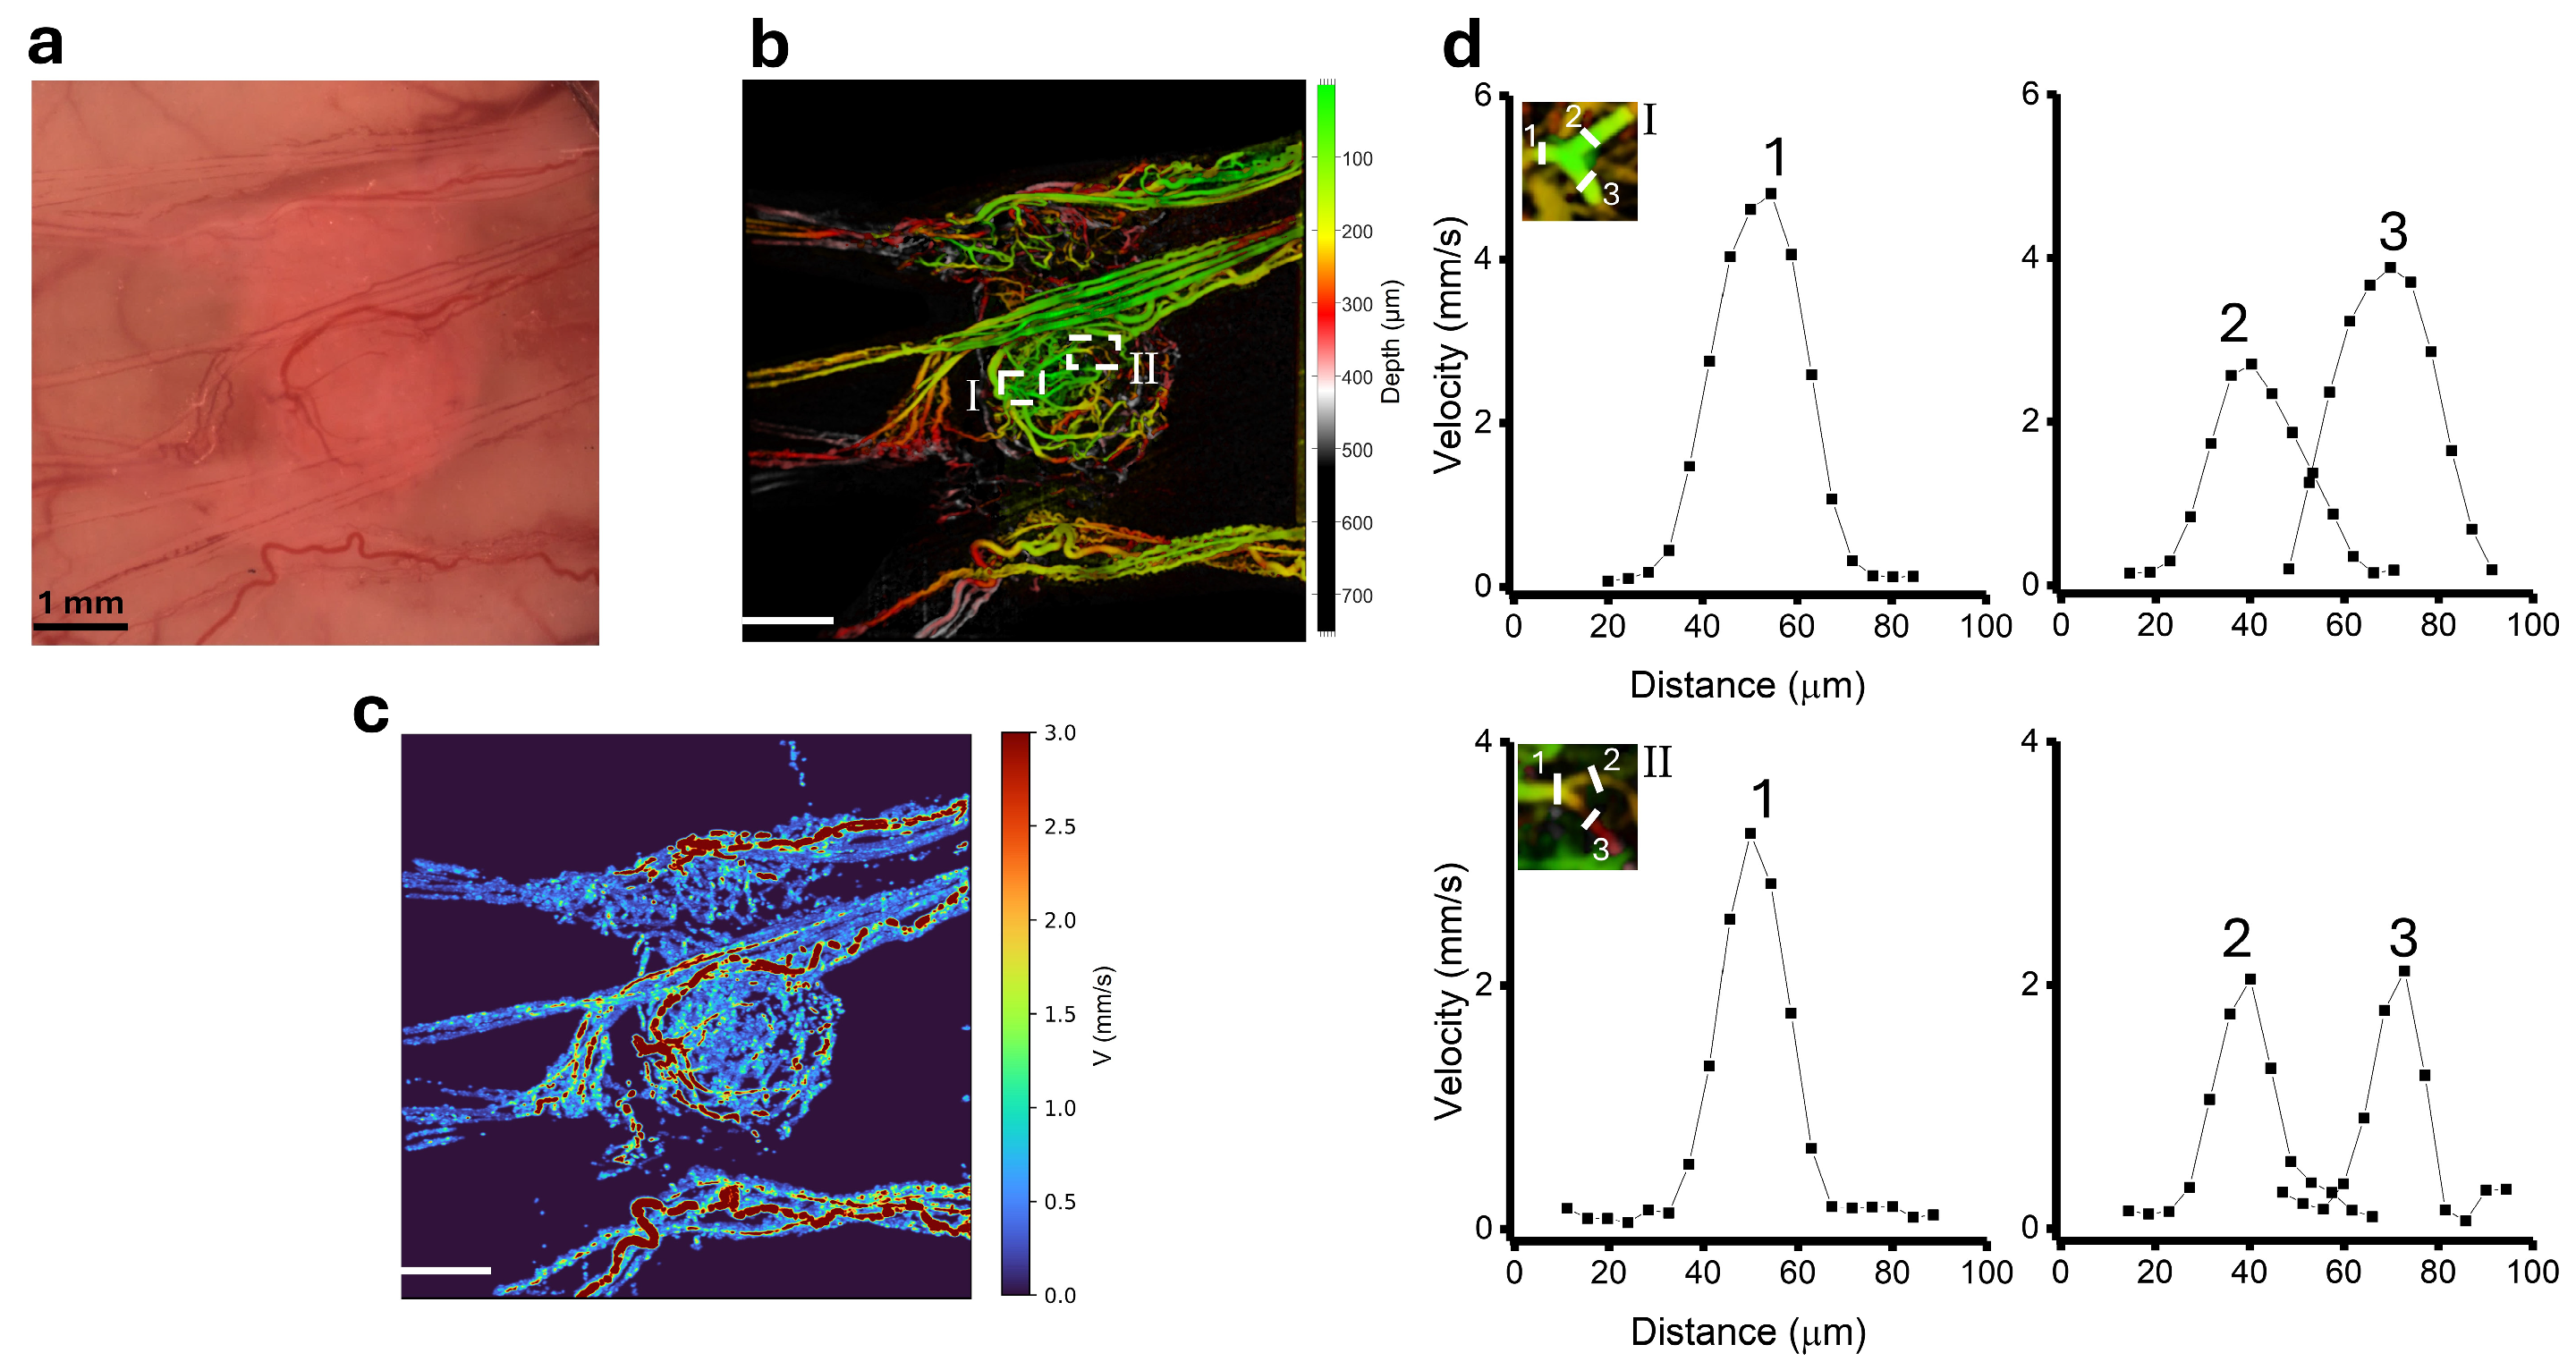
The results presented in Figure 4 establish the general basis of microvascular organization and hemodynamics for normal, well-perfused tissues, a useful baseline to understand inherent changes when a tumour is implanted into healthy host tissue. Solid tumours are known to develop their own system of vessels, but this process is chaotic, and vascular functionality is generally suboptimal. We present representative images of the combined svOCT microstructural and DOCT blood velocity study in the pancreatic human xenograft tumour model in Figure 5. Panels (a–c) show the brightfield image of the window chamber, the microvascular svOCT image, and the blood velocity information from DOCT integrated with the svOCT-determined vascular network, respectively. A typical disorganized tumour vascular bed is evident. The chaotic development of tumour vessels commonly arises from healthy vessels in the host tissue [5,6] whose function is the main source of blood supply/drainage (as observed in panels (b,c)).
The analysis of conservation of flow at two diverging bifurcations marked by dashed squares in (b) was performed as previously described for healthy tissue (Table 1). The blood velocity profiles in panel (d) show that tumour blood flow is also Poiseuille-like, which is more evident in large vessels but less so in smaller ones. As previously discussed, this deviation from parabolic flow profiles may be caused by RBC migration to the region of maximum flow [3,4]. Another important effect is the large hematocrit level of mammalian blood (~40–45% in humans, ~40–50% in mice [56]), so this largely particulate fluid will likely deviate in its flow patterns from a single-phase continuum behaviour; this ‘granularity’ deviation will manifest more severely at slow flow rates in small (capillary) vessels, where individual RBCs move in single file. As seen in this tumour example, the blood flow values for the first branching point were Q1 = (7.2 ± 1.5) × 106 µm3/s and Q2 + Q3 = (5.7 ± 1.8) × 106 µm3/s (−27% decrease). For the second branching point, Q1 = (1.9 ± 0.7) × 106 µm3/s and Q2 + Q3 = (1.9 ± 0.3) × 106 µm3/s (flow conserved). Out of the four analyzed branching points (two in tumours and two in healthy tissues), it was found that flow was thus conserved within an error of up to ~30%.
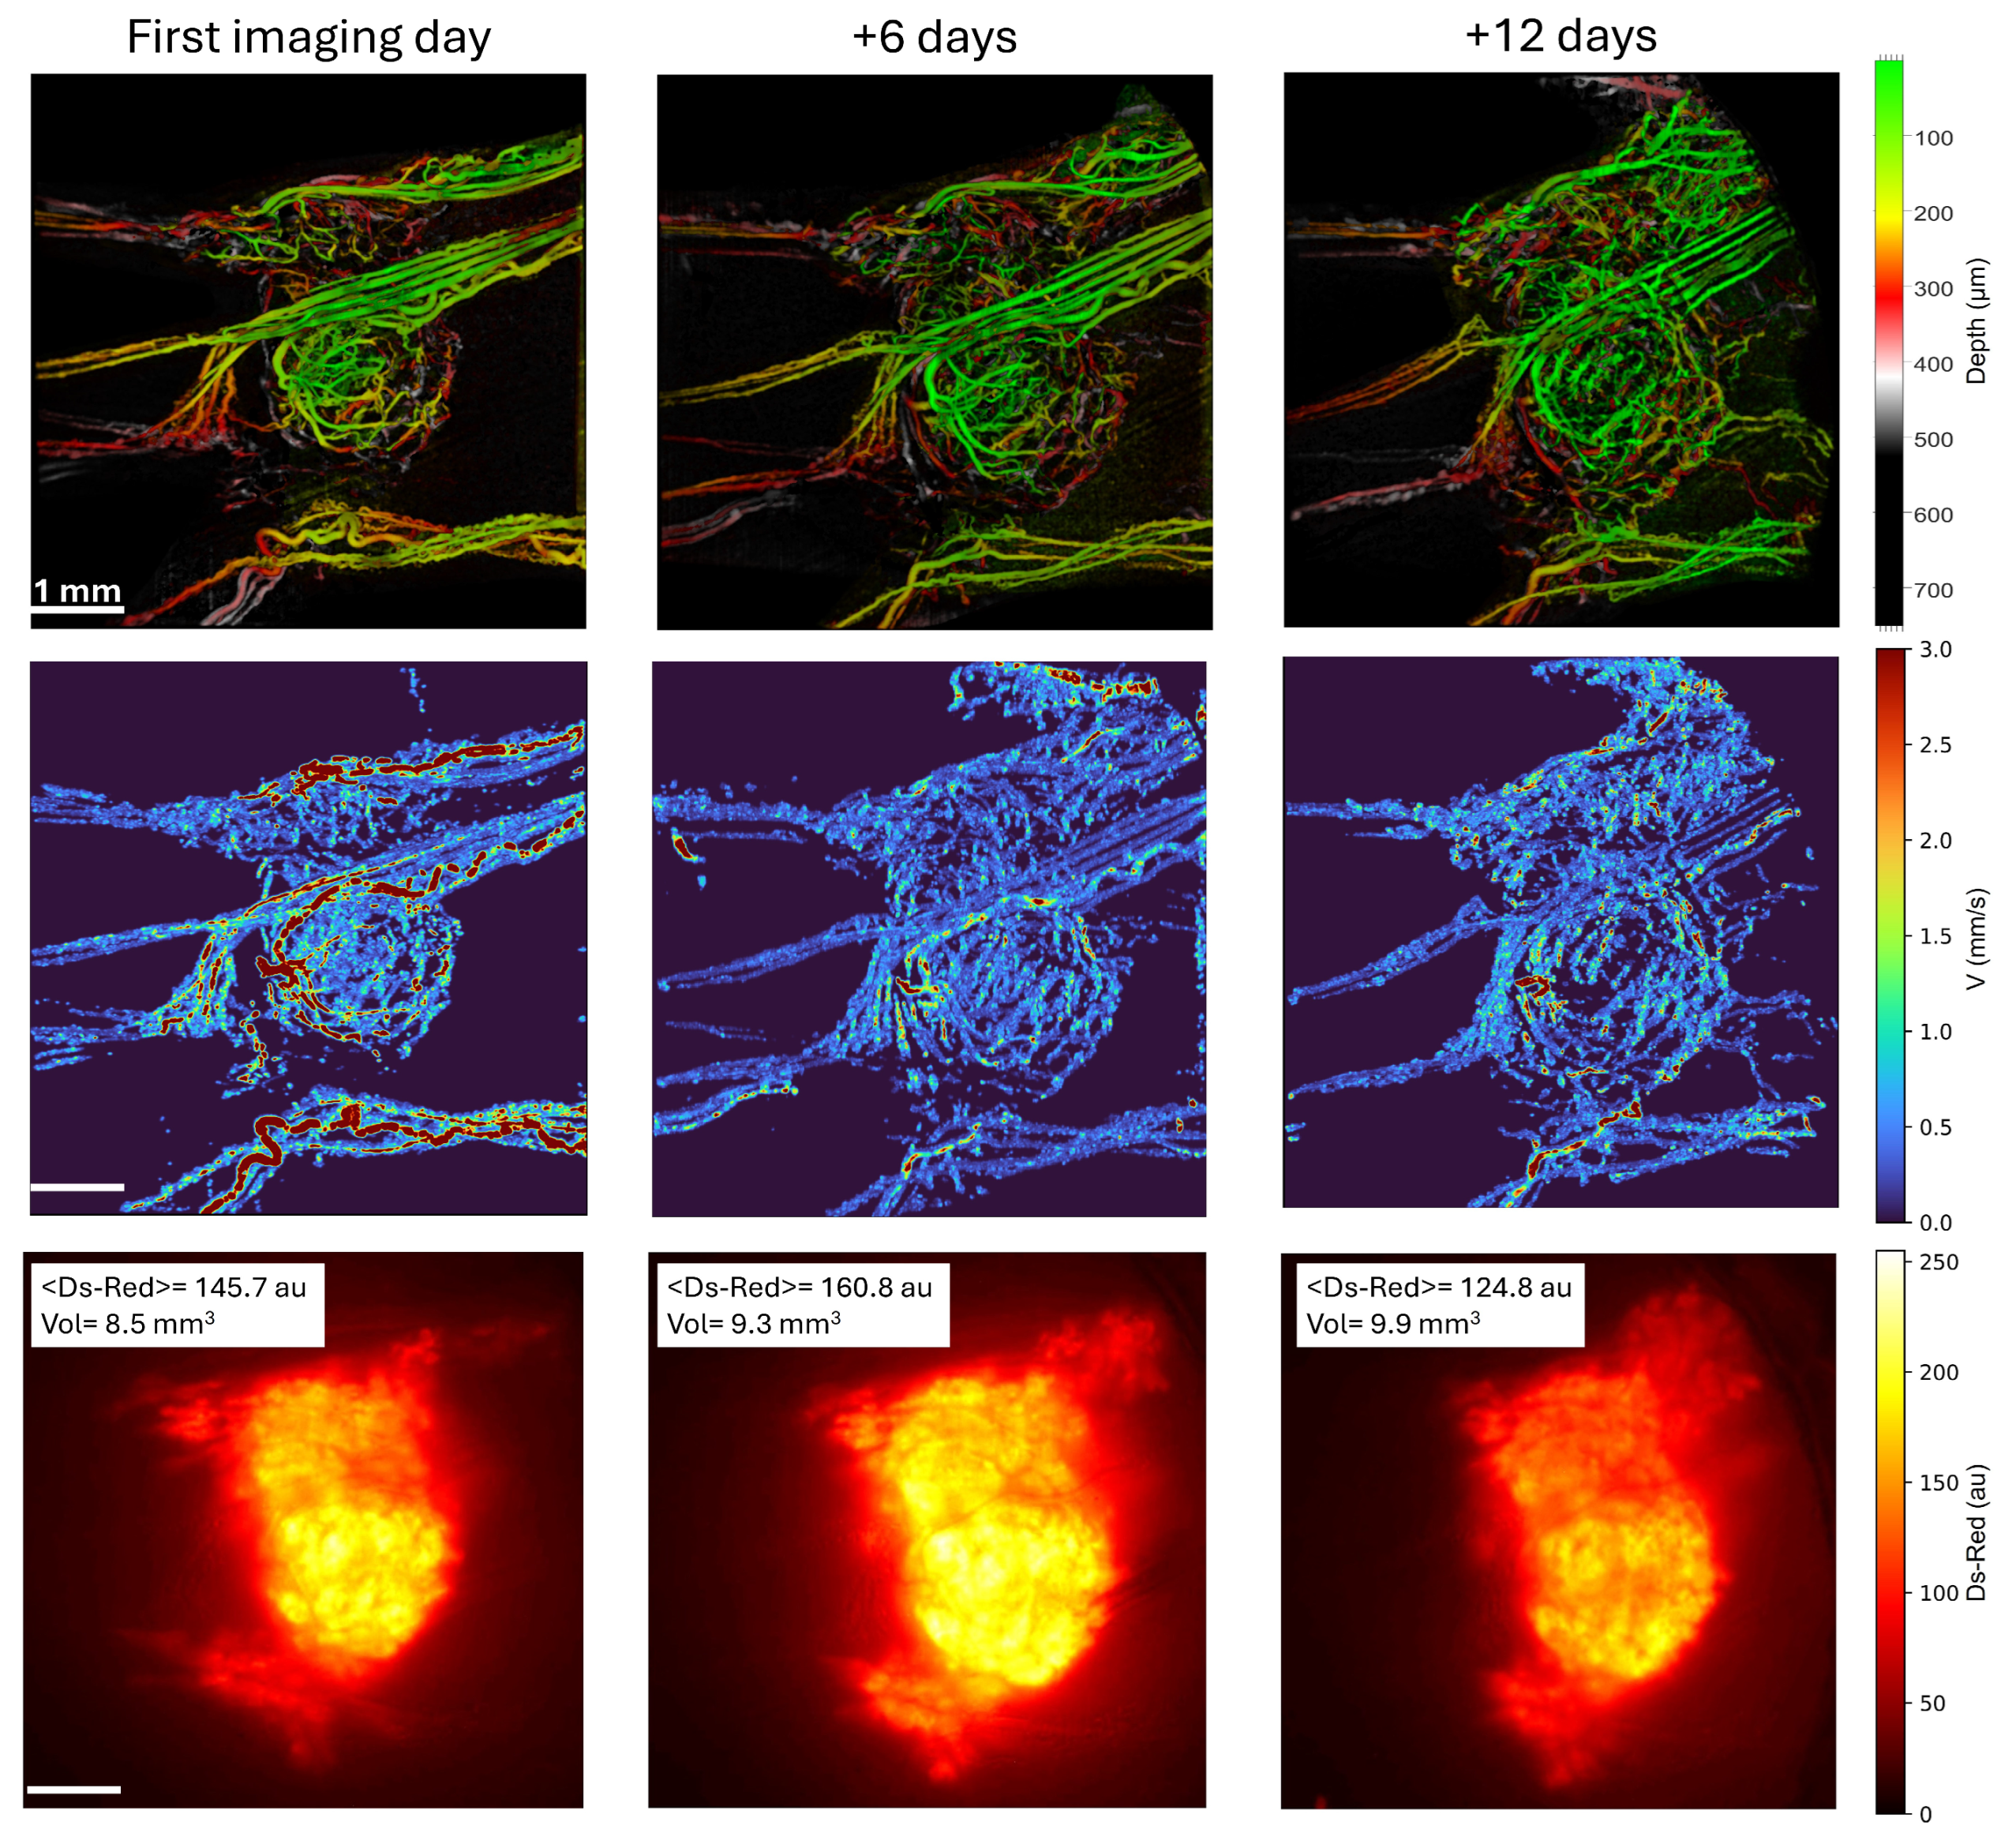
The microcirculation in solid tumours is a dynamic entity. The creation of new vessels, remodelling of existing ones, and continuous tumour growth modifies the micro-architecture and flow resistance of the whole vascular network. Longitudinal snapshots of the tumour microcirculation taken at three distinct time points (first imaging day, six and twelve days later) are shown for an example tumour in Figure 6. While the microstructural svOCT images reveal the complex and chaotic system of vessels (top row), the integration of blood flow with vessel morphology (middle row) suggests that tumour microcirculation cannot be exclusively assessed by its vascular architecture. The bottom row displays the corresponding Ds-Red fluorescence intensity image, a useful means of examining tumour cell density and viability that might be directly influenced by the functional status of the flowing microvasculature. All three quantities visualized in this plot—vessel density and architecture, blood flow velocity, and cell viability—evolve over the twelve days over which images were acquired. For the tumour shown in this figure, angiogenesis is evident as small vessels branch out from existing larger vessels towards the tumour. In tandem, the flow velocity in these larger vessels decreases. Fluorescence peaks at 6 days before decreasing substantially by day 12. A closer quantitative investigation is likely needed to understand the kinetics of tumour growth and vascular development.

3.4. Combining Microvascular Architecture and Functionality Analysis

The preliminary inspection of microvascular architecture and hemodynamics in the previous sections suggests their combination for further exploring the temporal evolution of the tumour microvasculature and its relationship with tumour growth. Many metrics on both fronts are possible, but, as noted in the introduction, vessel diameter and blood flow velocity will be examined here as an initial approach to provide a measure of the efficiency with which vasculature supplies blood [1,2,3,4,36,37]. Example results are shown in Figure 7 for representative normal and tumour tissues at three different time points.
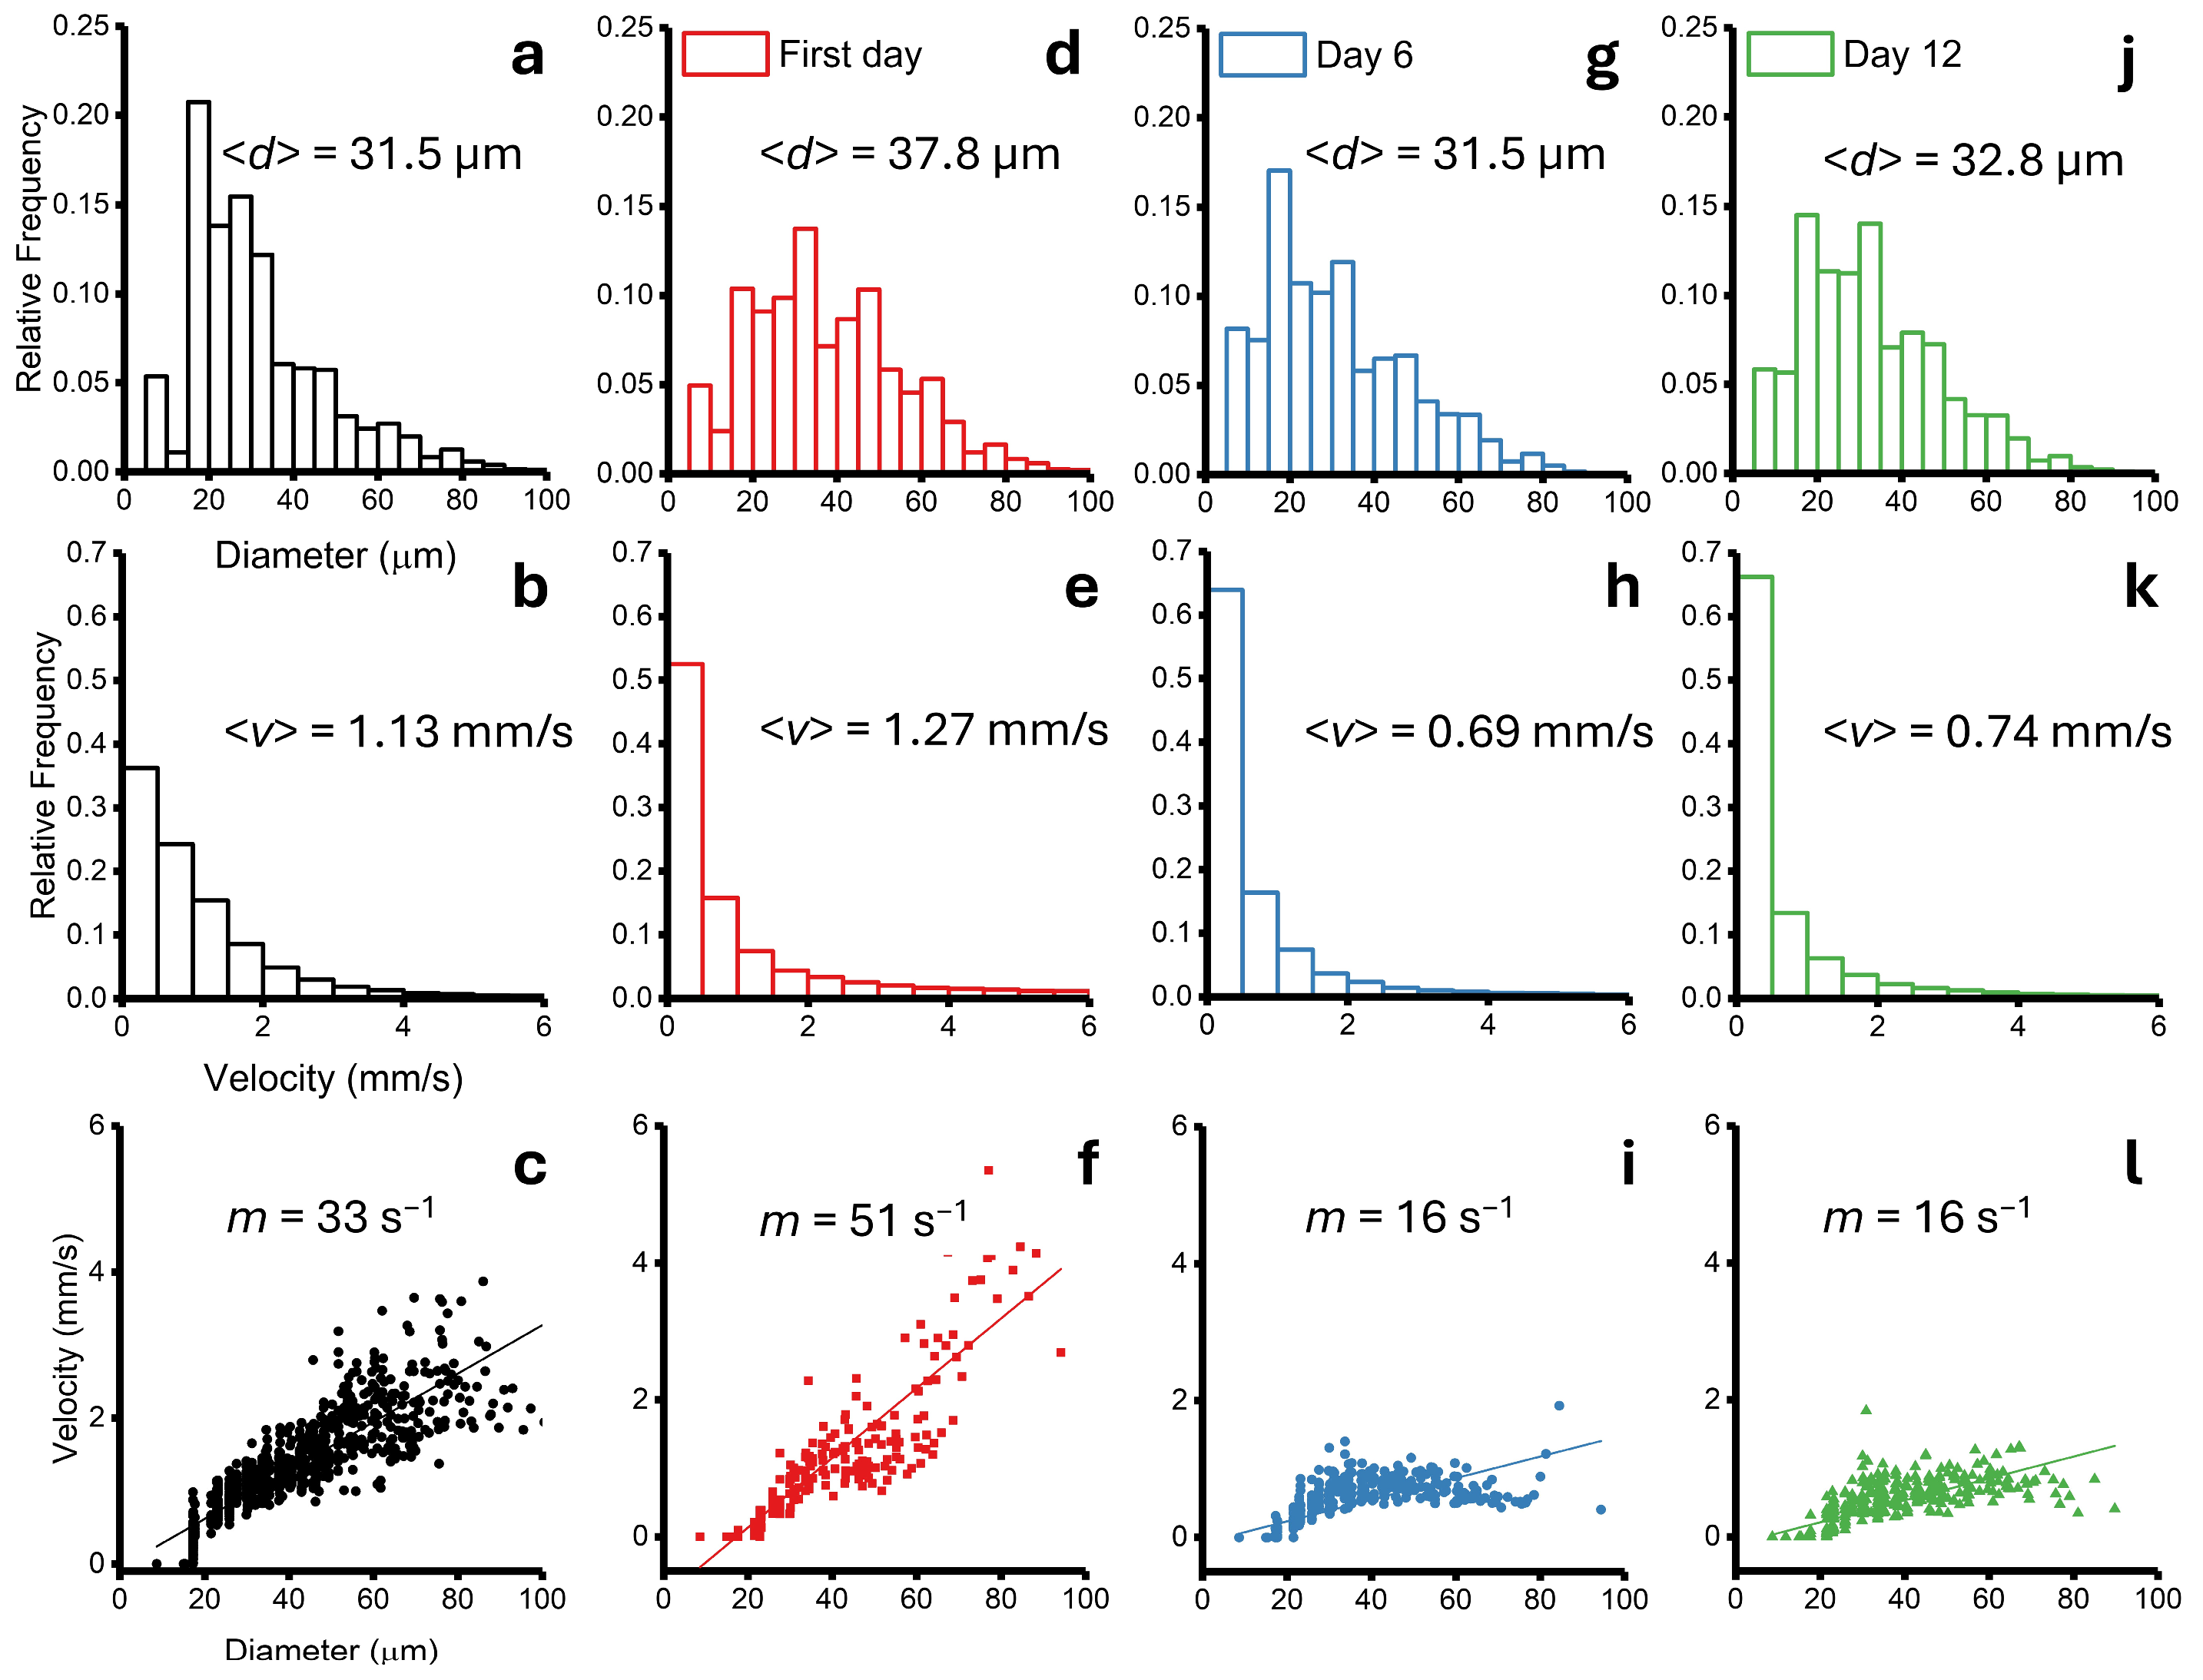
The left-most column (panels (a–c)) in Figure 7 shows the resultant distribution of vessel diameter (top row), blood velocity (middle row), and the combined diameter–velocity relationship (bottom row) in healthy mouse skin. Both histograms are strongly positively skewed and decrease with increasing diameter/velocity, although it is noteworthy that the diameter distribution also peaks at d~20 μm before monotonically decaying, which might be caused by the resolution limit (~15 μm) of the OCT system. The mean values are <d> = 31.81 ± 0.1 µm and <v> = 1.13 ± 0.01 mm/s (±SEM). In the combined diameter–velocity assessment, a positive correlation was observed; the linear regression analysis yielded a slope of mH = 33 ± 1 s−1, with a strong correlation coefficient value of R2 = 0.76.
Capillaries are the smallest unit of the microvasculature; they are designed to maximize the surface area for efficient nutrient delivery [1,2]. The greater proportion of smaller size vessels is a result of the branching nature of the vasculature; that is, daughter vessels in a bifurcation are smaller in size compared to the mother vessels. Except for the initial increase of up to ~20 μm, this trend is indeed observed in healthy skin, where a greater fraction of the vascular volume is occupied by small diameter vessels. A similar behaviour is seen in the distribution of velocities (panel (b)). As previously mentioned, this is because flow rates in the smaller vessels are sufficiently low to allow diffusion of materials to the extravascular space [1,4]. This large slow flow peak, however, also comprises the voxels within vessels with values below the OCT noise level, corresponding to ~17% of the entirely analyzed microvascular dataset.
When these two parameters are related to each other, a linear dependence should be expected [36]. The direct incorporation of vessel diameter (svOCT approach) with blood flow velocity (Doppler approach) does reveal this linear trend in healthy tissues (panel (c)). The fact that velocities at the smallest vessel level (i.e., capillaries) appear virtually around zero is probably not biological but rather reveals the detection limits/noise floor of the OCT system. However, the regression line might help predict the range of velocity values for this group of vessels based on the flow properties of the larger ones. In future studies, methods specifically developed for OCT capillary velocimetry [57,58,59] will be explored for improved measurements at this lower diameter and flow speed space.
Somewhat akin to the healthy tissue case, the distributions of tumour vessel diameters also exhibit an analogous decaying trend, with modest changes across the selected time points (panels (d,g,j)). A notable difference in these panels are the slight variations in the relative frequency of small size vessels (~20–30 μm). The mean diameter values for the tumour are 37.8 ± 0.1 µm during the initial imaging session, 31.5 ± 0.1 µm 6 days later, and 32.8 ± 0.1 µm 12 days later. Thus, tumour vessels were initially slightly larger than those in normal skin on the first day of imaging, and comparable 1–2 weeks later. This observation reflects the dynamic nature of tumour angiogenesis. Tumour vessels branch from pre-existing vessels from the host tissue, ultimately forming capillaries, albeit not hierarchically organized. Tumour angiogenesis is driven in part by the individual cell release of angiogenic factors in response to the local micro milieu (e.g., hypoxia and nutrient deprivation) [5]. Thus, on a relative basis, the frequency of small tumour vessels should increase in time. This may manifest more in functional metrics, and indeed, variations in blood flow velocity values are certainly more perceptible here (panels (e,h,k)). The mean velocity values from the three time points are 1.27 ± 0.01 mm/s, 0.69 ± 0.01 mm/s, and 0.74 ± 0.01 mm/s respectively, which corresponds to a +12% increase, −39% decrease, and −34% decrease relative to the normal-tissue baseline levels. These changes underscore the dynamic nature of tumour evolution, as expected for the complex disease development process [5,6,7,8].
The diameter–velocity plots in Figure 7 (panels (f,i,l)) give further insight into the time-varying physiological alterations of the tumour microvascular network. On the first day of imaging, tumour blood flow values are noticeably larger than their normal tissue counterpart (steeper slope). However, a significant decrease in blood flow was observed the following days. The line-of-best-fit slopes are m0 = 51 ± 1 s−1 (R2 = 0.74), m6 = 16 ± 1 s−1 (R2 = 0.57), and m12 = 16 ± 1 s−1 (R2 = 0.59) for the investigated days, respectively. More notably, the larger effects in blood flow velocity appear in the upper range of vessel diameters, meaning that the perfusion properties of the main feeder vessels are primarily affected. Particularly in the last two investigated days, the experimental curves diverge more from the linear relationship as a result of the decrease in velocity coming from large vessels, which is also reflected in the decrease in the correlation coefficient. The diminution of blood velocities in the larger group of tumour vessels could possibly be explained by the increase in the resistance of the vascular network, either due to an increase in the number of capillaries (high-resistance vessels) or partial vessel occlusion (likewise increasing resistance).
Since there is likely a connection between tumour cell viability and blood flow, we compared the latter with the Ds-Red fluorescence signal and volumetric tumour extent (Figure 6, bottom row). The mean fluorescence signal (au) was found to be 145.7 AUs (first day), 160.8 AUs (six days later), and 124.8 AUs (twelve days later). Further, the gross tumour volume determined from the OCT scans was 8.5 mm3, 9.3 mm3, and 9.9 mm3, respectively. Interestingly, there was a decrease in the mean fluorescence intensity, but with a time delay that appears twelve days later rather than six days later, where the largest drop in blood flow was observed. The Ds-Red protein is a widely used reporter due to its high stability (half-life of ~4.6 days [60]), but this half-life time is also within the order of the investigated days. Thus, a delay might appear when exploring dynamic processes. On the other hand, dynamic tumour blood flow patterns can lead to major effects on the tumour microenvironment [61]. Tumour cells easily adapt to harsh microenvironments, and even in the absence of a nutritive blood supply, tumour cells take advantage of alternative, oxygen-free metabolic pathways to satisfy metabolic needs and guarantee their growth and survival [9]; this may explain the continuing tumour volume increase despite the changing hemodynamic conditions. In fact, although counterintuitive, decreasing blood flow might be related to increased metabolic activity [9,10]. These evolving blood flow patterns might have strong consequences in the response to treatment [62], but more studies are required to confirm this.
The presented results for the representative healthy and tumour examples demonstrate the capabilities of OCT to study microcirculation in vivo. Specifically, the slopes and their corresponding goodness-of-fit R2 values quantify the flow effects and thus could possibly be used as robust metrics of vascular functionality. We summarize the results of three healthy mice and three tumours investigated here in Figure 8. Panel (a) shows the scatter plots of the slope in the diameter–velocity plots for the two groups, where only the first imaging session for the tumours was considered for direct comparison to healthy data. The slope metric for the tumour cohort seems higher than the healthy group, but the slight overlap of the distributions implies no statistically significant difference. Indeed, the heterogeneous microcirculatory patterns of this complex disease preclude further conclusions from this limited dataset. A similar comparison at later stages of tumour development might yield a clearer distinction between these two groups, perhaps also using more accurate metrics that better capture the spatio-temporal heterogeneities of the microvascular flow patterns. Panels (b–d) show functional longitudinal metrics for the three examined tumours: the slope of the diameter–velocity plot, tumour volume, and mean Ds-Red fluorescence, respectively. The behaviour of blood flow related to vessel morphology, as captured by the slope m, is tumour dependent; this ‘individuality’ of tumour dynamics is also seen in growth and viability curves (panels (c,d)). These longitudinal plots further highlight the necessity for personalized cancer therapy treatments that consider the individual and evolving features of the tumour microcirculation. But clearly a larger animal cohort to consider the intra- and inter-tumour variability and a deeper analysis of such plots at several time points of tumour growth are likely needed and will be investigated in future studies, in order to appropriately track the growth trajectories of both normal and pathologic microvasculature and its effect on tumour viability and size. Also, further refinements in the current OCT approach are necessary, such as enhancing velocity detection in the slow flow range, distinguishing between arterial and venous vessels, and developing additional vascular and flow metrics to yield biologically relevant properties of the microcirculation. Preclinical studies of tumours exposed to several cancer treatments to investigate the relevance of the vascular network and flow dynamics to therapy response are envisioned.

4. Conclusions

An OCT-based platform to study the dynamics of the tumour microcirculatory system was established by combining two widely used OCT extensions, svOCT and DOCT, for the detection of both microvascular architecture and functionality. Its performance was demonstrated in flow phantoms and an in vivo mouse window chamber model of both normal skin and human tumour xenografts. The incorporation of the imaging and processing tools yields a unique platform for detailed investigations of tumour microvascular biology and cancer therapy. The experimental observation of changing blood flow in the tumour could shed some light on the importance of tumour microvascular circulation in cancer diagnosis and therapeutic response monitoring in a pre-clinical setting.

Author Contributions

Conceptualization, H.A.C.-S., E.T. and A.V.; methodology, H.A.C.-S. and W.J.Z.; software, H.A.C.-S., W.J.Z. and C.F.; validation, H.A.C.-S., E.T. and A.V.; formal analysis, H.A.C.-S.; investigation, H.A.C.-S. and W.J.Z.; resources, H.A.C.-S., W.J.Z., C.F., L.L., E.T. and A.V.; data curation, H.A.C.-S.; writing—original draft preparation, H.A.C.-S.; writing—review and editing, H.A.C.-S., W.J.Z., C.F., L.L., E.T. and A.V.; visualization, H.A.C.-S. and W.J.Z.; supervision, E.T. and A.V.; project administration, A.V.; funding acquisition, H.A.C.-S., W.J.Z., E.T. and A.V. All authors have read and agreed to the published version of this manuscript.

Funding

This research was funded by the Canadian Institutes of Health Research (grant number 202010PJT-451556-MPI-ADHD-40858), the Ontario Graduate Scholarship, and the Strategic Training in Transdisciplinary Radiation Sciences for the 21st Century (STARS21) Program.

Institutional Review Board Statement

The animal study protocol was approved by University Health Network Institutional Animal Care and Use Committee in Toronto, Canada (AUP #3256).

Informed Consent Statement

Not applicable.

Data Availability Statement

The data presented in this study are available upon request from the corresponding author. The data are not publicly available due to privacy.

Acknowledgments

The authors thank Mohsin Qureshi (University Health Network, Toronto) for his valuable help and training with using the OCT system. Thanks also to Linda Mao, Shoude Chang, Sherif Sherif, and Erroll Murdock from the National Research Council of Canada (Ottawa) for contributing to the development of the OCT system.

Conflicts of Interest

The authors declare no conflicts of interest.

References

  1. Munoz, C.J.; Lucas, A.; Williams, A.T.; Cabrales, P. A Review on Microvascular Hemodynamics: The Control of Blood Flow distribution, and Tissue Oxygenation. Crit. Care Clin. 2020, 36, 293–305. [Google Scholar] [CrossRef] [PubMed]
  2. West, G.B.; Brown, J.H.; Enquist, B.J. A general model for the origin of allometric scaling laws in biology. Science 1997, 276, 122–126. [Google Scholar] [CrossRef] [PubMed]
  3. Secomb, T.W. Blood flow in the microcirculation. Annu. Rev. Fluid. Mechanics. 2017, 49, 443–461. [Google Scholar] [CrossRef]
  4. Pries, A.R.; Secomb, T.W.; Gaehtgens, P. Biophysical aspects of blood flow in microvasculature. Cardiovascular. Res. 1996, 32, 654–667. [Google Scholar] [CrossRef]
  5. Forster, J.C.; Harriss-Phillips, W.M.; Douglass, M.J.J.; Bezak, E. A review of the development of tumor vasculature and its effects on the tumor microenvironment. Hypoxia 2017, 5, 21–32. [Google Scholar] [CrossRef]
  6. Fukumura, D.; Duda, D.G.; Munn, L.L.; Jain, R.K. Tumor microvasculature and microenvironment: Novel insights through intravital imaging in pre-clinical models. Microcirculation 2010, 17, 206–225. [Google Scholar] [CrossRef]
  7. Nagy, J.A.; Chang, S.-H.; Dvorak, A.M.; Dvorak, H.F. Why are tumor blood vessels abnormal and why is it important to know? Br. J. Cancer 2009, 100, 865–869. [Google Scholar] [CrossRef]
  8. Horsman, M.R.; Vaupel, P. Pathophysiological basis for the formation of the tumor microenvironment. Front. Oncol. 2016, 6, 66. [Google Scholar] [CrossRef]
  9. Komar, G.; Kauhanen, S.; Liukko, K.; Seppanen, M.; Kajander, S.; Ovaska, J.; Nuutila, P.; Minn, H. Decreased blood flow with increased metabolic activity: A novel sign of pancreatic tumor aggressiveness. Clin. Cancer Res. 2009, 15, 5511–5517. [Google Scholar] [CrossRef]
  10. Mankoff, D.A.; Dunnwald, L.K.; Partridge, S.C.; Specht, J.M. Blood flow-metabolism mismatch: Good for the tumor, bad for the patient. Clin. Cancer Res. 2009, 15, 5294–5296. [Google Scholar] [CrossRef]
  11. Vaupel, P.; Kallinowski, F.; Okunieff, P. Blood flow, oxygen and nutrient supply, and metabolic microenvironment of human tumors: A review. Cancer Res. 1989, 49, 6449–6465. [Google Scholar] [PubMed]
  12. Primeau, A.J.; Rendon, A.; Hedley, D.; Lilge, L.; Tannock, I.F. The distribution of the anticancer drug doxorubicin in relation to blood vessels in solid tumors. Clin. Cancer Res. 2005, 11, 8782–8788. [Google Scholar] [CrossRef] [PubMed]
  13. Rockwell, S.; Dobrucki, I.T.; Kim, E.Y.; Marrison, S.T.; Vu, V.T. Hypoxia and radiation therapy: Past history, ongoing research, and future promise. Curr. Mol. Med. 2009, 9, 442–458. [Google Scholar] [CrossRef]
  14. Daly, S.M.; Leahy, M.J. ‘Go with the flow’: A review of methods and advancements in blood flow imaging. J. Biophotonics 2013, 6, 217–255. [Google Scholar] [CrossRef]
  15. Huang, D.; Swanson, E.A.; Lin, C.P.; Schuman, J.S.; Stinson, W.G.; Chang, W.; Hee, M.R.; Flotte, T.; Gregory, K.; Puliafito, C.A.; et al. Optical coherence tomography. Science 1991, 254, 1178–1181. [Google Scholar] [CrossRef] [PubMed]
  16. Allam, N.; Zabel, W.J.; Demidov, V.; Jones, B.; Flueraru, C.; Taylor, E.; Vitkin, I.A. Longitudinal in-vivo quantification of tumour microvascular heterogeneity by optical coherence angiography in pre-clinical radiation therapy. Sci. Rep. 2022, 12, 6140. [Google Scholar] [CrossRef]
  17. Demidov, V.; Maeda, A.; Sugita, M.; Madge, V.; Sadanand, S.; Flueraru, C.; Vitkin, I.A. Preclinical longitudinal imaging of tumor microvascular radiobiological response with functional optical coherence tomography. Sci. Rep. 2018, 8, 38. [Google Scholar] [CrossRef]
  18. Kim, H.; Eom, T.J.; Kim, J.G. Vascular Morphometric Changes during Tumor Growth and Chemotherapy in a Murine Mammary Tumor Model Using OCT Angiography: A Preliminary Study. Curr. Opt. Photonics 2019, 3, 54–65. [Google Scholar]
  19. Skala, M.C.; Fontanella, A.N.; Lan, L.; Izatt, J.A.; Dewhirst, M.W. Longitudinal optical imaging of tumor metabolism and hemodynamics. J. Biomed. Opt. 2010, 15, 011112. [Google Scholar] [CrossRef]
  20. Lian, C.-P.; Nakajima, T.; Watanabe, R.; Sato, K.; Choyke, P.L.; Chen, Y.; Kobayashi, H. Real-time monitoring of hemodynamic changes in tumor vessels during photoimmunotherapy using optical coherence tomography. J. Biomed. Opt. 2014, 19, 098004. [Google Scholar]
  21. Chen, C.-L.; Wang, R.K. Optical coherence tomography based angiography. Biomed. Opt. Express 2017, 8, 1056–1082. [Google Scholar] [CrossRef] [PubMed]
  22. Kashani, A.H.; Chen, C.-L.; Gahm, J.K.; Zheng, F.; Richter, G.M.; Rosenfeld, P.J.; Shi, Y.; Wang, R.K. Optical coherence tomography angiography: A comprehensive review of current methods and clinical applications. Prog. Retin. Eye. Res. 2017, 60, 66–100. [Google Scholar] [CrossRef] [PubMed]
  23. Mariampillai, A.; Standish, B.A.; Moriyama, E.H.; Khurana, M.; Munce, N.R.; Leung, M.K.K.; Jiang, J.; Cable, A.; Wilson, B.C.; Vitkin, I.A.; et al. Speckle variance detection of microvasculature using swept-source optical coherence tomography. Opt. Lett. 2008, 33, 1530–1532. [Google Scholar] [CrossRef]
  24. Mariampillai, A.; Leung, M.K.K.; Jarvi, M.; Standish, B.A.; Lee, K.; Wilson, B.C.; Vitkin, A.; Yang, V.X.D. Optimized speckle variance OCT imaging of microvasculature. Opt. Lett. 2010, 35, 1257–1259. [Google Scholar] [CrossRef]
  25. Leitgeb, R.A.; Werkmeister, R.M.; Blatter, C.; Schmetterer, L. Doppler optical coherence tomography. Prog. Retin. Eye. Res. 2014, 41, 26–43. [Google Scholar] [CrossRef]
  26. Liu, G.; Chen, Z. Advances in Doppler OCT. Chin. Opt. Lett. 2013, 11, 011702. [Google Scholar]
  27. Liu, G.; Lin, A.J.; Tromberg, B.J.; Chen, Z. A comparison of Doppler optical coherence tomography methods. Biomed. Opt. Express 2012, 3, 2669–2680. [Google Scholar] [CrossRef]
  28. Singh, A.S.G.; Kolbitsch, C.; Schmoll, T.; Leitgeb, R.A. Stable absolute flow estimation with Doppler OCT based on virtual circumpapillary scans. Biomed. Opt. Express 2010, 1, 1047–1058. [Google Scholar] [CrossRef] [PubMed]
  29. Michaely, R.; Bachmann, A.H.; Villiger, M.L.; Blatter, C.; Lasser, T.; Leitgeb, R.A. Vectorial reconstruction of retinal blood flow in three dimension measured with high resolution resonant Doppler Fourier domain optical coherence tomography. J. Biomed. Opt. 2007, 12, 041213. [Google Scholar] [CrossRef]
  30. You, J.; Du, C.; Volkow, N.D.; Pan, Y. Optical coherence Doppler tomography for quantitative cerebral blood flow imaging. Biomed. Opt. Express 2014, 5, 3217–3230. [Google Scholar] [CrossRef]
  31. Qi, L.; Zhu, J.; Hancock, A.M.; Dai, C.; Zhang, X.; Frostig, R.D.; Chen, Z. Fully distributed absolute blood flow velocity measurement for middle cerebral arteries using Doppler optical coherence tomography. Biomed. Opt. Express 2016, 7, 601–615. [Google Scholar] [CrossRef] [PubMed]
  32. You, J.; Li, A.; Du, C.; Pan, Y. Volumetric Doppler angle correction for ultrahigh-resolution optical coherence Doppler tomography. Appl. Phys. Lett. 2017, 110, 011102. [Google Scholar] [CrossRef] [PubMed]
  33. Trasischker, W.; Werkmeister, R.M.; Zotter, S.; Baumann, B.; Torzicky, T.; Pircher, M.; Hitzenberger, C.K. In vitro and in vivo three-dimensional velocity vector measurement by three-beam spectral-domain Doppler optical coherence tomography. J. Biomed. Opt. 2013, 18, 116010. [Google Scholar] [CrossRef]
  34. Wartak, A.; Haindl, R.; Trasischker, W.; Baumann, B.; Pircher, M.; Hitzenberger, C.K. Active-passive path-length encoded (apple) Doppler OCT. Biomed. Opt. Express 2016, 7, 5233–5251. [Google Scholar] [CrossRef]
  35. Huang, S.; Shen, M.; Zhu, D.; Chen, Q.; Shi, C.; Chen, Z.; Lu, F. In vivo imaging of retinal hemodynamics with OCT angiography and Doppler OCT. Biomed. Opt. Express 2016, 7, 663–673. [Google Scholar] [CrossRef] [PubMed]
  36. Skinner, H.B. Velocity-diameter relationships of the microcirculation. Med. Inform. 1979, 4, 243–256. [Google Scholar] [CrossRef]
  37. Fukumura, D.; Yuan, F.; Monsky, W.L.; Chen, Y.; Jain, R.K. Effects of host microenvironment on the microcirculation of human colon adenocarcinoma. Am. J. Pathol. 1997, 151, 679–688. [Google Scholar]
  38. Hartley, C.J.; Reddy, A.K.; Madala, S.; Entman, M.L.; Michael, L.H.; Taffet, G.E. Doppler velocity measurements from large and small arteries of mice. Am. J. Physiol. Heart. Circ. Physiol. 2011, 301, 269–278. [Google Scholar] [CrossRef]
  39. Kamoun, W.S.; Chae, S.-S.; Lacorre, D.A.; Tyrrell, J.A.; Mitre, M.; Gillissen, M.A.; Fukumura, D.; Jain, R.K.; Munn, L.L. Simultaneous measurement of RBC velocity, flux, hematocrit and shear rate in vascular networks. Nat. Methods 2010, 7, 655–660. [Google Scholar] [CrossRef]
  40. Zabel, W.J.; Allam, N.; Contreras Sanchez, H.A.; Foltz, W.; Flueraru, C.; Taylor, E.; Vitkin, A. A Dorsal Skinfold Window Chamber Tumor Mouse Model for Combined Intravital Microscopy and Magnetic Resonance Imaging in Translational Cancer Research. J. Vis. Exp. 2024, 206, e66383. [Google Scholar] [CrossRef]
  41. Constantinides, C.; Mean, R.; Janssen, B.J. Effects of Isoflurane Anesthesia on the Cardiovascular Function of the C57BL/6 Mouse. ILAR J. 2011, 52, e21–e31. [Google Scholar] [PubMed]
  42. Mao, Y.; Sherif, S.; Flueraru, C.; Chang, S. 3x3 Mach-Zehnder interferometer with unbalance differential detection for full-range swept-source optical coherence tomography. Appl. Opt. 2008, 47, 2004–2010. [Google Scholar] [CrossRef]
  43. Mao, Y.; Flueraru, C.; Chang, S.; Popescu, D.P.; Sowa, M.G. High-quality tissue imaging using a catheter-based swept source optical coherence tomography systems with an integrated semiconductor optical amplifier. IEEE Trans. Instrum. Meas. 2011, 60, 3376–3383. [Google Scholar]
  44. Liu, B. Doppler Optical Coherence Tomography. In Optical Coherence Tomography: Principles and Applications; Brezinski, M., Ed.; Academic Press: Burlington, MA, USA, 2006; pp. 278–300. [Google Scholar]
  45. Tang, J.; Erdener, S.E.; Fu, B.; Boas, D.A. Capillary red blood cell velocimetry by phase resolved optical coherence tomography. Opt. Lett. 2017, 42, 3976–3979. [Google Scholar] [CrossRef] [PubMed]
  46. Dong, M.L.; Goyal, K.G.; Worth, B.W.; Makkar, S.S.; Calhoun, W.R.; Bali, L.M.; Bali, S. Accurate in situ measurement of complex refractive index and particle size in intralipid emulsions. J. Biomed. Opt. 2013, 18, 087003. [Google Scholar] [CrossRef]
  47. Gosh, N.; Buddhiwant, P.; Uppal, A.; Majumder, S.K.; Patel, H.S.; Gupta, P.K. Simultaneous determination of size and refractive index of red blood by light scattering measurements. Appl. Phys. Lett. 2006, 88, 084101. [Google Scholar] [CrossRef]
  48. Casper, M.; Schulz-Hildebrandt, H.; Evers, M.; Birngruber, R.; Manstein, D.; Huttmann, G. Optimization-based vessel segmentation pipeline for robust quantification of capillary networks in skin with optical coherence tomography angiography. J. Biomed. Opt. 2019, 24, 046005. [Google Scholar] [CrossRef]
  49. Frangi, A.F.; Niessen, W.J.; Vincken, K.L.; Viergever, M.A. Multiscale vessel enhancement filtering. MICCAI’98. 1998, 1, 130–137. [Google Scholar]
  50. Farrance, I.; Frenkel, R. Uncertainty of Measurement: A Review of the Rules for Calculating Uncertainty Components through Functional Relationships. Clin. Biochem. Rev. 2012, 33, 49–75. [Google Scholar]
  51. Yang, V.X.D.; Gordon, M.L.; Qi, B.; Pekar, J.; Lo, S.; Seng-Yue, E.; Mok, A.; Wilson, B.C.; Vitkin, I.A. High speed, wide velocity dynamic range Doppler optical coherence tomography (part I): System design, signal processing, and performance. Opt. Express 2003, 11, 794–809. [Google Scholar] [CrossRef]
  52. Song, S.; Xu, J.; Men, S.; Shen, T.T.; Wang, R.K. Robust numerical phase stabilization for long-range swept-source optical coherence tomography. J. Biophotonics 2017, 10, 1398–1410. [Google Scholar] [CrossRef] [PubMed]
  53. Chen, W.; You, J.; Gu, X.; Du, C.; Pan, Y. High-speed swept source optical Doppler tomography for deep brain microvascular imaging. Sci. Rep. 2016, 6, 38786. [Google Scholar] [CrossRef]
  54. Chiu, C.-L.; Clack, N.; The Napari Community. Napari: A python multi-dimensional image viewer platform for the research community. Microsc. Microanal. 2022, 28, 1576–1577. [Google Scholar] [CrossRef]
  55. Werkmeister, R.M.; Dragostinoff, N.; Palkovits, S.; Told, R.; Boltz, A.; Leitgeb, R.A.; Groschl, M.; Garhofer, G.; Schmetterer, L. Measurement of absolute blood flow velocity and blood flow in the human retina by dual-beam bidirectional Doppler Fourier-domain optical coherence tomography. Investig. Ophthalmol. Vis. Sci. 2012, 53, 6062–6071. [Google Scholar] [CrossRef]
  56. Everds, N. Hematology of the Mouse. In The Laboratory Mouse; Hedrich, H.J., Bullock, G., Eds.; Academic Press: San Diego, CA, USA, 2004; pp. 271–286. [Google Scholar]
  57. Srinivasan, V.J.; Radhakrishnan, H.; Lo, E.H.; Mandeville, E.T.; Jiang, J.Y.; Barry, S.; Cable, A.E. OCT methods for capillary velocimetry. Biomed. Opt. Express 2012, 3, 612–629. [Google Scholar] [CrossRef] [PubMed]
  58. Lee, J.; Wu, W.; Lesage, F.; Boas, D.A. Multiple-capillary measurement of RBC speed, flux, and density with optical coherence tomography. J. Cereb. Blood. Flow. Metab. 2013, 33, 1707–1710. [Google Scholar] [CrossRef]
  59. Choi, W.J.; Li, Y.; Qin, W.; Wang, R.K. Cerebral capillary velocimetry based on temporal OCT speckle contrast. Biomed. Opt. Express 2016, 7, 4859–4873. [Google Scholar] [CrossRef]
  60. Verkhusha, V.V.; Kuznetsova, I.M.; Stepaneko, O.V.; Zaraisky, A.G.; Shavlovsky, M.M.; Turoverov, K.K.; Uversky, V.N. High Stability of Discosoma DsRed As Compared to Aequorea EGFP. Biochemistry 2003, 42, 7879–7884. [Google Scholar] [CrossRef]
  61. Gillies, R.J.; Brown, J.S.; Anderson, A.R.A.; Gatenby, R.A. Eco-evolutionary causes and consequences of temporal changes in intratumoural blood flow. Nat. Rev. Cancer 2018, 18, 576–585. [Google Scholar] [CrossRef]
  62. Chaplin, D.J.; Olive, P.L.; Durand, R.E. Intermittent Blood Flow in a Murine Tumor: Radiobiological Effects. Cancer Res. 1987, 47, 597–601. [Google Scholar]
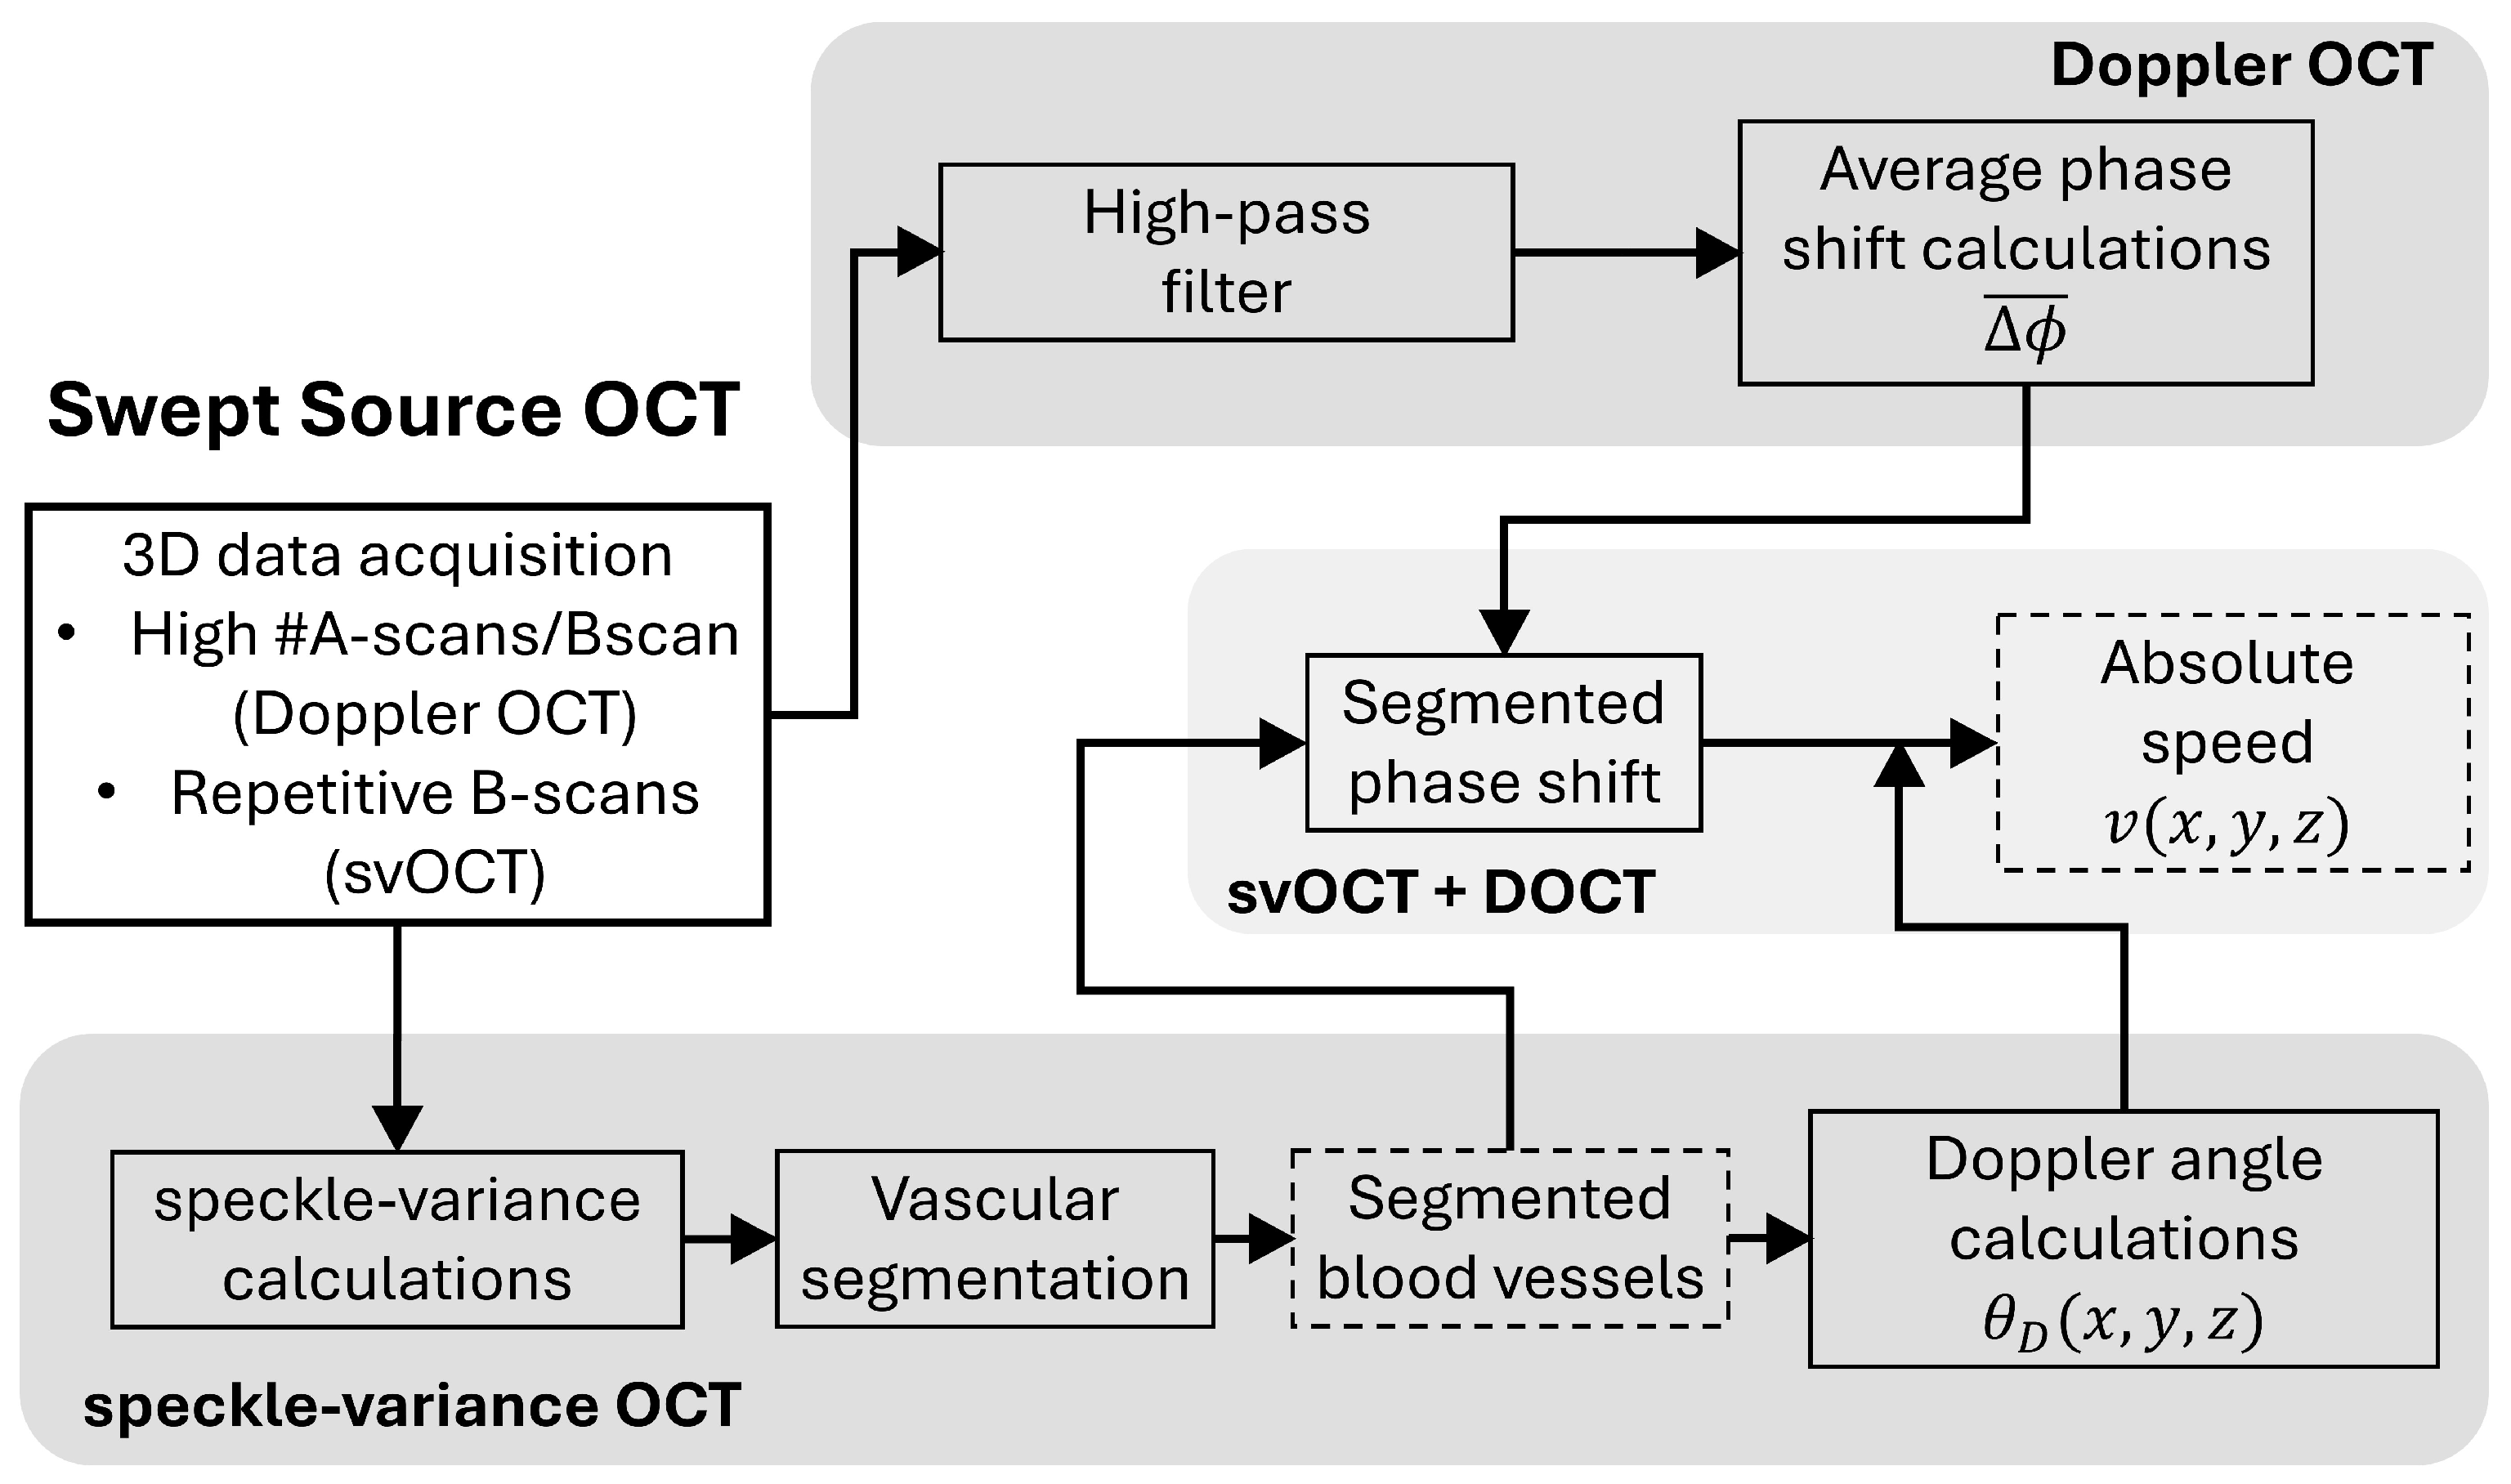
Figure 1. Processing diagram for microvascular and blood flow imaging using OCT. Sub-processing sections are grouped according to the OCT extension being used. The input box indicates the OCT scanning conditions required for each extension, and the dashed rectangles represent two main outputs from the processing diagram: the segmented microvascular network from svOCT and the Doppler-angle-corrected blood flow map obtained by combining svOCT and DOCT.
Photonics 11 00891 g001
Figure 2. Quantification of the microcirculatory system using OCT. (a) Schematic of the microvascular network. (b) Processing steps for quantification of velocity profiles and flow rates at a branching point. A branching point from the microvascular dataset is selected (dashed square in (a)), and representative velocity profiles across vessel as detected on cross-sectional OCT B-scans are generated. The velocity values are integrated across the vessel area to determine flow rate. This step is repeated across multiple B-scans for improved results’ robustness and for statistical analysis. (c) Calculation of vascular metrics from the microvascular dataset. Using the location of the centreline (dashed line), the distance to the vessel boundary is computed to measure diameter (d), and centre-flow velocity (v) is determined at that location. The two resultant distributions allow for plotting of their respective histograms and combined diameter-velocity plots.
Photonics 11 00891 g002
Figure 3. Phantom experiment results. (a) Logarithmic structural cross-sectional image of the phantom. Coloured dashed squares indicate the different components in the phantom. (b) Summary of velocity estimations at different flow rates. One representative image of the phantom (dashed rectangle region in (a) is displayed for all evaluated flow rates, organized in columns and in descending order. A colour bar is included for every column (note different ranges for the three colour bars). (c) Comparison of the experimental flow rates with the set flow rates. The 45° line of identity is also shown. (d) Phase noise histogram for a static region in the phantom. Noise is normally distributed, and the standard deviation (13.7 mrads in this example) usually determines the phase sensitivity of the system. (e) 3D segmented flow tube using svOCT and DOCT with a flow rate of 30 µL/min. This 3D volume contains structural information (length, diameter, orientation, etc.) along with the velocity information for every voxel. All static elements of the phantom were successfully removed by svOCT.
Photonics 11 00891 g003
Figure 4. Visualization of microvascular hemodynamics in normal murine skin using OCT. (a) brightfield image of the window chamber with the analyzed healthy skin tissue. (b) Depth encoded svOCT intensity projection. Vessels closer to the glass surface appear green, transitioning to red to grey with increasing depth. (c) Maximum intensity projection (MIP) of the combined svOCT and DOCT velocity map, which maintains the structural vessel information and supplements it with the velocity information. (d) Close-up of velocity profiles of the vessels in the branching points before (left) and after (right) the bifurcation. The inset images (I and II) correspond to the regions of interest delineated in (b)) (top and bottom). Labels in the bifurcation and velocity profiles indicate the mother (1) and daughter vessels (2 and 3). The lines in the velocity profiles are a guide for the eye.
Photonics 11 00891 g004
Figure 5. Visualization of the microcirculatory system in a human xenograft pancreatic tumour model using OCT. (a) Brightfield and (b) depth-encoded svOCT intensity projection and (c) MIP of the svOCT and blood velocity map for the tumour tissue. (d) Velocity profiles for the two branching points (I and II) delineated in (b) before (left) and after (right) the bifurcation. Labels in the bifurcation and velocity profiles indicate the mother (1) and daughter vessels (2 and 3). The lines in the velocity profiles are a guide for the eye.
Photonics 11 00891 g005
Figure 6. Temporal evolution of the tumour microcirculatory system. OCT-determined and epifluorescence images of one representative tumour across three different time points indicated at the top of each column. Depth-encoded structural microvascular images (top row) illustrate the detailed architecture of the microvasculature at different days of tumour growth. Combined svOCT and Doppler blood flow images (middle row) illustrate the hemodynamic properties of the tumour microvascular network. Ds-Red fluorescence images (bottom row) show the local fluorescence expression of the Ds-Red protein in the tumour. Quantitative measurements of mean fluorescence signal and tumour volume are tabulated in the bottom row. Colour bars are included for each row, indicating the scales for depth, velocity, and fluorescence.
Photonics 11 00891 g006
Figure 7. Quantitative analysis of healthy and tumour microcirculation. The distribution of diameters (top), velocities (middle), and diameter–velocity (bottom) plots are shown for healthy skin and one tumour across the evaluated time points. Healthy skin data are represented in black colour (ac), and tumour data are shown in various colours corresponding to the investigated days (dl). Mean values are included for all histograms; lines-of-best-fit and slope values of the linear regression are also shown in the diameter–velocity plots.
Photonics 11 00891 g007
Figure 8. Summary of the diameter–velocity assessment for healthy and tumour tissue using OCT. (a) Scatter plot of the slope values derived from the diameter–velocity plots for the two different groups. The central line represents the mean, and the bars correspond to one SEM. Only the datapoints for the first imaging session are shown. Longitudinal plots for the three investigated tumours of (b) the diameter–velocity slope, (c) volume, and (d) mean fluorescence, showing how these parameters evolve over time. In (bd), lines are a guide for the eye.
Photonics 11 00891 g008
Table 1. Quantification of blood velocities, vessel cross-sectional areas, and flow rates across selected branching points for one representative healthy and tumour mouse (see Figure 3d and Figure 4d). All values reported include one standard deviation.
v ¯ (mm/s) v m a x (mm/s)A (103 µm2) Q = v ¯ A (106 µm3/s)
Branching point I (Healthy)11.7 ± 0.13.2 ± 0.27.7 ± 0.312.9 ± 1.0Q2 + Q3
21.7 ± 0.13.1 ± 0.14.0 ± 0.76.9 ± 1.716.5 ± 5.2
32.1 ± 0.14.0 ± 0.14.5 ± 0.99.6 ± 4.2
Branching point II (Healthy)11.2 ± 0.42.4 ± 0.73.2 ± 0.34.0 ± 1.7Q2 + Q3
20.8 ± 0.21.7 ± 0.41.1 ± 0.20.9 ± 0.44.4 ± 2.1
31.4 ± 0.32.9 ± 0.72.4 ± 0.53.5 ± 2.0
Branching point I (Tumour)12.7 ± 0.35.1 ± 0.32.6 ± 0.27.2 ± 1.4Q2 + Q3
21.9 ± 0.43.4 ± 0.81.2 ± 0.12.4 ± 0.75.7 ± 1.8
32.0 ± 0.24.1 ± 0.41.6 ± 0.33.3 ± 1.4
Branching point II (Tumour)11.4 ± 0.23.2 ± 0.31.4 ± 0.31.9 ± 0.7Q2 + Q3
21.1 ± 0.22.2 ± 0.50.8 ± 0.10.9 ± 0.41.8 ± 0.3
31.1 ± 0.32.1 ± 0.40.8 ± 0.10.9 ± 0.6
Disclaimer/Publisher’s Note: The statements, opinions and data contained in all publications are solely those of the individual author(s) and contributor(s) and not of MDPI and/or the editor(s). MDPI and/or the editor(s) disclaim responsibility for any injury to people or property resulting from any ideas, methods, instructions or products referred to in the content.