Article

Iron-Modified Nano-TiO2: Comprehensive Characterization for Enhanced Photocatalytic Properties

by
Élida M. Margalho
1,2,*,
Orlando Lima, Jr.
1,2,
Cátia Afonso
3,
Iran Rocha Segundo
1,
Salmon Landi, Jr.
4,
Elisabete Freitas
2,
Manuel F. M. Costa
5 and
Joaquim Carneiro
1,*
1
Centre of Physics of Minho and Porto Universities (CF-UM-UP), University of Minho, Av. da Universidade, 4800-058 Guimarães, Portugal
2
ARISE, Department of Civil Engineering (ISISE-UMinho), University of Minho, Av. da Universidade, 4800-058 Guimarães, Portugal
3
Department of Chemistry, University of Aveiro, 3810-193 Aveiro, Portugal
4
Federal Institute Goiano, Rio Verde Campus, Rio Verde 75901-970, GO, Brazil
5
Centre of Physics of Minho and Porto Universities (CF-UM-UP), Gualtar Campus, University of Minho, R. da Universidade, 4710-057 Braga, Portugal
*
Authors to whom correspondence should be addressed.
Photonics 2024, 11(9), 888; https://doi.org/10.3390/photonics11090888
Submission received: 9 August 2024 / Revised: 13 September 2024 / Accepted: 18 September 2024 / Published: 20 September 2024

Abstract

:
This study investigates the effect of iron-modified nano-TiO2, using the co-precipitation method with different concentrations of FeCl3 (0.1, 1, and 10%), to improve its photocatalytic properties for outdoor applications. To this end, modified and unmodified nano-TiO2 were characterized using different techniques. The optical properties were characterized by diffuse reflectance spectroscopy (DRS) followed by band gap calculation. X-ray diffraction (XRD) was used to analyze the crystalline structure. Chemical and morphological characterization were carried out using energy-dispersive X-ray spectroscopy (EDS) and scanning electron microscopy (SEM). The photocatalytic activity was investigated by decolorizing Rhodamine B aqueous solutions under similar sunlight irradiation. The results indicate that the modification improved light absorption in the UV range for all iron concentrations; however, only the concentration of TiO2: FeCl3 (10%) shifted the absorption to the visible region. Also, including Fe3⁺ in TiO2 decreased the band gap energy from 3.14 to up to 2.80 eV. There were variations in crystallite size from 21.13 to up to 40.07 nm. The nano-TiO2 morphology analysis showed that it did not change after iron modification. EDS showed an FeCl3 peak only at higher concentrations (10%). In addition, the 0.1% Fe-modified TiO2 exhibited the highest activity in the photocatalytic process, with an efficiency of 95.23% after 3 h of irradiation.

1. Introduction

Heterogeneous photocatalysis has been widely studied for outdoor applications due to its capability to remove various pollutants and pathogenic microorganisms [1]. In different areas, incorporating photocatalytic materials is promising in addressing sustainability, cost reduction, and safety issues. In civil engineering, for example, the application of semiconductors is being studied on substrates such as facades, road pavements [2], and even road markings [3]. For these substrates, the photocatalytic process can contribute to air-cleaning. It can also reduce the accumulation of dirt on facades, minimizing maintenance costs and enhancing the aesthetics of the surfaces [4]. Similarly, self-cleaning road marking can reduce costs and improve road safety by breaking down oils and greases normally left behind by vehicles [3].
Titanium dioxide nanoparticles (nano-TiO2) are commonly used in heterogeneous photocatalysis to promote the oxidation of organic and inorganic pollutants in the atmosphere or aqueous environments [5]. The oxidation process begins when this semiconductor material absorbs light energy, creating an electron–hole pair that initiates photocatalytic reactions. These reactions can degrade harmful pollutants into less harmful by-products [6]. Previous studies recognize the advantages of using nano-TiO2, such as its high oxidizing capacity, low cost, and stability [7].
However, the pollutant degradation rate is limited to the absorption of the energy fraction corresponding to the ultraviolet (UV) range, which represents only 3–4% of the solar spectrum. This limitation is attributed to the large band gap of nano-TiO2 (Eg > 3.0 eV), covering the wavelength of light below 400 nm [8]. To overcome this issue, the literature highlights the potential of modifying TiO2 with metals such as iron (Fe3⁺), nickel (Ni+2), cobalt (Co+2), and others [9]. Modifying nano-TiO2 creates an intermediate band within the band gap, enabling the absorption of lower-energy photons and enhancing the material’s ability to utilize a broader spectrum of light.
This increases light absorption to higher wavelengths within the visible range (400–700 nm), enhancing the degradation rate of pollutants in outdoor applications since around 48% of sunlight falls within this range. Specifically, Fe3⁺ has a similar ionic radius to Ti4+ and is highly compatible for incorporation into the crystal lattice of TiO2 [10]. Also, the presence of Fe3+ introduces two new energy levels into the band structure of nano-TiO2: the oxidation level (Fe4+/Fe3+) above the valence band and the reduction level (Fe3+/Fe2+) below the conduction band of the pure semiconductor. When the semiconductor is activated, the first step is the formation of Fe+2 by the transfer of photogenerated electrons from nano-TiO2 to Fe3⁺ (Equation (1)). Due to the instability of Fe2⁺ resulting from the loss of the electronic configuration of the 3d5 orbital, it reverts to Fe3⁺ by reaction with molecular oxygen (adsorbed on the surface of nano-TiO2), which leads to the formation of highly reactive superoxide anions (Equation (2)). Similarly, in the Fe3+/Fe4+ level, the Fe3⁺ also acts as a hole trap, resulting in oxidation to Fe4+ (Equation (3)). As a result, the Fe4⁺ ion reacts with a hydroxide ion (OH) on the TiO2 surface, resulting in the reduction from Fe4⁺ to Fe3⁺ and the formation of a hydroxyl radical (OH) (Equation (4)) [11].
Fe3+ + e→Fe2+
Fe2+ + O2(ads)→Fe3+ + O2•−
Fe3+ + h+→Fe4+
Fe4+ + OH→Fe3+ + OH
Although modification with Fe3+ can improve the pollutant rate degradation of TiO2, its photocatalytic efficiency is also influenced by other factors. These include the modification method, the physical properties of the semiconductor, and the amount of iron incorporated into the TiO2 lattice [12].
The literature reports a wide range of optimum iron contents, between 0.05 and 20 at%, which have achieved the best efficiencies [13]. In addition, different methods are employed to modify nano-TiO2, such as sol–gel [14], co-precipitation [15], and hydrothermal methods [16], among others. Ambrus et al. [13] point out that, depending on the modification method, the iron ions can occupy different positions in the nano-TiO2 and influence the optimum amount used. Usually, sol–gel is the primary method chosen due to its efficiency in modifying nano-TiO2 [17]. However, the co-precipitation method is simple, robust, reliable, low-cost, and requires a short time to modify nano-TiO2 [18].
The number of studies published on iron-modified TiO2 by the co-precipitation method for photocatalytic purposes highlights its relevance in the literature. For example, Mahendran, V. and Gogate, P.R. [19] used the ultrasound-assisted co-precipitation method using Titanium (IV) isopropoxide (TTIP) (98%) and ferric nitrate nonahydrate [Fe(NO3)3·9H2O] (98%) to obtain Fe-modified TiO2. The authors compared this approach with the conventional co-precipitation method (without ultrasound). They found that the optimum Fe modification concentration in the Fe-modified doped TiO2 catalyst is 0.4 mol%, which achieves a degradation rate of 48.2% for the Acid Scarlet 3R dye, higher than the 34% degradation observed with the conventional method.
Similarly, Ma, Jinzhu et al. [20] combined Fe(NO3)3·9H2O (≥98%) with Ti(SO4)2 (≥96%) to synthesize the nanoparticles, comparing co-precipitation, homogeneous precipitation, and wet impregnation methods to determine the most effective photocatalyst for NO removal. The results show that the Fe 0.1% T concentration had better photocatalytic activity, achieving 45–60% NO removal and 38% NOx conversion, compared to pure TiO2. The study also identified co-precipitation as the best approach for preparing Fe/TiO2, showing the highest NOx conversion activity.
In the work of Lucas, S.S. et al. [21], co-precipitation was employed to modify a commercial nano-TiO2, which was then incorporated into a mortar substrate to evaluate its efficiency in NOx degradation. The authors primarily focused on the practical application of the iron-modified TiO2 in the substrate and did not provide a detailed characterization of the photocatalyst. This approach appears as the less-explored aspect of applying the co-precipitation method when considering the incorporation of iron into commercial TiO2.
This work aims to comprehensively characterize iron-modified TiO2 obtained by the co-precipitation method using an already synthesized commercial TiO2. The novelty lies in the modification of pre-synthesized TiO2 rather than the incorporation of iron during its initial synthesis, also considering the use of lower amounts of iron, as reported in the literature. Thus, the effects of nano-TiO2 modified on optical, structural, chemical, morphological properties, and photocatalytic activity will be analyzed. To this end, different aqueous solutions of FeCl3 were added to aqueous suspensions of commercial nano-TiO2 concentrations of 0.1, 1, and 10%, and the changes that occurred will be studied. FeCl3 was used as a precursor for iron due to some advantages such as solubility in water [22] and other solvents, compatibility with the co-precipitation method [23,24], low cost, and non-toxicity [25].

2. Materials and Methods

2.1. Materials

The materials used were the following: (i) Nano-TiO2 (Aeroxide TiO2 P25) from Quimidroga (Barcelona, Spain); (ii) Iron chloride (FeCl3) and (iii) Rhodamine B from Merck (Algés, Portugal); and (iv) Distilled water.

2.2. Methods

2.2.1. Modification Process

The co-precipitation method was used to modify nano-TiO2. Firstly, a solution using 1 g of nano-TiO2 and 100 mL of distilled water was prepared. Similarly, aqueous solutions of FeCl3 were also prepared at different concentrations. The amount of FeCl3 was calculated relative to the amount of TiO2, e.g., 0.1% of FeCl3 relative to 1 g of TiO2 corresponds to 0.001 g of FeCl3, dispersed in 100 mL of water. Thus, the three solutions prepared were 0.1% FeCl3, 1% FeCl3, and 10% FeCl3. Secondly, each solution of FeCl3 was mixed with one solution of nano-TiO2 and stirred at 70 °C for 150 min [21]. The mixed solution was then filtrated and washed with distilled water. Washing is important to remove the chlorine and keep only the iron in the modification process. Finally, the mix was dried at 60 ºC to obtain nano-TiO2 modified with Fe3⁺. The prepared TiO2:FeCl3 concentrations was TiO2:FeCl3 (0.1%), TiO2:FeCl3 (1%), and TiO2:FeCl3 (10%).

2.2.2. Diffuse Reflectance Spectroscopy (DRS)

Diffuse reflectance spectroscopy (DRS) was used to characterize the optical properties before and after the modification process of nano-TiO2. DRS was performed using a spectrophotometer (UV-310 PC, Shimadzu, Kyoto, Japan) with an integrating sphere. The reflectance (R) was recorded from 250 to 850 nm. Barium sulphate (BaSO4) was used as a baseline for the reflectance spectra.
From the results obtained for the reflectance (R), the light absorption of the nano-TiO2 was then determined using the Kubelka–Munk function, F(R), defined by Equation (5):
F(R) = [(1 − R)2/2R] = K/S
K and S are the absorption and scattering coefficients of Kubelka–Munk [26]. The incident photon energy (E) is obtained by the relation E = (1239.7/λ), where E is eV (electron volts), and λ is the wavelength in nm.
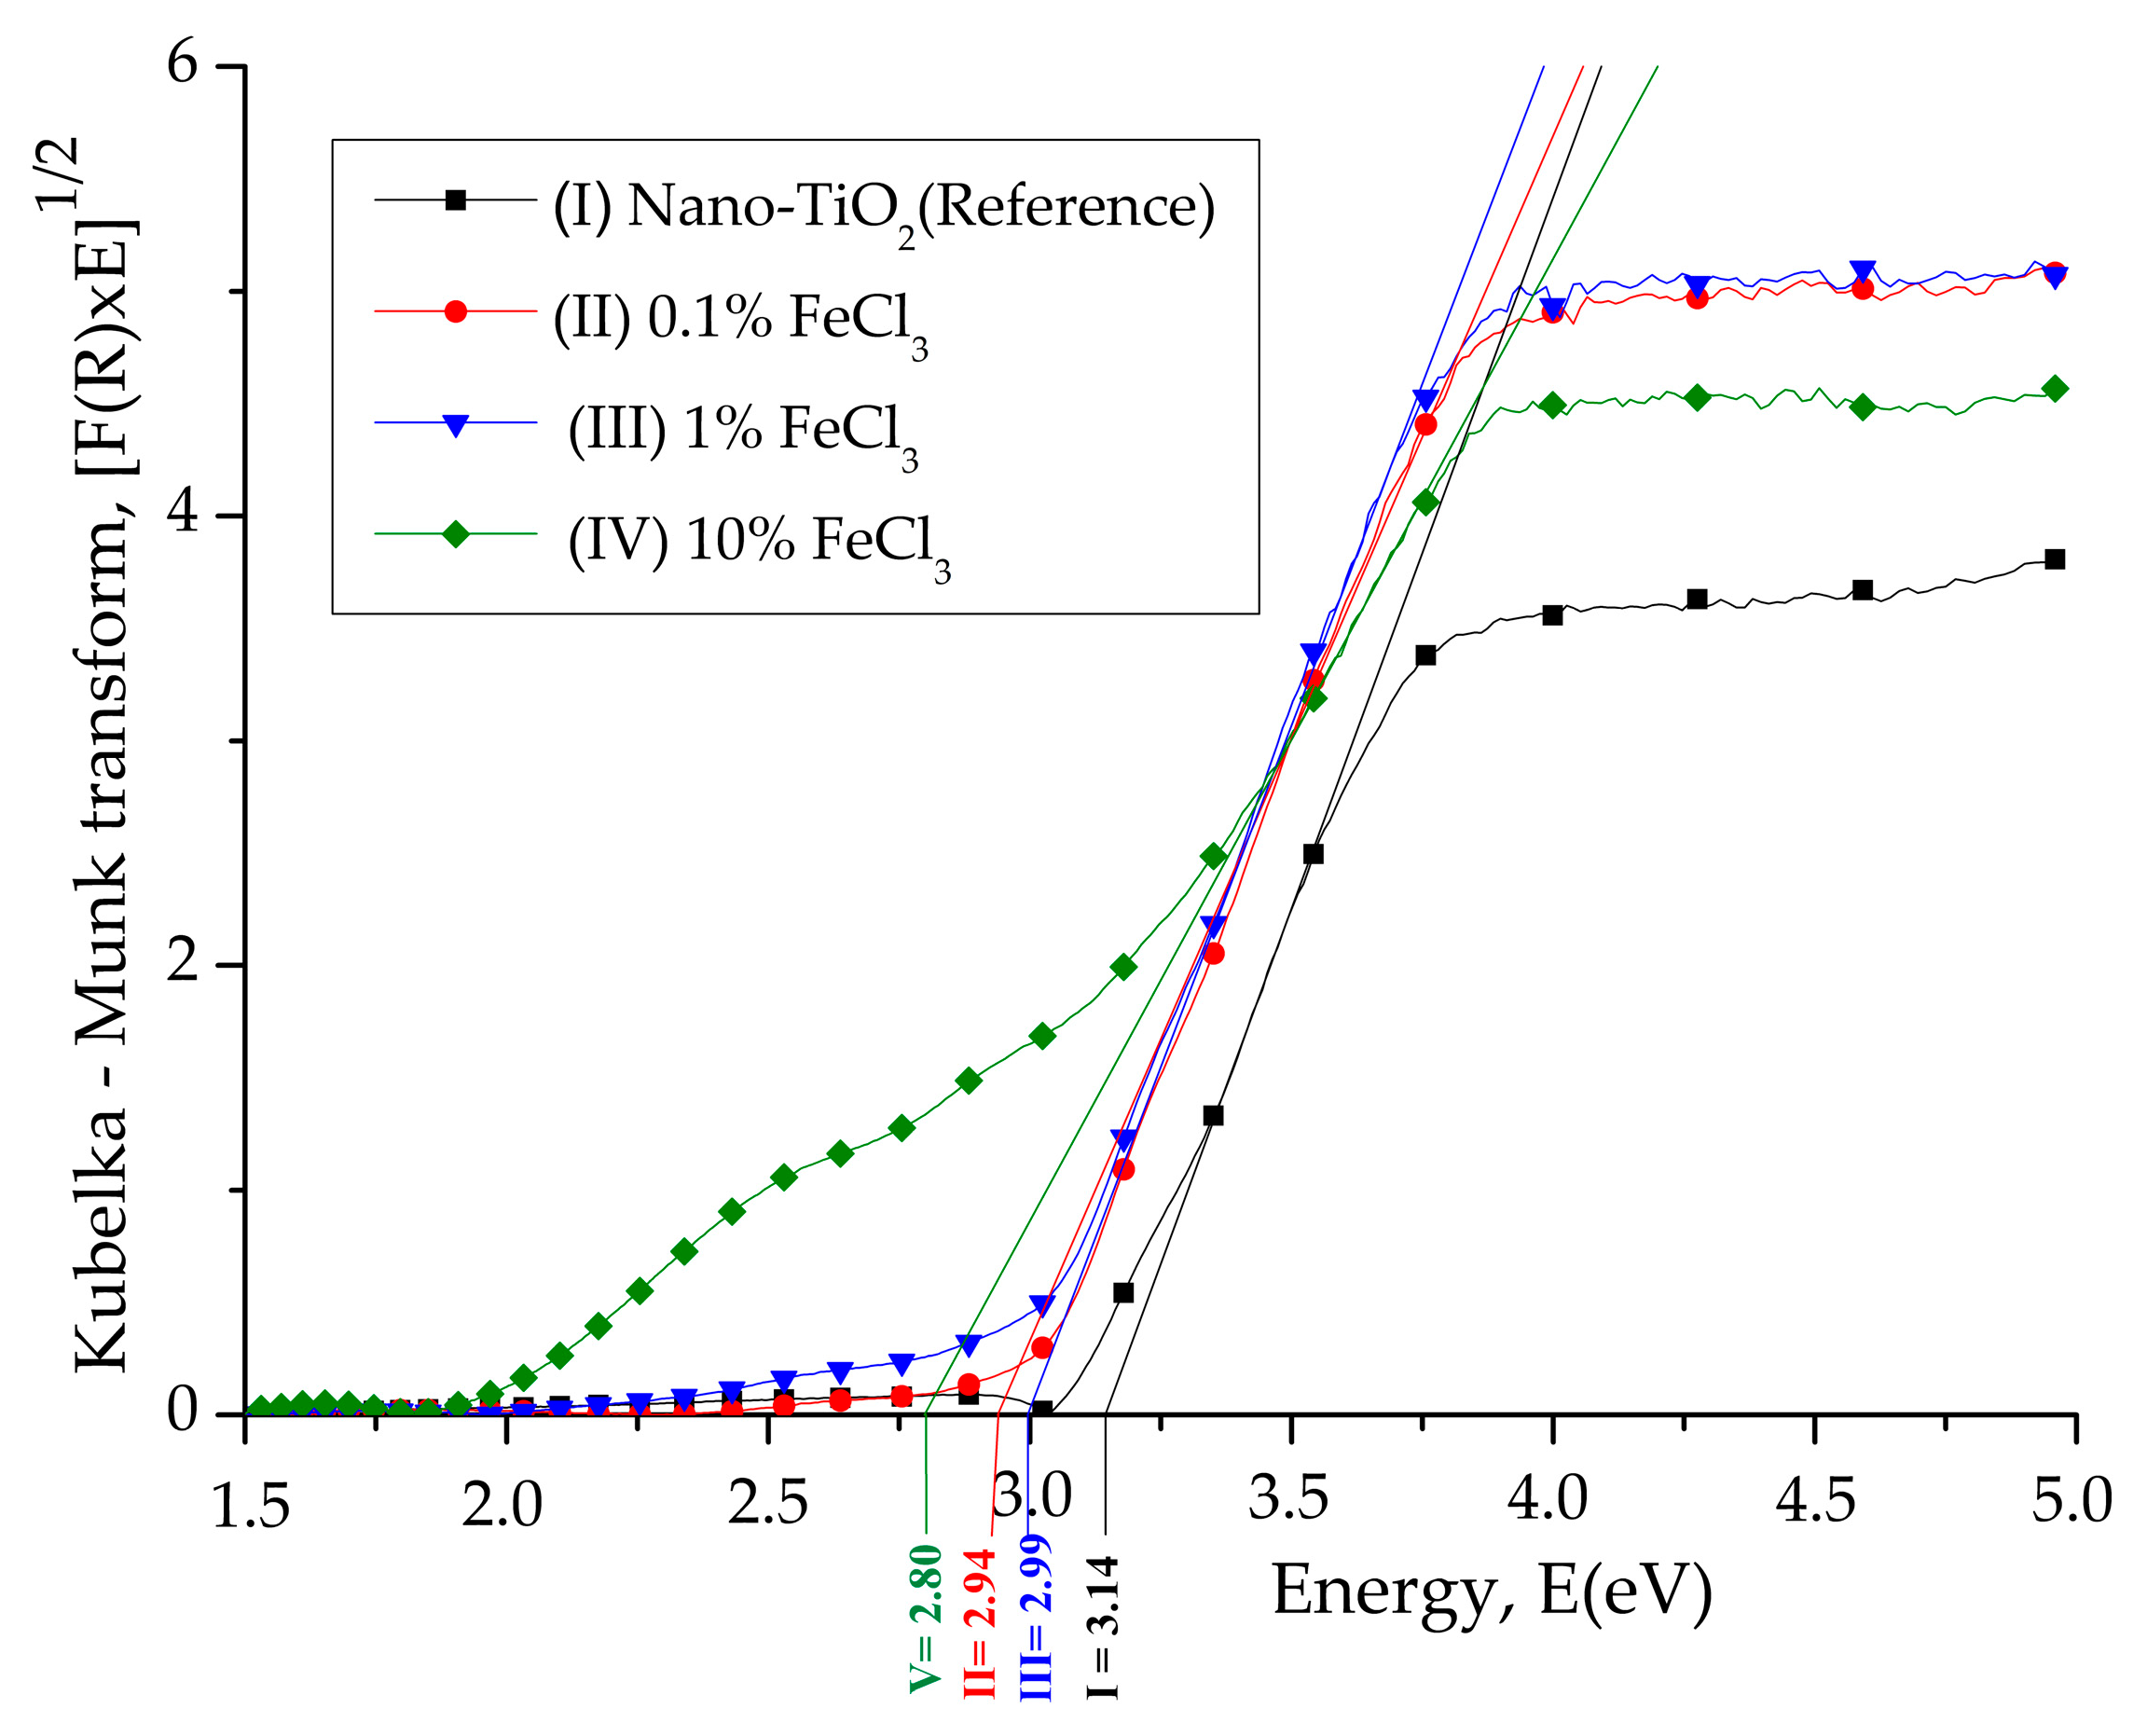
Thus, the band gap (Eg) values were calculated from the linear fits to the plot of [F(R) × E]1/2 versus E. This involves drawing a tangent line at the curve’s inflexion point, and the value where this tangent line intersects the horizontal axis is taken as Eg.

2.2.3. Scanning Electron Microscopy (SEM) and Energy Dispersive Spectroscopy (EDS)

The morphology and chemical composition of the nanoparticles were characterized by scanning electron microscopy (SEM) and energy dispersive spectroscopy (EDS). SEM images and EDS analyses of the modified and unmodified nano-TiO2 were obtained using a nano-SEM (Nova 200, FEI Company, Hillsboro, OR, USA) operated in a high vacuum at an accelerating 10 kV. The SEM system is integrated with an EDS (EDAX Pegasus X4M, Gatan, Pleasanton, CA, USA).

2.2.4. X-ray Diffraction (XRD)

X-ray diffraction (XRD) was used to investigate the changes in the crystalline structure of the modified and unmodified nano-TiO2. Using an X-ray diffractometer (D8 Discover, Bruker, Carcavelos, Portugal), the X-ray diffraction data were recorded using CuKα radiation (λ = 1.5406 Å) and between a range of 2θ from 5° to 65°. Data from the obtained XRD patterns were used to determine the crystalline phase, crystallite size, lattice parameters, unit cell volume, and weight fraction anatase of nano-TiO2.
The crystalline phase was identified from the peaks measured by XRD and known in the Inorganic Crystal Structure Database (ICSD) PDF 01-070-6826 (anatase), PDF 03-065-1119 (rutile), and PDF 01-077-0999 (iron (III) chloride). The crystallite size was estimated by applying the Debye–Scherrer equation:
D = (K × λ)/β × cosθ
where D is the average crystallite size in nm; K = 0.94; β is the half-height width of the diffraction peak; λ = 1.5406 Å; and θ is the diffraction angle.
The lattice parameters were determined using Bragg’s law (Equation (7)) and Equation (8), applicable to a hexagonal structure (a = b ≠ c). The unit cell volume was calculated according to Equation (9).
d = λ/(2sinθ)
1/d2 = (h2 + k2 + l2) × 1/a2
v = a2 × c
Finally, the anatase weight fraction (XA) was calculated using the method proposed by Spurr and Myers [27], according to Equation (10).
XA = 1/(1 + 1.26 × (IR/IA))
IR is the rutile phase’s peak intensity, and IA is the peak intensity of the anatase phase. All the parameters were calculated using the two most intense peaks of the TiO2 phases [15].

2.2.5. Photocatalytic Efficiency Assessment

The photocatalytic efficiency of modified and unmodified nano-TiO2 was analyzed by the degradation of Rhodamine B (RhB). This test consisted of preparing a 50 mg solution of nanoparticles in 50 mL of aqueous RhB solution at 2 ppm. The solutions were then placed in a customized box containing a lamp that simulates solar radiation. For the test, all solutions were kept in the dark for 2 h and exposed to light for 3 h. The dark period was used to evaluate the dye adsorption by the nanoparticles without the influence of the photocatalytic process.
To analyze the photocatalytic degradation of the RhB solutions, their maximum absorbance values obtained at different time intervals (0.166, 0.5, 1, 1.5, 2, 2.5, and 3 h) were monitored. The decrease over time in the maximum absorbance of the solution indicates the decomposition of RhB caused by the photocatalytic process. Thus, for each time interval, 5 mL of the solutions was centrifuged at 6000 rpm for 30 min to decant the material, which remained at the bottom of the container. Subsequently, 3 mL of the centrifuged dispersions was removed and placed in cuvettes to measure the absorbance of the dye using a spectrophotometer (SanSpecUV–Vis) over a wavelength range of 400–800 nm. The photocatalytic efficiency was determined from Equation (11):
Φ (%) = (A0 − A) × 100/A
where Φ is the photocatalytic efficiency, while A and A0 represent the maximum absorption of the RhB solution (554 nm) for time “t” and 0 h after irradiation, respectively.

3. Results

3.1. Diffuse Reflectance Spectroscopy (DRS)

Figure 1 shows the Kubelka–Munk function of nano-TiO2 and iron-modified nano-TiO2 as a function of the light wavelength. The results for nano-TiO2 demonstrate that it absorbs light only at wavelengths shorter than 400 nm (i.e., in the UV region), as reported in the literature. The modified TiO2 showed improved absorption in this UV region for all concentrations of FeCl3. However, only the highest iron concentration (10% FeCl3) showed a significant absorption edge shift, extending into the visible region and reaching up to 600 nm of wavelength.
In Figure 2, nano-TiO2 showed a band gap of 3.14 eV larger than the modified nano-TiO2. The lowest band gap energy was found for the highest FeCl3 concentration of 10%, with a value of 2.80 eV. The concentrations of 0.1%FeCl3 and 1%FeCl3 exhibited a reduction in the band gaps very close to 2.94 and 2.99 eV, respectively.

3.2. Scanning Electron Microscopy (SEM) and Energy Dispersive Spectroscopy (EDS)

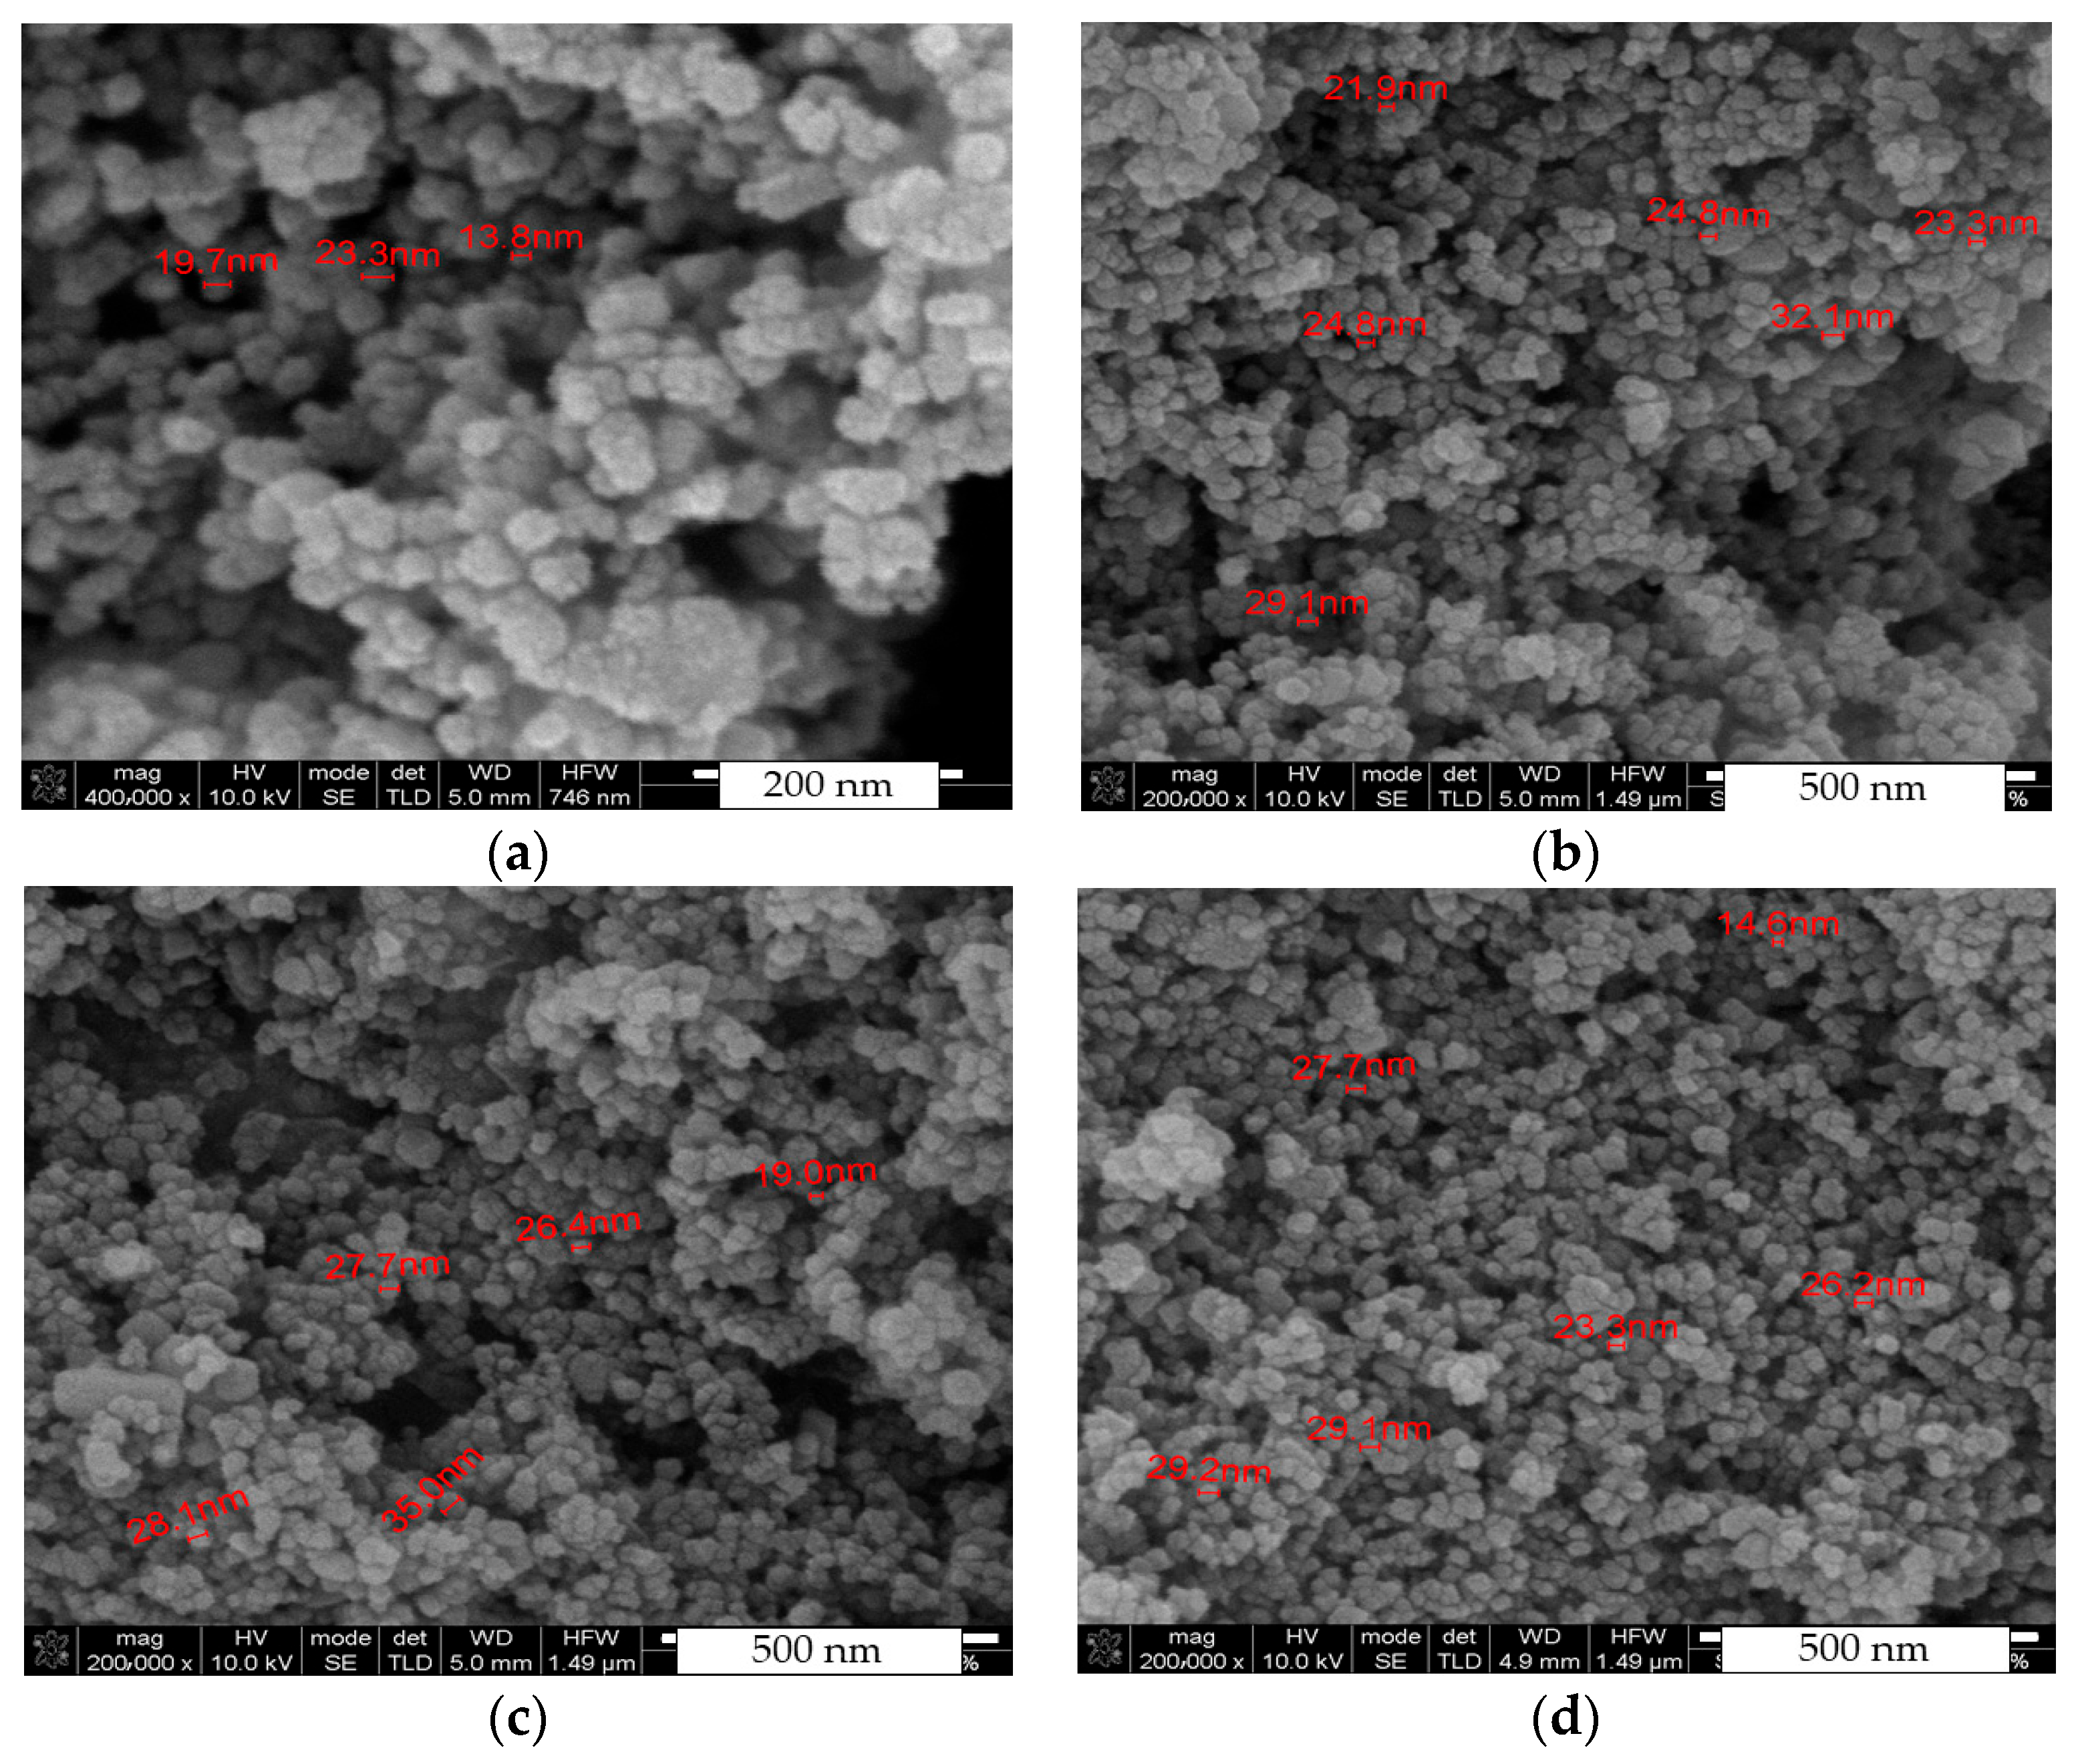
The SEM analyses of nano-TiO2, 0.1% FeCl3, 1% FeCl3, and 10% FeCl3 are shown in Figure 3. Particle agglomeration and random distribution were observed in both unmodified and modified nano-TiO2.
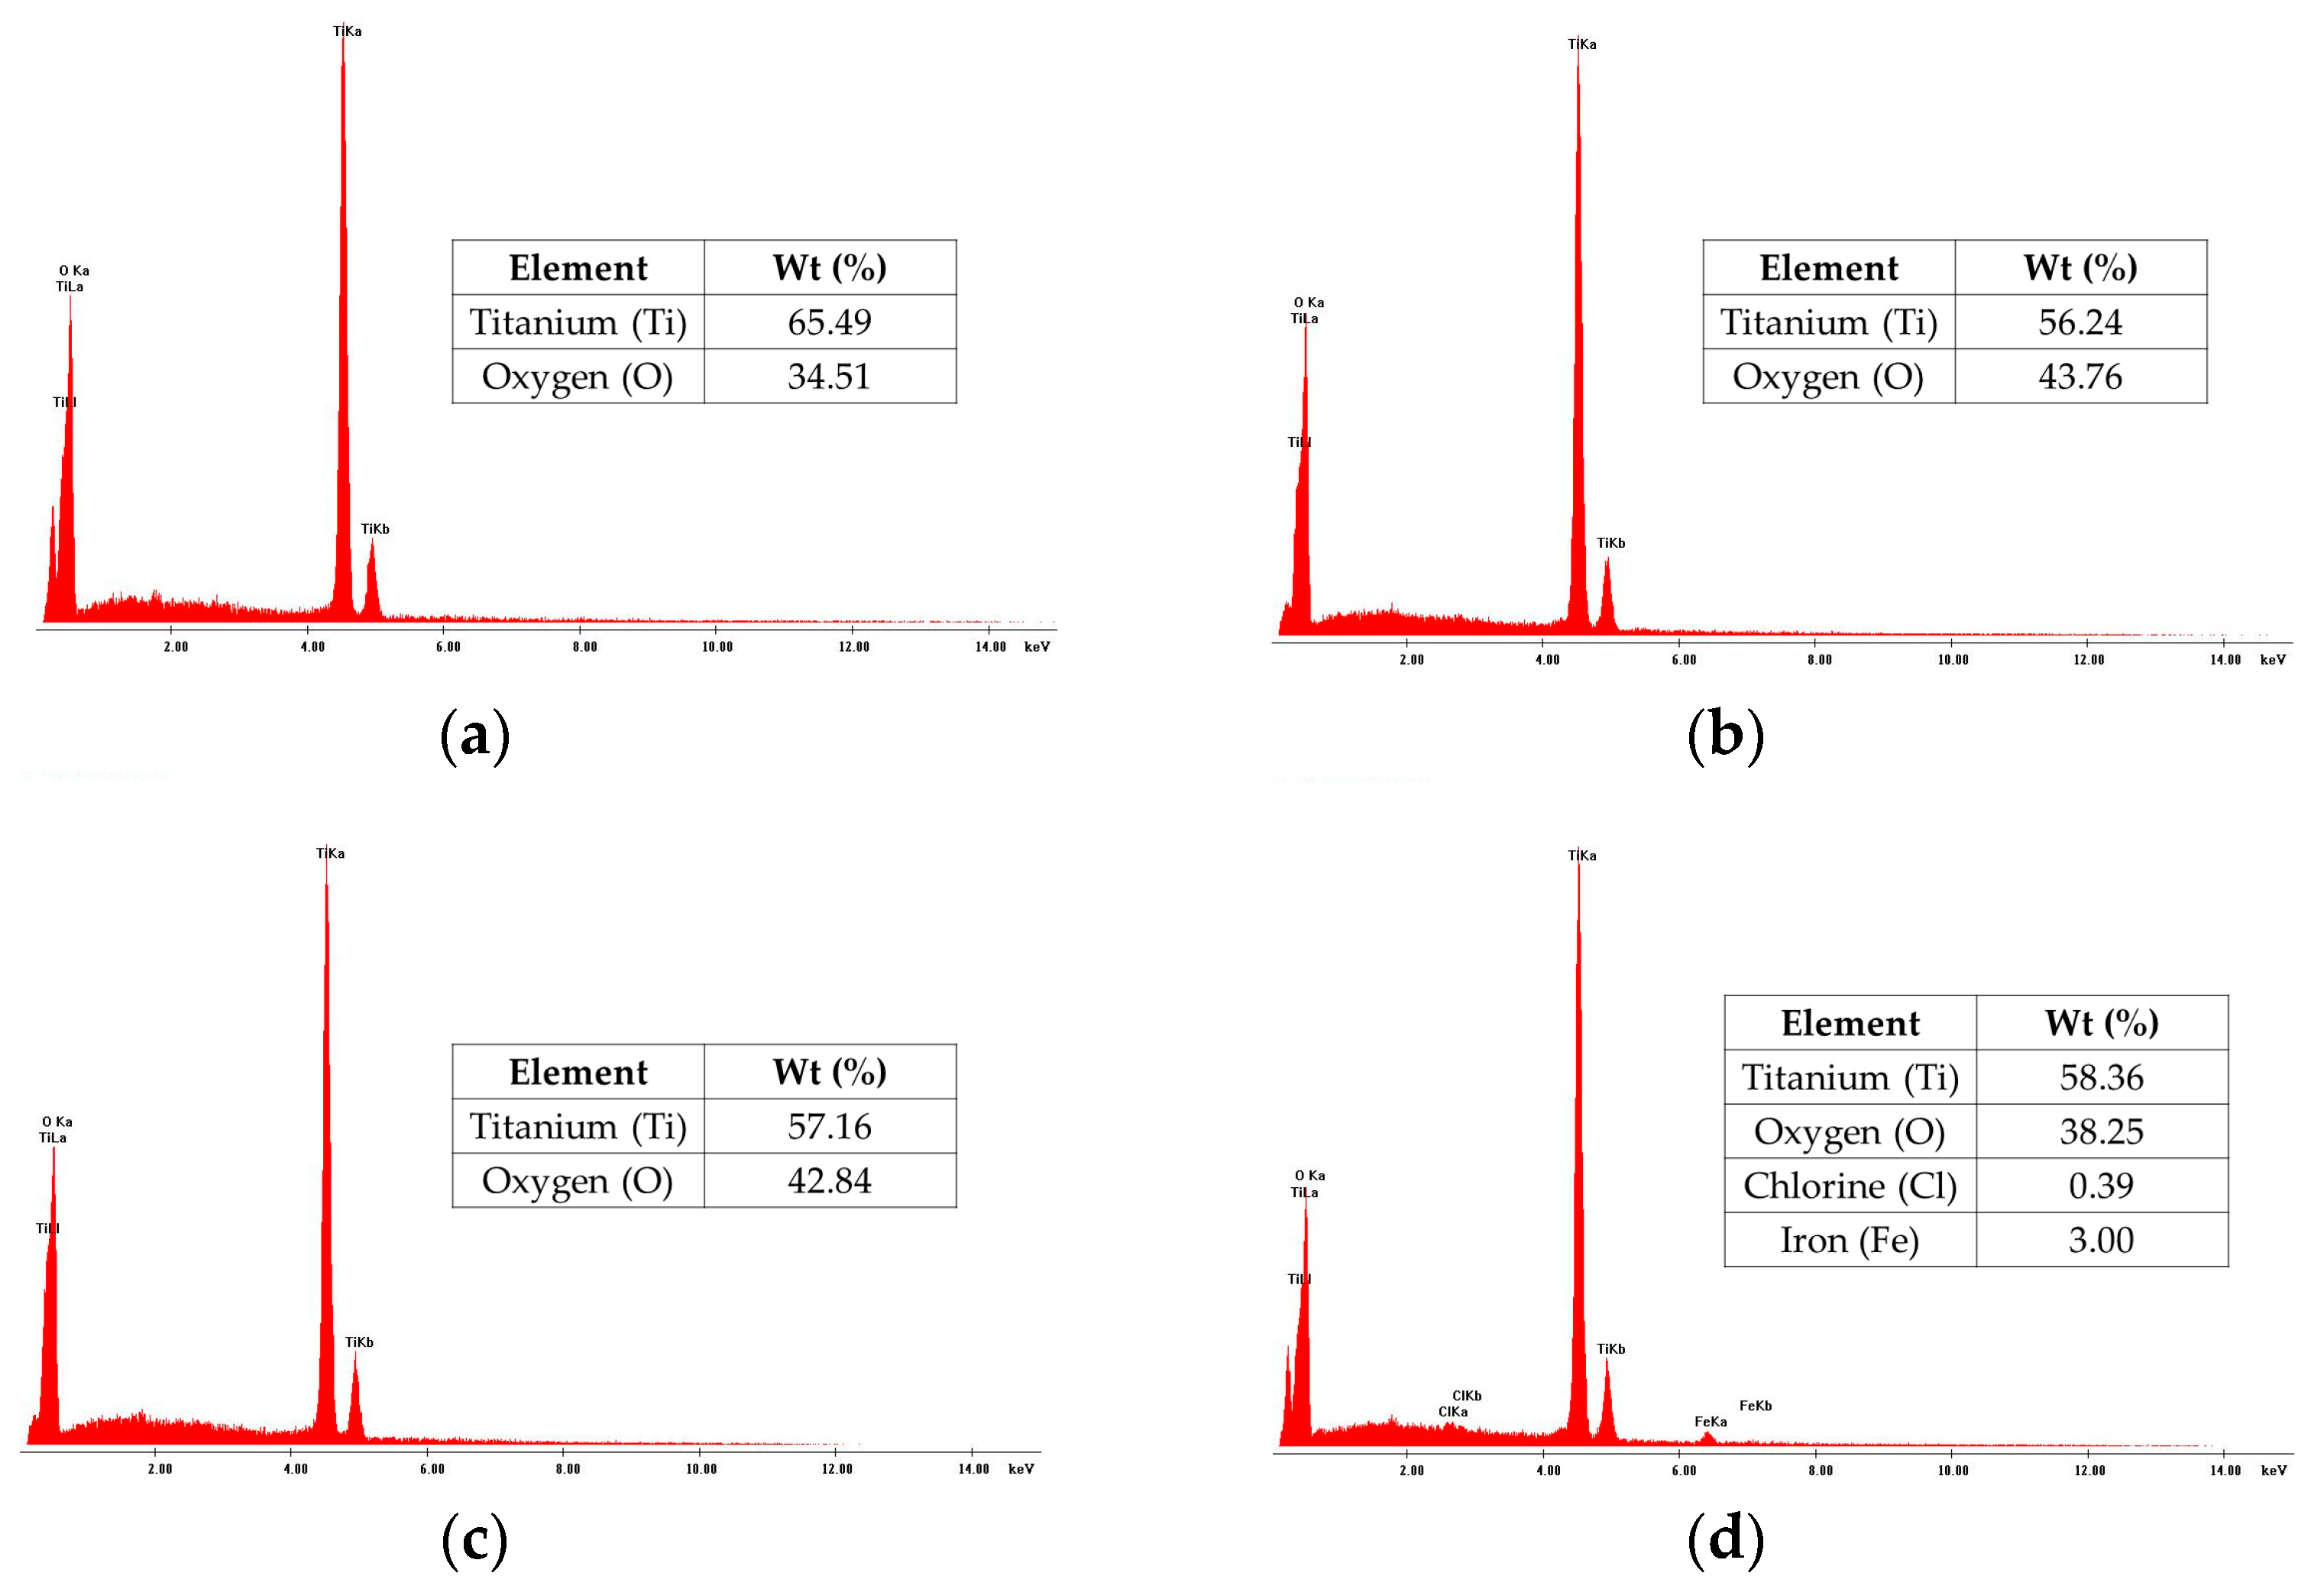
The results of the EDS analysis are shown in Figure 4. They confirm the presence of Ti and O in all nano-TiO2 samples. However, iron (Fe) was not detected in the samples with 0.1% FeCl3 and 1% FeCl3 concentrations.

3.3. X-ray Diffraction (XRD)

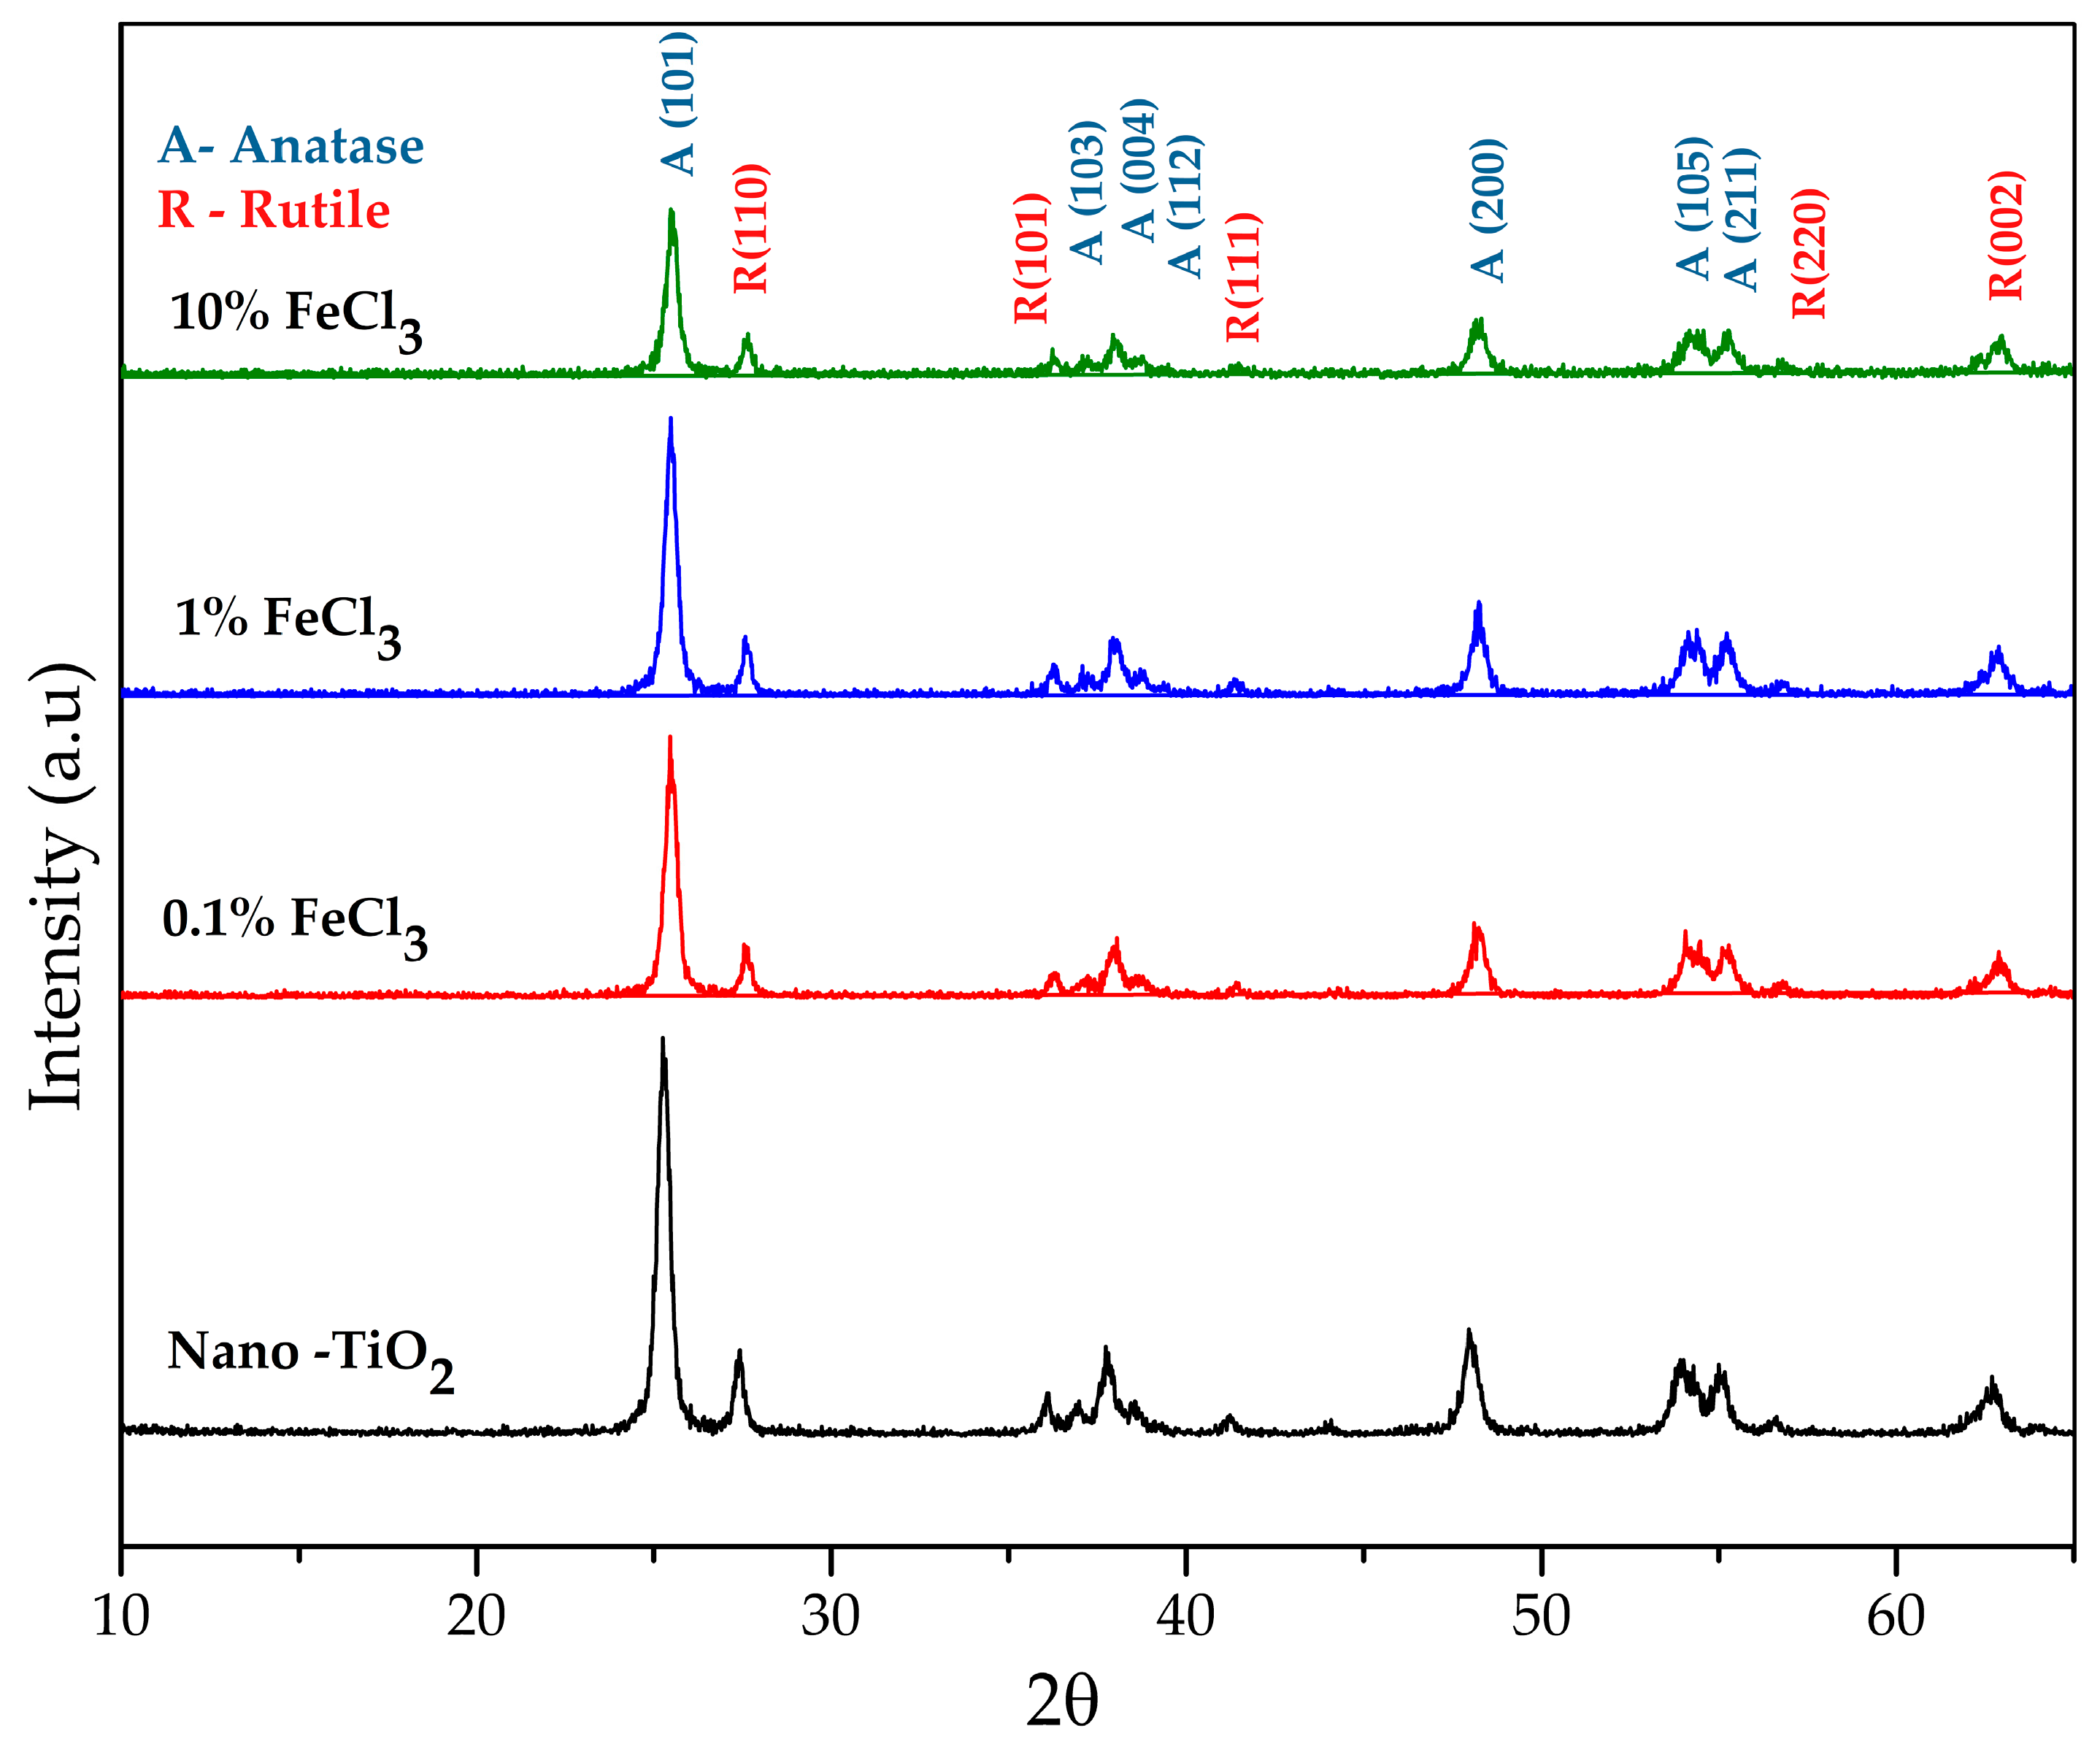
Figure 5 shows the XRD spectra. The presence of anatase and rutile phases in nano-TiO2 can be observed. For the anatase phase, the two most intense peaks appeared around the diffraction angles of 25.42° and 48.23°, corresponding to A (101) and A (200). In the rutile phase, the two most intense peaks were observed at about 27.47° and 62.56°, corresponding to R (110) and R (002). The FeCl3 diffraction peaks were not present in the iron-modified TiO2.
The estimated crystallite size is shown in Table 1.
The lower concentrations of 0.1% FeCl3 and 1% FeCl3 result in an increase in the average crystallite size. However, at a 10% FeCl3 concentration, the crystallite sizes of anatase and rutile decrease again compared to 0.1% and 1% FeCl3 concentrations.
The lattice parameters, unit cell volume, and weight fraction of anatase (XA) are shown in Table 2 and Table 3.
Lattice parameters and unit cell volume show a slight reduction after modification of nano-TiO2.

3.4. Photocatalytic Efficiency Assessment

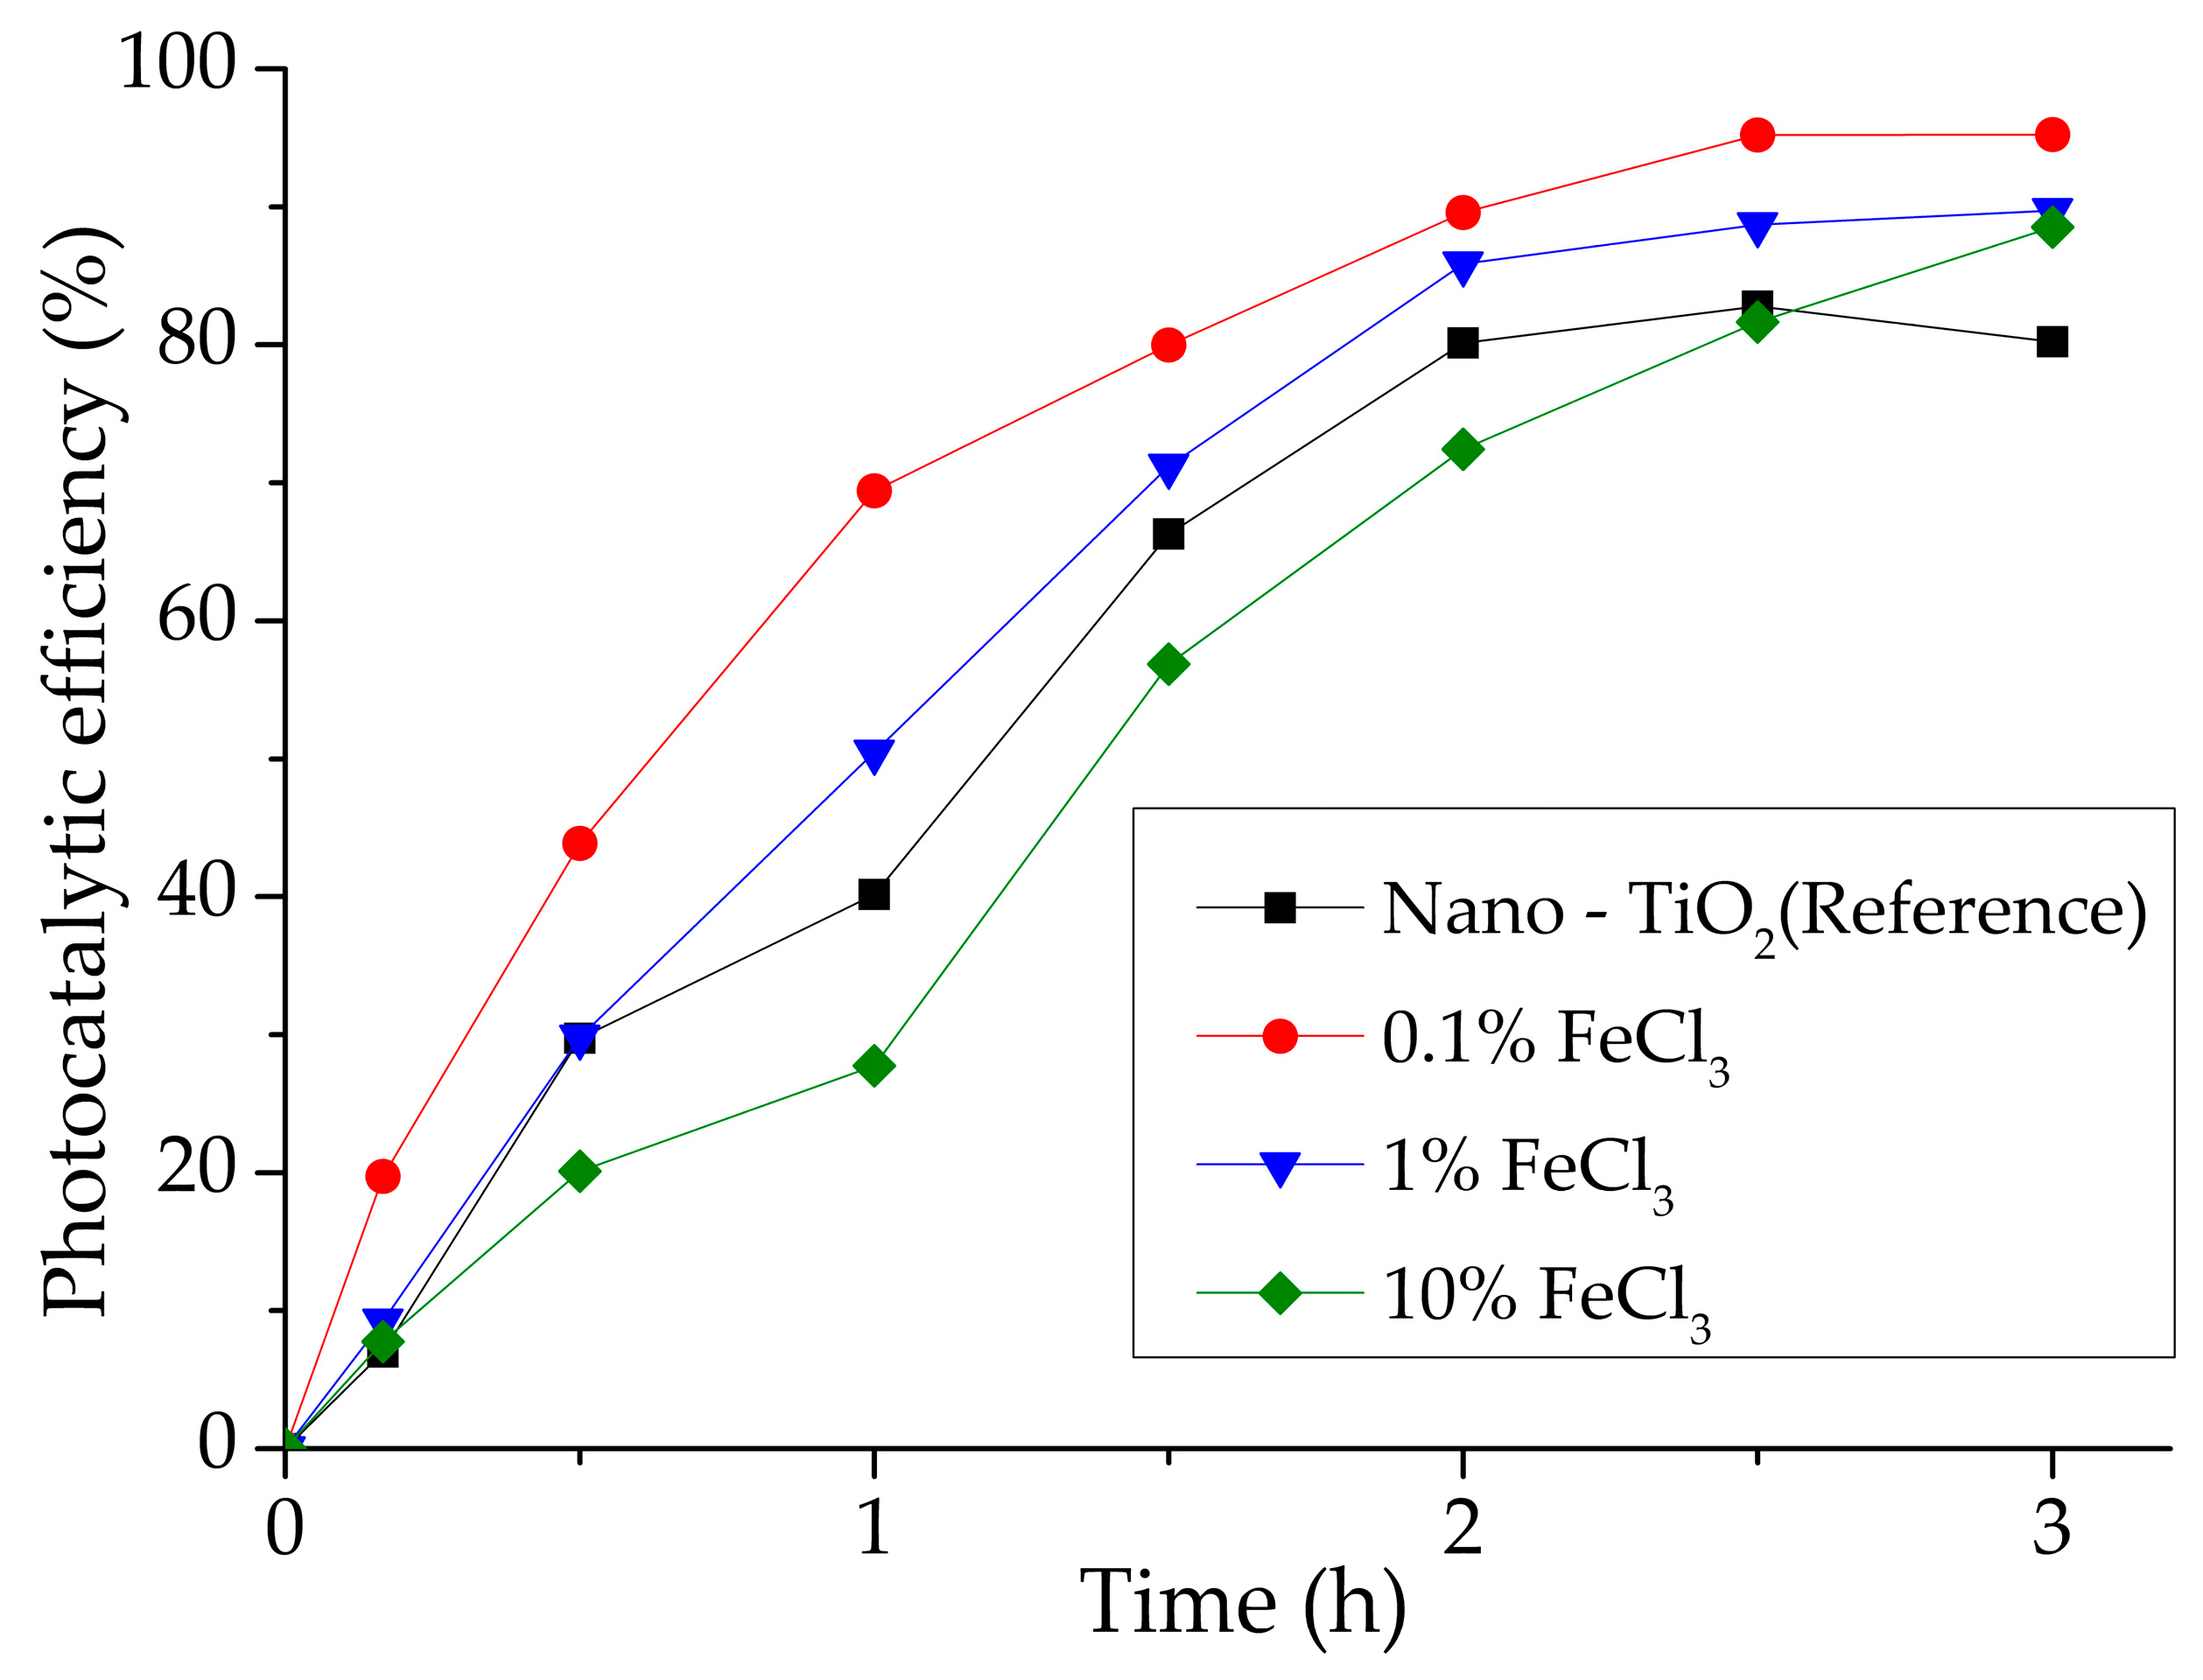
Figure 6 shows the photocatalytic efficiency of unmodified and modified nano-TiO2 with 0.1%,1%, and 10% concentration percentages of FeCl3. It is observed that, after 3 h of irradiation, all the modified samples showed a photocatalytic efficiency above the unmodified samples, which reached 80% efficiency. Notably, the nano-TiO2 with the highest FeCl3 concentration (10%) showed the lowest photocatalytic efficiency at up to 2.5 h of the test.
The sample corresponding to 0.1% FeCl3 achieved the best performance, which obtained a photocatalytic efficiency of 95.23%.

4. Discussion

Modifying nano-TiO2 with FeCl3 led to changes in its optical properties, notably enhanced light absorption in UV and visible regions compared to pure TiO2. These changes are influenced by the amount of iron incorporated. Specifically, the higher iron concentration (10%) resulted in a shift in absorption to longer wavelengths, reaching up to 600 nm. This shift was also accompanied by a decrease in the energy band gap (Eg) values with increasing iron concentration, consistent with findings reported in previous studies [14,28]. Medina-Ramírez et al. [28] described this decrease in the energy band gap as a result of the formation of additional energy levels within the band gap: above the valence band (Fe4+/Fe3+) and also an energy level (Fe3+/Fe2+) below the conduction band of TiO2. These observations show that the modification process altered the optical properties of nano-TiO2 due to the possible replacement of Ti4+ with Fe3⁺.
Morphological analysis showed no significant changes after modifying nano-TiO2, with all the samples displaying a similar distribution and agglomeration patterns. Also, the inability to observe distinct TiO2 and Fe particles suggests that a chemical reaction occurred during the modification process, leading to the formation of single particles [15].
In the chemical analysis, Fe was undetectable in samples containing 0.1% and 1% FeCl3. This absence can be attributed to the low concentration of Fe3⁺, which is below the detection limit of the EDS method. For example, in the study by Medina-Ramírez et al. [28], the researchers varied the amount of Fe ions in the modification process, resulting in an EDS detection of 0.45 wt% Fe for a concentration of 1% Fe3⁺. In this study, the 1% refers to the FeCl3 compound and not directly to Fe ions, suggesting that the actual Fe concentration may be too low to be detected. To overcome the problem of not detecting Fe at the lowest concentrations, the acceleration voltage of the EDS system was increased to 25 kV. However, the integration error, i.e., the uncertainty associated with the count of X-ray photons detected for the element Fe, was high (over 13%). Therefore, alternative methods, such as atomic absorption spectrometry (AAS) or X-ray photoelectron spectroscopy (XPS), may be more suitable for detecting and quantifying these low concentrations of Fe. In addition, chlorine (Cl) was also detected at the 10% FeCl3 concentration, which was not entirely removed by the washing process.
Regarding structural analysis, there are no evident changes in the crystalline phase after the modification of nano-TiO2. However, a decrease in the intensity of the peaks of Anatase and Rutile occurred, which also reduced their half-height width and induced variations in crystallite size. Also, the absence of Fe peaks may indicate that the iron was successfully integrated into the TiO2 lattice or dispersed over the TiO2 surface in amounts too small to be detected by the XRD method [7]. In addition, the variations in crystallite size correlate with the amount of FeCl3 used in the modification process. The increase in iron concentration showed a reduction in crystallite size. This trend is consistent with the findings of Ambrus et al. [13]. Similarly, Wahyuni et al. [14] reported that the crystallite size tends to decrease as the concentration of Fe3⁺ increases. Lattice parameters, unit cell volume, and weight fraction of anatase (XA) also showed slight changes. This lattice distortion in TiO2 was attributed by Pongwan et al. [12] and Medina-Ramírez et al. [28] to the replacement of titanium ions for iron due to Fe3+ substituting for Ti4+ in the TiO2 lattice.
Concerning photocatalytic activity, the inclusion of iron improves the photocatalytic degradation activity of the nano-TiO2 by extending the lifetime of the electrons and holes, reducing the chance of recombination. Recombination occurs when an electron returns to the hole, releasing energy as heat and decreasing photocatalytic efficiency. When Fe3⁺ is introduced into TiO2, the new intermediate energy states temporarily trap these charge carriers, reducing recombination. This results in a greater generation of reactive radicals, such as hydroxyl and superoxide, which are fundamental to the degradation of pollutants during photocatalysis [8]. In this study, the inferior concentration of iron (0.1%) had better photocatalytic efficiency through rhodamine B degradation over time. Thus, although the optical characterization results (Section 3.1) showed a better absorption of visible light for the nano-TiO2 modified with the highest iron concentration (10%), this improvement alone does not translate into higher photocatalytic activity. Medina-Ramírez et al. [28] argued that the photocatalytic performance of the photocatalyst is improved when the amount of iron is adequate. Similarly, Hung et al. [29] reported that a high amount of iron ions could decrease the photoactivity due to the ions becoming the recombination centers and accelerating the recombination rate.
According to Zhang et al. [30], particle size is important in achieving greater photoactivity using Fe3⁺. Based on the authors’ studies, the ideal iron concentration for nano-TiO2 modification is inversely related to the particle size of the semiconductor. For Degussa’s P25 used in this work, the authors emphasize that, due to the larger particle size of the semiconductor (>20 nm), the Fe3⁺ concentration must be small to result in greater photocatalytic efficiency. Therefore, the higher efficiency achieved at a lower concentration can be attributed to the reduced recombination rates of the electron–hole pairs photogenerated in a lower concentration of Fe3⁺. Due to the large size of the P25 Degussa particles, the distance the carriers travel to the surface is greater, which increases the possibility of multiple trapping and recombination rates if the concentration of Fe3⁺ is not reduced [30].

5. Conclusions

This study presents an advancement in modifying a commercial nano-TiO2 with iron using the co-precipitation method. This approach is less explored than iron incorporation during nano-TiO2 synthesis by the same method. By varying FeCl3 concentrations (0.1%, 1%, and 10%), enhanced light absorption in the visible spectrum at the highest concentration was observed, which led to a reduction in the energy band gap from 3.14 to 2.80 eV. Despite this improved light absorption, the most effective photocatalytic performance was achieved at the lowest iron concentration (0.1%). From the results found, it was possible to confirm that the modification of nano-TiO2 with FeCl3 produced changes in the material consistent with the literature, suggesting that iron was incorporated into the crystalline structure of TiO2. In addition, an enhanced photocatalytic activity at lower iron concentrations, as previously reported for the semiconductor studied (Nano-TiO2 Aeroxide P25 Degussa), was also confirmed. In this context, using commercial TiO2 can simplify the modification process of photocatalytic materials for outdoor applications, overcoming the complexity associated with the challenges of transitioning these processes from the laboratory to the field. However, more studies are needed to better understand its advantages and potential limitations.
Another point is the need for a more detailed investigation of the chemical processes involved. Challenges were observed in the detection of low iron concentrations, and alternative techniques such as atomic absorption spectrometry (AAS) or X-ray photoelectron spectroscopy (XPS) may be required for a more accurate quantification of the amount of Fe3+ incorporated into the nano-TiO2. Future research could explore other iron concentrations and evaluate the photocatalytic efficiency of these modified nanoparticles through pollutant degradation tests on civil engineering substrates, wherein the photocatalytic application is being investigated. This could provide valuable information in practical applications.

Author Contributions

Conceptualization, É.M.M., C.A., O.L.J. and I.R.S.; methodology, I.R.S., S.L.J., M.F.M.C. and J.C.; validation, M.F.M.C., E.F. and J.C.; formal analysis, É.M.M., S.L.J. and I.R.S.; investigation, É.M.M., C.A. and O.L.J.; resources, M.F.M.C. and J.C.; data curation, É.M.M. and C.A.; writing—original draft preparation, É.M.M.; writing—review and editing, I.R.S., S.L.J., E.F., M.F.M.C. and J.C.; visualization, É.M.M., S.L.J. and I.R.S.; supervision, I.R.S., E.F. and J.C.; project administration, J.C., E.F. and I.R.S.; funding acquisition, J.C. All authors have read and agreed to the published version of the manuscript.

Funding

This research was financed by the Portuguese Foundation for Science and Technology FCT/MCTES through national funds (PIDDAC) under the projects NanoAir PTDC/FIS-MAC/6606/2020 (https://doi.org/10.54499/PTDC/FIS-MAC/6606/2020), UIDB/04650/2020, UIDB/04029/2020 (https://doi.org/10.54499/UIDB/04029/2020), and under the Associate Laboratory Advanced Production and Intelligent Systems ARISE under reference LA/P/0112/2020. This research is also financed by national funds through FCT—Foundation for Science and Technology, under grant agreement 2023.02795.BD (https://doi.org/10.54499/2023.02795.BD), as well as by doctoral grant PRT/BD/154269/2022 financed by FCT, with funds from POR Norte-Portugal 2020 and the State Budget under the MIT Portugal Program. Iran Rocha Segundo would like to acknowledge the FCT for funding with reference 2022.00763.CEECIND (https://doi.org/10.54499/2022.00763.CEECIND/CP1718/CT0006).

Institutional Review Board Statement

Not applicable.

Informed Consent Statement

Not applicable.

Data Availability Statement

Data are contained within the article.

Conflicts of Interest

The authors declare no conflicts of interest.

References

  1. Lale, E.; Uyguner-Demirel, C.S.; Bekbolet, M. Visible Light Photocatalytic Response of Fe Doped TiO2: Inactivation of Escherichia Coli. J. Photochem. Photobiol. A Chem. 2024, 456, 115836. [Google Scholar] [CrossRef]
  2. Segundo, I.R.; Freitas, E.; Branco, V.T.F.C.; Landi, S.; Costa, M.F.; Carneiro, J.O. Review and Analysis of Advances in Functionalized, Smart, and Multifunctional Asphalt Mixtures. Renew. Sustain. Energy Rev. 2021, 151, 111552. [Google Scholar] [CrossRef]
  3. Fang, M.; Peng, L.; Li, Y.; Cheng, Y.; Zhan, L. Evaluation Test of NO Degradation by Nano-TiO2 Coatings on Road Pavements under Natural Light. Coatings 2022, 12, 1200. [Google Scholar] [CrossRef]
  4. Bersch, J.D.; Picanço Casarin, R.; Maia, J.; Masuero, A.B.; Dal Molin, D.C.C. TiO2-Based Mortars for Rendering Building Envelopes: A Review of the Surface Finishing for Sustainability. Sustainability 2023, 15, 16920. [Google Scholar] [CrossRef]
  5. Nyamukamba, P.; Okoh, O.; Mungondori, H.; Taziwa, R.; Zinya, S. Synthetic Methods for Titanium Dioxide Nanoparticles: A Review. In Titanium Dioxide—Material for a Sustainable Environment; InTech: Houston, TX, USA, 2018. [Google Scholar]
  6. Schneider, J.; Matsuoka, M.; Takeuchi, M.; Zhang, J.; Horiuchi, Y.; Anpo, M.; Bahnemann, D.W. Understanding TiO2 Photocatalysis: Mechanisms and Materials. Chem. Rev. 2014, 114, 9919–9986. [Google Scholar] [CrossRef] [PubMed]
  7. Sangeetha, M.; Senthil, T.S.; Senthilkumar, N.; Kang, M. Solar-Light-Induced Photocatalyst Based on Bi–B Co-Doped TiO2 Prepared via Co-Precipitation Method. J. Mater. Sci. Mater. Electron. 2022, 33, 16550–16563. [Google Scholar] [CrossRef]
  8. Carneiro, J.O.; Azevedo, S.; Fernandes, F.; Freitas, E.; Pereira, M.; Tavares, C.J.; Lanceros-Méndez, S.; Teixeira, V. Synthesis of Iron-Doped TiO2 Nanoparticles by Ball-Milling Process: The Influence of Process Parameters on the Structural, Optical, Magnetic, and Photocatalytic Properties. J. Mater. Sci. 2014, 49, 7476–7488. [Google Scholar] [CrossRef]
  9. Crişan, M.; Drăgan, N.; Crişan, D.; Ianculescu, A.; Niţoi, I.; Oancea, P.; Todan, L.; Stan, C.; Stănică, N. The Effects of Fe, Co and Ni Dopants on TiO2 Structure of Sol–Gel Nanopowders Used as Photocatalysts for Environmental Protection: A Comparative Study. Ceram. Int. 2016, 42, 3088–3095. [Google Scholar] [CrossRef]
  10. Matias, M.L.; Pimentel, A.; Reis-Machado, A.S.; Rodrigues, J.; Deuermeier, J.; Fortunato, E.; Martins, R.; Nunes, D. Enhanced Fe-TiO2 Solar Photocatalysts on Porous Platforms for Water Purification. Nanomaterials 2022, 12, 1005. [Google Scholar] [CrossRef]
  11. Ali, T.; Tripathi, P.; Azam, A.; Raza, W.; Ahmed, A.S.; Ahmed, A.; Muneer, M. Photocatalytic Performance of Fe-Doped TiO2 Nanoparticles under Visible-Light Irradiation. Mater. Res. Express 2017, 4, 015022. [Google Scholar] [CrossRef]
  12. Pongwan, P.; Inceesungvorn, B.; Wetchakun, K.; Phanichphant, S.; Wetchakun, N. Highly Efficient Visible-Light-Induced Photocatalytic Activity of Fe-Doped TiO2 Nanoparticles. Eng. J. 2012, 16, 143–152. [Google Scholar] [CrossRef]
  13. Ambrus, Z.; Balázs, N.; Alapi, T.; Wittmann, G.; Sipos, P.; Dombi, A.; Mogyorósi, K. Synthesis, Structure and Photocatalytic Properties of Fe(III)-Doped TiO2 Prepared from TiCl3. Appl. Catal. B Environ. 2008, 81, 27–37. [Google Scholar] [CrossRef]
  14. Wahyuni, E.T.; Lestari, N.D.; Cinjana, I.R.; Annur, S.; Natsir, T.A.; Mudasir, M. Doping TiO2 with Fe from Iron Rusty Waste for Enhancing Its Activity under Visible Light in the Congo Red Dye Photodegradation. J. Eng. Appl. Sci. 2023, 70, 9. [Google Scholar] [CrossRef]
  15. Afonso, C.; Lima, O.; Segundo, I.R.; Landi, S.; Margalho, É.; Homem, N.; Pereira, M.; Costa, M.F.M.; Freitas, E.; Carneiro, J. Effect of Iron-Doping on the Structure and Photocatalytic Activity of TiO2 Nanoparticles. Catalysts 2022, 13, 58. [Google Scholar] [CrossRef]
  16. Li, Z.; Shen, W.; He, W.; Zu, X. Effect of Fe-Doped TiO2 Nanoparticle Derived from Modified Hydrothermal Process on the Photocatalytic Degradation Performance on Methylene Blue. J. Hazard. Mater. 2008, 155, 590–594. [Google Scholar] [CrossRef]
  17. Akpan, U.G.; Hameed, B.H. The Advancements in Sol–Gel Method of Doped-TiO2 Photocatalysts. Appl. Catal. A Gen. 2010, 375, 1–11. [Google Scholar] [CrossRef]
  18. Letifi, H.; Dridi, D.; Litaiem, Y.; Ammar, S.; Dimassi, W.; Chtourou, R. High Efficient and Cost Effective Titanium Doped Tin Dioxide Based Photocatalysts Synthesized via Co-Precipitation Approach. Catalysts 2021, 11, 803. [Google Scholar] [CrossRef]
  19. Mahendran, V.; Gogate, P.R. Ultrasound-Assisted Synthesis of Fe-Doped TiO2 Catalyst for Photocatalytic Oxidation Application. Int. J. Environ. Res. 2021, 15, 1071–1084. [Google Scholar] [CrossRef]
  20. Ma, J.; He, H.; Liu, F. Effect of Fe on the Photocatalytic Removal of NO over Visible Light Responsive Fe/TiO2 Catalysts. Appl. Catal. B Environ. 2015, 179, 21–28. [Google Scholar] [CrossRef]
  21. Lucas, S.S.; Ferreira, V.M.; de Aguiar, J.L.B. Incorporation of Titanium Dioxide Nanoparticles in Mortars—Influence of Microstructure in the Hardened State Properties and Photocatalytic Activity. Cem. Concr. Res. 2013, 43, 112–120. [Google Scholar] [CrossRef]
  22. Díaz, D.D.; Miranda, P.O.; Padrón, J.I.; Martín, V.S. Recent Uses of Iron (III) Chloride in Organic Synthesis. Curr. Org. Chem. 2006, 10, 457–476. [Google Scholar] [CrossRef]
  23. Jeyachitra, R.; Senthilnathan, V.; Senthil, T.S. Studies on Electrical Behavior of Fe Doped ZnO Nanoparticles Prepared via Co-Precipitation Approach for Photo-Catalytic Application. J. Mater. Sci. Mater. Electron. 2018, 29, 1189–1197. [Google Scholar] [CrossRef]
  24. Ellouzi, I.; El Hajjaji, S.; Harir, M.; Schmitt-Kopplin, P.; Laânab, L. Coprecipitation Synthesis of Fe-Doped TiO2 from Various Commercial TiO2 for Photocatalytic Reaction. Int. J. Environ. Res. 2020, 14, 605–613. [Google Scholar] [CrossRef]
  25. Yang, X.; Li, L. Controlled Synthesis of Single-Crystalline α-Fe2O3 Micro/Nanoparticles from the Complex Precursor of FeCl3 and Methyl Orange. Nanotechnology 2010, 21, 355602. [Google Scholar] [CrossRef]
  26. Landi, S.; Segundo, I.R.; Freitas, E.; Vasilevskiy, M.; Carneiro, J.; Tavares, C.J. Use and Misuse of the Kubelka-Munk Function to Obtain the Band Gap Energy from Diffuse Reflectance Measurements. Solid State Commun. 2022, 341, 114573. [Google Scholar] [CrossRef]
  27. Spurr, R.A.; Myers, H. Quantitative Analysis of Anatase-Rutile Mixtures with an X-Ray Diffractometer. Anal. Chem. 1957, 29, 760–762. [Google Scholar] [CrossRef]
  28. Medina-Ramírez, I.; Liu, J.L.; Hernández-Ramírez, A.; Romo-Bernal, C.; Pedroza-Herrera, G.; Jáuregui-Rincón, J.; Gracia-Pinilla, M.A. Synthesis, Characterization, Photocatalytic Evaluation, and Toxicity Studies of TiO2–Fe3+ Nanocatalyst. J. Mater. Sci. 2014, 49, 5309–5323. [Google Scholar] [CrossRef]
  29. Hung, W.-C.; Chen, Y.-C.; Chu, H.; Tseng, T.-K. Synthesis and Characterization of TiO2 and Fe/TiO2 Nanoparticles and Their Performance for Photocatalytic Degradation of 1,2-Dichloroethane. Appl. Surf. Sci. 2008, 255, 2205–2213. [Google Scholar] [CrossRef]
  30. Zhang, Z.; Wang, C.-C.; Zakaria, R.; Ying, J.Y. Role of Particle Size in Nanocrystalline TiO2-Based Photocatalysts. J. Phys. Chem. B 1998, 102, 10871–10878. [Google Scholar] [CrossRef]
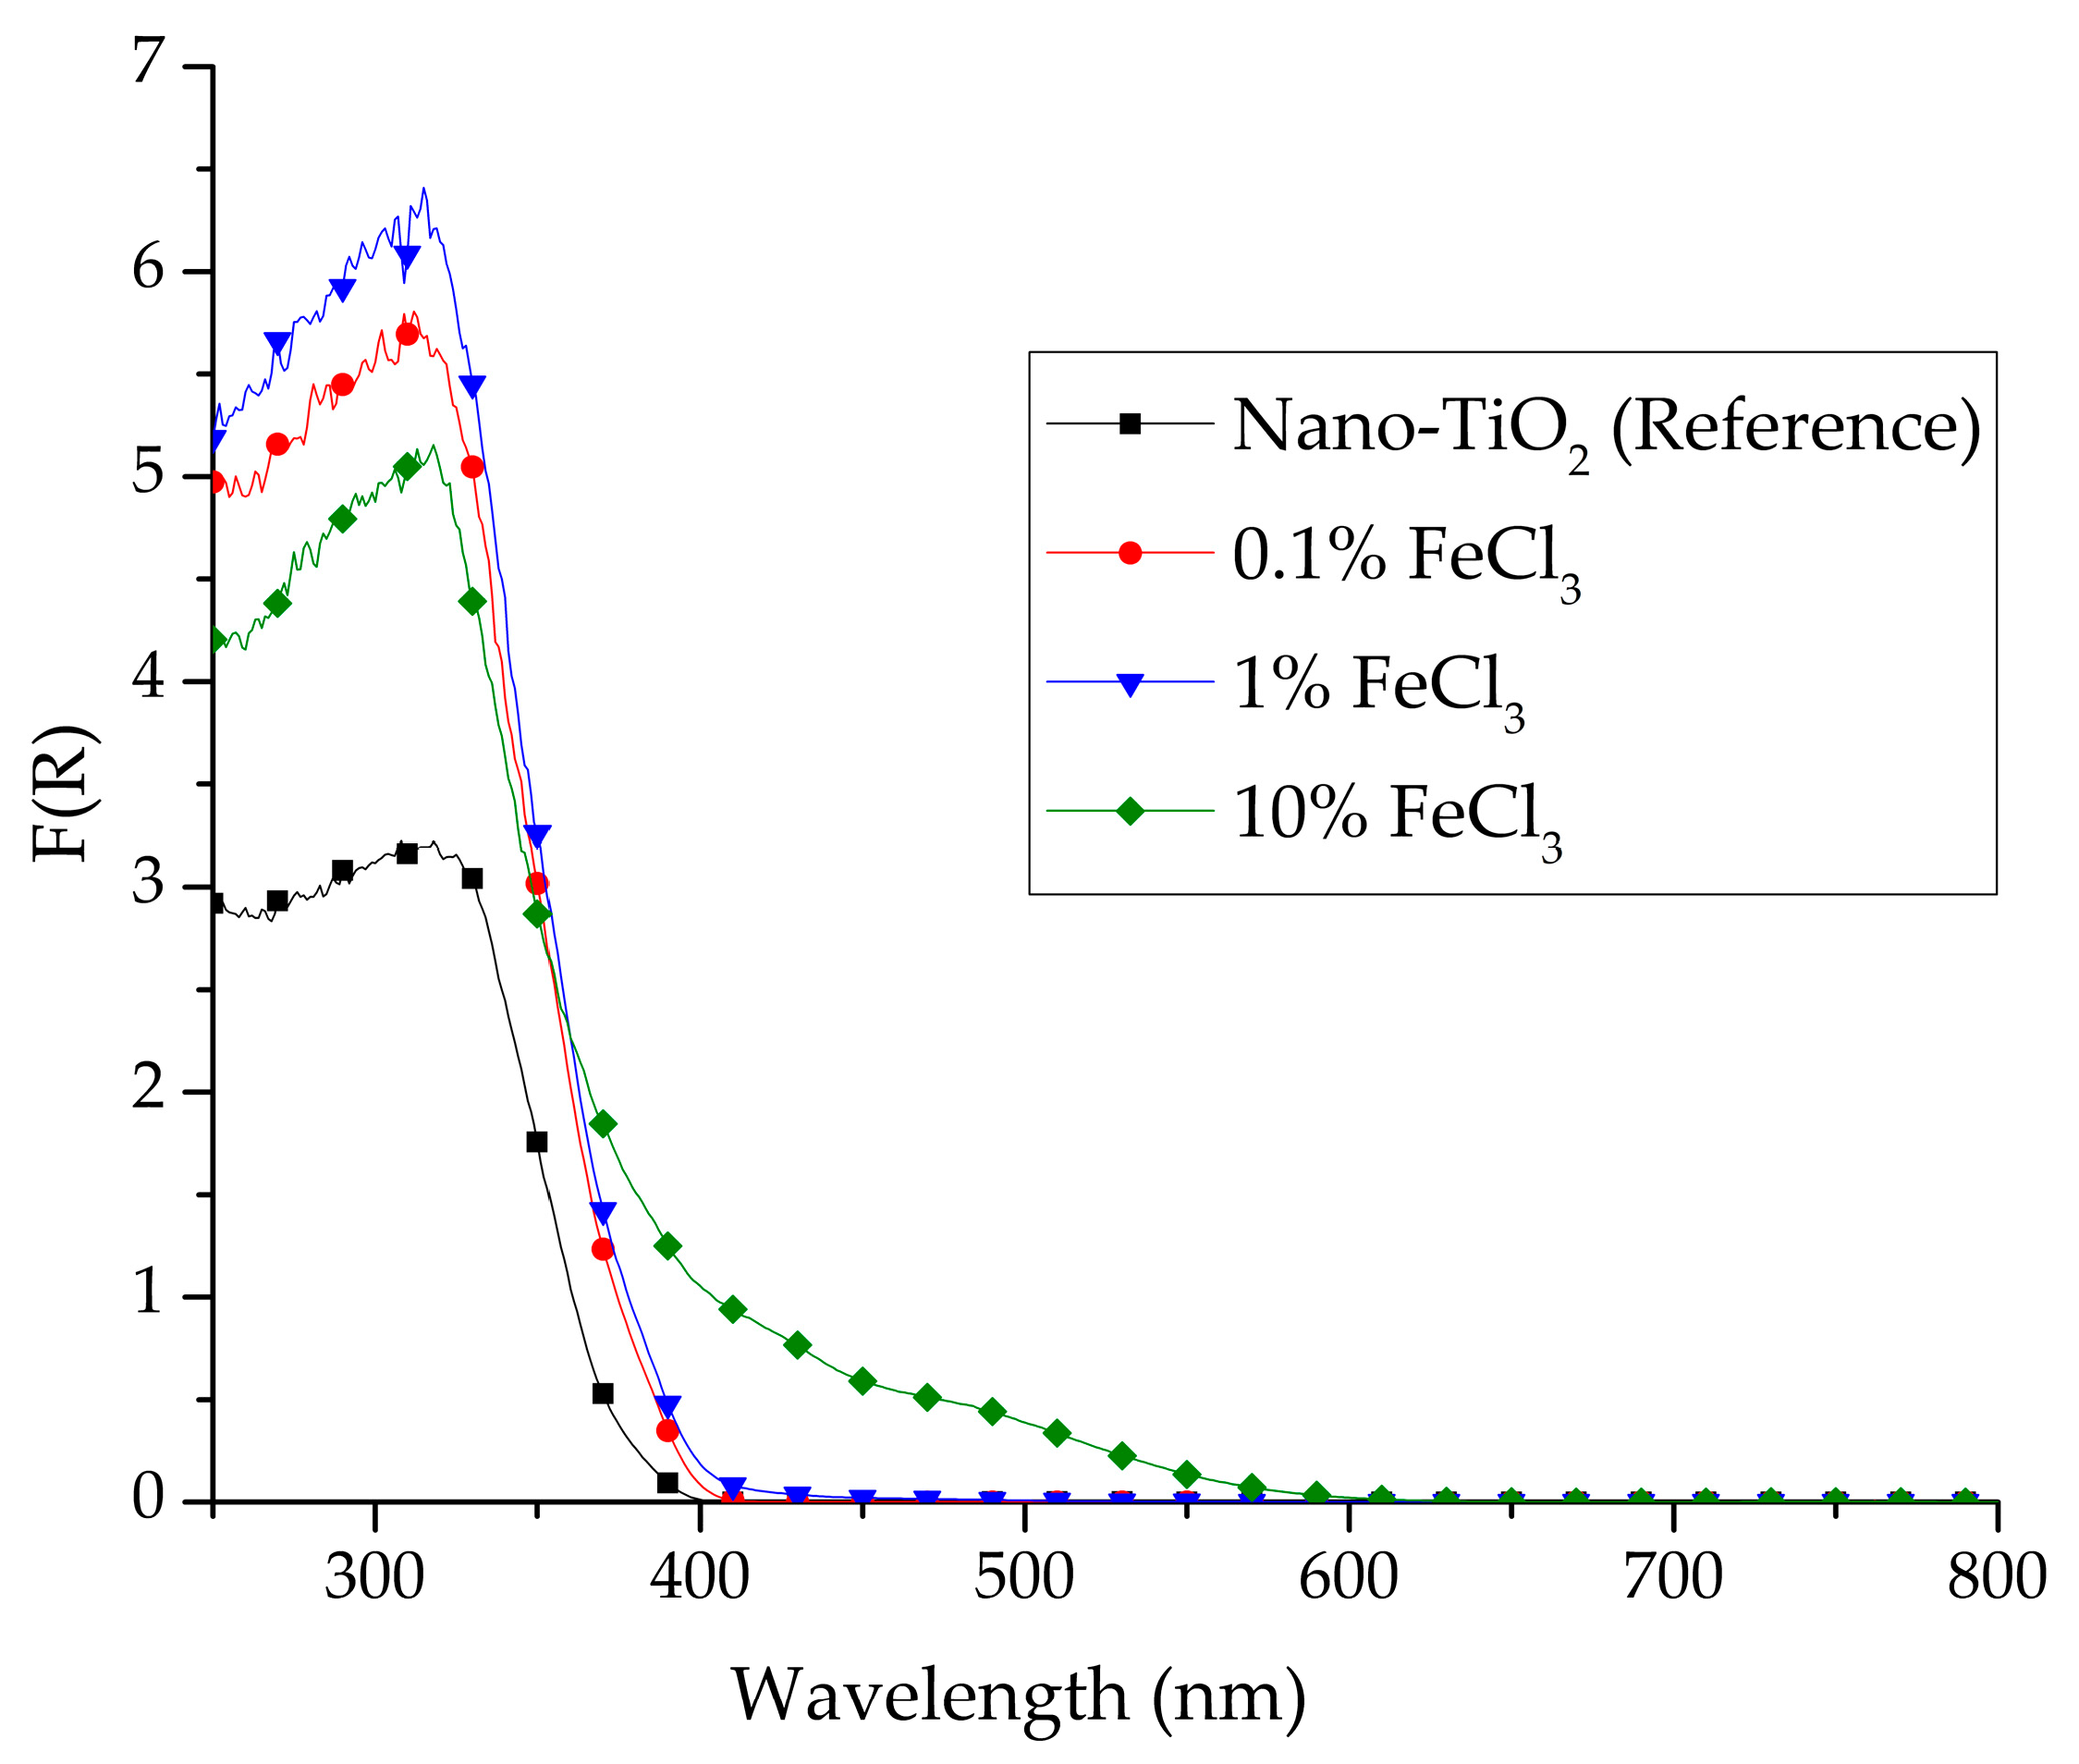
Figure 1. Kubelka–Munk absorbance spectra of TiO2 (reference) and TiO2 modified with 0.1, 1, and 10% of FeCl3.
Photonics 11 00888 g001
Figure 2. Band gap energy of TiO2 (Reference) and TiO2 modified with 0.1, 1, and 10% of FeCl3.
Photonics 11 00888 g002
Figure 3. SEM micrographs of (a) TiO2 (Reference) and TiO2 modified with (b) 0.1% FeCl3, (c) 1% FeCl3 (1%), and (d) 10% FeCl3.
Photonics 11 00888 g003
Figure 4. EDS spectra of (a) TiO2 (reference) and TiO2 modified with (b) 0.1% FeCl3, (c) 1% FeCl3 (1%), and (d) 10% FeCl3.
Photonics 11 00888 g004
Figure 5. X-ray diffraction patterns of TiO2 (reference) and TiO2 modified with 0.1, 1, and 10% of FeCl3.
Photonics 11 00888 g005
Figure 6. The photocatalytic efficiency of TiO2 (reference) and TiO2 modified with 0.1, 1, and 10% of FeCl3.
Photonics 11 00888 g006
Table 1. The crystallite size of TiO2 (reference) and TiO2 modified with 0.1, 1, and 10% of FeCl3.
CompositionCrystallite Size (nm)
AnataseRutile
Nano-TiO221.1326.39
0.1% FeCl323.5740.07
1% FeCl325.3529.57
10% FeCl323.1927.76
Table 2. Lattice parameters of TiO2 (reference) and TiO2 modified with 0.1, 1, and 10% of FeCl3.
CompositionLattice Parameters (Å)
AnataseRutile
acac
Nano-TiO23.799.524.592.96
0.1% FeCl33.789.084.572.95
1% TiO23.779.194.572.95
10% FeCl33.769.304.562.95
Table 3. Unit cell volume and weight fraction of anatase of TiO2 (reference) and TiO2 modified with 0.1, 1, and 10% of FeCl3.
CompositionUnit Cell Volume (Å3)XA
AnataseRutile
Nano-TiO2136.7362.4973.36
0.1% FeCl3129.7061.7974.73
1% FeCl3130.6861.6272.71
10% FeCl3131.7161.1868.81
Disclaimer/Publisher’s Note: The statements, opinions and data contained in all publications are solely those of the individual author(s) and contributor(s) and not of MDPI and/or the editor(s). MDPI and/or the editor(s) disclaim responsibility for any injury to people or property resulting from any ideas, methods, instructions or products referred to in the content.