Abstract
This paper demonstrates a five-layer InAs/InP quantum-dash semiconductor optical amplifier (QDash-SOA), which will be integrated into microwave-photonic on-chip devices for millimeter-wave (mmWave) over fibre wireless networking systems. A thorough investigation of the QDash-SOA is conducted regarding its communication performance at different temperatures, bias currents, and input powers. The investigation shows a fibre-to-fibre (FtF) small-signal gain of 18.79 dB and a noise figure of 6.3 dB. In a common application with a 300 mA bias current and 25 °C temperature, the peak FtF gain is located at 1507.8 nm, which is 17.68 dB, with 3 dB gain bandwidth of 56.6 nm. Furthermore, the QDash-SOA is verified in a mmWave radio-over-fibre link with QAM (32 Gb/s 64-QAM 4-GBaud) and OFDM (250 MHz 64-QAM) signals. The average error vector magnitude of the QAM and OFDM signals after a 2 m wireless link could be as low as 8.29% and 6.78%, respectively. These findings highlight the QDash-SOA’s potential as a key amplifying component in future integrated microwave-photonic on-chip devices.
1. Introduction
With the proliferation of applications such as the Internet of things, autonomous vehicles, video streaming, and artificial intelligence, the challenges of low latency and high bitrate have emerged as significant hurdles for modern wireless-communication systems [1]. In 5G-and-beyond wireless networking systems, millimeter-wave (mmWave) bands (25–300 GHz) are considered a remedy to alleviate the congestion in the traditional sub-6 GHz radio frequency (RF) band. Therefore, in 5G new radio, frequency bands above 24.25 GHz are standardized as frequency range 2 to significantly increase the signal bandwidth, resulting in an ultra-high bitrate and low latency [1]. However, the inherent high attenuation of mmWave signals necessitates the proliferation of base stations. In addition, generating mmWave electrically is costly and power-consuming, demanding the processing of all modulation components at frequencies exceeding 30 GHz [2]. To address these challenges, optical mmWave generation, known as mmWave over fibre, has been proposed and developed as a promising solution [2]. Currently, most of the optical mmWave generation systems are built-up with separate RF and optical components, which contain laser sources, optical couplers, RF amplifiers, erbium-doped fibre amplifiers (EDFAs), optical modulators, and optical filters. To further integrate separate components, using integrated microwave-photonics on a chip is proposed [3,4]. On-chip optical filters [5] and modulators [6] have been reported over the past decade. For such small-scale on-chip devices, it is hard to fit an EDFA into the system. Therefore, semiconductor optical amplifiers (SOAs) have been considered as a potential solution thanks to their chip-level size and energy efficiency [7].
In a semiconductor optical amplifier, non-linear effects such as cross-talk, pattern effects, and strong phase fluctuations are driven by interactions that occur through both the optical field and the charge-carrier distribution [7,8,9,10]. These non-linear effects result in performance degradation when going from a single optical channel to multichannel amplification networking systems. The use of quantum dashes/dots (QDs) as the gain medium, rather than the more conventional quantum well (QW), can help overcome these phenomena. The charge carriers in the QD gain medium are confined in three dimensions to individual QDs, resulting in a significant reduction in the interactions between the QDs throughout the charge-carrier distribution [11,12]. Thus the gain medium can be considered as a collection of weakly interacting independent emitters, an inhomogeneously broadened gain medium [7,13,14]. This effect, combined with QD size fluctuations, can result in an increase in gain bandwidth, and can reduce the phase noise, pattern effects, and crosstalk between different wavelength channels [7,13,14]. Therefore, the QD-SOA is more suitable than a QW-SOA for optical multichannel communication applications. The advantage of the QD-SOA, especially its small non-linear effect, has been proven in system experiments with a single-phase-modulated signal [15], ultra-wideband non-return-to-zero signal [16], and wavelength division multiplexed phase-modulated signal [17]. The performance of the QD-SOA is also compared with conventional SOAs in [16,17], in which it shows significant advantages, provided by the low cross-gain/phase modulation in QD-SOA.
With all these advantages, QD-SOAs have become a popular research topic. Theoretical research on QD-SOAs has been reported regarding the carrier dynamics [8], gain/noise saturation [18], non-linear effects [19], gain-clamping [20], and emission characteristics [21]. Furthermore, the physics studies of the QD gain medium has also been conducted in the past decades [22,23]. In addition to these theoretical studies, many QD-SOAs have been fabricated and measured experimentally. In [24], researchers report an O-band QD-SOA with an ultra-wide gain bandwidth of 100 nm, which achieved a chip gain of 20 dB. A small-signal chip gain of 25 dB was reported in [25], centered at 1450 nm with a minimum noise figure (NF) of 6.1 dB. In [26], researchers demonstrated a QD-SOA with a minimum polarization-dependent chip gain of 25 dB over a 110 nm wavelength range centered at 1520 nm. A more recent work reported in [27] presented a QD-SOA with a 22 dB polarization-independent fibre-to-fibre (FtF) gain centered at 1550 nm. The highest chip gain is reported in [28], where the chip gain is measured to be 35 dB at a 400 mA bias current with 15 dB coupling loss per face, and the calculated NF is reported as 4.59 dB. The temperature stability of QD-SOAs was also investigated. In [29], a QD-SOA was measured at 82 °C, which showed a small-signal gain of 20 dB at 1599 nm. This kind of temperature-stable QD-SOA requires a specific structure or material, i.e., active multi-mode interferometer [30] or columnar-quantum-dot [31]. The reported QDash-SOA is mainly focus on common communication conditions around room temperature.
QD-SOAs have been widely used in different applications, such as a traditional waveguide amplifier [23] or reflective SOA [32]. Similar to other SOAs, QD-SOAs can also be used as wavelength shifters [33]. Furthermore, QD-SOAs are also reported to be used in digital-to-analog conversion [34], optical logical components [35], and variable optical delays [36]. In communication systems, QD-SOAs are proposed to be integrated with Mach–Zehnder modulators (MZMs) [37] and QD lasers [32].
Previously, in [12], we have reported and compared the performance of quantum-dash (QDash) SOAs with different numbers of QDash layers. These results showed that the eight-layer device had the highest gain and amplified spontaneous emission (ASE) power, but the ripple of the eight-layer QDash-SOA was also the highest. High ripple usually suggests a high residual reflection at the facet, which consequently leads to gain fluctuation in a communication system and significantly degrades its performance. Therefore, in this work, the five-layer QDash-SOA is measured in detail. We focus on the performance criteria of QDash-SOAs that highly affect communication applications. We measure the gain and NF through the S+C band (1460–1565 nm) at different temperatures and bias currents. Furthermore, we also verify the use of the QDash-SOA in a heterodyne-detected mmWave over fibre wireless-communication system. The performance results show that the QDash-SOA has a wide gain wavelength range, up to 62.8 nm, a flat gain spectrum, and a low NF. In the communication system, the average error vector magnitude (EVM) of a 32 Gb/s 16-QAM and OFDM signal after a 2 m wireless link can be as low as 8.29% and 6.78%, respectively.
2. SOA Structure and Measurement Methods
2.1. Structure of the QDash-SOA
The QDash-SOA used in this work is an InP-based waveguide which is tilted 7° to the longitude direction of the chip to minimize facet reflection [12]. The SOAs were grown using Chemical Beam Epitaxy (CBE) on (001) InP substrates; growth details are given in ref. [38]. A core containing QDashes rather than QDots was used for these studies, although similar performance would be expected from Qdot-based devices, as seen for our laser structures [39]. Multilayer TiO2/SiO2 antireflection coatings were applied on both facets of the QDash-SOA, resulting in a <10−4 TE mode reflectivity [12]. The reflectivity of the TM mode is slightly higher than in TE mode, still less than 10−4. The top view of the QDash-SOA is shown in Figure 1a, with 3 QDash-SOA devices, while the whole bar contains 15 identical devices. The dimension of a single QDash-SOA chip is 1.5 mm × 0.8 mm × 0.1 mm. The cross section structure of the chip is shown in Figure 1b, and the active region of the QDash-SOA contains five layers of InAs QDashes with 10 nm In0.816Ga0.184As0.392P0.608 (1.15Q) barriers in a 350 nm thick 1.15Q core. The average QDash density in each active layer is around 1.5 × 1010 cm−2 [40]. The composition of InGaAsP was chosen to have a photoluminescence peak of 1.15 µm at 300 K. Figure 1c,d show the scanning electron microscope (SEM) image of the cross section and top view of QDash layer. This QDash structure provides both carrier and optical confinement. The design and fabrication details of the QDash-SOA are described in [11].

Figure 1.
(a) Top view of QDash-SOA devices. (b) Cross section structure of QDash-SOA. (c) SEM image of cross section around QDash layers (scale bar is 200 nm). (d) SEM image of top view of a typical QDash layer (scale bar is 300 nm).
2.2. Measurement Methods
Figure 2a shows a block diagram of the measurement system. As the core component of the system, the QDash-SOA bar is mounted onto a gold-plated copper carrier on a central post to provide mechanical support, as shown in Figure 2b. The bottom of the QDash-SOA chip is the ground, which is placed on the gold-plated mounting. The top metal contact of the chip is used as the bias point. Two metal probes are used to bias the device, two lensed fibres are used to couple the laser into and amplify the signal out of the measured device. As the waveguide of the QDash-SOA is tilted 7°, the device and its mount are rotated anticlockwise by 26° so the input and output beam can be parallel to the lensed fibres after refraction at the facet/air interface. A semiconductor temperature controller is integrated into the mount to maintain the QDash-SOA at the desired temperature during measurement. An ILX LDC-3722 laser controller is used to control the bias current and temperature of the device.

Figure 2.
(a) Block diagram of the QDash-SOA measurement system (Figure 2 of ref [12]). (b) Picture of the QDash-SOA holder and lensed fibres.
For the system, an Agilent 81682A tunable laser is used as a seed laser during the gain and NF tests. Then, the laser is coupled into the QDash-SOA by the input fibre. After amplification, the laser is received by the output fibre. To minimize back reflections from the amplified signal, a two-stage polarization-maintained (PM) isolator is added after the output fibre. A PM coupler is added afterward, 10% of the laser is detected by a Thorlab PM100D to monitor the power in real-time and 90% of the laser is measured by a Yokogawa AQ6380 optical spectrum analyzer (OSA). A computer is connected to the tunable laser, laser controller, and OSA to automatically control all the equipment with Python through the virtual instrument software architecture (VISA) protocol [41].
In this work, we mainly focused on the performance of our QDash-SOA as part of a communication system. All the gain and NF in this work is based on the FtF measurement. Before the measurement, we first determined the reference optical power without the QDash-SOA, i.e., directly connecting Point 1 and Point 2 in Figure 2a. The seed laser generates an input signal at the desired power with the wavelength being swept from 1460 nm to 1565 nm with a step size of 0.2 nm. The OSA records the output of the optical coupler and determines the peak power during each sweep step. The peak power spectrum density and its corresponding wavelength is recorded. We designate these data as Pref(λ) in dBm, which includes the power and loss information of the system in terms of wavelength. Figure 3 shows the reference power with a seed laser power of −10 dBm. There was about a 1.5 dB difference throughout the S+C band.
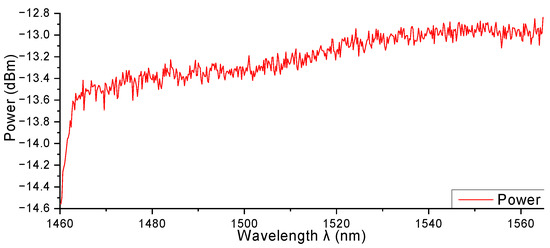
Figure 3.
Reference power of the system without SOA.
After we obtained the reference power, the QDash-SOA is added back to the system. The laser controller sets the temperature and bias current of the QDash-SOA to the desired value. Once the QDash-SOA is stabilized, the tunable laser generates a seed laser signal at the desired power and is swept from 1460 nm to 1565 nm with a step size of 0.2 nm. The seed laser is amplified by the SOA and then analyzed at the OSA. The spectrum at each laser input wavelength during the sweep was recorded in the OSA. An example of recorded power spectrum density is shown in Figure 4. The peak power and its wavelength are recorded as Pout(λ) in dBm. The ASE around the peak is also recorded as PASE(λ) in dBm, which is the average of four points around the peak power, separated by 0.2 nm. With the Pout(λ) and PASE(λ), we can calculate the optical signal-to-noise ratio (OSNR) at each wavelength, denoted as OSNR(λ), in dB:
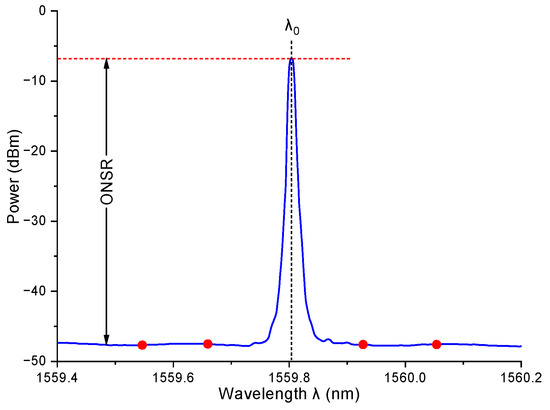
Figure 4.
An example of recorded power spectrum density during gain and NF measurement.
With Pref(λ) and Pout(λ), the gain of the QDash-SOA for a given bias current and temperature can be calculated by
where G(λ) is the gain in dB of the QDash-SOA at wavelength λ.
The NF is calculated based on the PASE(λ) and G(λ) with following formula:
where is Planck’s constant (6.626 × 10⁻³⁴ J∙s), is the resolution of OSA, and c is the speed of light in vacuum. In this measurement, the resolution is set to = 0.01 nm.
3. Results and Discussion of Device Measurement
3.1. Polarization Dependency of QDash-SOA
The reported QDash-SOA is highly polarized. The extinction ratio of ASE power is −18.8 dB. The relation between ASE power and polarization is shown in Figure 5a. The relation between ratio of ASE power and different polarization is shown in Figure 5b.
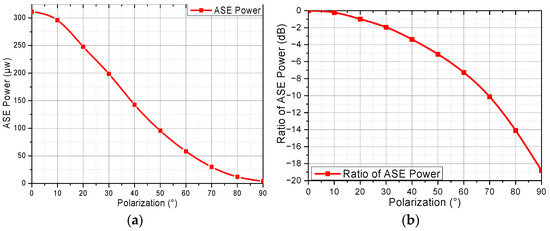
Figure 5.
The (a) ASE power and (b) ratio of ASE power of QD-SOA at different polarization.
The gain of QDash-SOA is also highly polarization-dependent. The extinction ratio of gain is −19.4 dB. The relation between gain and polarization is shown in Figure 6.
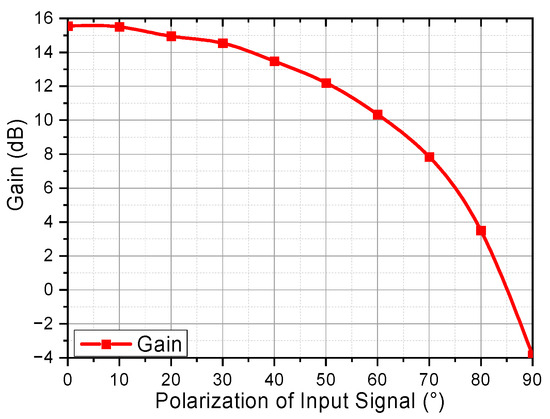
Figure 6.
The gain of QDash-SOA at different polarization.
The result shows that the QDash-SOA is highly polarization-dependent. There is almost no gain or ASE at the fast axis.
3.2. Fundamental Scenario: 20 °C, 300 mA Bias Current
During the measurement, we captured the output data of QDash-SOA with different temperatures, bias currents, input powers, and input wavelengths. It is difficult to cover all the details of each scenario in this paper. Therefore, we will discuss the performance at a temperature of 20 °C and 300 mA bias current in detail as a fundamental scenario. For other scenarios, we will summarize the data and compare some of them to the fundamental scenario to demonstrate the influence of temperature and bias current.
Figure 7a shows the overall ASE output of the QDash-SOA without input; the peak ASE is found at 1506.6 nm with a power of −35.91 dBm. The 3 dB bandwidth of the ASE is 57.3 nm, from 1534.5 nm to 1477.2 nm. Figure 7b shows a zoomed-in ASE spectrum around the ASE peak. The ripple of this device is about 0.2 dB, and the distance between two ripple peaks is 0.21 nm. From this value, the cavity length of QDash-SOA can be calculated by
where and are the wavelengths of two adjacent ripple peaks, and is the effective refractive index of the QDash-SOA. The measured refractive index is = 3.22. Therefore, the cavity length is calculated to be 1.46 mm, in agreement with the length of QDash-SOA waveguide (see Figure 1a). In addition, from the ripple, the residual reflectivity is also calculated to be 0.0062 by using the transmittance function of the etalon. This is higher than the theoretical value of the AR coating, caused by the reflection of the lensed fibre.
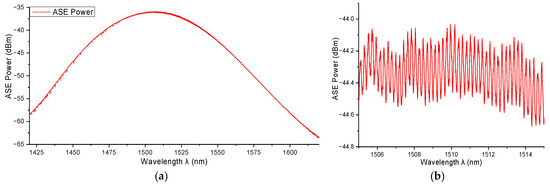
Figure 7.
(a) The overall ASE output of QDash-SOA. (b) Zoomed-in ASE spectrum around ASE peak.
Figure 8a shows the gain through the S+C bands (1460–1565 nm) for different input powers. For a small-signal scenario (−20 dBm input), the peak gain is found to be 17.7 dB at 1507.8 nm. Considering the coupling loss is measured to be 3.2 dB/facet, the maximum chip gain will be 24.1 dB at 1507.8 nm. However, the coupling loss measurement included a large-area optical meter for total power and a regular optical meter for coupled power. Although we had calibrated two meters to minimize the error, the final result of coupling loss is still an estimate. Compared with the peak of ASE, there is a 1.2 nm red shift in the gain peak. The 3 dB gain bandwidth is 56.6 nm, from 1481.6 nm to 1538.2 nm. Compared with the ASE, the 3 dB bandwidth is reduced by 1.6 nm. Figure 8b shows the OSNR versus wavelength for different input powers. In a small-signal scenario, the OSNR can be up to −45.8 dB. Figure 8c shows the NF versus wavelength with different input power. In a small-signal scenario, the NF can be as low as 6.3 dB. The chip NF can be further reduced to 3.1 dB if the coupling loss is considered. From Figure 8b,c, it shows that with the increase in the input power, the OSNR will decrease almost linearly in dB and the NF would be almost the same if the input power was lower than −5 dBm. This is caused by the saturation of the QDash-SOA. With the increasing of the input power, more stimulated electrons within the QDash gain medium will contribute to the input photon. Therefore, the electrons contributing to the spontaneous emission will be reduced. Although the gain is reduced and the ASE noise is also reduced, the NF remains similar. However, if the input signal is high enough to the saturation level, most of the stimulated electrons have already been contributed to the input photon, and further increasing input power will not reduce the ASE noise. Therefore, the NF will increase after the material is fully saturated. This phenomenon can be found in other QD-SOAs [15].

Figure 8.
The (a) FtF gain, (b) OSNR, and (c) NF of the QDash-SOA versus wavelength for different input powers.
Figure 9a shows the relationship between input power and gain. Two wavelengths, 1507.8 nm and 1550.0 nm, are considered, where 1507.8 nm is the peak of the gain and 1550.0 nm is the most common wavelength used in communication. Figure 9b shows the relationship between input power and NF. The result shows that with higher input power, the gain will reduce due to saturation; the 1 dB gain compression power at 1550 nm and 1507.8 nm is around −4.5 dBm and −12.5 dBm, respectively. As for NF, when the input power is lower than −5 dBm, the NF is almost the same.
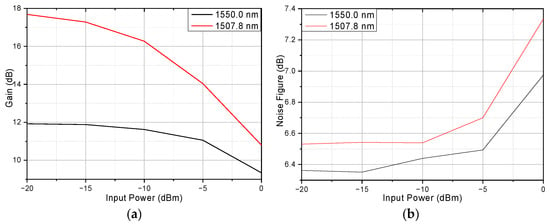
Figure 9.
The (a) FtF gain and (b) NF of the QDash-SOA versus input laser power at the peak gain wavelengths (1507.8 nm and 1550.0 nm).
3.3. The Influence of Bias Current
In these series of measurements, the temperature of the QDash-SOA is kept at 20 °C while the bias current is changed from 150 mA to 400 mA. Figure 10 shows the ASE output at different bias currents. It shows that with the increase in the current, the center frequency of ASE is blue shifted from 1518.7 nm to 1479.1 nm, and the 3 dB bandwidth of the ASE is also increased from 53.7 nm to 77.6 nm. The ripple of the QDash-SOA also increases with higher bias current, from 0.2 dB at 150 mA to 0.8 dB at 400 mA.
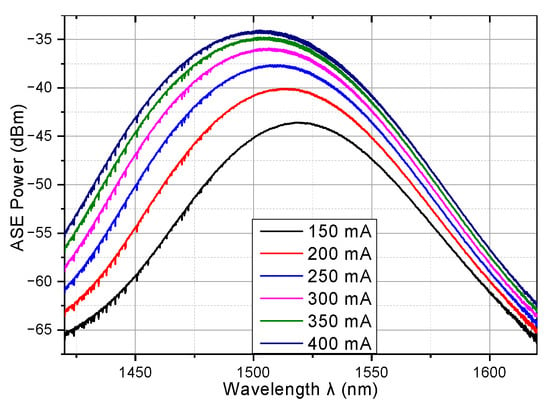
Figure 10.
The ASE output of the QDash-SOA at different bias currents.
To further verify the influence of bias current, the gain, OSNR, and NF at different bias currents are also measured with a small input signal (−20 dBm). Figure 11a shows that with increasing bias current, the gain is increased. However, the gain only slightly increases when the current is increased from 350 mA to 400 mA, which suggest the bias limitation of the QDash-SOA is around 400 mA. This is caused by excess heat produced under higher bias current that cannot dissipate fast enough to allow temperature control, leading to a lower gain increase. Figure 11b shows the OSNR of the QDash-SOA at different bias currents. As the gain is low when the bias current is set to 150 mA or 200 mA, the OSNR is relatively poor in these two conditions, especially at a lower wavelength. When the bias current is higher than 250 mA, the OSNR increases slightly at lower wavelengths, and is almost the same at higher wavelengths. Figure 11c shows the NF versus wavelength at different bias currents, which shows a similar tendency compared with OSNR. Table 1 summarized the 3 dB gain bandwidth and peak gain wavelength at different bias currents. It shows that with the increase in bias current, the peak gain wavelength is blue shifted and the 3 dB gain bandwidth is increased.

Figure 11.
The (a) FtF gain, (b) OSNR, and (c) NF of the QDash-SOA versus wavelength for different bias currents.

Table 1.
The peak gain wavelength and 3 dB bandwidth at different bias currents.
The gain and NF for different input powers at each bias current was also measured through the C+S bands. However, to simplify the analysis shown here, we chose to show only the gain and NF at the peak gain wavelength and 1550.0 nm for each bias current. Figure 12a,b show the gain and NF of the QDash-SOA versus input power at the peak gain wavelength, as shown in Table 1. Figure 13a,b show the gain and NF of the QDash-SOA versus input power at 1550.0 nm, respectively. It is clear that the gain increases with the increasing bias current at both peak gain wavelength and 1550.0 nm. As for the NF, 300 mA and 350 mA bias current have the lowest NF at peak gain wavelength. As 1550.0 nm is outside the 3 dB gain bandwidth, the NF does not have a clear tendency with regards to bias current.
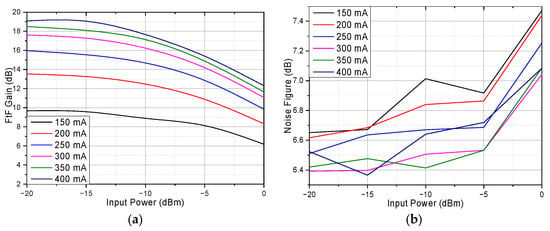
Figure 12.
The (a) FtF gain and (b) NF of the QDash-SOA versus input power at peak gain wavelength.
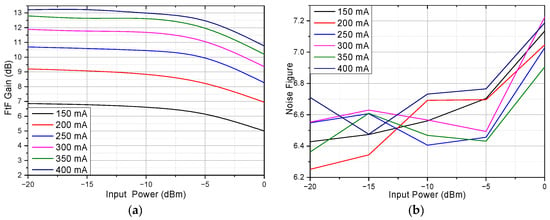
Figure 13.
The (a) FtF gain and (b) NF of the QDash-SOA versus input power at 1550.0 nm.
3.4. The Influence of Temperature
In this series of measurements, the current is kept at 300 mA while the temperature of the QDash-SOA is changed from 15 °C to 40 °C. Figure 14 shows the ASE output of the QDash-SOA at different temperatures. It shows that with the increase in temperature, the ASE power is decreased, the center frequency of the ASE is red shifted from 1503.9 nm to 1523.6 nm, and the 3 dB bandwidth of the ASE is also increased from 56.3 nm to 63.7 nm. The ripple of the QDash-SOA is decreased with increasing temperature, from 0.9 dB at 15 °C to 0.2 dB at 40 °C, due to the drop in gain.
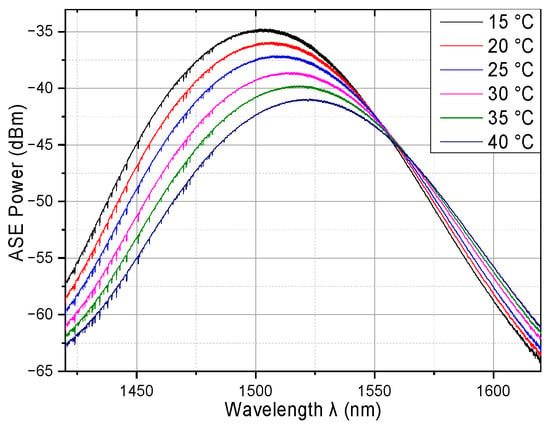
Figure 14.
The ASE output of the QDash-SOA at different temperatures.
To further verify the influence of temperature, the gain, OSNR, and NF at different bias currents were also measured with a small input signal (−20 dBm). Figure 15a shows that with the increase in temperature, the gain is decreased. Figure 15b shows the OSNR of the QDash-SOA for different temperatures. It clearly shows that with increasing temperature, the OSNR is reduced. Figure 15c shows the NF versus wavelength at different temperatures, which shows a similar tendency compared with OSNR, i.e., higher temperature leads to a higher NF. Table 2 summarized the 3 dB gain bandwidth and peak gain wavelength for different temperatures. It shows that with the increase in bias current, the peak gain wavelength increases and the 3 db gain bandwidth also increases.

Figure 15.
The (a) FtF gain, (b) OSNR, and (c) NF of QDash-SOA versus wavelength with difference temperatures.

Table 2.
Peak gain wavelength and 3 dB bandwidth at different temperatures.
The gain and NF for different input powers at each temperature are also measured through the C+S band. As before, we chose to show the gain and NF at peak gain wavelength and 1550.0 nm for each bias current. The peak gain wavelength is shown in Table 2. Figure 16a,b show the gain and NF of the QDash-SOA versus input power at the peak gain wavelength. Figure 17a,b show the gain and NF of the QDash-SOA versus input power at 1550.0 nm. It is clear that the gain decreases with increasing temperatures at both the peak gain wavelength and 1550.0 nm. Compared with the previously reported QD-SOA in [29], the gain compression caused by temperature increasing is similar at 1550.0 nm, which is 2.8 dB in [29] and 2.5 dB for this QDash-SOA. As for the NF, the measurements at 15 °C always have the lowest NF at the peak gain wavelength and 1550.0 nm. For other temperatures, it mainly follows the tendency that higher temperature leads to higher NF.
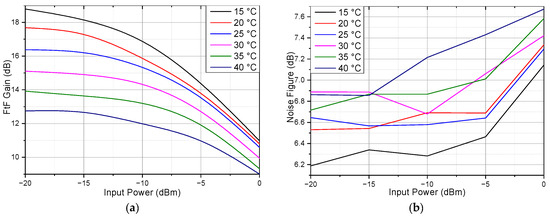
Figure 16.
The (a) FtF gain and (b) NF of the QDash-SOA versus input power at the peak gain wavelength.
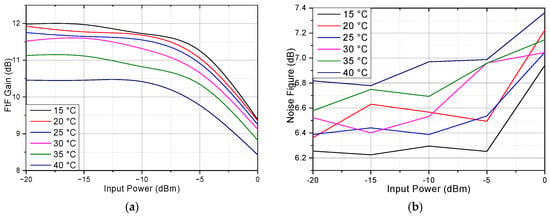
Figure 17.
The (a) FtF gain and (b) NF of the QDash-SOA versus input power at 1550.0 nm.
3.5. Discussion of Device Results
In this section, the performance of the QDash-SOA is investigated as part of a communication system. Given the measurements described in the earlier sections, we could estimate the characteristics of the QDash-SOA within a common communication system. In general, lower temperature, higher bias current, and lower input laser power will lead to higher gain and lower OSNR. However, the peak gain wavelength of the five-layer QDash-SOA is not located in the C band, which limits its potential in communication applications. The previously described eight-layer QDash-SOA could solve this problem, as the peak gain wavelength for this device is located in the C band under most conditions.
4. Heterodyne-Detected mmWave Radio-over-Fibre System Experimentation
4.1. System Setup
To further verify the performance of the QDash-SOA, it is integrated into the heterodyne-detected mmWave over fibre link shown in Figure 18. The laser source is a 29 GHz spaced multi-wavelength QDash-MLL, which is the same as the one used in [42]. Then, wavelengths are separated and filtered by a wave shaper (II-VI 16000A), filtering λ1 at 1543.476 nm and λ2 at 1543.248 nm into different branches. λ1 is amplified by optical amplifier 1 (OA1) and I/Q is modulated by an MZM SHF-46215B using a baseband QAM or OFDM I/Q signal generated by an arbitrary waveform generator (Keysight M8195A). To maintain an equal optical distance between λ1 and λ2, a delay line is introduced for λ2. Subsequently, a 50/50 optical coupler (OC) combines the two optical signals, which are then amplified by the OA2. The output undergoes heterodyne detection through a photonic detector (New Focus 1014). The received mmWave RF signal is subsequently amplified and transmitted over a 2 m wireless link. Finally, the received wireless signal is analyzed using an oscilloscope (Tektronix DPO73304SX). Two OAs in this system can be replaced by the QDash-SOA. However, due to the limitation of the current test bed, only one QDash-SOA can be applied into the system. We conduct two experiments that replace either OA1 or OA2 with the QDash-SOA the other OA was an EDFA (Amonics AEDFA-PA-35-B-FA).

Figure 18.
The block diagram of the heterodyne-detected mmWave over fibre system. (PC: polarization controller).
By replacing OA1 with the QDash-SOA, its basic functionality and compatibility is proven. In addition, it also proves that the reported QDash-SOA will not introduce extra phase fluctuation and will not affect coherence between two comb lines.
By replacing OA2 with the QDash-SOA, the low cross-gain/phase modulation of reported QDash-SOA can be proved. In this scenario, the optical input signal in the time domain of OA2 is
where and are the base band I/Q signals, corresponds to the wavelength of λ1, and and are the phase noises of carriers λ1 and λ2. Here, we assume there is no amplitude noise to simplify the calculation. The intensity of the signal at λ1 is
In the SOA, there will be cross-gain modulation. As λ2 is a CW laser without amplitude noise, it will not generate cross-gain/phase modulation. However, it will be affected by the power fluctuation of . The affected CW laser at λ2 will be
where G is the constant gain of QDash-SOA, is the coefficient of nth order cross-gain modulation, is the coefficient of the mth order cross-phase modulation. At the optical receiver, the combined signal is power-detected. The component located around the mmWave band will be
As the laser source is a QD-MLL, the phase noises and can cancel each other out, but the amplitude noise and phase noise introduced by cross-gain/phase modulation persist in the formula, which will degrade the performance of the system. The reported QDash-SOA has a small non-linear effect, and, hence, adequate performance.
4.2. System Results and Discussion
4.2.1. QDash-SOA at OA1
In this setup, the QDash-SOA is placed at OA1, which is before the MZM. The QDash-SOA is set at 20 °C and biased at 380 mA. The input power into the QDash-SOA at λ1 (1543.476 nm) is −9.50 dBm, resulting in a total output power of the QDash-SOA of 5.85 dBm, a gain of 14.35 dB. However, the MZM used in the system has a high attenuation (10 dB) and low modulation index. Therefore, the power of the modulated signal after MZM is low at −15.70 dBm, which leads to relatively poor performance. An EDFA is used as OA2, with a gain of 21.41 dB. We utilized a 16- and 64-QAM baseband signal at symbol rates of up to 6 GBaud, achieving a maximum bitrate of 32 Gb/s with a 4 GBaud 64-QAM signal.
The constellation of the received signal is shown in Figure 19. For the 16-QAM signal, the EVM of the received signal is 7.19%, 8.09%, and 10.20% for 2 Gbaud, 4 Gbaud, and 6 Gbaud, respectively. For the 64-QAM signal, the EVM of the received signal is 7.77% and 8.75% for 2 Gbaud and 4 Gbaud, respectively.
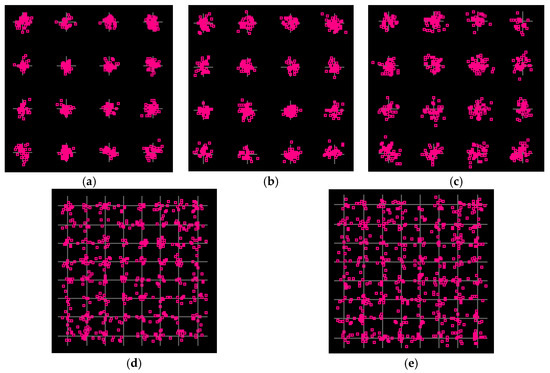
Figure 19.
The constellations of received signal of (a) 16-QAM 2 Gbaud, (b) 16-QAM 4 Gbaud, (c) 16-QAM 6 Gbaud, (d) 64-QAM 2 Gbaud, and (e) 64-QAM 4 Gbaud.
To further verify the performance of the QDash-SOA mmWave over fibre system, the OFDM signal is also transmitted. The total bandwidth is 250 MHz and the bandwidth of each subcarrier is 4 MHz. The constellation of the received signal is shown in Figure 20. The EVMs of the 16-QAM and 64-QAM OFDM are 7.27% and 7.35%, respectively, which are less than the 3GPP standard of 5G described in [43].
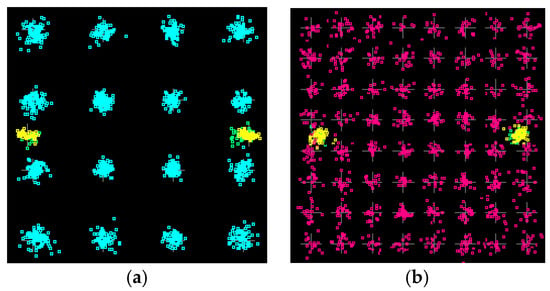
Figure 20.
The constellations of received signal of (a) 16-QAM OFDM and (b) 64-QAM OFDM.
4.2.2. QDash-SOA at OA2
In this setup, the QDash-SOA is placed at OA2, which is after the OC. As above, the QDash-SOA is set at 20 °C and biased at 380 mA. The input power of the QDash-SOA is −13.41 dBm, the total output power is 1.36 dBm, with a gain of 14.77 dB. An EDFA is used as OA1, with a gain of 24.41 dB. Therefore, in this scenario, the input power at the MZM is 14.91 dBm, which is high enough and leads to better performance. As before, we utilized 16- and 64-QAM baseband signals at symbol rates of up to 6 GBaud, achieving a maximum bitrate of 32 Gb/s with a 4 GBaud 64-QAM signal.
The constellations of the received signals are shown in Figure 21. For the 16-QAM signal, the EVM of the received signal is 6.48%, 7.93%, and 8.12% for 2 Gbaud, 4 Gbaud, and 6 Gbaud, respectively. For the 64-QAM signal, the EVM of the received signal is 6.62% and 8.29% for 2 Gbaud and 4 Gbaud, respectively.
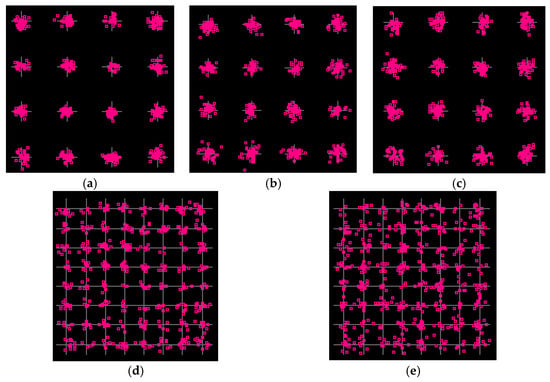
Figure 21.
The constellation of received signal of (a) 16-QAM 2 Gbaud, (b) 16-QAM 4 Gbaud, (c) 16-QAM 6 Gbaud, (d) 64-QAM 2 Gbaud, and (e) 64-QAM 4 Gbaud.
The same as the previous scenario, the OFDM signal is also transmitted. The total bandwidth is 250 MHz and the bandwidth of each subcarrier is 4 MHz. The constellation of the received signal is shown in Figure 22. The EVM of the 16-QAM and 64-QAM OFDM is 6.61% and 6.78%, respectively, which is still less than the 5G standard in both cases [43].
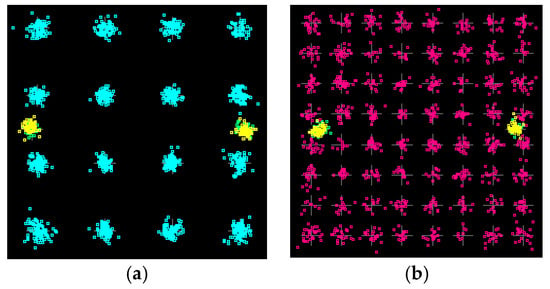
Figure 22.
The constellation of received signal of (a) 16-QAM OFDM and (b) 64-QAM OFDM.
A 10 km single-mode fibre (SMF) is also added to the system to prove the performance of the QDash-SOA after long distance transmission. The EVM is 7.52% and 9.36% for the 16-QAM 2 Gbaud and 4 GBaud signal after 10 km SMF transmission and 2 m wireless link. As for the OFDM signal, the EVM after 10 km SMF transmission is 7.91% and 8.33% for the 16-QAM and 64-QAM signal. These results proves that the performance of the QDash-SOA is adequate in a long-distance mmWave over fibre fronthaul transmission.
4.2.3. Discussion of System Results
In this section, we applied the QDash-SOA to a mmWave over fibre system. Due to the limitation of the QDash-SOA measurement system, we could only insert one QDash-SOA into the system at either OA1 or OA2. Compared with the EDFA-only system, the reported QDash-SOA has a compatible performance. For the 4 GBauds 16-QAM signal, the EVM of the EDFA-only system is 8.03% [2], while the EVM with reported the QDash-SOA can be as low as 8.29%. For the OFDM 16-QAM signal, the EVM of the EDFA-only system is 6.69%, while the EVM with the QDash-SOA can be as low as 6.78%. The results of the two scenarios prove that the QDash-SOA can replace an EDFA at any position within the system. The performance of the QDash-SOA is good enough regardless of the modulation method, and the EVM performance is better than the 3GPP limitation for 5G fronthaul transmission. These measurements show the strong potential of QDash-SOAs to be used in mmWave over fibre systems, especially if they can be integrated into an optical-photonic chip fronthaul system.
5. Conclusions
In this paper, a five-layer QDash-SOA was measured in detail through the S+C band (1460–1565 nm), focused on communication performance. The maximum gain was 18.79 dB, achieved at 20 °C and 400 mA. The NF could be as low as 6.2 dB. The influence of temperature and bias current was also investigated. The results show that with the increase in the bias current, the gain will increase, while the gain spectrum will blue shift and the 3 dB bandwidth will increase. With increasing temperature, the gain will decrease, while the gain spectrum will red shift, and the 3 dB bandwidth will also increase. These results show that the performance of the QDash-SOA is good enough to be a potential alternative to EDFAs in communication applications, especially integrated into laser-photonic chip systems.
To further verify the performance of the QDash-SOA, especially in a communication system, a series of experiments were conducted in a mmWave over fibre fronthaul transmission system. One of the OAs was replaced with the QDash-SOA. The result shows that with a 2 Gbaud 16-QAM signal, the EVM can be as low as 6.48% and the maximum bitrate of 32 Gb/s is achieved with a 4 Gbaud 64-QAM signal with an EVM of 8.29%. These results show that the QDash-SOA is capable in a mmWave over fibre system.
In conclusion, in this work, a QDash-SOA was verified in both characteristics and system performance, showing that the QDash-SOA is an alternative candidate for EDFAs and a key amplifying component in communication systems.
Author Contributions
Conceptualization, X.X., Y.M., Z.L., P.J.P., J.L. and J.Y.; methodology, X.X., Y.M., C.S., Z.L., P.J.P., J.L., M.T., Y.Q., G.L., P.B., D.P., P.M., J.W., P.Z., M.V., M.R., P.M. and X.C.; software, X.X. and M.V.; validation, X.X., Y.M., C.S., Z.L., P.J.P., J.L., D.P., P.M., J.W., M.V., M.R. and P.M.; formal analysis, Y.M., X.X., C.S., Z.L., P.J.P. and J.L.; investigation, X.X., Y.M., C.S., Z.L., P.J.P., J.L., P.B., D.P., P.M., J.W., M.R. and P.M.; resources, Z.L., P.J.P. and J.L.; data curation, X.X., Y.M., C.S., M.T., Y.Q., G.L., P.B., D.P., J.W., P.Z., M.V. and X.C.; writing—original draft, X.X.; writing—review and editing, X.Z., Z.L., X.X., Y.M., C.S., P.J.P., J.L., P.B., D.P. and A.A.; visualization, Y.M. and P.J.P.; supervision, Y.M., C.S., Z.L., P.J.P., J.L., A.A., X.Z. and J.Y.; project administration, Y.M., Z.L., J.L. and A.A.; funding acquisition, Z.L. and J.L. All authors have read and agreed to the published version of the manuscript.
Funding
This research was funded by NRC-QN’s internal research project NRC-QN-A1-024159-01.
Institutional Review Board Statement
Not applicable.
Informed Consent Statement
Not applicable.
Data Availability Statement
Data are unavailable due to restrictions.
Acknowledgments
The authors would like to acknowledge the Canadian Photonics Fabrication Center (CPFC) of NRC and the Advanced Technology Fabrication (ATF) Group in Quantum and Nanotechnolgies (QN) Research Centre of NRC for the material growth and device fabrication.
Conflicts of Interest
Author Ahmad Atieh is employed by the company Optiwave Systems Inc. The remaining authors declare that the research was conducted in the absence of any commercial or financial relationships that could be construed as potential conflicts of interest.
References
- Release 17 Description; Summary of Rel-17 Work Items, 3GPP. 2023. Available online: https://www.3gpp.org/specifications-technologies/releases/release-17 (accessed on 26 August 2024).
- Zeb, K.; Lu, Z.; Liu, J.; Mao, Y.; Liu, G.; Poole, P.J.; Rahim, M.; Pakulski, G.; Barrios, P.; Jiang, W.; et al. InAs/InP Quantum Dash Buried Heterostructure Mode-Locked Laser for High Capacity Fiber-Wireless Integrated 5G New Radio Fronthaul Systems. Opt. Express OE 2021, 29, 16164–16174. [Google Scholar] [CrossRef] [PubMed]
- Marpaung, D.; Yao, J.; Capmany, J. Integrated Microwave Photonics. Nat. Photon 2019, 13, 80–90. [Google Scholar] [CrossRef]
- Maram, R.; Kaushal, S.; Azaña, J.; Chen, L.R. Recent Trends and Advances of Silicon-Based Integrated Microwave Photonics. Photonics 2019, 6, 13. [Google Scholar] [CrossRef]
- Jiang, W.; Xu, L.; Liu, Y.; Chen, Y.; Liu, X.; Yi, J.; Yu, Y.; Zhang, X. Optical Filter Switchable Between Bandstop and Bandpass Responses in SOI Wafer. IEEE Photonics Technol. Lett. 2020, 32, 1105–1108. [Google Scholar] [CrossRef]
- Shao, S.; Hu, Z.; Xiao, Z.; Cao, G.; Zhu, X.; Wu, Y.; Feng, J.; Guo, J. 50 Gb/s Silicon Optical Modulators for Intra-Datacenter and On-Chip Optical Interconnect. In Proceedings of the 2020 Asia Communications and Photonics Conference (ACP) and International Conference on Information Photonics and Optical Communications (IPOC), Beijing, China, 24–27 October 2020; pp. 1–3. [Google Scholar]
- Sobhanan, A.; Anthur, A.; O’Duill, S.; Pelusi, M.; Namiki, S.; Barry, L.; Venkitesh, D.; Agrawal, G.P. Semiconductor Optical Amplifiers: Recent Advances and Applications. Adv. Opt. Photon. AOP 2022, 14, 571–651. [Google Scholar] [CrossRef]
- Zilkie, A.J.; Meier, J.; Mojahedi, M.; Poole, P.J.; Barrios, P.; Poitras, D.; Rotter, T.J.; Yang, C.; Stintz, A.; Malloy, K.J.; et al. Carrier Dynamics of Quantum-Dot, Quantum-Dash, and Quantum-Well Semiconductor Optical Amplifiers Operating at 1.55 μm. IEEE J. Quantum Electron. 2007, 43, 982–991. [Google Scholar] [CrossRef]
- Bramann, G.; Wunsche, H.-J.; Busolt, U.; Schmidt, C.; Schlak, M.; Sartorius, B.; Nolting, H.-P. Two-wave competition in ultralong semiconductor optical amplifiers. IEEE J. Quantum Electron. 2005, 41, 1260–1267. [Google Scholar] [CrossRef]
- Guan, A.; Fu, H.-L. Experiment study on reducing SOA induced crosstalk by CW light injection and dispersion management. In Proceedings of the Optical Transmission, Switching, and Subsystems VI, Hangzhou, China, 27–30 October 2008; Volume 7136, pp. 577–584. [Google Scholar]
- Poole, P.J.; Kaminska, K.; Barrios, P.; Lu, Z.; Liu, J. Growth of InAs/InP-based quantum dots for 1.55 μm laser applications. J. Cryst. Growth 2009, 311, 1482–1486. [Google Scholar] [CrossRef]
- Mao, Y.; Xie, X.; Song, C.; Lu, Z.; Poole, P.J.; Liu, J.; Toreja, M.; Qi, Y.; Liu, G.; Barrios, P.; et al. Performance Investigations of InAs/InP Quantum-Dash Semiconductor Optical Amplifiers with Different Numbers of Dash Layers. Micromachines 2023, 14, 2230. [Google Scholar] [CrossRef]
- Eyvazi, M.; Yadipour, R.; Rostami, A. All-Optical Broadband QDs Semiconductor Optical Amplifier (QDs-SOA): Inhomogeneous Broadening. IEEE Access 2024, 12, 47993–48003. [Google Scholar] [CrossRef]
- Bauer, S.; Sichkovskyi, V.; Eyal, O.; Septon, T.; Becker, A.; Khanonkin, I.; Eisenstein, G.; Reithmaier, J.P. 1.5-μm Indium Phosphide-Based Quantum Dot Lasers and Optical Amplifiers: The Impact of Atom-Like Optical Gain Material for Optoelectronics Devices. IEEE Nanotechnol. Mag. 2021, 15, 23–36. [Google Scholar] [CrossRef]
- Vallaitis, T.; Bonk, R.; Guetlein, J.; Hillerkuss, D.; Li, J.; Brenot, R.; Lelarge, F.; Duan, G.H.; Freude, W.; Leuthold, J. Quantum Dot SOA Input Power Dynamic Range Improvement for Differential-Phase Encoded Signals. Opt. Express OE 2010, 18, 6270–6276. [Google Scholar] [CrossRef] [PubMed]
- Boriboon, B.; Worasucheep, D.; Shimizu, S.; Shinada, S.; Furukawa, H.; Matsumoto, A.; Akahane, K.; Yamamoto, N.; Wada, N. Performances of Conventional SOAs Versus QD-SOA in 1530-nm Upstream Transmission of 40 Gb/s Access Network. IEEE Photonics J. 2022, 14, 7108912. [Google Scholar] [CrossRef]
- St-Arnault, C.; Bernal, S.; Gutiérrez-Castrejón, R.; Berikaa, E.; Wei, Z.; Rautert, J.; Poltavtsev, S.V.; Gubenko, A.E.; Belykh, V.V.; Mikhrin, V.S.; et al. Performance Comparison of QD-SOA, QW-SOA, Bulk-SOA and PDFA for Multi-Tbps O-Band WDM Links. In Proceedings of the Optical Fiber Communication Conference (OFC), San Diego, CA, USA, 24–28 March 2024; p. M3E.5. [Google Scholar]
- Hadass, D.; Bilenca, A.; Alizon, R.; Dery, H.; Mikhelashvili, V.; Eisenstein, G.; Schwertberger, R.; Somers, A.; Reithmaier, J.P.; Forchel, A.; et al. Gain and noise saturation of wide-band InAs-InP quantum dash optical amplifiers: Model and experiments. IEEE J. Sel. Top. Quantum Electron. 2005, 11, 1015–1026. [Google Scholar] [CrossRef]
- Zajnulina, M.; Lingnau, B.; Lüdge, K. Four-Wave Mixing in Quantum-Dot Semiconductor Optical Amplifiers: A Detailed Analysis of the Nonlinear Effects. IEEE J. Sel. Top. Quantum Electron. 2017, 23, 3000112. [Google Scholar] [CrossRef]
- Qasaimeh, O. Broadband Gain-Clamped Linear Quantum Dash Optical Amplifiers. Opt. Quantum Electron. 2013, 45, 1277–1286. [Google Scholar] [CrossRef]
- Gioannini, M. Numerical modeling of the emission characteristics of semiconductor quantum dash materials for lasers and optical amplifiers. IEEE J. Quantum Electron. 2004, 40, 364–373. [Google Scholar] [CrossRef]
- Huang, F.; Zhang, X. Impact of Excited States Transitions on Polarization Property of InAs/InP Quantum Dots. IEEE J. Quantum Electron. 2022, 58, 7100109. [Google Scholar] [CrossRef]
- Xia, M.; Ghafouri-Shiraz, H. Quantum Transmission Line Modeling Method and Its Application to Quantum Dot Amplifiers. IEEE J. Quantum Electron. 2016, 52, 5100107. [Google Scholar] [CrossRef]
- Liu, S.; Tong, Y.; Norman, J.; Dumont, M.; Gossard, A.; Tsang, H.K.; Bowers, J. High Efficiency, High Gain and High Saturation Output Power Quantum Dot SOAs Grown on Si and Applications. In Proceedings of the 2020 Optical Fiber Communications Conference and Exhibition (OFC), San Francisco, CA, USA, 30 March–3 April 2020; pp. 1–3. [Google Scholar]
- Lelarge, F.; Dagens, B.; Renaudier, J.; Brenot, R.; Accard, A.; van Dijk, F.; Make, D.; Gouezigou, O.L.; Provost, J.-G.; Poingt, F.; et al. Recent Advances on InAs/InP Quantum Dash Based Semiconductor Lasers and Optical Amplifiers Operating at 1.55 μm. IEEE J. Sel. Top. Quantum Electron. 2007, 13, 111–124. [Google Scholar] [CrossRef]
- Matsuura, M.; Raz, O.; Gomez-Agis, F.; Calabretta, N.; Dorren, H.J.S. Ultrahigh-Speed and Widely Tunable Wavelength Conversion Based on Cross-Gain Modulation in a Quantum-Dot Semiconductor Optical Amplifier. Opt. Express OE 2011, 19, B551–B559. [Google Scholar] [CrossRef] [PubMed]
- Farmani, A.; Farhang, M.; Sheikhi, M.H. High performance polarization-independent Quantum Dot Semiconductor Optical Amplifier with 22 dB fiber to fiber gain using Mode Propagation Tuning without additional polarization controller. Opt. Laser Technol. 2017, 93, 127–132. [Google Scholar] [CrossRef]
- Boriboon, B.; Worasucheep, D.; Matsumoto, A.; Akahane, K.; Yamamoto, N.; Wada, N. Optimized design of QD-LD toward QD-SOA to achieve 35-dB maximum chip gain with 400-mA injected current. Opt. Commun. 2020, 475, 126238. [Google Scholar] [CrossRef]
- Akahane, K.; Umezawa, T.; Matsumoto, A.; Yoshida, Y.; Yamamoto, N. High Temperature Operation of Quantum Dot Semiconductor Optical Amplifier for Uncooled 80 Gbps Data Transmission. In Proceedings of the Conference on Lasers and Electro-Optics, Online, 11–14 May 2020; p. AW3M.2. [Google Scholar]
- Fan, Z.; Hinokuma, Y.; Jiang, H.; Hamamoto, K. Active-MMI SOA on Quantum-Dots toward High Saturation Output Power under High Temperature. In Proceedings of the 2021 26th Microoptics Conference (MOC), Virtual, 26–19 September 2021; pp. 1–2. [Google Scholar]
- Sekiguchi, S.; Yasuoka, N.; Okumura, S.; Kawaguchi, K.; Ebe, H.; Morito, K.; Sugawara, M.; Arakawa, Y. Highly efficient columnar-quantum-dot semiconductor optical amplifier in high temperature condition. In Proceedings of the 2010 Conference on Optical Fiber Communication (OFC/NFOEC), Collocated National Fiber Optic Engineers Conference, San Francisco, CA, USA, 21–25 March 2010; pp. 1–3. [Google Scholar]
- Matsumoto, A.; Masuda, W.; Akahane, K.; Umezawa, T.; Yamamoto, N.; Kita, T. 1.55-μm Si-Photonics-Based Heterogeneous Tunable Laser Integrated with Highly Stacked QD-RSOA. In Proceedings of the 2021 Conference on Lasers and Electro-Optics (CLEO), Virtual, 9–14 May 2021; pp. 1–2. [Google Scholar]
- Connelly, M.J.; Krzczanowicz, L.; Morel, P.; Sharaiha, A.; Lelarge, F.; Brenot, R.; Joshi, S.; Barbet, S. 40 Gb/s NRZ-DQPSK Data Wavelength Conversion with Amplitude Regeneration Using Four-Wave Mixing in a Quantum Dash Semiconductor Optical Amplifier. Front. Optoelectron. 2016, 9, 341–345. [Google Scholar] [CrossRef]
- Itoh, T.; Sagara, M.; Matsuura, M. 40 Gb/s Operation of Photonic Digital-to-Analog Conversion Using Frequency Chirp in a QD-SOA. In Proceedings of the 2023 International Conference on Photonics in Switching and Computing (PSC), Mantova, Italy, 26–29 September 2023; pp. 1–3. [Google Scholar]
- Takemoto, T.; Tsuda, J.; Matsuura, M. All-Optical AND Logic Gate Using Filter-Sliced Frequency Chirp in a QD-SOA. In Proceedings of the 2022 27th OptoElectronics and Communications Conference (OECC) and 2022 International Conference on Photonics in Switching and Computing (PSC), Toyama, Japan, 3–6 July 2022; pp. 1–3. [Google Scholar]
- Martinez, A.; Aubin, G.; Lelarge, F.; Brenot, R.; Landreau, J.; Ramdane, A. Variable optical delays at 1.55 μm using fast light in an InAs/InP quantum dash based semiconductor optical amplifier. Appl. Phys. Lett. 2008, 93, 091116. [Google Scholar] [CrossRef]
- Ezra, Y.B.; Haridim, M.; Lembrikov, B.I.; Ran, M. Proposal for All-Optical Generation of Ultra-Wideband Impulse Radio Signals in Mach–Zehnder Interferometer With Quantum-Dot Optical Amplifier. IEEE Photonics Technol. Lett. 2008, 20, 484–486. [Google Scholar] [CrossRef]
- Poole, P.J.; Lu, Z.; Liu, J.; Barrios, P.; Mao, Y.; Liu, G. A Performance Comparison Between Quantum Dash and Quantum Well Fabry-Pérot Lasers. IEEE J. Quantum Electron. 2021, 57, 2500207. [Google Scholar] [CrossRef]
- Liu, G.; Poole, P.J.; Lu, Z.; Liu, J.; Song, C.-Y.; Mao, Y.; Barrios, P. Mode-Locking and Noise Characteristics of InAs/InP Quantum Dash/Dot Lasers. J. Light. Technol. 2023, 41, 4262–4270. [Google Scholar] [CrossRef]
- Lu, Z.; Liu, J.; Poole, P.J.; Mao, Y.; Weber, J.; Liu, G.; Barrios, P. InAs/InP Quantum Dash Semiconductor Coherent Comb Lasers and Their Applications in Optical Networks. J. Light. Technol. JLT 2021, 39, 3751–3760. [Google Scholar] [CrossRef]
- Grecco, H.E.; Dartiailh, M.C.; Thalhammer-Thurner, G.; Bronger, T.; Bauer, F. PyVISA: The Python Instrumentation Package. J. Open Source Softw. 2023, 8, 5304. [Google Scholar] [CrossRef]
- Liu, G.; Lu, Z.; Liu, J.; Poole, P.J.; Mao, Y.; Zeb, K.; Xie, X.; Vachon, M.; Barrios, P.; Song, C.; et al. Monolithic InAs/InP Quantum Dash Mode-Locked Lasers for Millimeter-Wave-Over-Fiber Mobile Fronthaul Systems. IEEE J. Sel. Top. Quantum Electron. 2023, 29, 1900110. [Google Scholar] [CrossRef]
- Noweir, M.; Zhou, Q.; Kwan, A.; Valivarthi, R.; Helaoui, M.; Tittel, W.; Ghannouchi, F.M. Digitally Linearized Radio-Over Fiber Transmitter Architecture for Cloud Radio Access Network’s Downlink. IEEE Trans. Microw. Theory Technol. 2018, 66, 3564–3574. [Google Scholar] [CrossRef]
Disclaimer/Publisher’s Note: The statements, opinions and data contained in all publications are solely those of the individual author(s) and contributor(s) and not of MDPI and/or the editor(s). MDPI and/or the editor(s) disclaim responsibility for any injury to people or property resulting from any ideas, methods, instructions or products referred to in the content. |
© 2024 by the authors. Licensee MDPI, Basel, Switzerland. This article is an open access article distributed under the terms and conditions of the Creative Commons Attribution (CC BY) license (https://creativecommons.org/licenses/by/4.0/).