Abstract
Laser drilling is widely used for fabricating holes in the semiconductor industry due to high throughput and a small heat-affected zone. However, it produces varying depths owing to uncertain external conditions and requires live control at the rate of a few tens of kHz to handle the fast material removal rate. Optical coherent tomography is capable of in situ acquiring a raw interferogram at a high rate (>80 kHz), but the depth extraction is slow due to the involved heavy Fast Fourier Transform (FFT). To address this, an efficient depth-tracking algorithm is proposed to save the FFT. It searches the depth in the raw interferogram locally with a known last depth given the two truths that only one depth exists and the adjacent depths do not change significantly. The proposed algorithm was proven to expedite the measuring rate six times with sub-pixel tracking precision. To further secure the rate against the interrupting of the system, the tracking process is parallelly implemented in a field-programmable gate array. The closed-loop control tests were conducted on probe cards with depth variations introduced by offsetting laser focus. The proposed method maintained a uniform depth, with variations reduced by 80% compared to traditional methods.
1. Introduction
The fast advances of electronic devices and microelectromechanical systems, particularly in terms of their miniaturization and the integration of emerging functions in a smaller package, demand new manufacturing methods able to meet the increasing requirements in terms of their dimensional precision, repeatability, and cost efficiency [1]. Micro holes are common features drilled in such devices and PCBs as microvias or for other critical functions. Vertical probe cards are a typical example that fabricates arrays of micro holes on silicon nitride substrates to support and position micro pins with high accuracy [2]. With the continuous development of chips, the holes on probe cards need to be manufactured with higher density to satisfy the constantly increasing functional requirements for these pins, i.e., smaller diameters and pitch distances, and geometrical accuracy, i.e., uniform hole depth. So, this translates into stringent technical requirements for controlled hole manufacturing quality while increasing the drilling speed in order to produce the holes cost-effectively.
In this context, laser micro drilling, particularly using short-pulsed lasers, offers significant advantages compared with alternative machining processes [3]. These advantages include high throughput, a small heat-affected zone (HAZ), a wide variety of materials that can be processed, contactless machining, and small beam diameters in the micron level range [4,5,6]. However, laser micro drilling may produce varying results owing to its inherent stochastic variations [7] and external environmental factors, especially the hole depth, which is sensitive to changes in mechanical factors such as the deformation of the processing board owing to heat accumulation in the system, and biases in processing parameters, such as an offset laser focus and laser optics wear. A tiny bias in the established processing sets would introduce deviation in the hole depth and diminish the high-volume manufacturing yield. A direct and efficient approach to addressing such an issue is to conduct live closed-loop control on the depth to achieve a uniform result.
Closed-loop control needs an in situ real-time depth measurement that captures the signal in the drilling site without any movement (in situ) and continuously processes incoming signal streams to provide immediate depth and feedback with minimal delay (real-time). The traditional measurement techniques for hole depth measurement include optical profilometry [8,9], white light interferometry [10,11], or scanning electron microscopy [12,13]; these techniques involve analyzing the surface profile or cross-sectional images of the probe card to determine the hole depth accurately. Recently, machine vision has also been adopted to measure the depth of a hole [14,15,16] by correlating the hole surface image with the hole depth using the machine learning method. Those techniques are post-process measurements that are conducted after the laser drilling process is complete; they can hardly be coupled into the laser head for an in situ real-time measurement due to the strong interruption of the processing beam radiation.
Efforts are being made in developing in-process monitoring methods that can be incorporated into laser drilling systems and sense the in situ real-time depth during the laser drilling process. The sensors typically capture the optical emission signal, sound, and low coherent light [17,18,19]. By correlating these signals with the depth of holes using analytical models [20] or machine learning methods [21], the hole depth can be estimated in real time and holds the potential to be controlled live. Ho [22] used the variation in light brightness from laser-induced plasma as an indicator to control laser percussion drilling. Through online plasma emission acquisition and analysis, they obtained a positive association between the increased depth and the optical signal output. Sun [21] detected the optical emission signal in the drilling process as the live signal and the drilling stage was determined through an analysis of the optical emission signal by using the established correlation between signal and drilling stages. Xie [23] captured the acoustic emission during the laser drilling process and created the relationships between the acoustic emission and the material removal rate, surface structure characteristics, and surface defects. Subasi [24] proposed a real-time measurement method based on acoustic signals, in which a correlation between ultra-sound emission and material removal, depending on the hole geometry, was created. Low coherent light is typically used in OCT as the probe light, which goes into the hole up to a couple of millimeters deep, along with the high-power laser beam, enabling simultaneous processing and monitoring. Webster et al. [21,25,26,27] coupled OCT into a laser processing head to image the percussion drilling of industrial materials in situ. They observed microsecond transients in sample morphology and attempted to conduct feedback control to overcome inherent stochastic variations. However, due to the heavy FFT processing task, the interrupted latency, and other delays inherent to desktop hardware and operating systems, the feedback was implemented by manually adjusting the number of incident pulses after a first trial. They designed a homodyne filtering that waits at a certain depth and terminates the laser to achieve a targeted depth [28].
Overall, the optical emission and sound-based methods are in situ real-time monitoring methods, but they are not direct measurements of the hole depth, resulting in limited precision. In addition, their correlations are not general and need to be recalibrated once a change occurs in either the materials or the processing conditions. The current literature shows that OCT has an advantage in measurement precision and generality, for it senses the hole depth directly by shooting the probe light into the hole bottom and capturing the reflected interference patterns which are embedded within the depth information. However, its inherent heavy computation cost of FFT hinders its potential to calculate the depth in real-time and be used as live feedback for closed-loop control. To address this challenge, this study implemented an in situ real-time closed-loop control on the hole depth of the laser drilling process. We achieved this by integrating a variant of the biological OCT system into a laser processing head. This setup allows for acquiring real-time interferograms and expediting the inline depth extraction process through an efficient tracking algorithm. Furthermore, a dedicated FPGA was used for fast feedback control. The computationally heavy FFT involved in biological OCT is saved by converting the depth measurement to a dynamic depth-tracking issue, in which the new depth is searched for in a small window near the previous depth during the drilling processing. The processing rate of the tracking process is further secured at 50 kHz by parallelizing the capturing of the interferogram and the tracking process on FPGA hardware with the CMOS sensor embedded, which allows it to achieve the closed-loop control of the laser drilling processing at a fast rate. The performance of the built closed-loop control system was approved on probe card drilling processes with a variation applied in terms of laser focus.
2. System
An OCT imaging system couplable into a laser head was developed in the laser group of UESTC. A low coherent beam from a fiber pigtailed SLD (measured to have a center wavelength of 850 nm, full width at a half maximum bandwidth of 42 nm, and a power of 25 mW) passes into a 50/50 fiber optic coupler (TN1840R5A2; Thorlabs, Inc., Newton, NJ, USA). Therefore, the theoretical axial resolution of the OCT system can be calculated using the following equation:
where is the central wavelength of the light source (837.2 nm), and is the bandwidth of the light source (53.5 nm). Using these values, the axial resolution is approximately 5.78 m. Each A-scan initially contains 2048 pixels. After performing the FFT and mirror artefact removal, each A-scan is reduced to 1024 pixels, resulting in a detection depth of 5.92 mm. Despite weak scattered light, interference can still be captured by the spectrometer. Experiments show interference even when the depth of field exceeds (spot diameter d), with a resolution of 3 pixels in static conditions. Thus, detection depth is influenced by both focal depth and system capabilities.
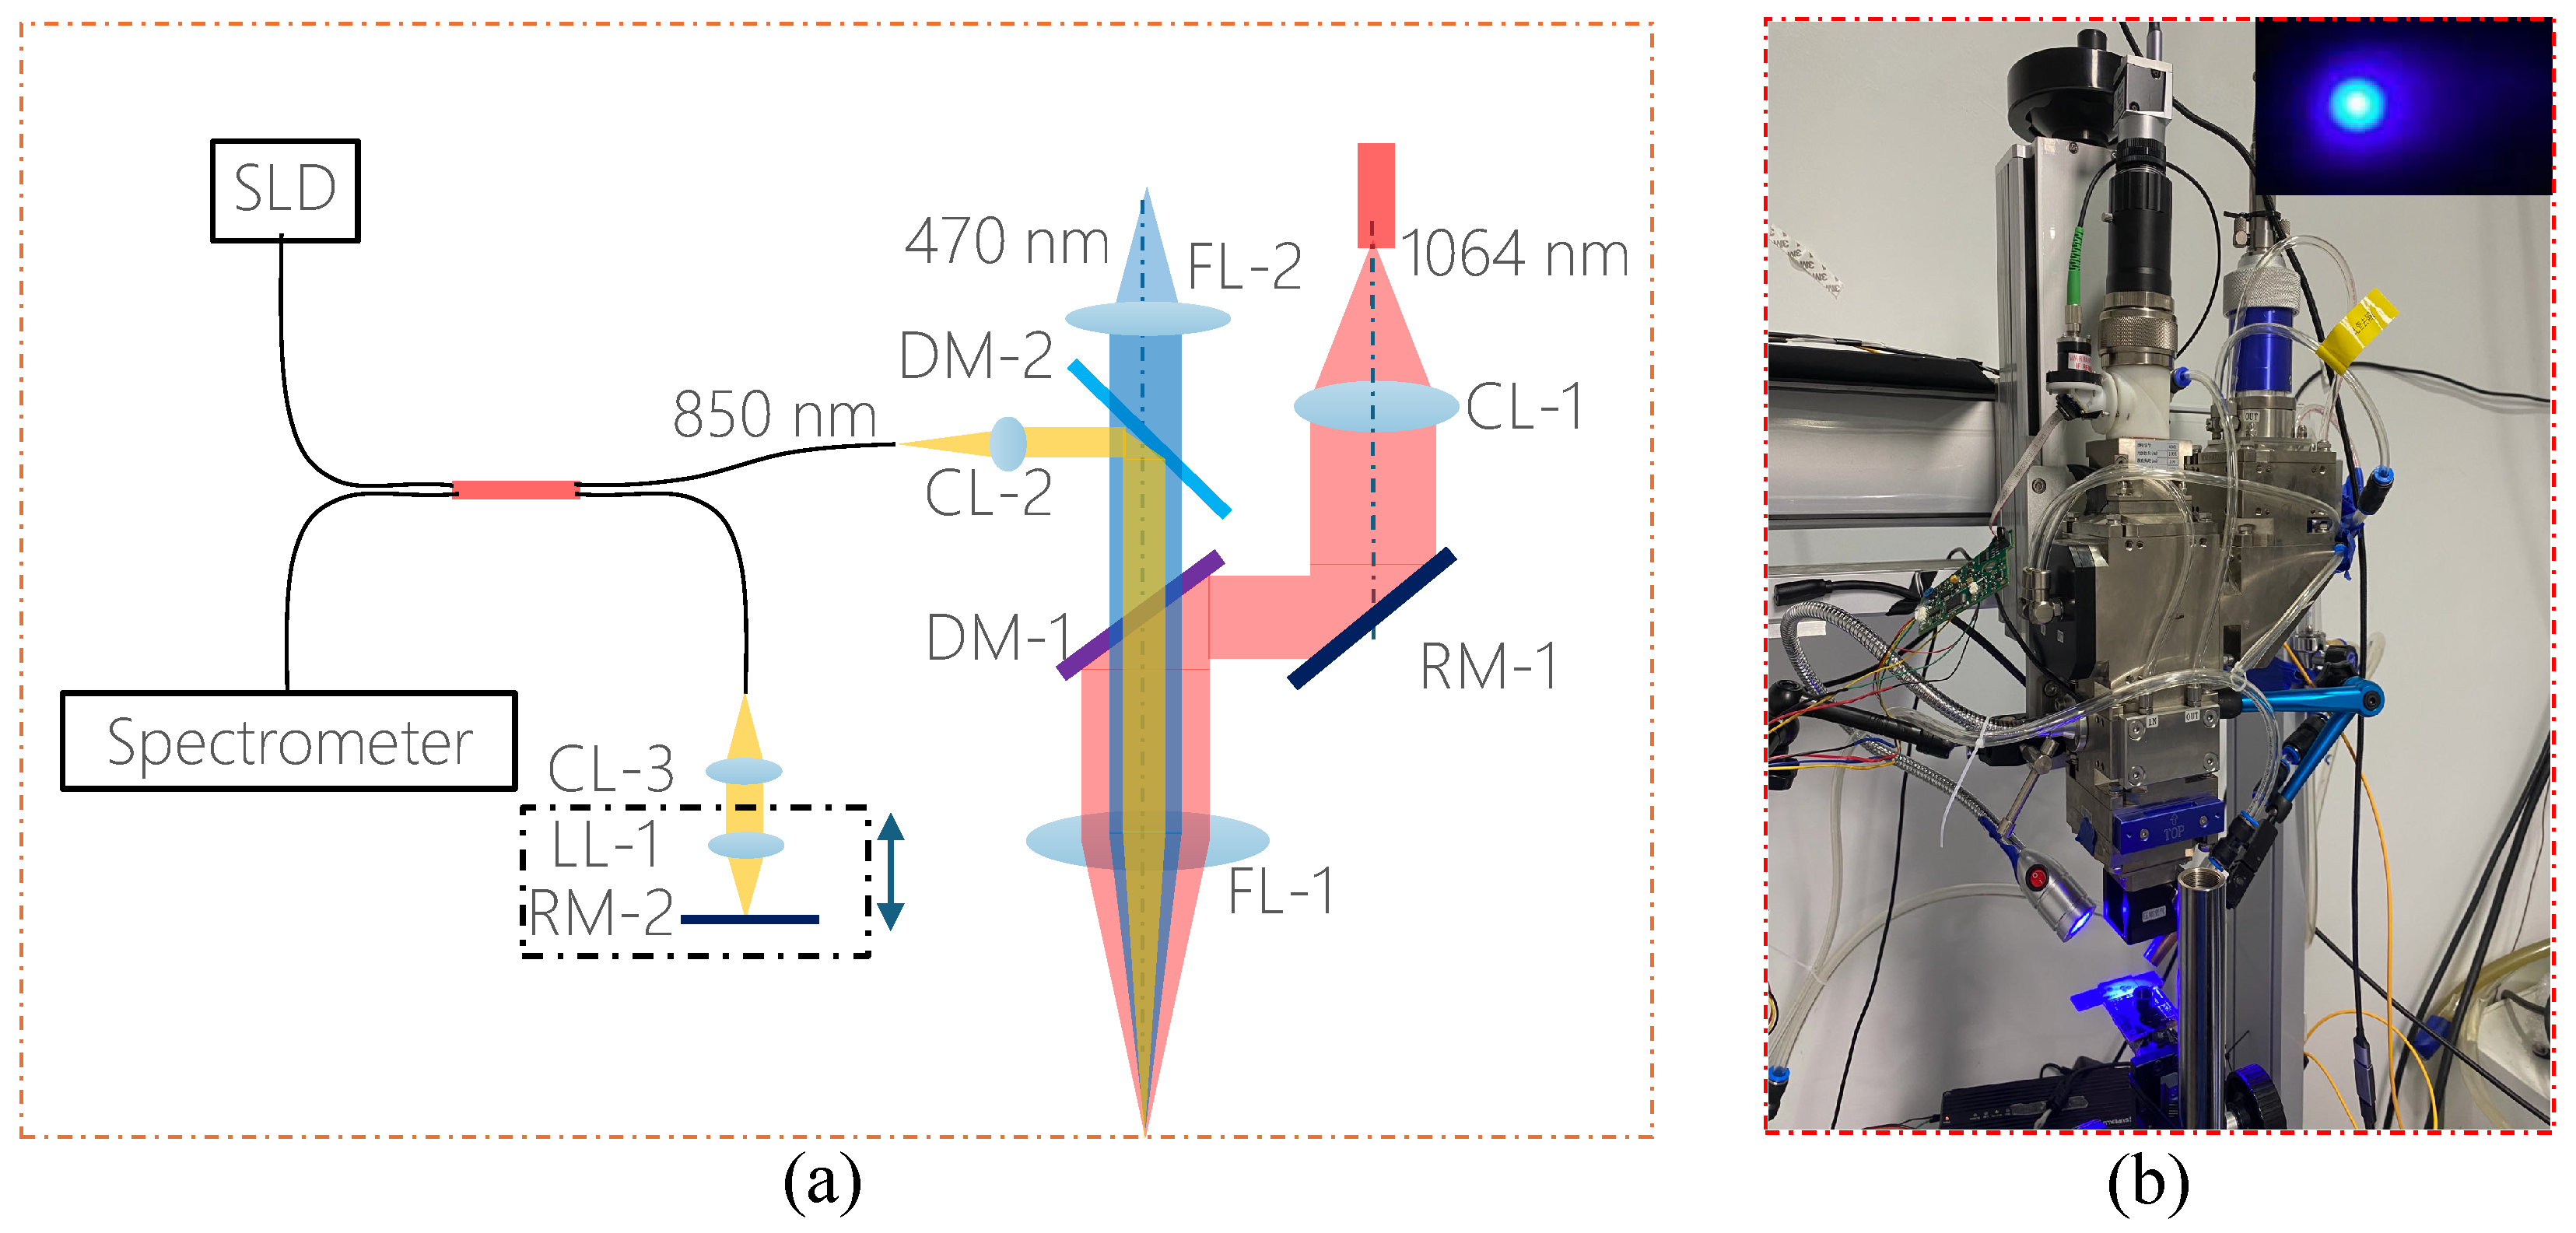
The light from one output of the coupler goes to the reference arm, where the beam is collimated into a 3 mm diameter parallel beam by a 10 mm collimator (CL-3), the optical path of the referring beam is controlled by a linear motion of the Reflecting Mirror (RM-2), and the reflecting strength is tuned by a Liquid Lens (LL-1). The other output of the couple goes to the laser head where the sampling beam is combined with the processing beam (3 kW, fiber core diameter of 50 µm, 1060 ± 10 nm, and maximum modulation frequency of 5 kHz). DM-2 was featured in passing the center wavelength of 470 nm while reflecting 850 nm, and DM-1 was featured in reflecting 1064 nm while passing 470 nm and 850 nm. The 850 nm light is scattered back by the measuring surface and goes back the same optical path. It is interfered with by the beam from the reference arm and captured in a spectrometer which is based on a CMOS sensor array consisting of 1 × 2048 pixels with an A-scan line rate of 82 kHz. The process beam is delivered into a laser head via a QBH connector, where it is collimated by a 100 mm collimating lens (CL-1), reflected by a reflecting mirror (RM-1) placed at a 45-degree angle, and then directed toward the dichroic mirrors (DM-1) and fully reflected down toward a 150 mm final objective lens. The process beam produces a measured spot size with a 100 m intensity diameter. With a 20 mm collimator for the OCT beam, the 780 HP fiber, and the 150 mm objective lens, the imaging beam has a measured 50 m intensity diameter and a depth of focus of 5 mm. The laser head was fixed on the Z axis of an XY motion stage. The weld substrate is clamped on the XY motion stage for weld motion. Figure 1 shows the typical images captured by a video camera during a laser welding process.
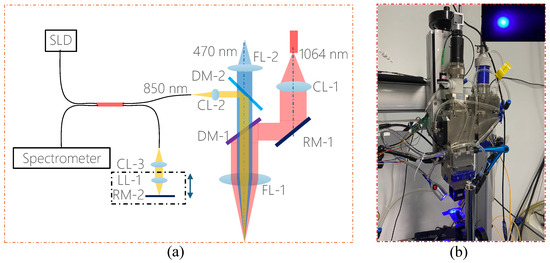
Figure 1.
(a) Schematic of optical path for coupling between OCT beam and laser processing beam; (b) photo of laser process platform with OCT imaging coupled into the laser head and typical coaxial video image during laser welding (top right).
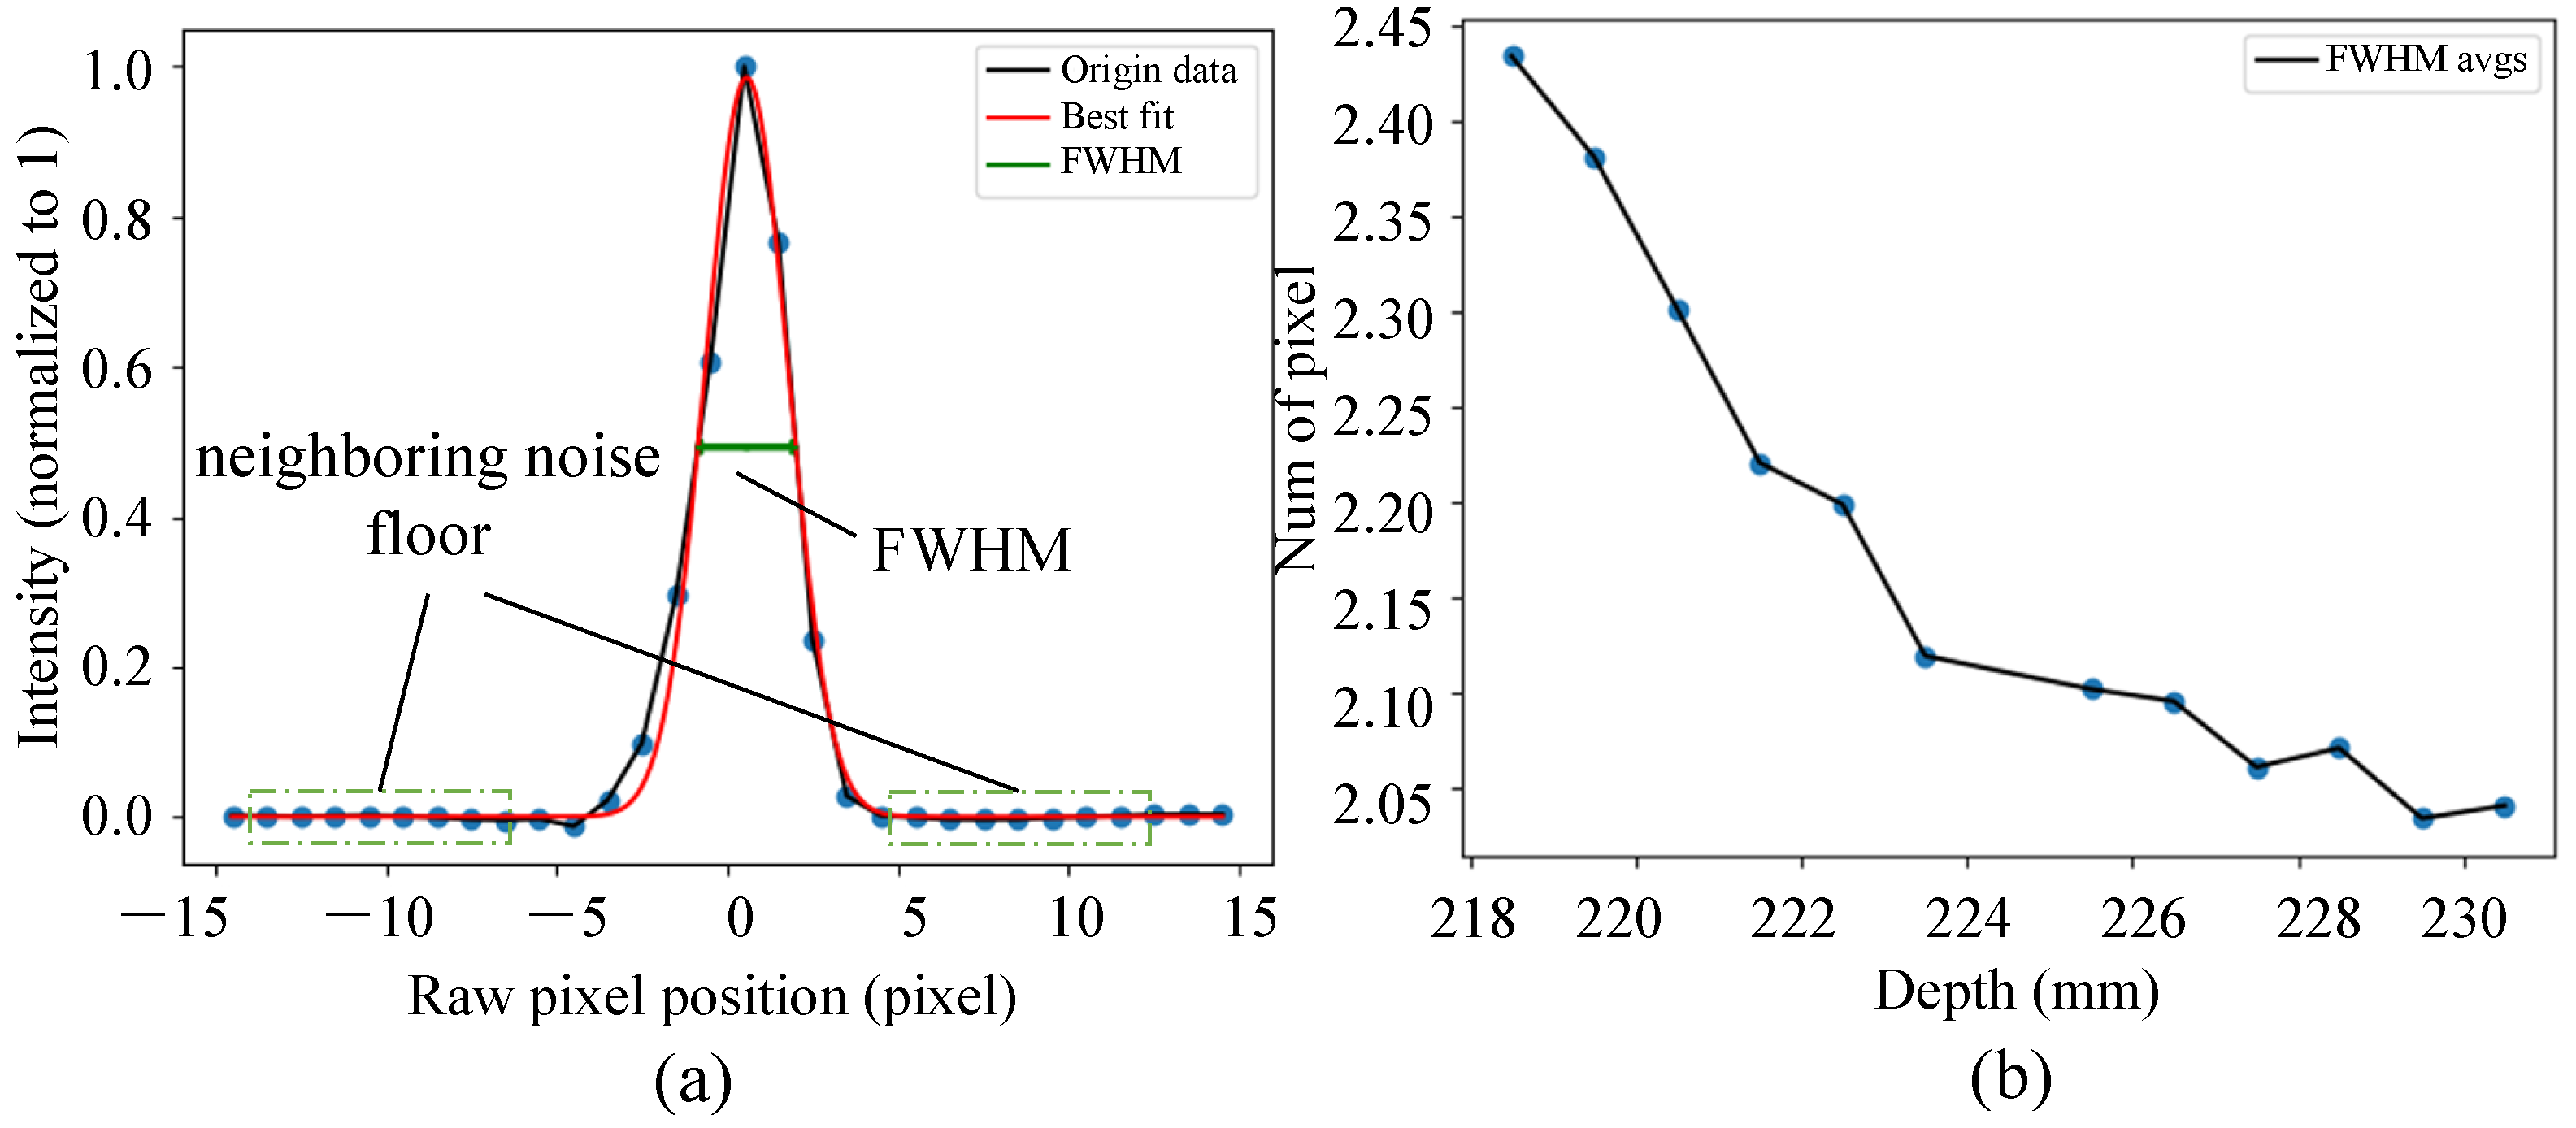
The spectrum captured by the interferometer is k-linearized and DC-removed by subtracting the background spectrum that is captured with no reflector in the sampling arm first; it then goes through FFT to obtain the A-scan image. The qualification metrics for an A-scan image include the signal-to-noise ratio (SNR) and the full width at half maximum (FWHM) of the PSF shape. The SNR of the imaging system is defined as 10 times the log of the ratio between the maximum intensity of the PSF in the A-scan and the root-mean-square (RMS) of the neighboring noise floor on two sides of the PSF shape. Ten pixels on each of the two sides are used for evaluating the SNR in this system. FWHM is a metric that characterizes the beam concentration on the measuring surface. The smaller the FWHM is, the more concentrated the sampling beam is, which helps produce a stronger signal. To qualify the imaging system itself, 12 points were measured with the laser off at an interval of 1 mm near the focus plane (near depth = 223 mm) of the processing beam. For each point, the back reflection from a high-quality mirror is maximized for calculating the corresponding SNR and FWHM, which are shown in Figure 2. As can be seen, the highest SNR is near the optical path difference (OPD) = 0 mm, and it decreases symmetrically as the measuring surface moves away. This suggests that it would benefit the signal SNR to place the measuring surface of interest as close as possible to OPD = 0. In the following tests, the referring arm was moved to a place so that the imaging position of the keyhole bottom was placed near OPD = 0. The FWHM decreases as the measuring surface moves further, which suggests that the OCT beam focuses (at 229 mm) at a depth further than the processing beam (at 223 mm). Given the fact that the keyhole bottom is below the substrate surface, a 7 mm lower focus position for the OCT beam provides a higher chance of getting a focused OCT beam when measuring the bottom of the keyhole, hence helping to achieve a stronger signal. The interfered spectrum was captured by the spectrometer with an exposure time of 11.3 s and a line scan rate of 82.5 kHz (scan period 12.11 s). A total of 1000 sequential A-scan images were acquired, transferred from spectrometer to PC and processed as a group, which is referred to as the “B-scan” in the following sections.
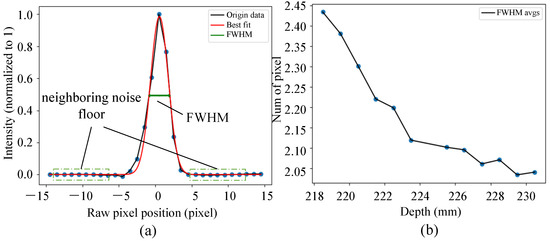
Figure 2.
(a) The normalized PSF, the Gaussian fitting of the PSF, and the neighboring noise points used for SNR calculation; (b) FWHM at 12 depth points near the focus plane of processing beam at an interval of 1 mm.
3. Efficient Depth-Tracking
3.1. Depth-Tracking Algorithm
In biological OCT imaging, the FFT algorithm is typically applied to convert the interferogram to the depth values of all the reflectors within the field of view and it is a static measurement. However, for the scenario of drilling holes in the probe card, the measurement of the bottom is a matter of dynamic interface tracking. Given the two truths of the drilling process that (1) the material is known as being opaque, hence only having one interface, i.e., the bottom front of the hole exists, and (2) the interface would not change significantly from one A-scan to the next one, the hole depth can be tracked efficiently by providing the a priori depth and searching the new interface in a local window. As shown in Figure 3, starting with a known depth in A-scan , the total amount of the depth step towards would not be greater than a certain amount of pixels in practice. In this schematic, a 4-pixels-wide searching window is set to search the depth in A-scan . A synthetic interferogram expressed in units of constant camera pixel numbers can be back-calculated for depth (, , , ). Then, the captured interferogram at is compared with the four generated interferograms. The most similar one is tagged as the depth for . To calculate the similarity between two interferograms, this work adopts homodyne mixing, which mixes a signal of interest with a local oscillator signal that has the same frequency as the carrier frequency of the signal being processed. The expression is as follows:
Here, is the target depth and is the spectral interferogram intensity collected by the spectrometer. During the tracking process, the newly detected depth refreshes the priori depth before the next depth detection for . The steps repeat until the end of laser drilling. In this way, all exact depths for individual A-scans could be efficiently determined without conducting the full field depth calculation by FFT, showing a great potential to speed up the depth computing and build real-time closed-loop control.

Figure 3.
Schematic of laser drilling performance with different focus offsets.
To evaluate the tracking performance of the proposed method in terms of tracking precision and speed, the proposed tracking method was tested on a typical drilling process. As shown in Figure 4, with the laser set on, a hole starts to form with a portion of the probe light going into the bottom. Since the opening of the hole is tiny at the beginning, the probe light on the surface dominates the signal. As the drilling proceeds, the hole opens wider, resulting in a strong signal from the bottom until the end of the drilling process. The slope of the depth profile represents the drilling removal speed, v, which can be calculated as follows:
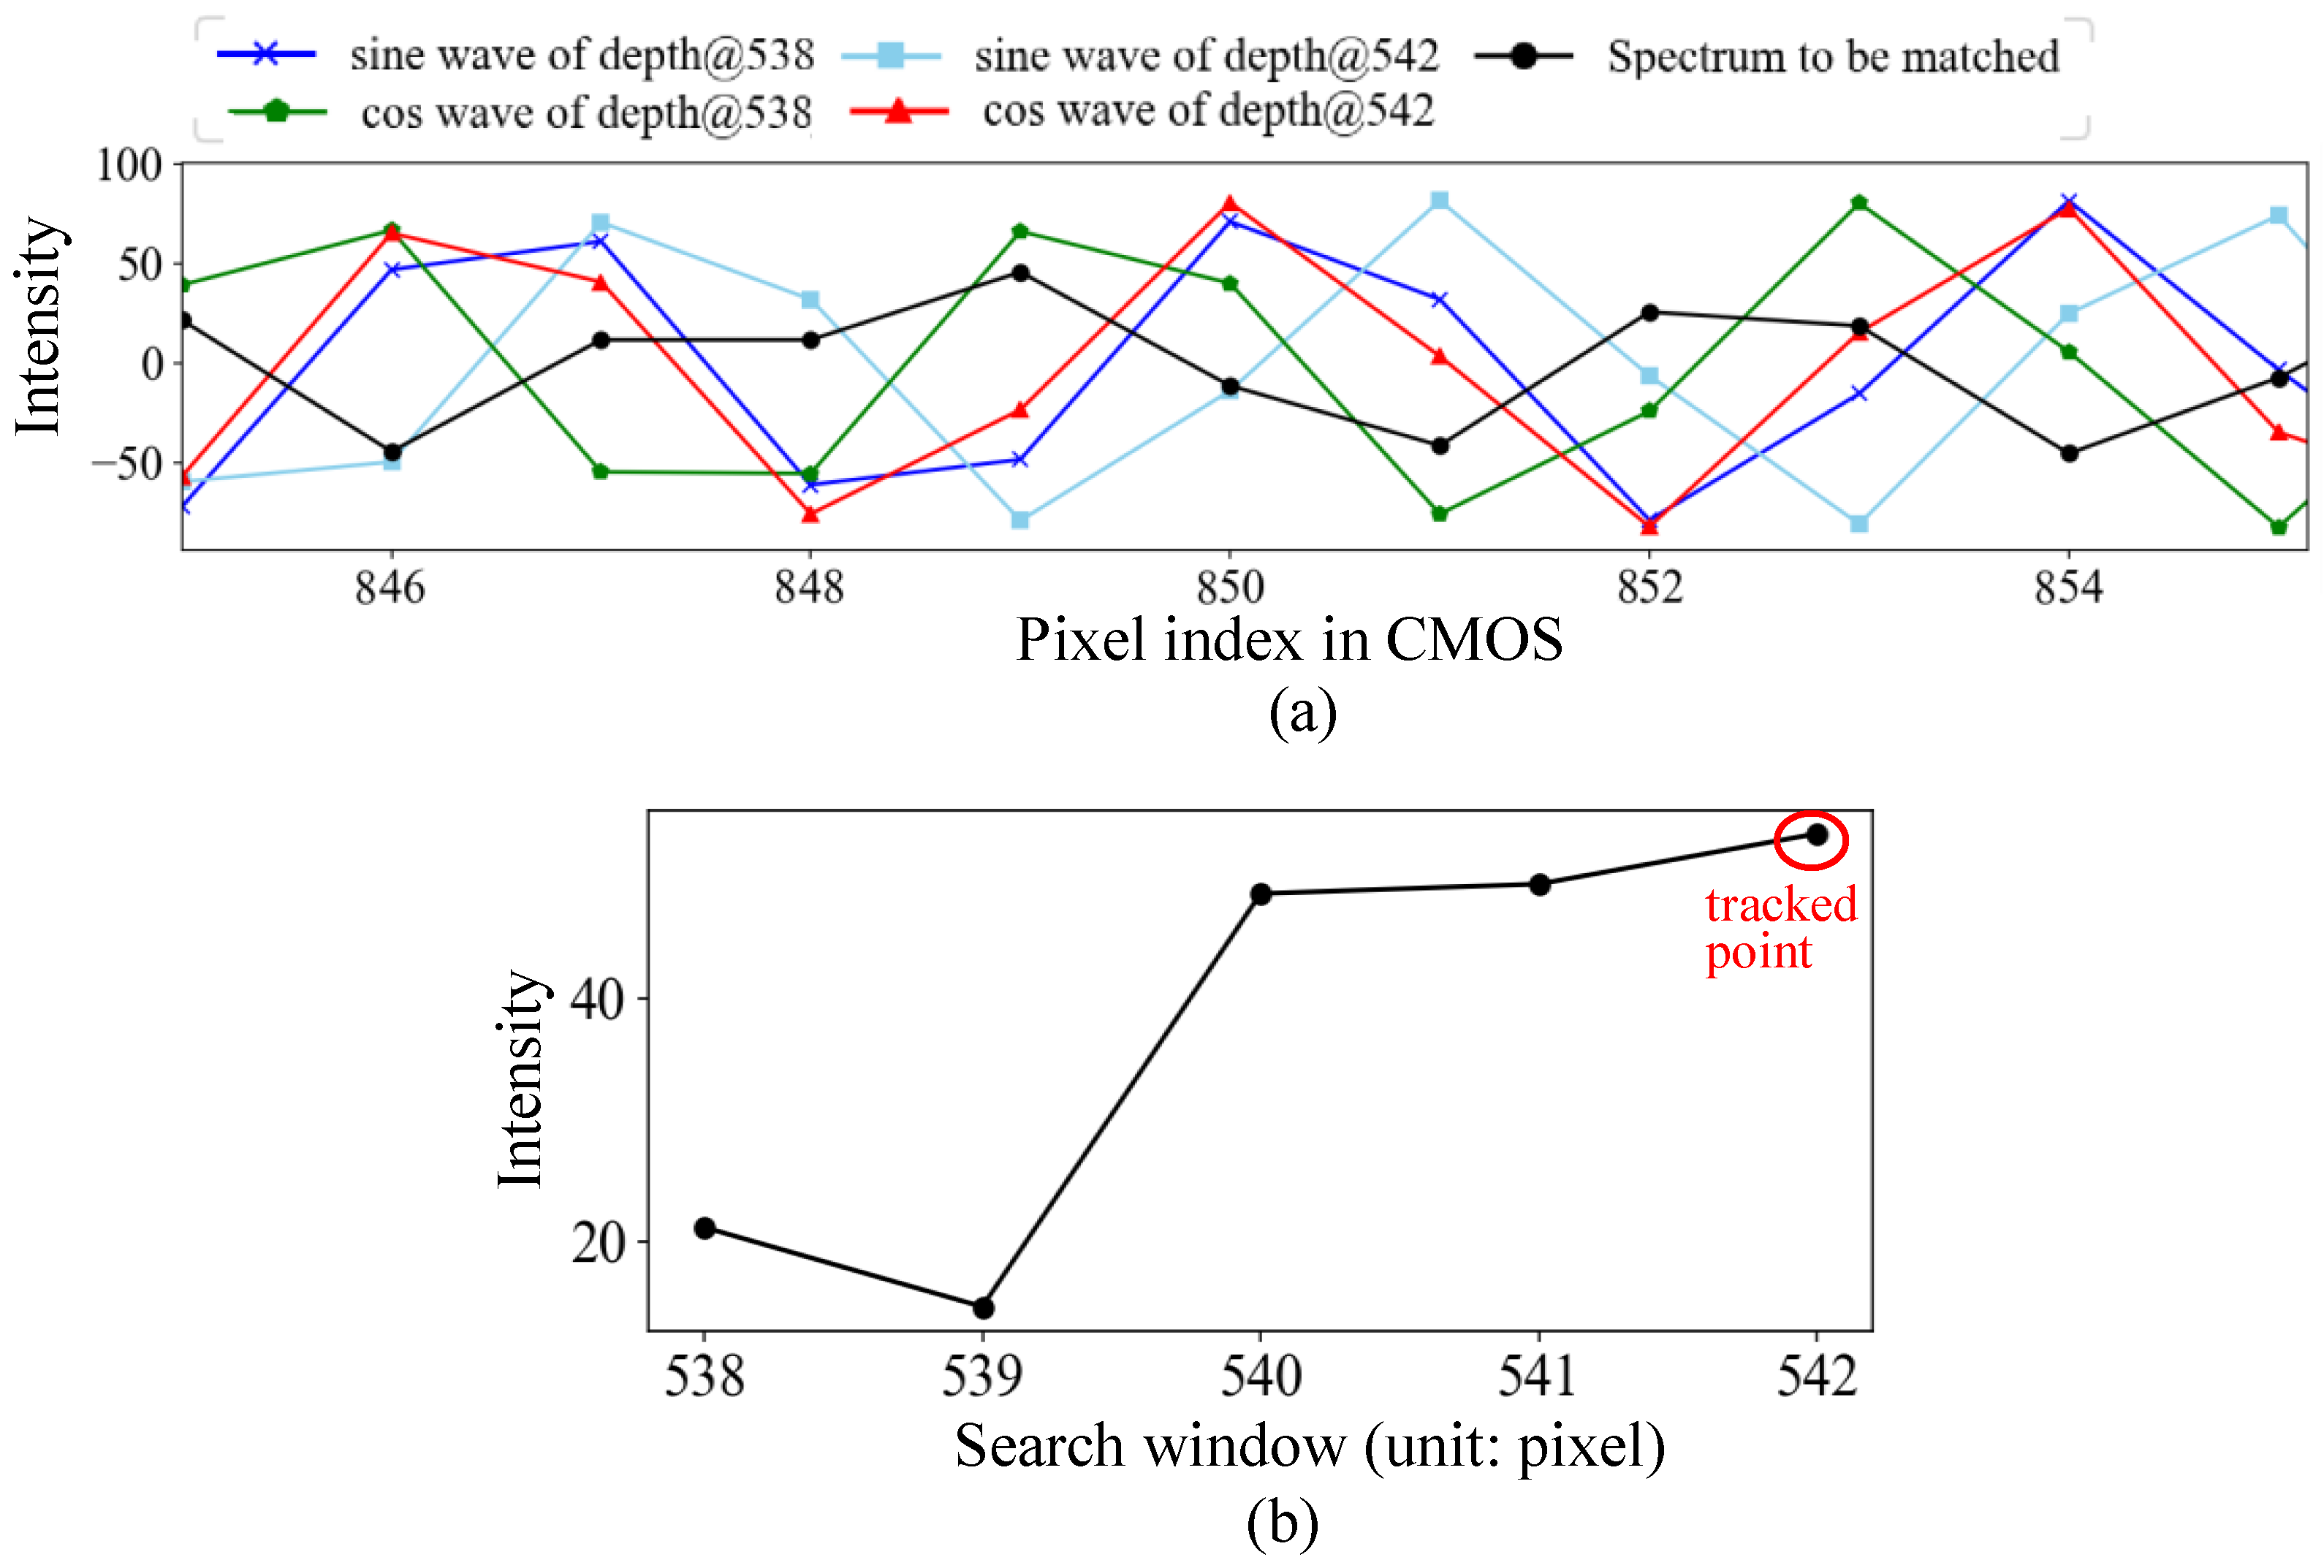
where p is the depth change in pixels between two adjacent A-scans, is the physical size a pixel represents, which was calibrated at 6.543 m/pixel in this system; t is the iteration time of A-scan, which is 12.11 s in this system. As can be seen, the removal rate decreases as the drilling site deepens. With the prior practical knowledge that the drilling speed is typically not faster than 1 m/s at the beginning in this context, a window size of 4 pixels is set, which is capable of tracking a maximum drilling speed of 2.2 m/s. Figure 5 shows the partial waveforms (845–855) used for determining the depth given the previous depth at 542. The depth 542 scores the highest, indicating that the drilling depth does not change. In a practical situation, the depth signal between adjacent A-scans could stay unchanged or even lifted in the later A-scan due to the block of the removed material or noise; therefore, typically, a search section above the previous depth is set and denoted as size_up, and the search section below the previous depth is size_down. The total window size would be size_up + 1 + size_down.

Figure 4.
The raw OCT depth calculated by the FFT of a typical drilling process.
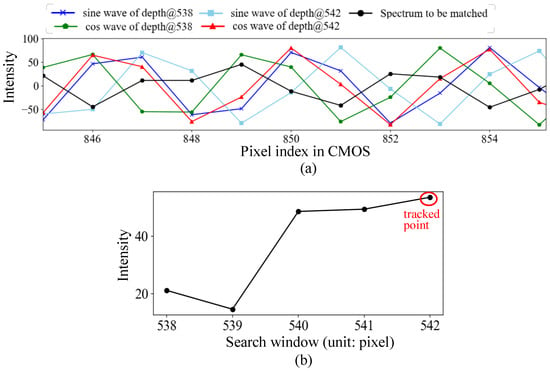
Figure 5.
(a) Partial waveforms (845–855 nm) used for determination of depth given the previous depth at 542, and (b) the intensity of homodyne mixing over the searching window.
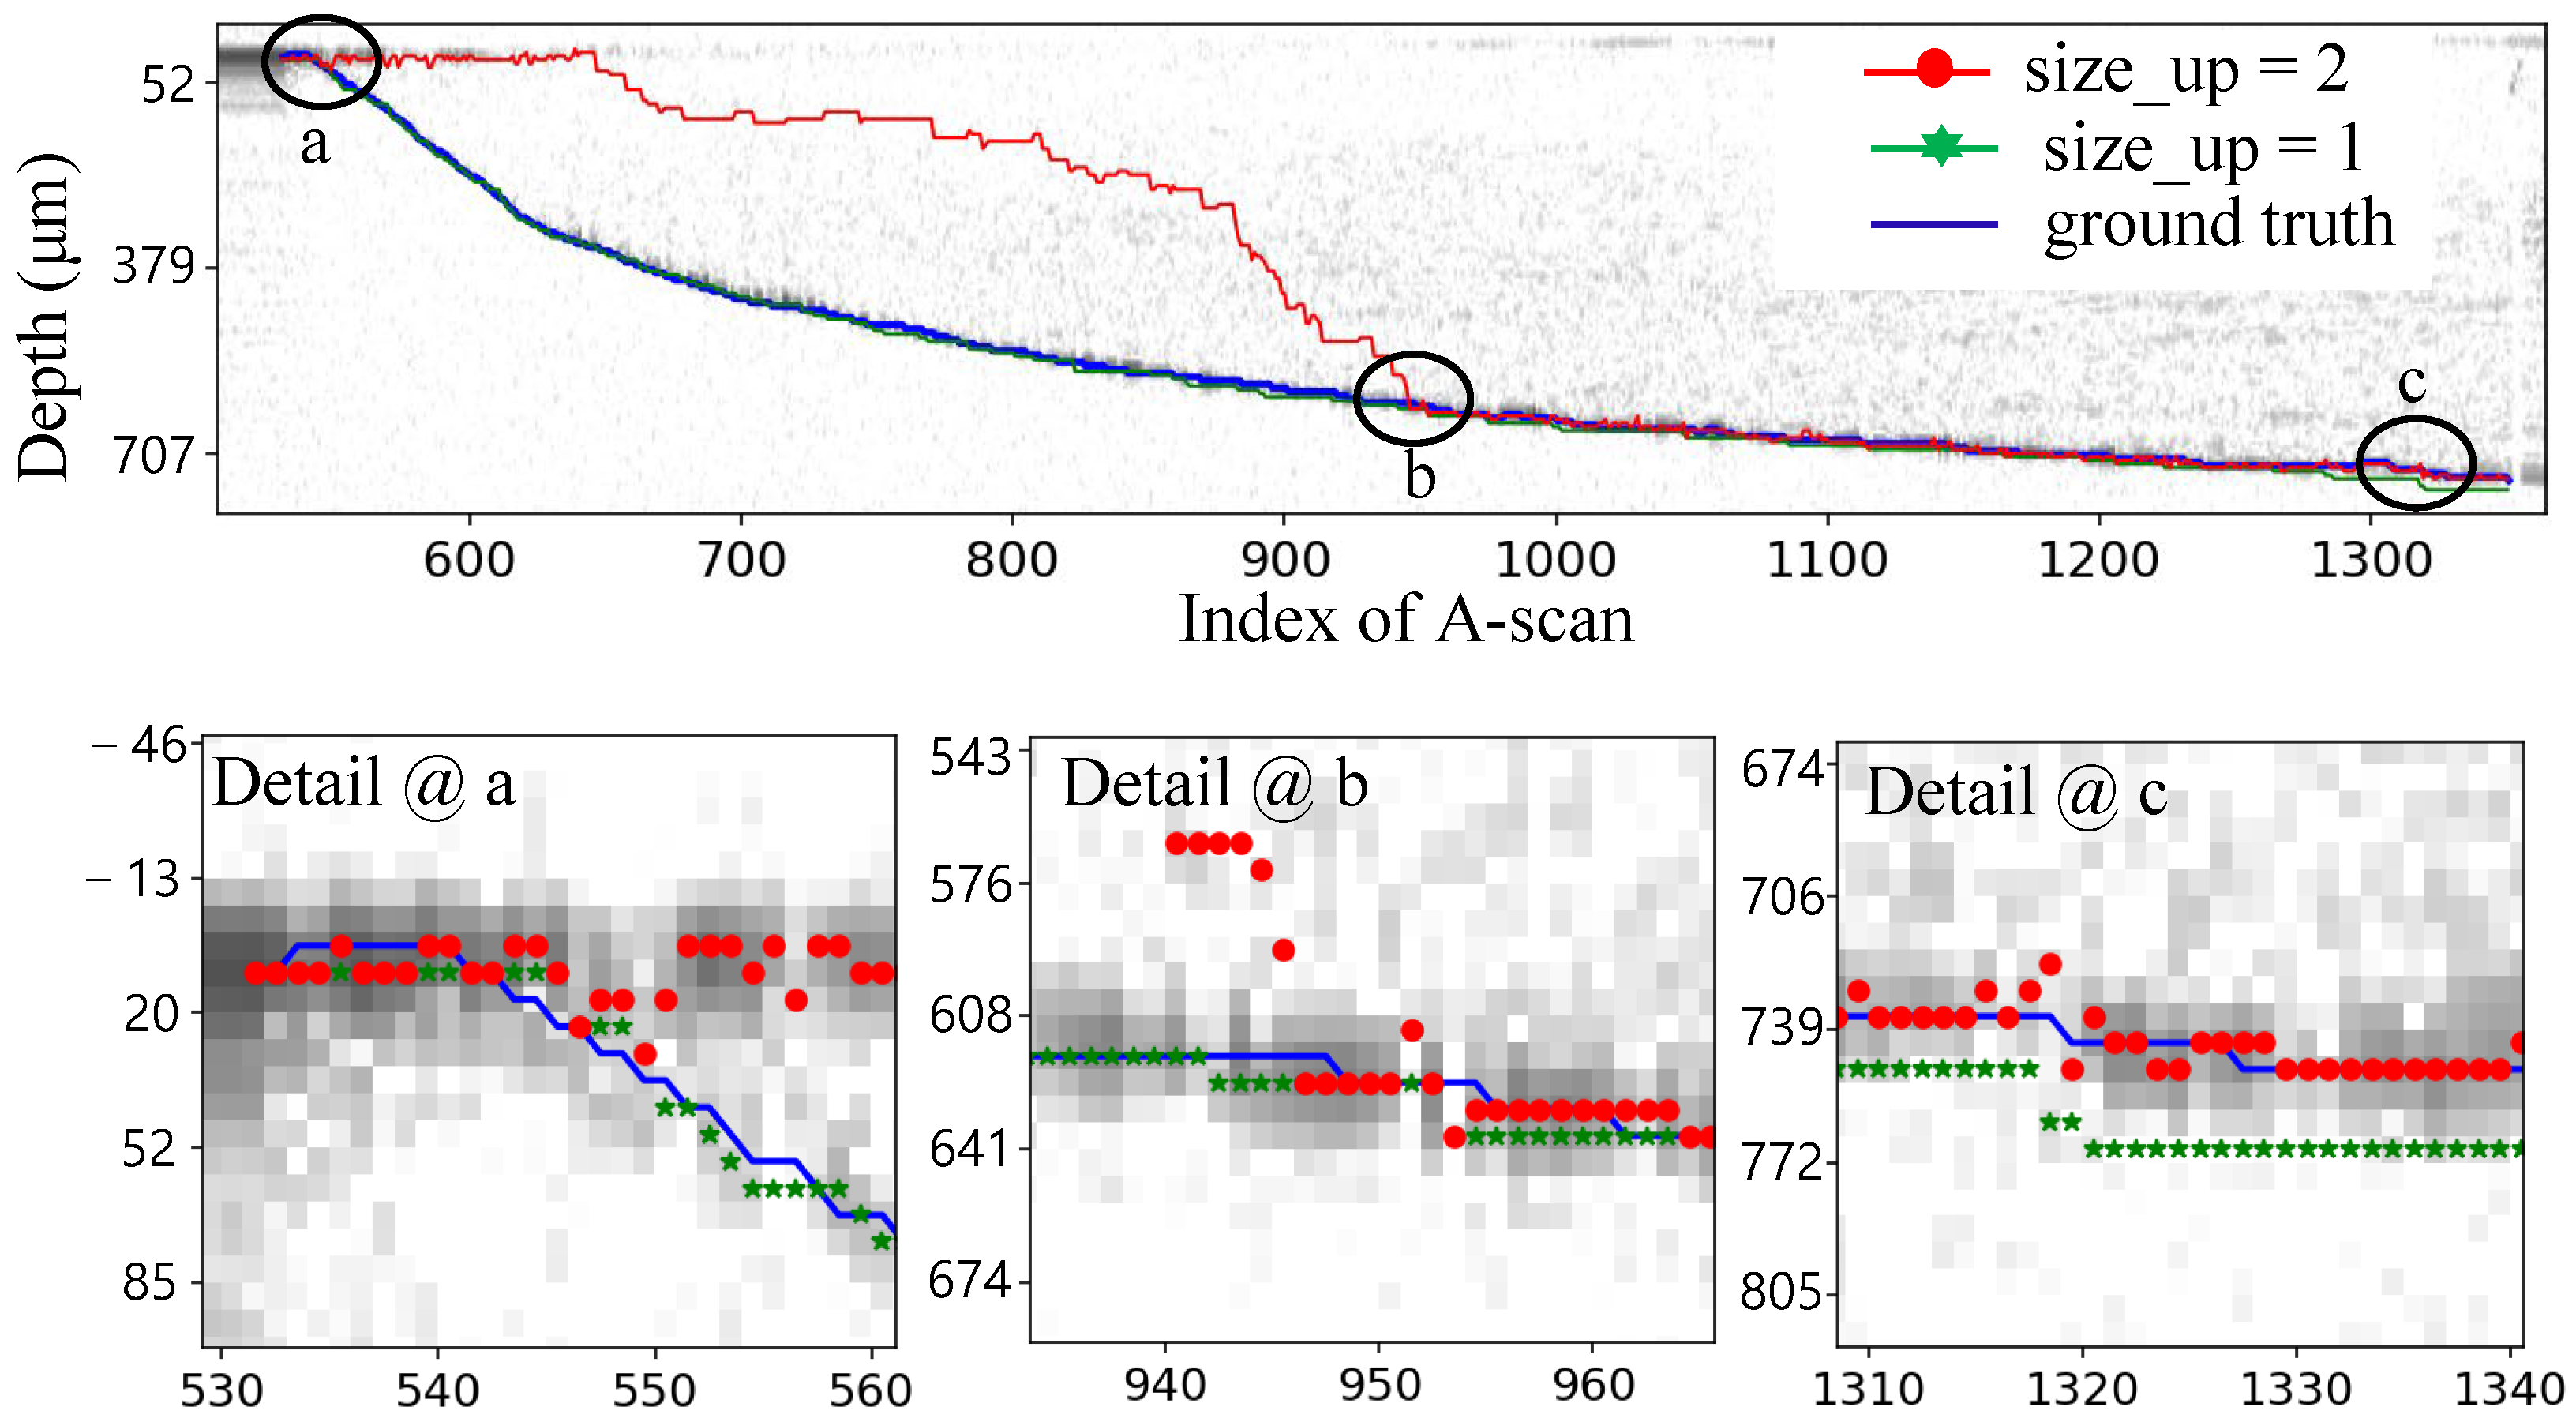
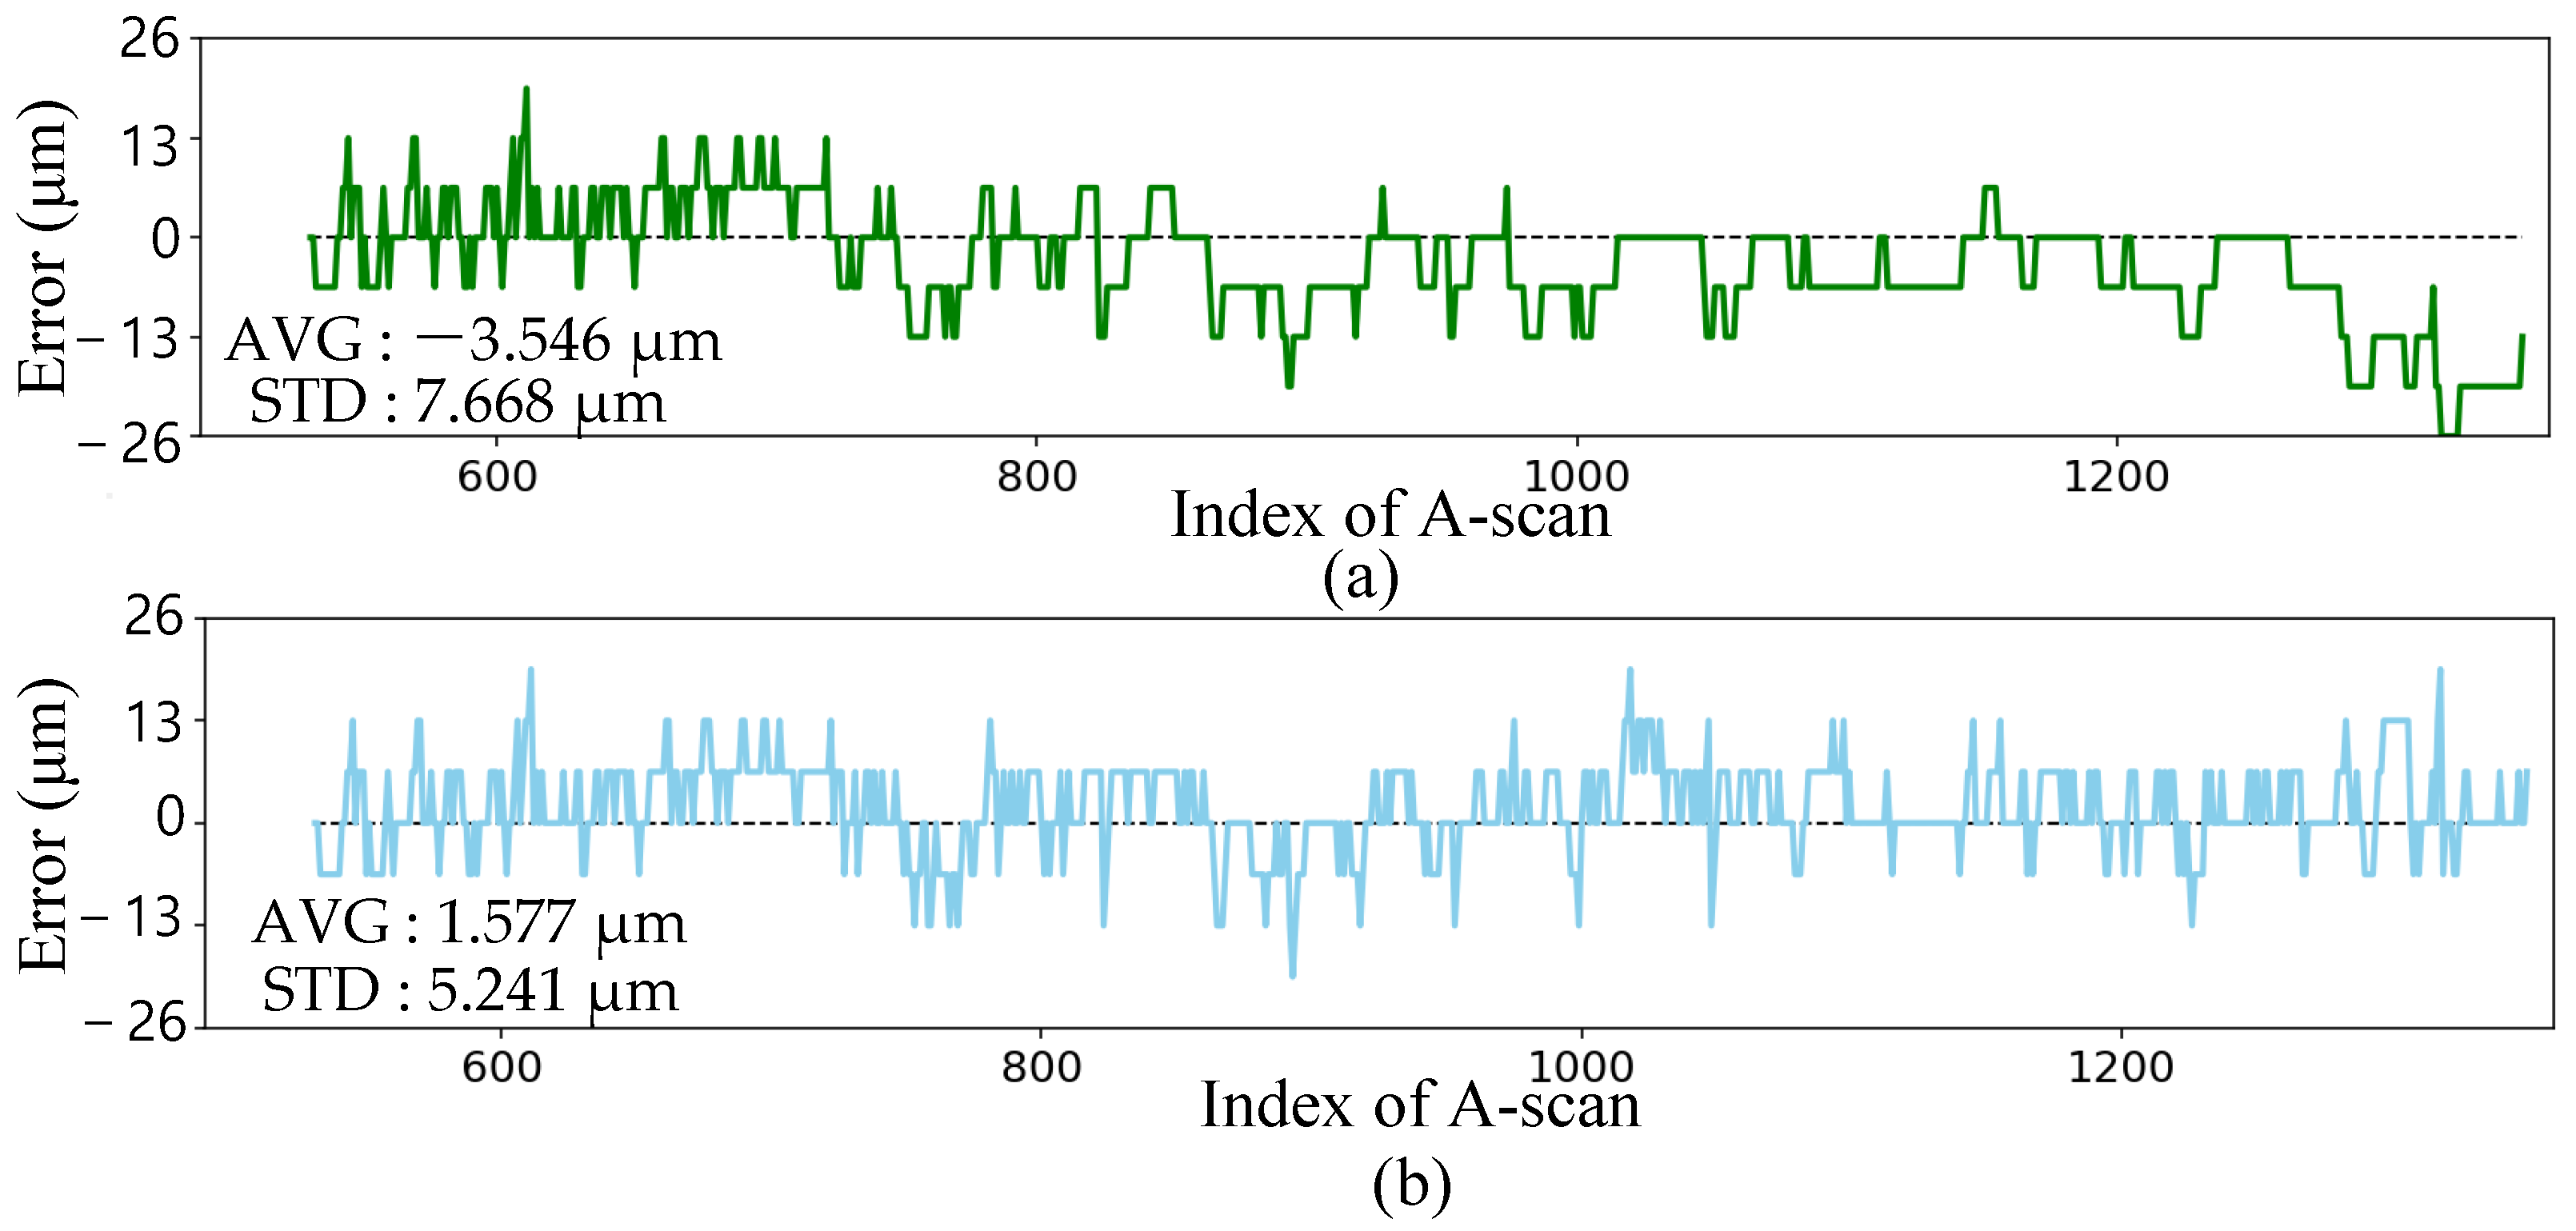
Figure 6 shows a tracked profile with size_down = 2 and size_up = 1. This tracked outcome is compared against a manually drawn profile, considered as the ground truth. In Figure 7a, the error is illustrated with an average of −3.546 m and a standard deviation of 7.668 m. Notably, after A-scan 700, the tracking consistently follows the downward trend, resulting in an average of −3.337 m. The trend is evidenced by the Detail @ c in Figure 6; the small size_up restricts the ability to track upwards when the drilling slows down. To enable upward tracking, the search window size was expanded to 2. This adjustment provides an opportunity to identify the most intensive point, evidenced by the period from 1310 to 1340 where the red dot retraces its path and aligns with the blue well. However, enlarging the size_up led to initial tracking loss due to the intense signal from the surface, as demonstrated in detail in Figure 6. An effective approach was designed which initiated conservatively with a smaller size_up to avoid the effect of the surface signal. It potentially compromises precision to ensure a secure track. As the process continues and the disparity between the depth and surface signals exceeds a certain threshold, the size_up is switched to 2 for enhanced precision. The combination of safe mode (size_up = 1) and precision mode (size_up = 2) facilitates depth profile tracking, resulting in an improved precision with an average error of 1.577 m and a standard deviation of 5.241 m.
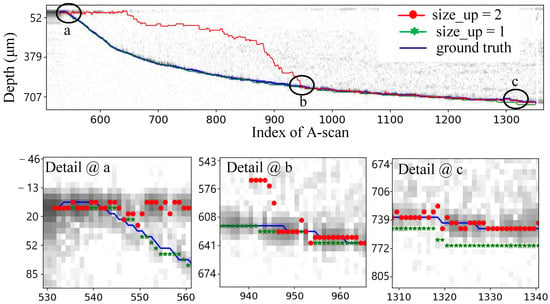
Figure 6.
The tracked profiles with two different search window configurations.
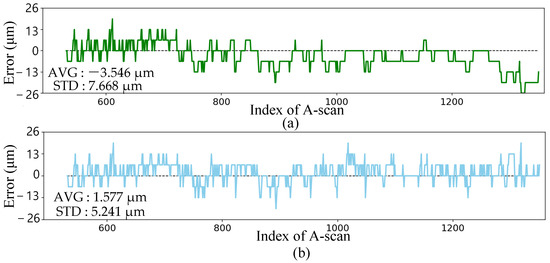
Figure 7.
(a) The tracking error with size_up = 1; (b) the tracking error with the combination of safe mode at the beginning and precision mode later.
The computing speed for the proposed tracking algorithm was evaluated within an individual processing block, which contains a certain amount of A-scans and is calculated as a group to generate an output for feedback. Processing blocks with A-scans of 1, 10, 100, and 1000 were processed in the program and the performance was compared with the traditional FFT method. As can be seen in Table 1, for a typical processing block with 1000 A-scans, the averaged processing speed using the tracking method is 3.299 kHz, which is around six times faster than using FFT, showing a great improvement in processing speed. In the following section, an FPGA-based parallel computing architecture is designed to further accelerate the tracking process to an industrial level of 20 kHz.

Table 1.
Comparison of processing speed.
3.2. Parallel Computing Design
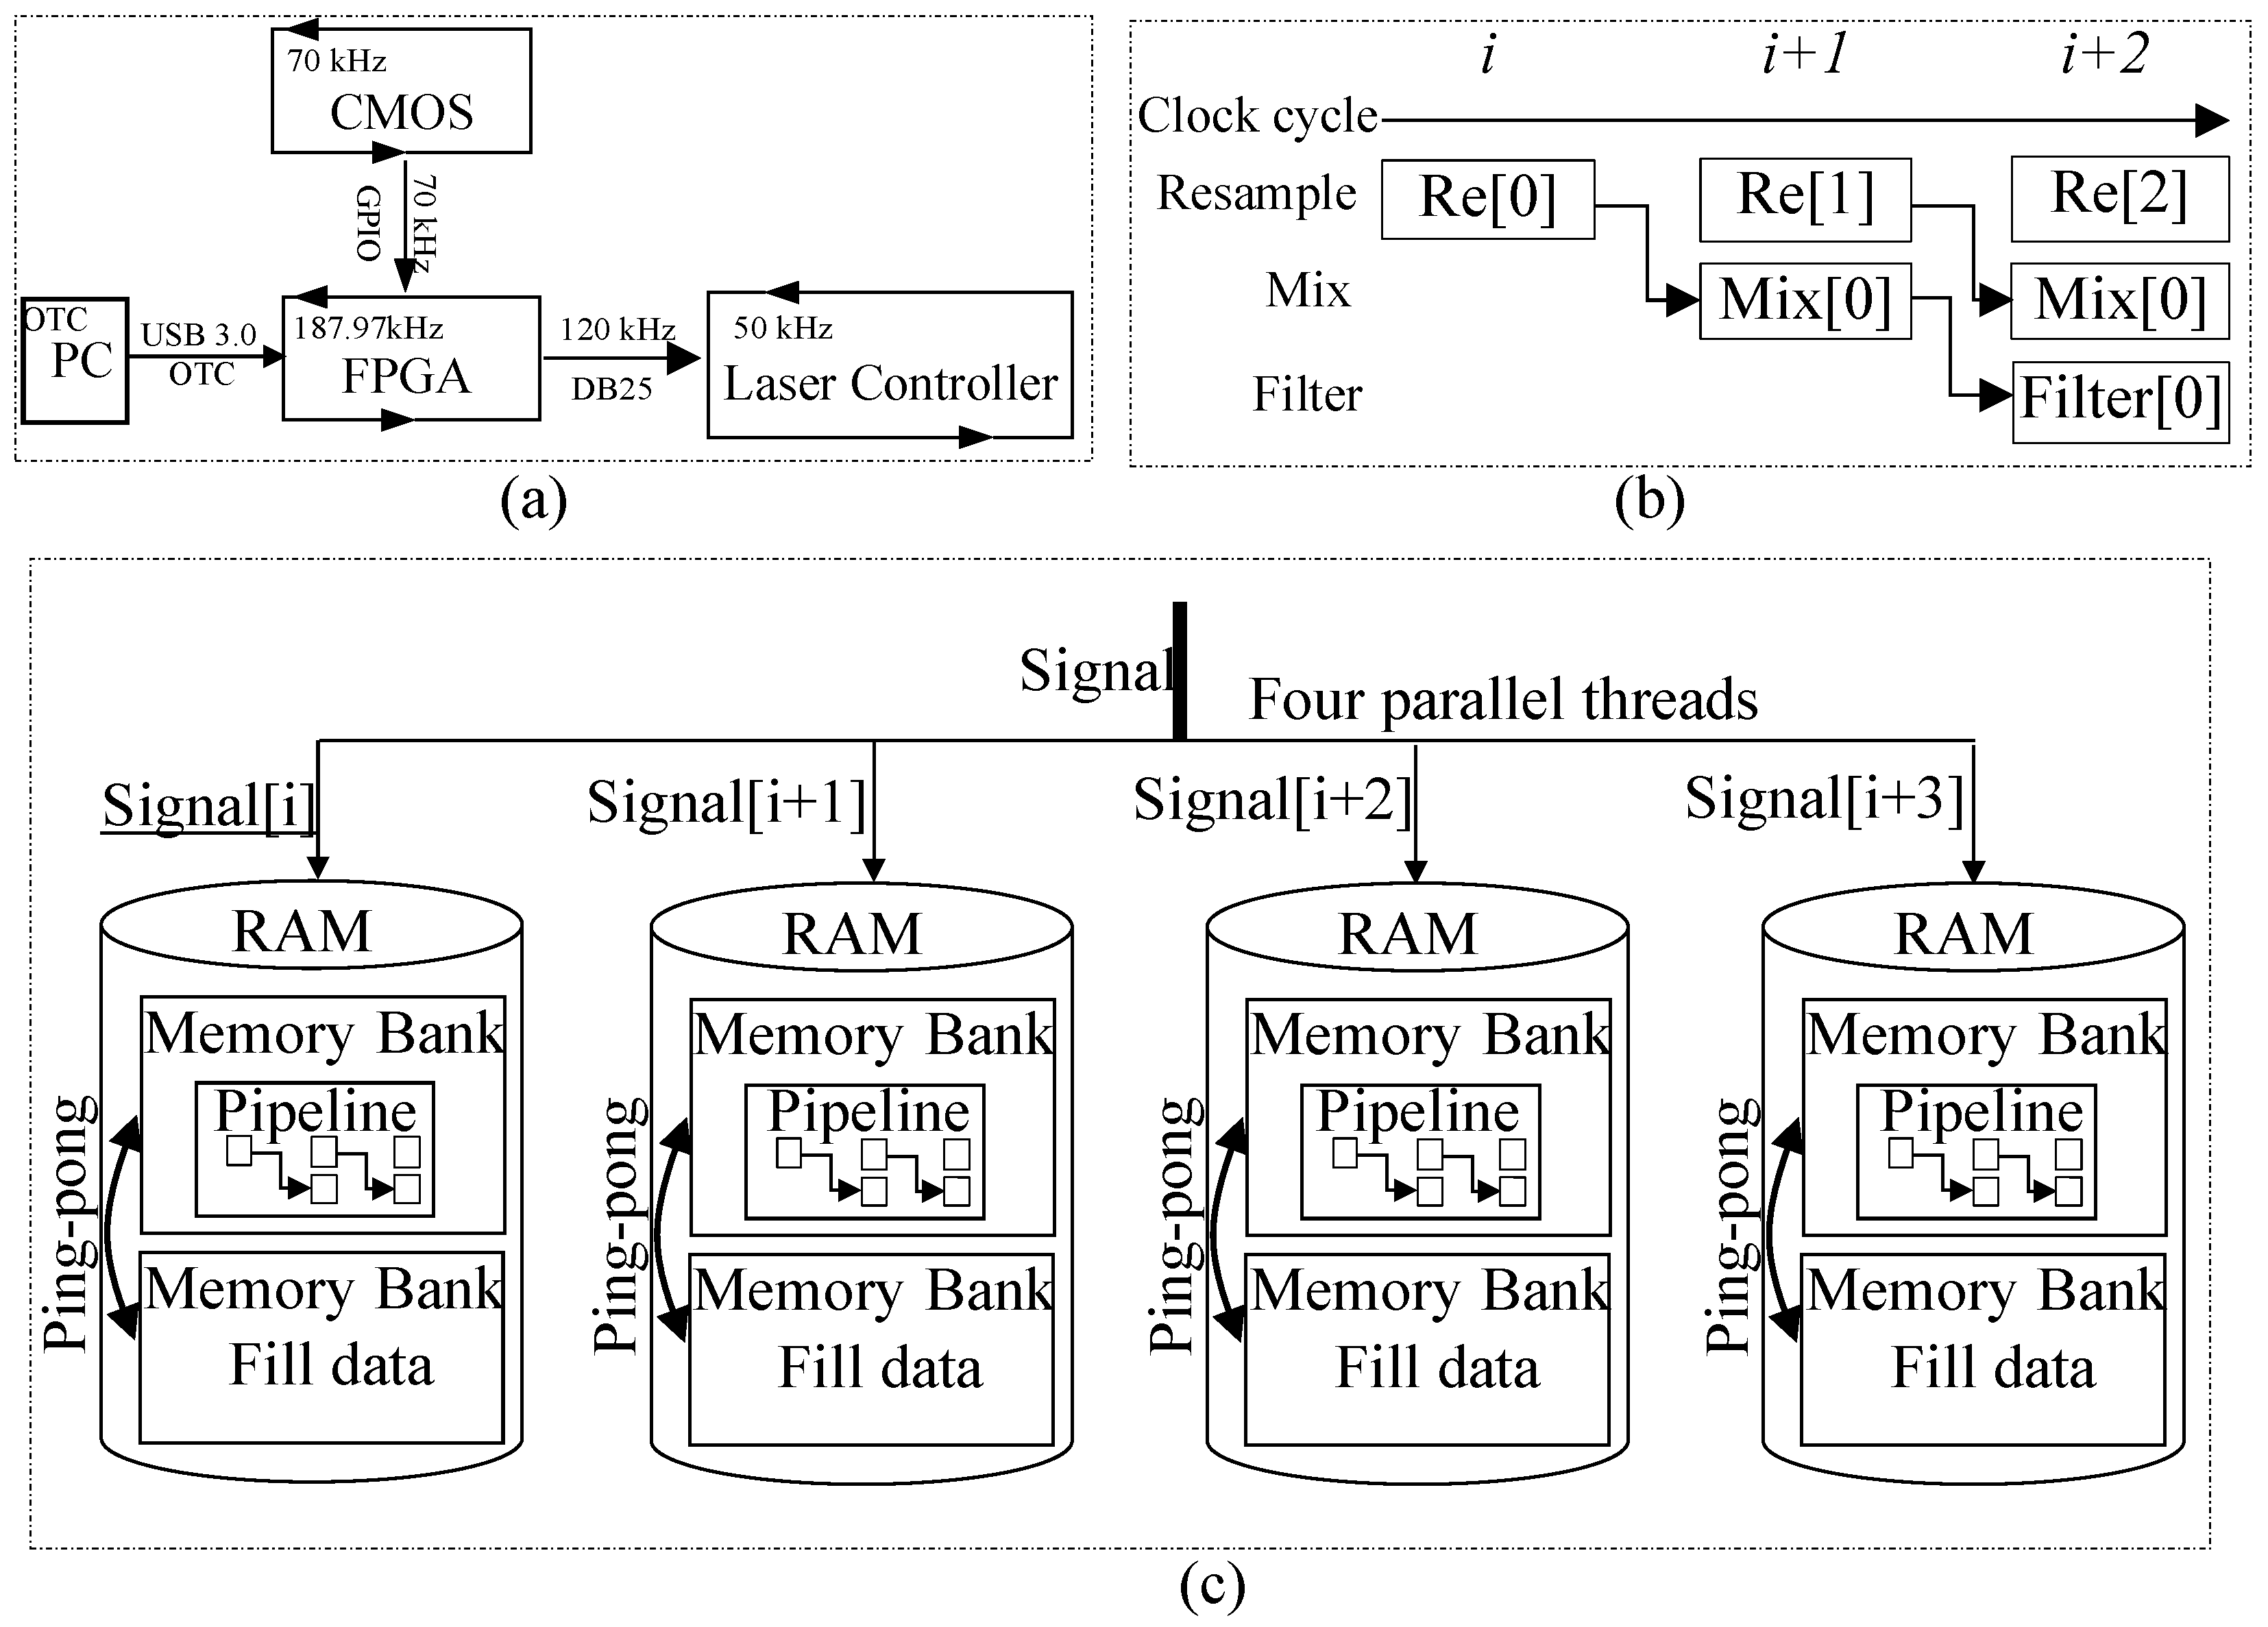
To fully exhibit the efficiency of the tracking method and avoid the interrupt latency and other delays inherent to desktop hardware and operating systems, the closed-loop control is further secured by a parallel implementation in FPGA. Figure 8a shows the hardware architecture; an FPGA (XC7A200T-1FBG484I) is computationally centered with the CMOS sensor (HAMAMATSU S15729) embedded for fast spectrum capturing. The PC and laser controller communicate with FPGA in a One Time Command (OTC) manner via USB 3.0, which allows for a 188 kHz refresh rate. The FPGA allows itself to discipline the closed-loop control of the laser drilling. The control process is started from PC as an OTC containing the target depth of the FPGA. Then, the FPGA sends a signal to the laser controller to fire the laser beam and starts to acquire the COMS image and track the depth. Once the depth reaches the target depth, FPGA sends a signal to the laser controller to terminate the laser beam.
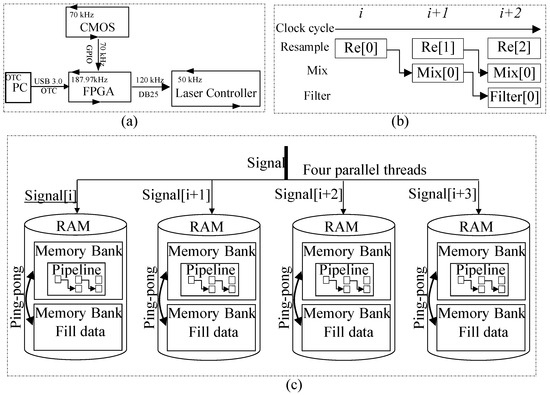
Figure 8.
(a) Inter data transfer rate between FPGA and other modules; (b) pipeline design for resample, mix, and filter; (c) three techniques used for parallel computing: four-way parallel computation, pipeline operations, and ping-pong.
As shown in Figure 8c, three acceleration techniques including four-way parallel computation, pipeline operations, and ping-pong operations were adopted to fasten the processing in FPGA. Firstly, a four-way parallel computing technology is designed to decompose and synchronously transmit the collected 2048 × 16 bit interference signals to four storage units (RAM) per clock cycle, reading continuous data (Signal[i], Signal[i+1], Signal[i+2], Signal[i+3]) from the signal and subsequently processing them in their respective storage spaces. This technique diverts the original data streams, significantly increasing the system’s parallelism. Upon data entry into each RAM, to synchronize storage and processing within the RAM, each Memory Management Unit adopted ping-pong operations for control, realizing a round-robin storage and processing operation. Regarding the data processing process, its core algorithms include resampling, zero–intermediate mixing, and low-pass filtering. The resampling module resamples the collected interference signals based on preset index addresses. The zero–intermediate mixing module calculates the signal intensity which involves computations across multiple stages. To reduce latency, a pipeline is designed to divide the entire processing process into multiple stages, with each stage carried out in parallel.
The tracking tests in the previous section were repeated by using the FPGA-based hardware system instead of a PC. The processing speed for different processing blocks is shown in Table 1; the computing speed in FPGA reaches no less than 187.970 k A-scan/s for all blocks, which fastens the tracking speed around 90 times. It is also quite stable even with varied block sizes, benefiting from the designated parallel threads with no interruptions in the FPGA. It is worth noting that with the CMOS sensor rate of 70 kHz and the laser controller refresh rate of 50 kHz bottlenecking the overall control rate, the control system enables a maximum feedback control rate of 50 kHz, which is sufficient for controls in most laser drilling processes.
4. Live Control Test
Experiments were carried out to test the performance of the built closed-loop control system by varying a processing variable and evaluating the capacity to maintain the preset drilling depth. One of the processing variables that significantly affects the drilling depth is the position of the drilling plane with respect to the focus plane of the processing beam. Typically, the drilling process is most efficient at the focus plane of the processing beam. Offsetting the focus plane would disperse the energy of the processing beam and result in a shallow and wide-open hole. Focus offset occurs during the high-volume laser drilling process due to the thermal expansion or mechanical micro-movement of the clamping frame introducing deviation into the hole depth. In this test, holes were drilled at various offset focus planes with and without closed-loop control, respectively, to demonstrate the capacity of the built system to maintain the preset drilling depth.
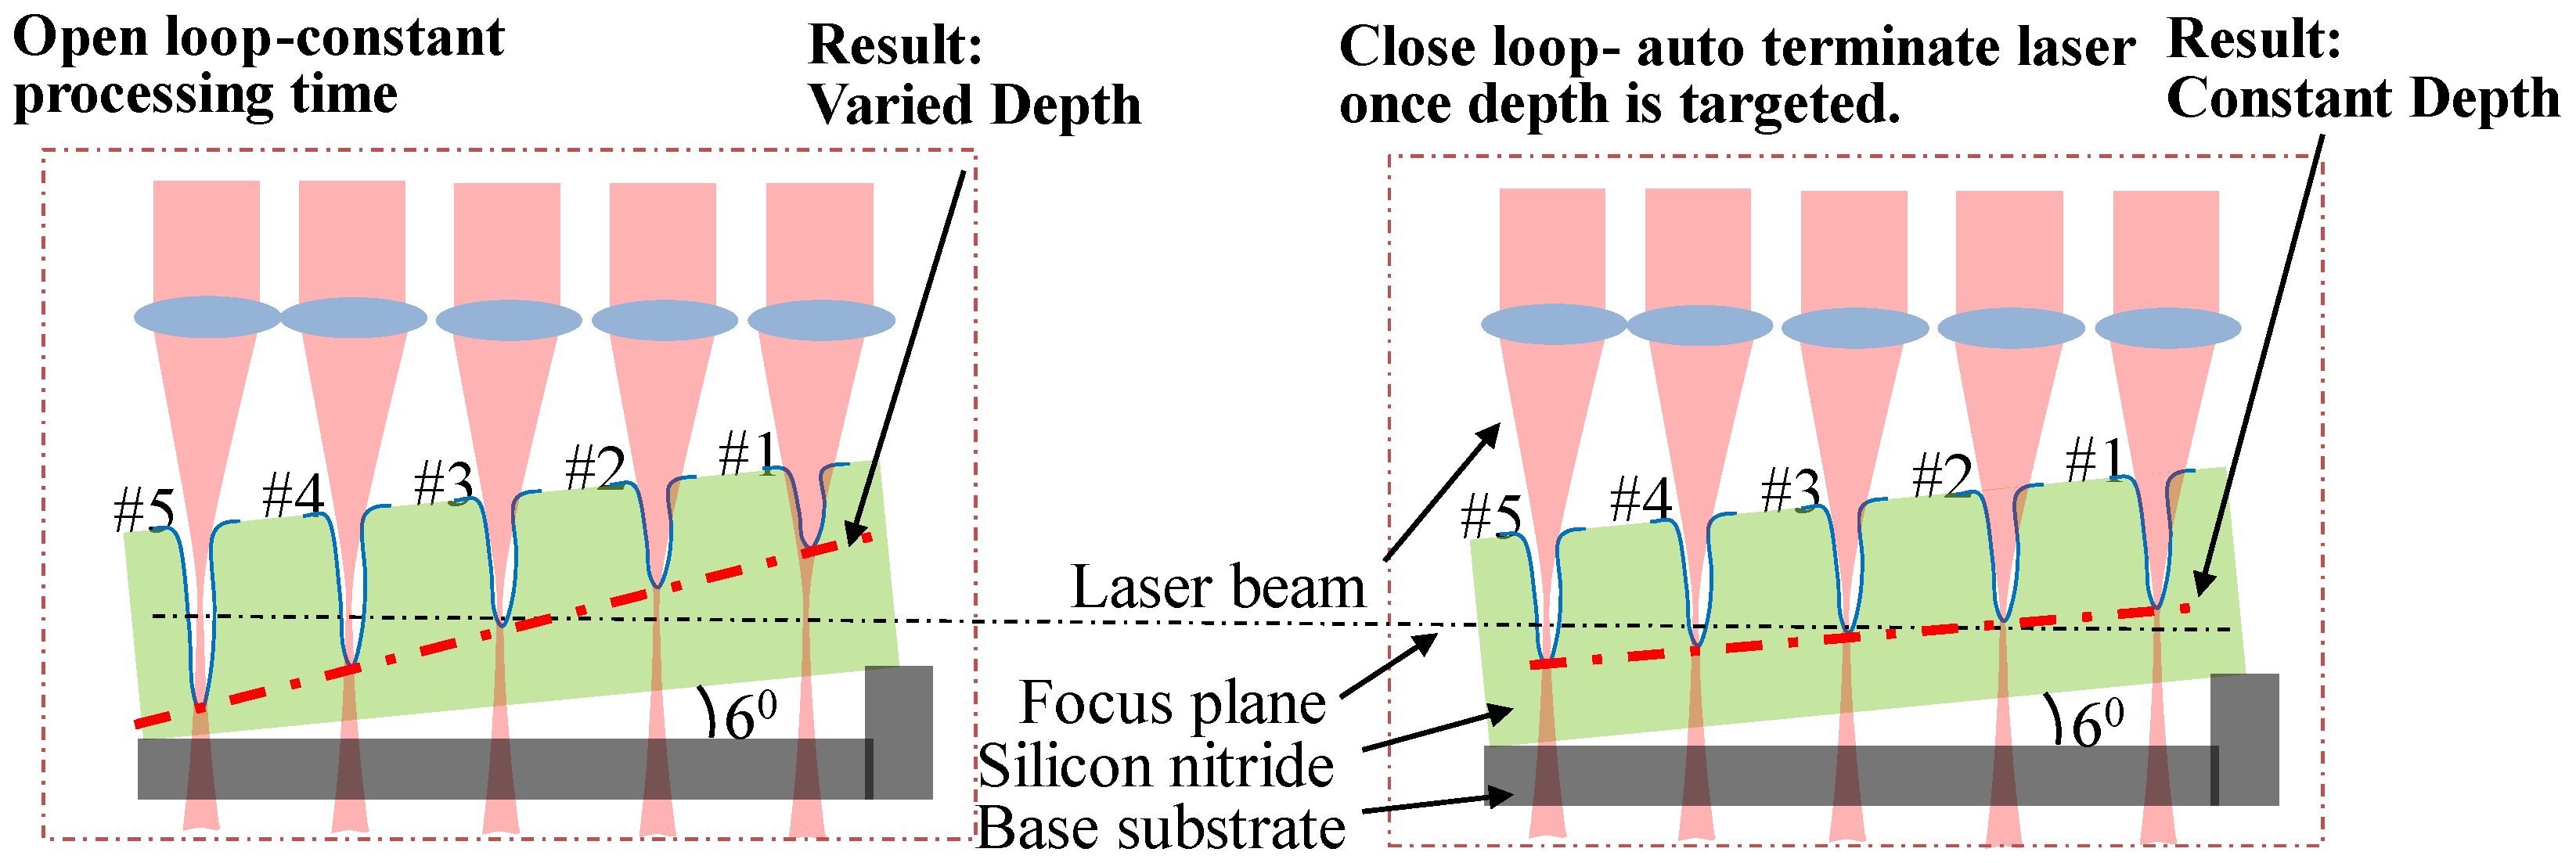
The schematic of the drilling test is shown in Figure 9. The silicon nitride plate is clamped at a 6-degree angle with respect to the base substrate which is fixed on the XY motion stage. The silicon nitride plate is moved by the motion stage so that the laser beam drills the hole from #1 to #5 in sequence. Firstly, five holes were drilled on the titled plate of silicon nitride without closed-loop control. Given the same laser power and time duration, drilling is most efficient with a focus plane aligned with the half-deep point of the hole (as in case #1); the farther the offset to this focus plane, the shallower the hole is. The hole depth would vary as the drilling plane moves away from the focus plane, as shown by the bold dashed line in the left schematic. The right schematic applies the closed-loop control in which a target depth is preset and the laser is terminated once the live depth is targeted. The processing time would vary depending on the efficiency of different processing planes. A constant depth is expected in this scenario with a closed-loop control.
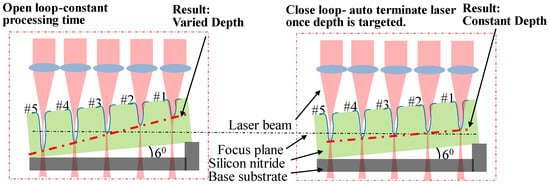
Figure 9.
Schematic of laser drilling performance at different focus offsets with and without control (Left: without control; Right: with control).
4.1. Drill Hole at Different Offsets without Control
The laser power was set at 60 W during the whole drilling process with a constant drilling time of 10 milliseconds for all holes; shielding gas argon was set at 5 mL/min to blow the spatter generated during the drilling process. The depth hole drilled with this set of processing parameters was certified to be around 654.3 m deep with the laser focus at the surface of the material (nominal processing plane). To introduce biases to the hole depth, the material plate was placed 3 mm above the nominal processing plane and clamped at a 6-degree angle with respect to the base substrate.
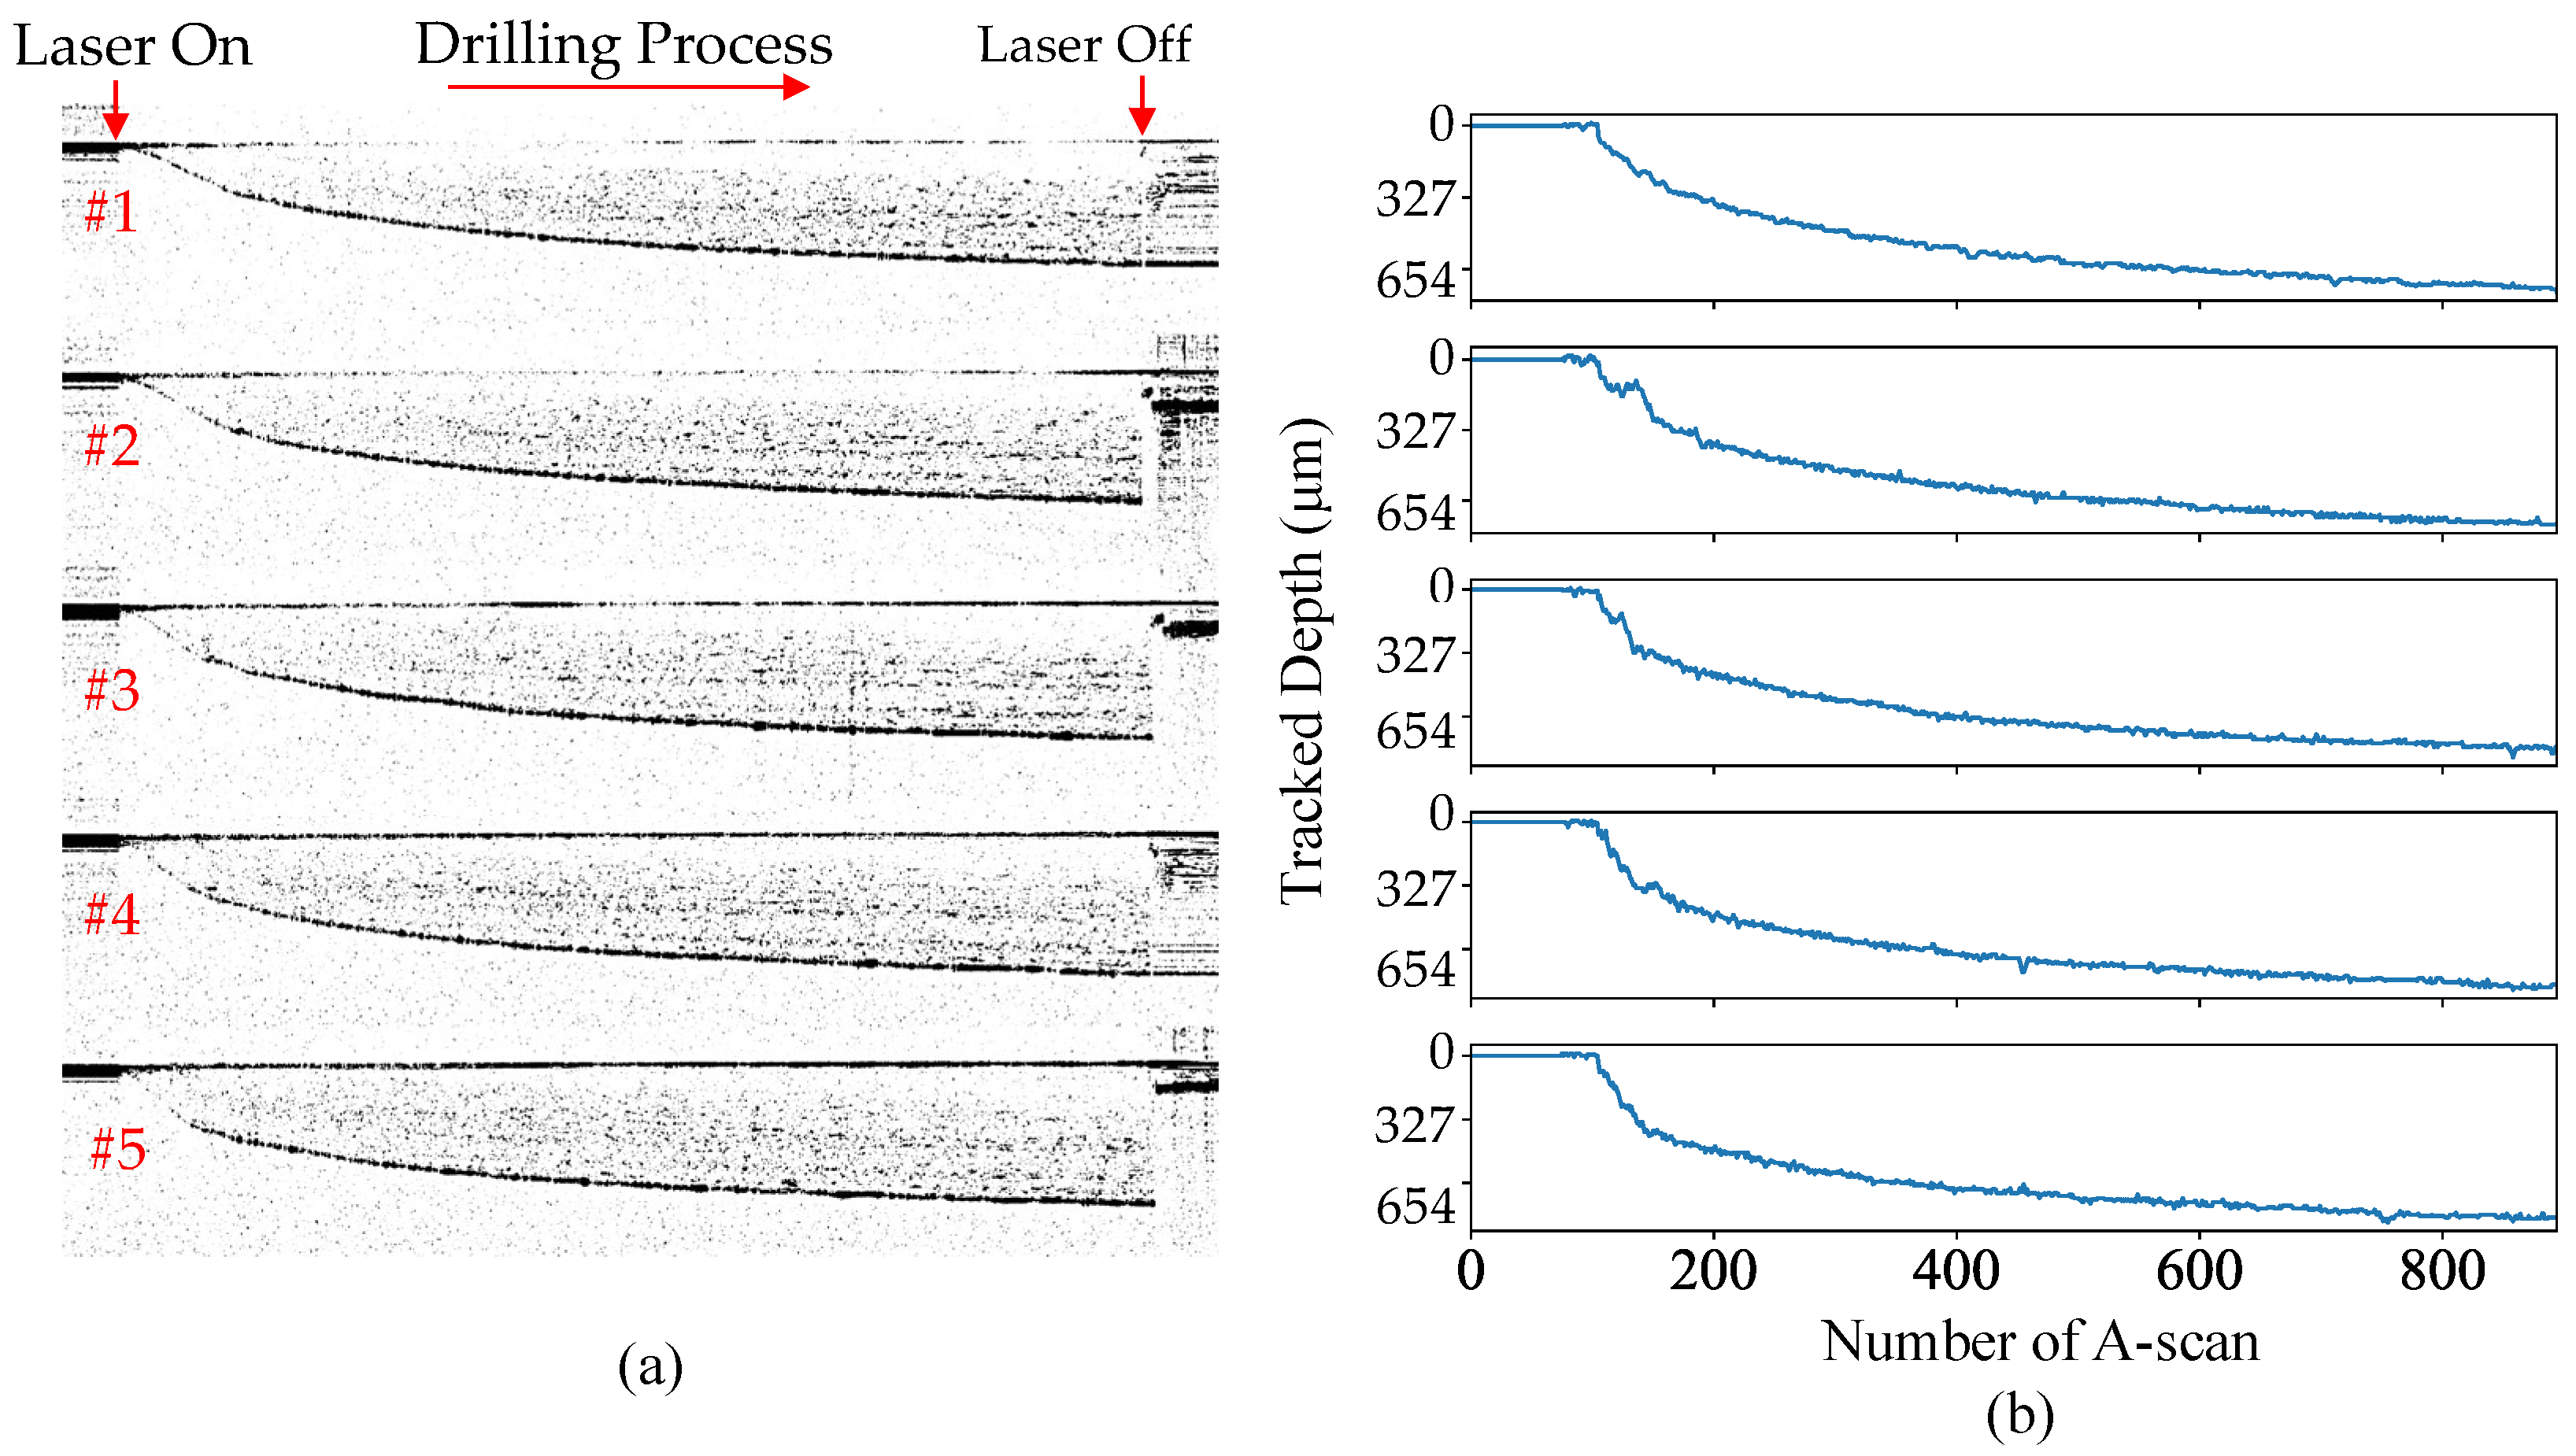
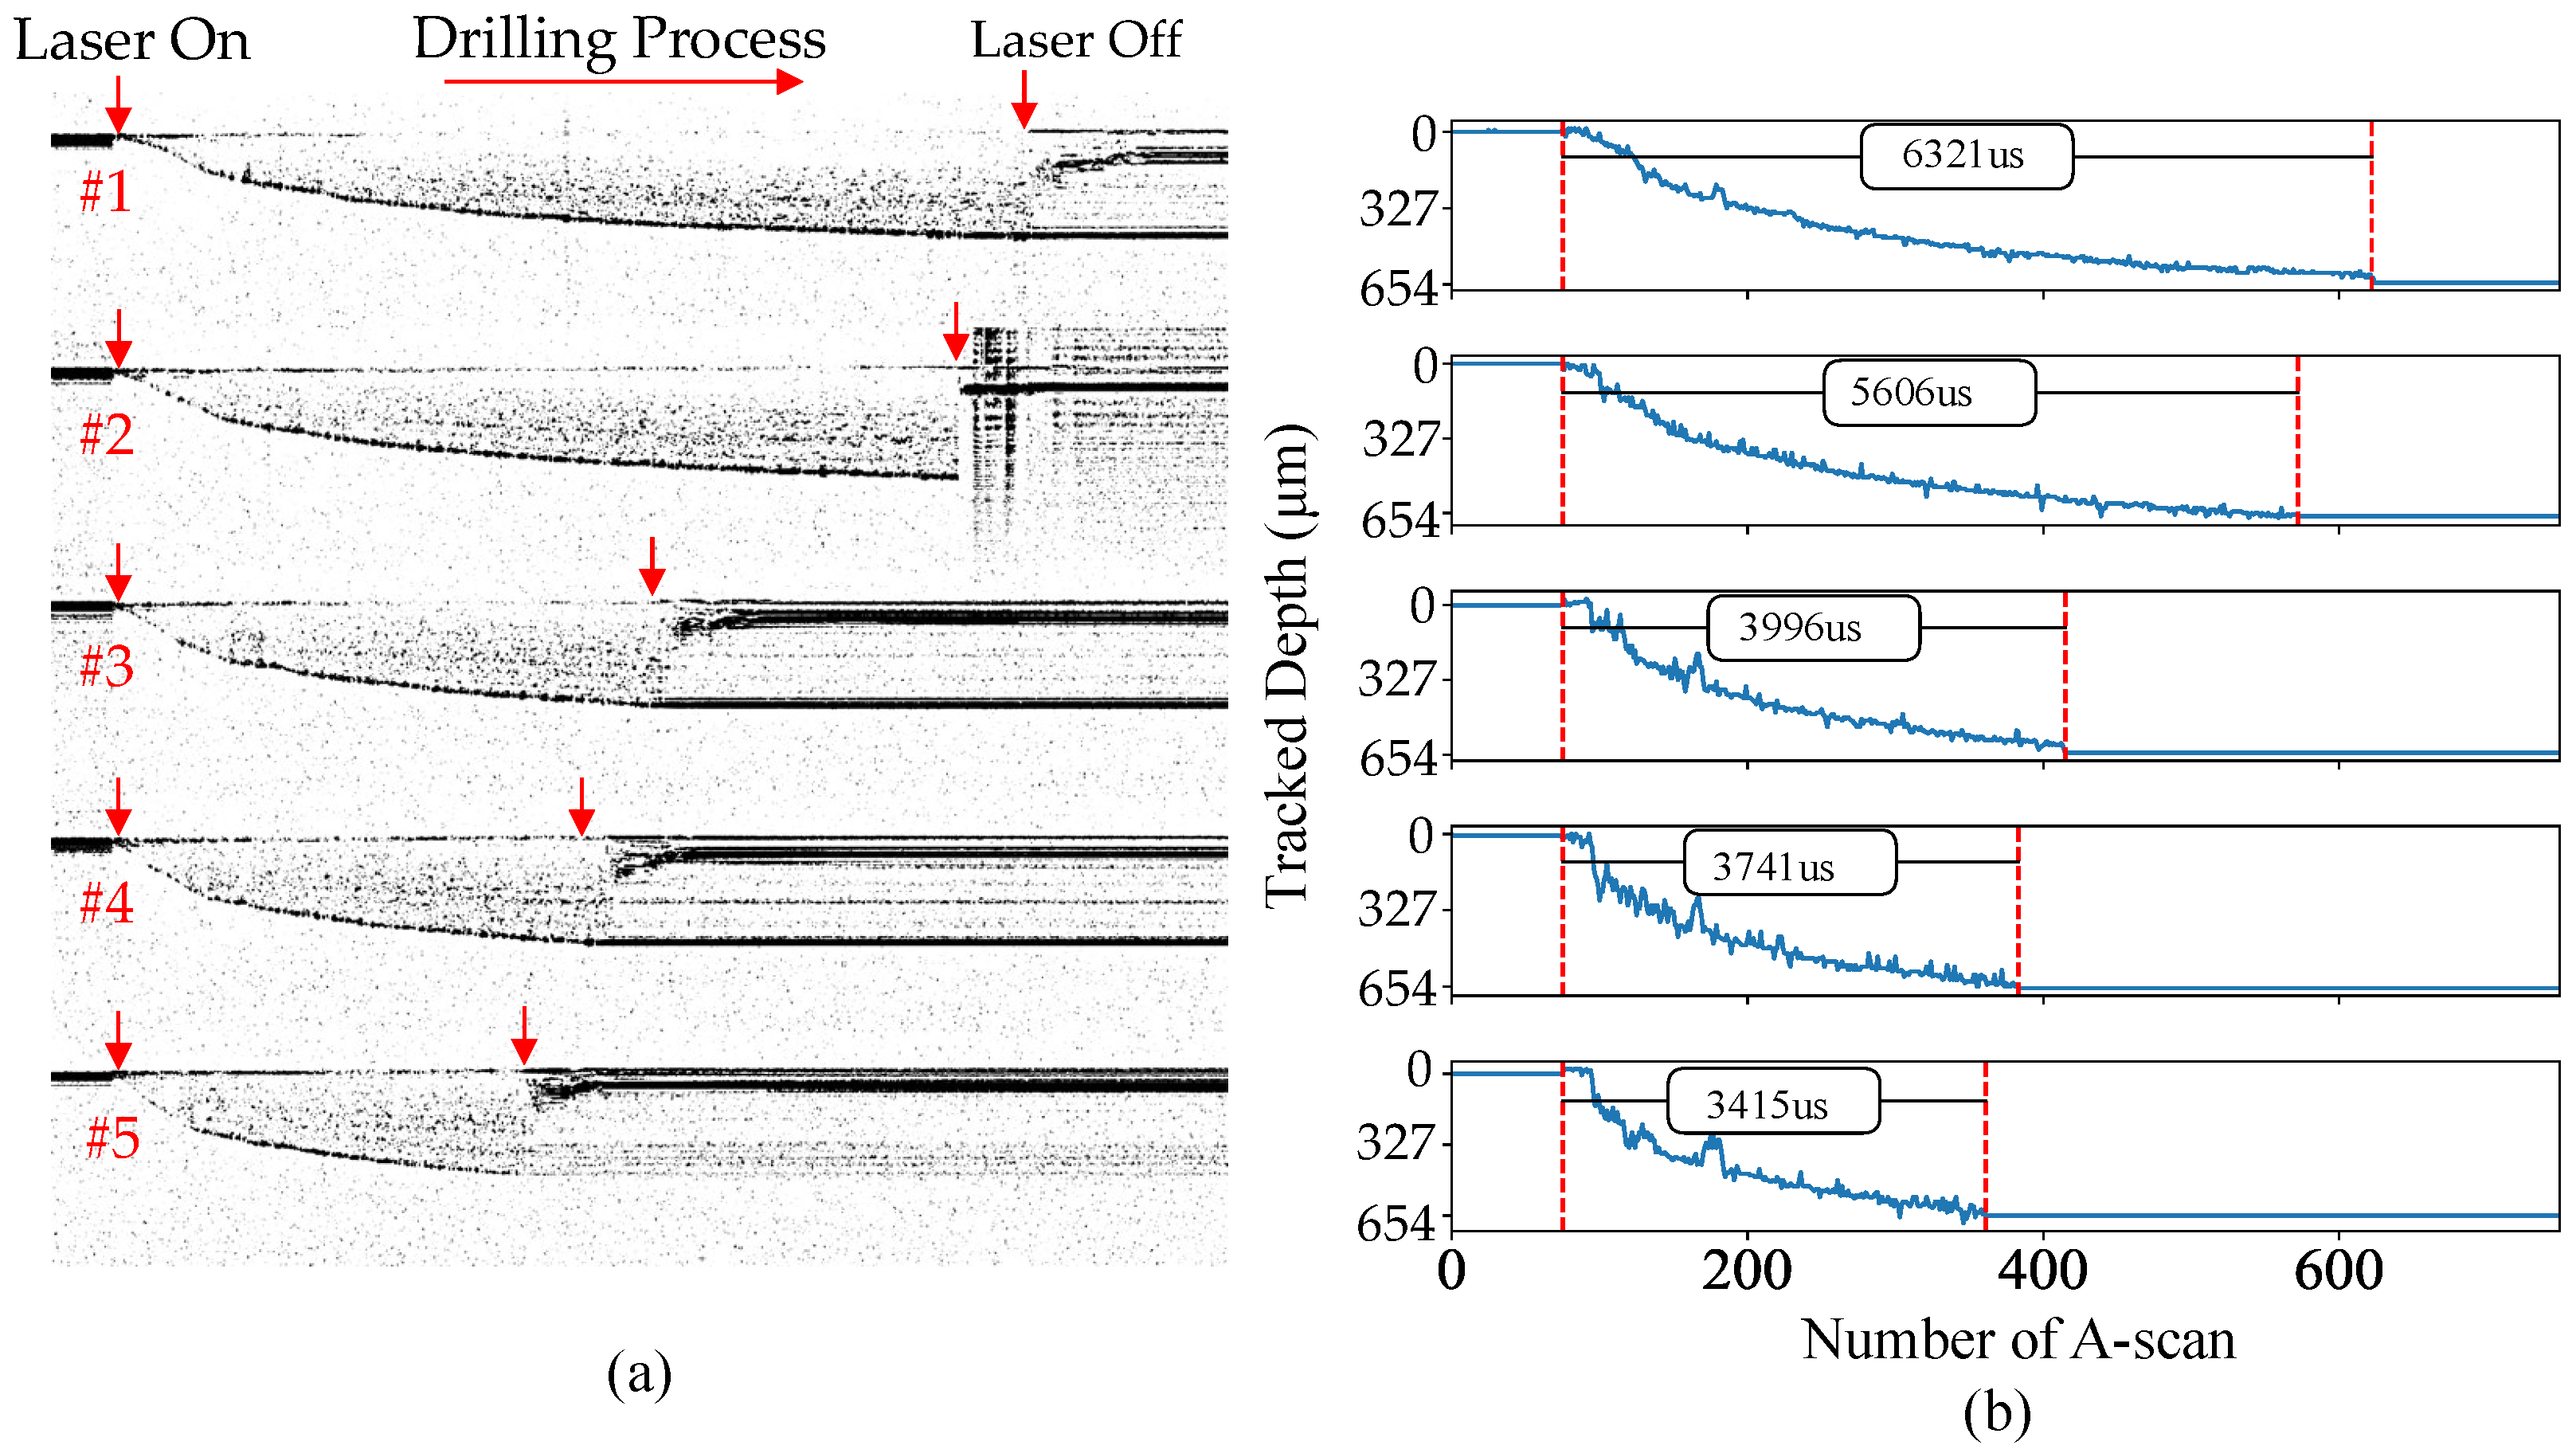
Figure 10 shows the live OCT signals and the tracked depth of the holes. The OCT signal at the beginning when the laser started was typically weaker than the following moments, for the hole was quite small and most of the OCT light was projected on the surface. This introduced difficulty into the proposed tracking algorithm. As shown in Figure 4, where the depth signal is weak at the beginning, the tracked depth profile biased the trend at the beginning. To optimize the tracking performance for a weak signal, live information such as drilling speed (slope) and down-toward searching direction could be used to predict the trend at the signal-starving moment. As it moved deeper, the opening of the hole was wider, allowing more OCT light to project onto the deep bottom of the hole. Nonetheless, the tracked depth, as a whole, matches the FFT calculated values well. The finished depth varied significantly at different offset planes with finished depths of 765.5, 811.3, 837.5, 739.4, and 883.3 m respectively. With a further processing plane, the energy of the processing beam was dispersed and resulted in a shallower hole. Position #1 was at the layer where the half-depth position aligns with the focus plane of the processing beam. So, the average drilling efficiency was relatively greater than in other positions, resulting in deeper holes (see Figure 9). Finally, compared to the expected hole depth of 654.3 m, distinct biases with an averaged error of 179.3 m and Standard Deviation (STD) of 41.8 m were introduced by offsetting the laser focus.
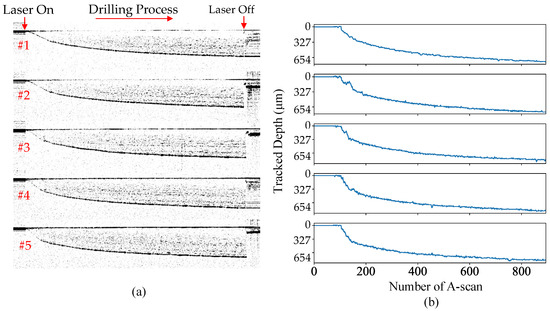
Figure 10.
(a) Online OCT signals during the drilling of the 5 holes; (b) tracked depth of the live holes for the 5 holes.
4.2. Drill Hole at Different Offsets with Control
The same drilling processes were conducted with the closed-loop control system developed in this work. In this test, the actual hole depth tracked during the drilling process was averaged within two sequential A-scans as an output for the determination of laser termination, which resulted in a control time interval of 25 s (40 kHz). Once the live depth reached the preset depth, the FPGA sent a signal to the laser controller to terminate the laser beam. Figure 11a shows the live OCT signal with the finished depths plotted in Figure 11b. As can be seen, the depths are 660.8, 654.3, 641.2, 641.2, and 641.2 m, which were well controlled at around 654.3 m deep with an averaged error of 6.5 m and STD of 8.5 m. The 2-pixel bias could be attributed to the determination of the beginning surface, which is a single reflector; the current method used to determine the surface point is to pick the brightest point in an A-scan which could be optimized by interpolating the pixels for sub-pixel resolution.
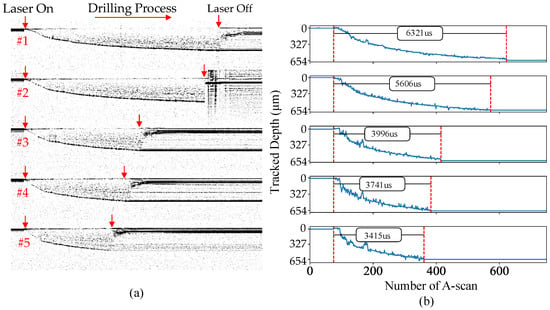
Figure 11.
(a) Online OCT signals during the drilling of the 5 holes; (b) hole depths with and without control, respectively.
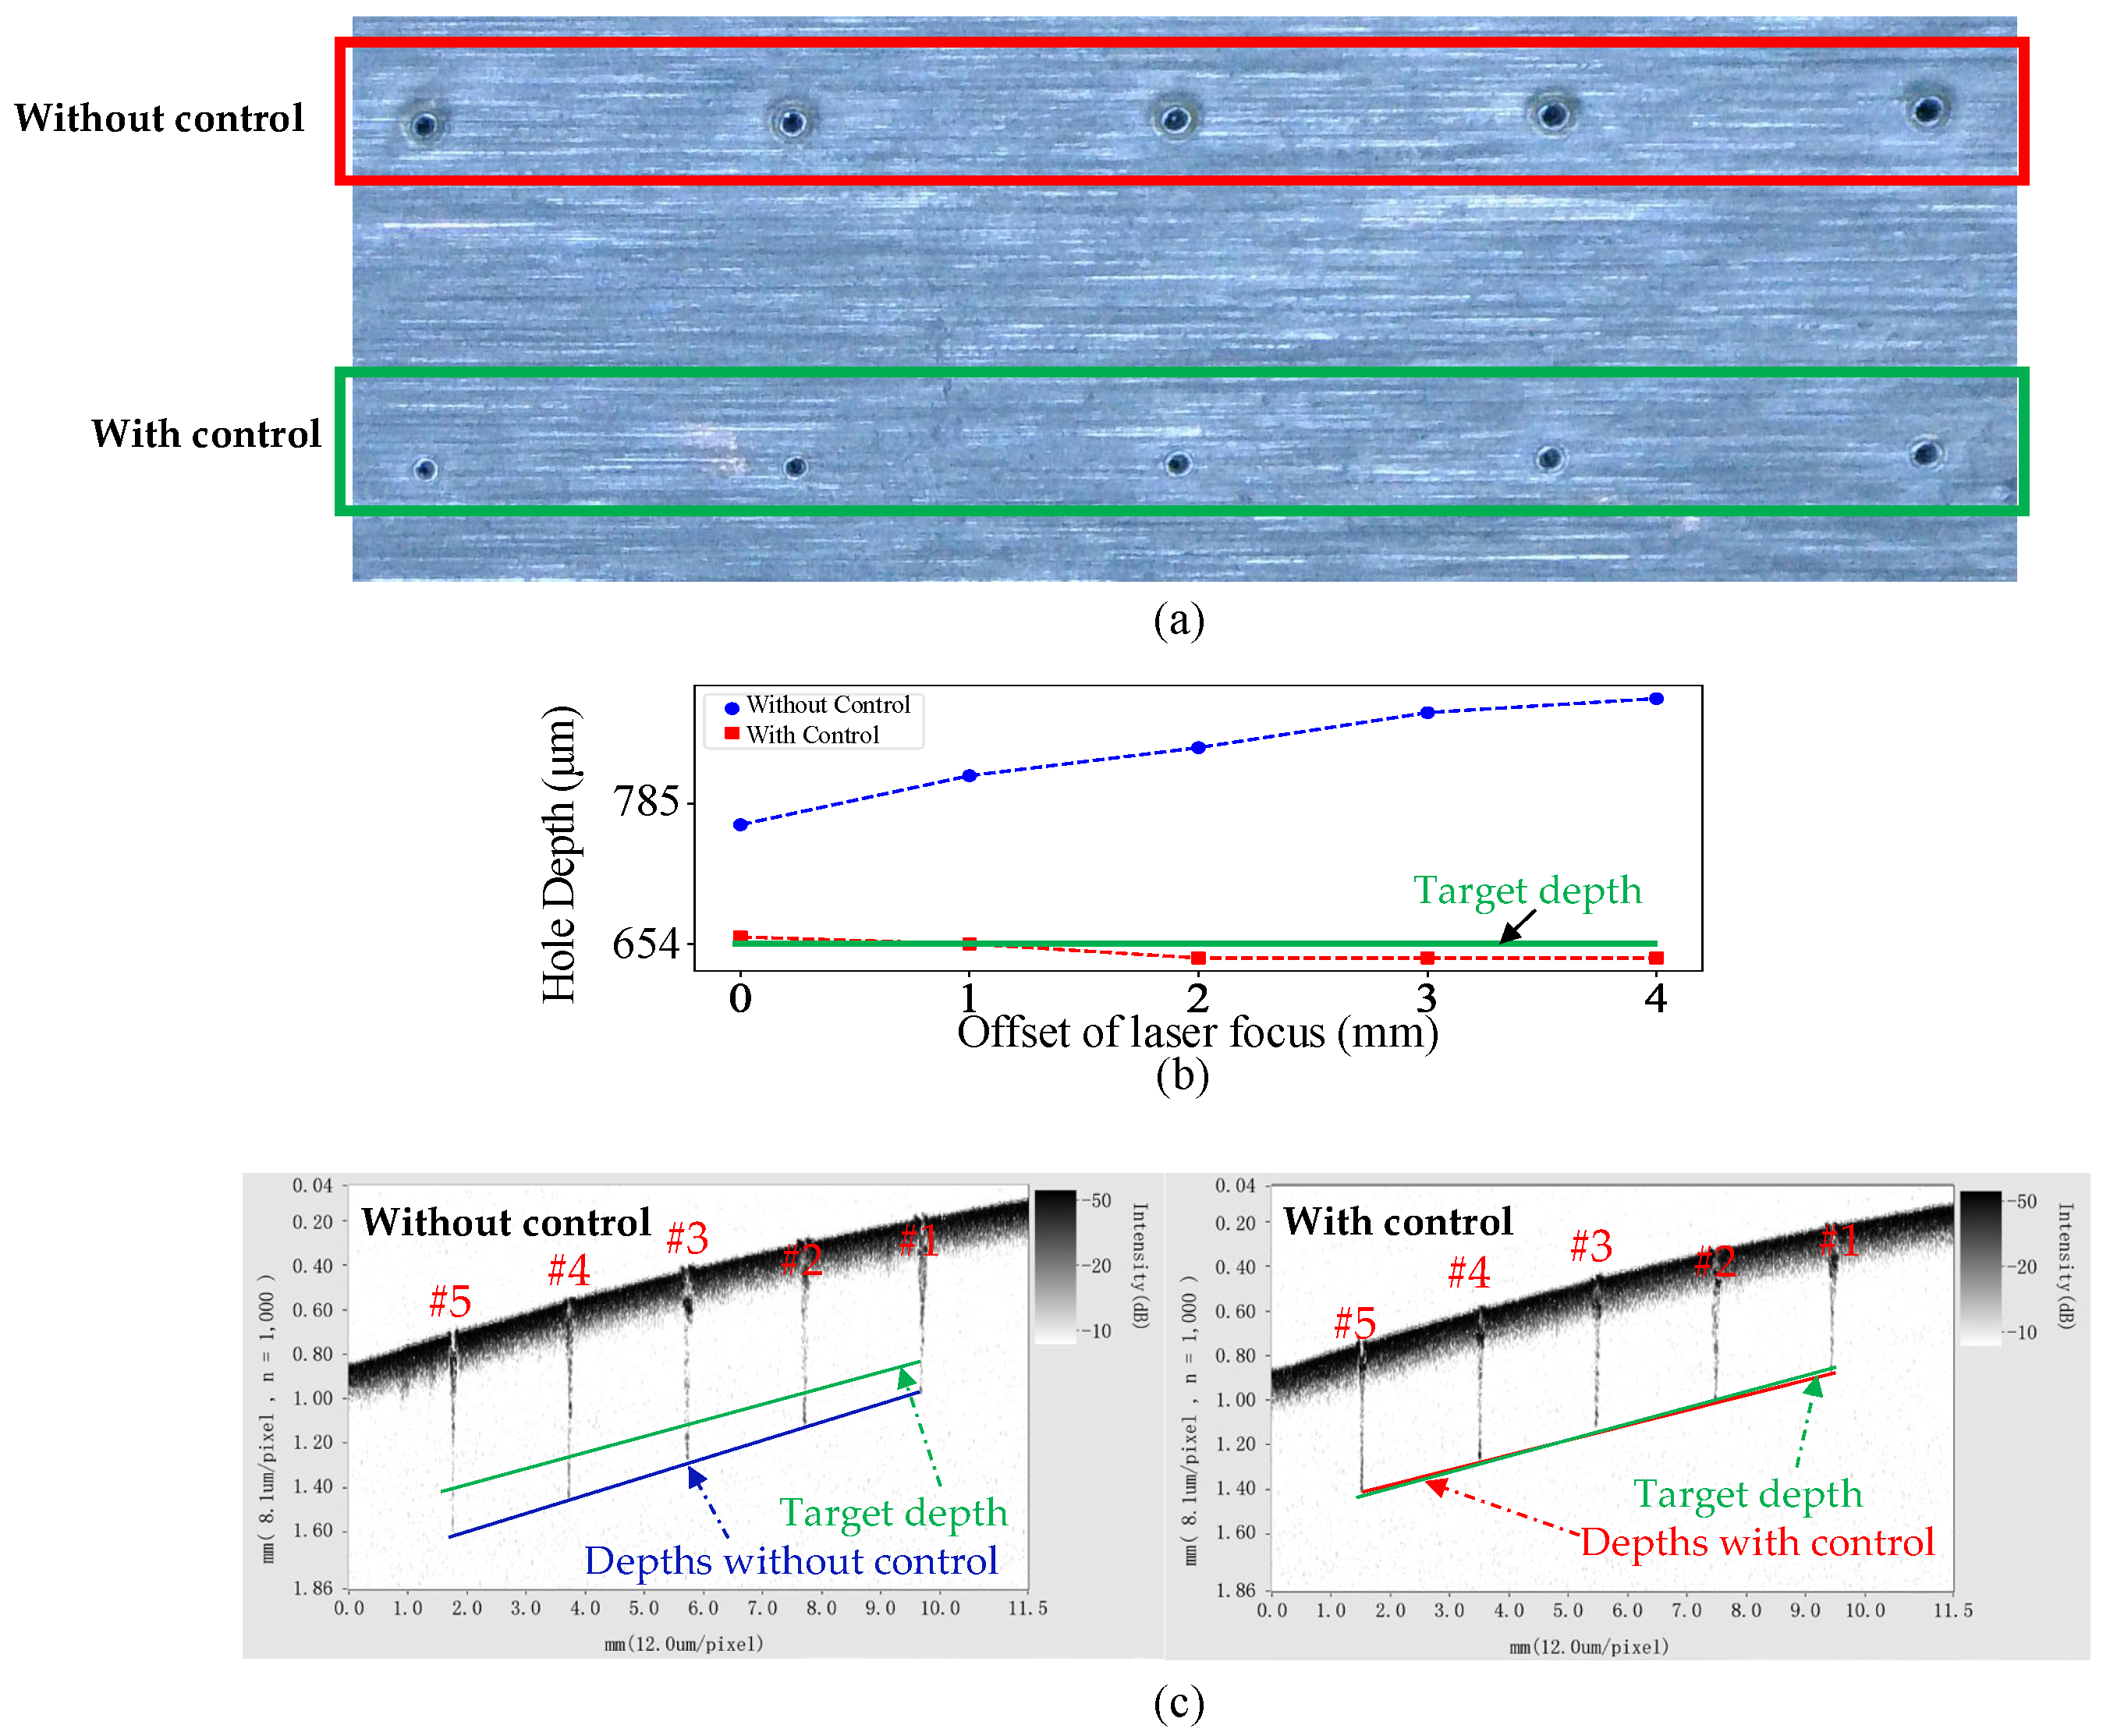
For the verification of the drilled hole depths, an extra offline measurement of the depth of the drilled holes was conducted by using a Santec OCT- IVS-2000, Photonics Valley Ohkusa Campus, Komaki, Japan, which shows the same trend of the finished depths with and without closed-loop control, respectively. As shown in Figure 12, distinct biases in terms of hole depth were introduced by offsetting the laser focus with an average error of 179.3 m and STD of 41.9 m. Through closed-loop control, the bias was well corrected to the targeted depth with an averaged error of 6.5 m and STD of 8.5 m. The developed closed-loop control system of the hole depth exhibited a good performance in achieving the targeted depth.
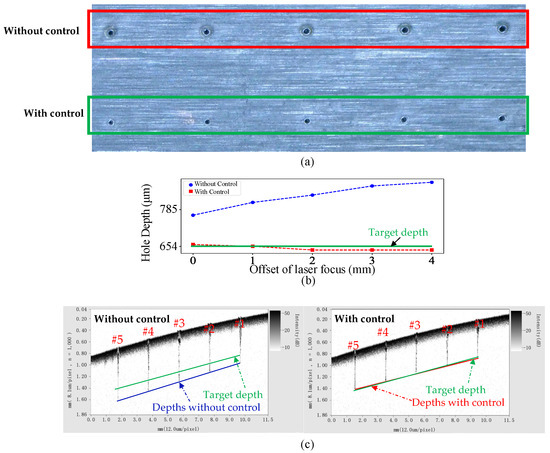
Figure 12.
Hole depth comparison between the ones with control and the ones without control: (a) top surface of the drilled holes; (b) hole depth measured in situ when the laser drilling was finished; (c) post-process measurement for verification with a Santec OCT system.
5. Conclusions
An in situ real-time closed-loop control on the depth of the laser drilling process was implemented by coupling a variant of the biological optical coherent imaging (OCT) into a laser processing head for acquiring a real-time depth spectrum signal and expediting in-line signal processing via an efficient algorithm and dedicated hardware for fast feedback control:
- The computationally heavy FFT involved in biological volume OCT imaging is saved by a depth-tracking algorithm given the two truths of the drilling process that only one interface exists and the interface moves smoothly from one A-scan to the next one. The proposed tracking algorithm expedited the computing speed by six times to 3 k A-scan/s.
- The feedback control rate is further secured by parallelizing the capturing of fringe patterns and the processing of the tracking algorithm in FPGA. Experiments demonstrated that the computing speed of the FPGA reached no less than 187.970 k A-scan/s and stayed stable with various sizes of processing blocks. It is fast enough to conduct live processing for the vast majority of laser drilling processes.
- The test on probe card hole drilling by using the control system shows the capacity of correcting the depths to a target depth within an averaged error of 6.5 m and STD of 8.5 m, which is a huge improvement compared to the hole depths with an averaged error of 179.3 m and STD of 41.9 m without control, showing the good performance of the built control system in achieving the targeted depth.
Author Contributions
Methodology and writing—original draft, J.Z.; software, C.Z.; data curation, J.Z. and C.Z.; funding acquisition and writing—review and editing, Y.D., L.B. and Y.C. All authors have read and agreed to the published version of the manuscript.
Funding
We acknowledge the financial support of the National Natural Science Foundation of China under Grants 62303093, 62003075, U2030205, and 62003074, and the Sichuan Science and Technology Planning Project (2022JDJQ00400 and 2023YFG0044).
Institutional Review Board Statement
Not applicable.
Informed Consent Statement
Not applicable.
Data Availability Statement
The raw data supporting the conclusions of this article will be made available by the authors on request.
Acknowledgments
In this section, you can acknowledge any support given which is not covered by the author contribution or funding sections. This may include administrative and technical support, or donations in kind (e.g., materials used for experiments).
Conflicts of Interest
The authors declare no conflicts of interest.
References
- Chu, W.S.; Kim, C.S.; Lee, H.T.; Choi, J.O.; Park, J.I.; Song, J.H.; Jang, K.H.; Ahn, S.H. Hybrid manufacturing in micro/nano scale: A review. Int. J. Precis. Eng.-Manuf.-Green Technol. 2014, 1, 75–92. [Google Scholar] [CrossRef]
- Choi, W.C.; Ryu, J.Y. Fabrication of a guide block for measuring a device with fine pitch area-arrayed solder bumps. Microsyst. Technol. 2012, 18, 333–339. [Google Scholar] [CrossRef]
- Chatterjee, S.; Mahapatra, S.S.; Xu, J.; Brabazon, D. Influence of parameters on performance characteristics and defects during laser microdrilling of titanium alloys using RSM. Int. J. Adv. Manuf. Technol. 2023, 129, 4569–4587. [Google Scholar] [CrossRef]
- Jia, X.; Dong, J.; Chen, Y.; Wang, H.; Zhu, G.; Kozlov, A.; Zhu, X. Nanosecond-millisecond combined pulse laser drilling of alumina ceramic. Opt. Lett. 2020, 45, 1691–1694. [Google Scholar] [CrossRef] [PubMed]
- Jia, X.; Chen, Y.; Liu, L.; Wang, C. Combined pulse laser: Reliable tool for high-quality, high-efficiency material processing. Opt. Laser Technol. 2022, 153, 108209. [Google Scholar] [CrossRef]
- Jia, X.; Li, K.; Li, Z.; Wang, C.; Chen, J.; Cui, S. Multi-scan picosecond laser welding of non-optical contact soda lime glass. Opt. Laser Technol. 2023, 161, 109164. [Google Scholar] [CrossRef]
- Webster, P.J.; Leung, B.Y.; Joe, X.; Anderson, M.D.; Hoult, T.P.; Fraser, J.M. Coaxial real-time metrology and gas assisted laser micromachining: Process development, stochastic behavior, and feedback control. In Proceedings of the Micromachining and Microfabrication Process Technology XV, San Francisco, CA, USA, 26 January 2010; SPIE: Bellingham, WA, USA, 2010; Volume 7590, pp. 15–24. [Google Scholar]
- Lin, C.H.; Powell, R.A.; Jiang, L.; Xiao, H.; Chen, S.J.; Tsai, H.L. Real-time depth measurement for micro-holes drilled by lasers. Meas. Sci. Technol. 2010, 21, 025307. [Google Scholar] [CrossRef]
- Zhang, Z.; Wang, W.; Jiang, R.; Zhang, X.; Xiong, Y.; Mao, Z. Investigation on geometric precision and surface quality of microholes machined by ultrafast laser. Opt. Laser Technol. 2020, 121, 105834. [Google Scholar] [CrossRef]
- Chen, X.; Xu, Y.; Chen, N.K.; Shy, S.; Chui, H.C. In-situ depth measurement of laser micromachining. Photonics 2021, 8, 493. [Google Scholar] [CrossRef]
- Wang, C.S.; Hsiao, Y.H.; Chang, H.Y.; Chang, Y.J. Process Parameter Prediction and Modeling of Laser Percussion Drilling by Artificial Neural Networks. Micromachines 2022, 13, 529. [Google Scholar] [CrossRef]
- Lv, J.; Dong, X.; Wang, K.; Duan, W.; Fan, Z.; Mei, X. Study on process and mechanism of laser drilling in water and air. Int. J. Adv. Manuf. Technol. 2016, 86, 1443–1451. [Google Scholar] [CrossRef]
- Kumar, D.; Gururaja, S. Investigation of hole quality in drilled Ti/CFRP/Ti laminates using CO2 laser. Opt. Laser Technol. 2020, 126, 106130. [Google Scholar] [CrossRef]
- Lim, D.W.; Kim, M.; Choi, P.; Yoon, S.J.; Lee, H.T.; Kim, K. Hole Depth Prediction in a Femtosecond Laser Drilling Process Using Deep Learning. Micromachines 2023, 14, 743. [Google Scholar] [CrossRef] [PubMed]
- Saif, Y.; Yusof, Y.; Latif, K.; Kadir, A.Z.A.; binti lliyas Ahmed, M.; Adam, A.; Hatem, N.; Memon, D.A. Roundness Holes’ Measurement for milled workpiece using machine vision inspection system based on IoT structure: A case study. Measurement 2022, 195, 111072. [Google Scholar] [CrossRef]
- Ho, C.C.; Li, G.H. Study on the measurement of laser drilling depth by combining digital image relationship measurement in aluminum. Materials 2021, 14, 489. [Google Scholar] [CrossRef] [PubMed]
- Webster, P.J.; Joe, X.; Leung, B.Y.; Anderson, M.D.; Yang, V.X.; Fraser, J.M. In situ 24 kHz coherent imaging of morphology change in laser percussion drilling. Opt. Lett. 2010, 35, 646–648. [Google Scholar] [CrossRef]
- Hasegawa, S.; Fujimoto, M.; Atsumi, T.; Hayasaki, Y. In-process monitoring in laser grooving with line-shaped femtosecond pulses using optical coherence tomography. Light. Adv. Manuf. 2022, 3, 427–436. [Google Scholar] [CrossRef]
- Lin, J.; Zhong, S.; Zhang, Q.; Zhong, J.; Nsengiyumva, W.; Peng, Z. Swept-source optical coherence vibrometer: Principle and applications. IEEE Trans. Instrum. Meas. 2022, 71, 7002209. [Google Scholar] [CrossRef]
- Holder, D.; Weber, R.; Graf, T.; Onuseit, V.; Brinkmeier, D.; Förster, D.J.; Feuer, A. Analytical model for the depth progress of percussion drilling with ultrashort laser pulses. Appl. Phys. A 2021, 127, 302. [Google Scholar] [CrossRef]
- Sun, T.; Fan, Z.; Sun, X.; Ji, Y.; Zhao, W.; Cui, J.; Mei, X. Femtosecond laser drilling of film cooling holes: Quantitative analysis and real-time monitoring. J. Manuf. Process. 2023, 101, 990–998. [Google Scholar] [CrossRef]
- Ho, C.C.; Chang, Y.J.; Hsu, J.C.; Chiu, C.M.; Kuo, C.L. Optical emission monitoring for defocusing laser percussion drilling. Measurement 2016, 80, 251–258. [Google Scholar] [CrossRef]
- Xie, X.; Zhang, Y.; Huang, Q.; Huang, Y.; Zhang, W.; Zhang, J.; Long, J. Monitoring method for femtosecond laser modification of silicon carbide via acoustic emission techniques. J. Mater. Process. Technol. 2021, 290, 116990. [Google Scholar] [CrossRef]
- Subasi, L.; Gokler, M.I.; Yaman, U. A comprehensive study on water jet guided laser micro hole drilling of an aerospace alloy. Opt. Laser Technol. 2023, 164, 109514. [Google Scholar] [CrossRef]
- Krause, T.J.; Allen, T.R.; Fraser, J.M. Self-witnessing coherent imaging for artifact removal and noise filtering. Opt. Lasers Eng. 2022, 151, 106936. [Google Scholar] [CrossRef]
- Ji, Y.; Grindal, A.W.; Webster, P.J.; Fraser, J.M. Real-time depth monitoring and control of laser machining through scanning beam delivery system. J. Phys. Appl. Phys. 2015, 48, 155301. [Google Scholar] [CrossRef]
- Fleming, T.G.; Clark, S.J.; Fan, X.; Fezzaa, K.; Leung, C.L.A.; Lee, P.D.; Fraser, J.M. Synchrotron validation of inline coherent imaging for tracking laser keyhole depth. Addit. Manuf. 2023, 77, 103798. [Google Scholar] [CrossRef]
- Webster, P.J.; Wright, L.G.; Mortimer, K.D.; Leung, B.Y.; Yu, J.X.; Fraser, J.M. Automatic real-time guidance of laser machining with inline coherent imaging. J. Laser Appl. 2011, 23, 022001. [Google Scholar] [CrossRef]
Disclaimer/Publisher’s Note: The statements, opinions and data contained in all publications are solely those of the individual author(s) and contributor(s) and not of MDPI and/or the editor(s). MDPI and/or the editor(s) disclaim responsibility for any injury to people or property resulting from any ideas, methods, instructions or products referred to in the content. |
© 2024 by the authors. Licensee MDPI, Basel, Switzerland. This article is an open access article distributed under the terms and conditions of the Creative Commons Attribution (CC BY) license (https://creativecommons.org/licenses/by/4.0/).

