Abstract
A photonic instantaneous microwave frequency measurement scheme based on frequency-to-time mapping and channelization is proposed. An unknown signal is divided into four channels and mixed with a broadband linear frequency-modulated signal. The frequency information is converted to the time domain, and the frequency measurement range has been expanded due to channelization. A simulation system has been constructed to demonstrate the effectiveness of the proposed method. A proof-of-concept experimental result shows that the frequency measurement errors can be kept in 20 MHz with a 10 MHz resolution, and the frequency measurement range is 1 GHz to 39 GHz.
1. Introduction
Instantaneous frequency measurement (IFM) can determine the frequency of unknown microwave signals, providing initial threat classification of incoming signals and suggesting frequency ranges to focus processing resources, which makes IFM important for modern radar and electronic warfare (EW) systems. Electronic IFM receivers are widely utilized, but the frequency measurement ranges are usually restricted to around 18 GHz due to the bandwidth limitations of electronic circuits. Photonic technology is renowned for its broad bandwidth and immunity to electromagnetic interference. The photonic implementations for IFMs have aroused increasing interest [1,2]. Over the past few decades, microwave photonics (MWP) in communication systems, especially the radio-over-fiber technique, has been extensively researched [3]. Recently, an increasing amount of attention has been paid to MWP applications in radar and EW systems. Substantial efforts have been made on photonic-assisted IFMs and a great number of schemes have been proposed [4,5,6].
These approaches can be generally divided into three types: frequency-to-power mapping [7,8,9,10,11,12,13], frequency-to-space mapping [14,15], and frequency-to-time mapping (FTTM) [16,17,18,19,20,21,22,23]. FTTM is usually realized by constructing an amplitude comparison function (ACF), which is established by comparing the responses of the two transmission channels. This method has the drawback of only measuring single-tone signals, making it less practical in a spectral-cluttered environment. For frequency-to-space mapping, the signal under test (SUT) is modulated on the optical carrier, and then it is divided into multiple channels. Through this way, the frequency of the SUT is estimated. For the frequency-to-space mapping method, spectral slicing is an essential process that is implemented by narrow sub-band optical filters. However, multiple optical carriers will increase the size, weight, and power consumption of the system. The frequency measurement can also be realized by frequency-to-time mapping. In [4], an unknown signal mixes with a broadband LFM signal, and then the frequency information is inversely mapped using the relationship between the input frequency and the time difference of a pair of pulses.
The LFM signal can not only be applied in IFM systems, but also mostly in radar systems. One of the MWP radar architectures uses a MWP frequency quadrupler to generate a broadband LFM, enabling a very large range resolution. Thus, the LFM signal-based MWP system can achieve IFM and radar functions simultaneously. A photonic IFM and radar system based on polarization–division multiplexing has been proposed. A light with ±2nd-order LFM is used for detection, and IFM functions simultaneously, which is modulated by the signal under test and the radar echo along two orthogonal polarizations through a dual-polarization modulator. The polarization division multiplexing architecture helps reduce the size of the system. In addition, the MWP frequency quadrupler expands the frequency measurement range from 2 GHz to 8 GHz. However, it is unable to cover the operating frequency range of radar and electronic warfare systems, which is considered to be 0–40 GHz.
In this paper, we propose and demonstrate a microwave multi-frequency measurement system which combines the frequency-to-time mapping method with photonics-assisted microwave channelization. The frequency information of an unknown microwave signal is inversely mapped using the relationship between the input microwave frequency and the time delay of the generated pulses. Signals under test are divided into four channels. With a large bandwidth LFM signal, each channel’s frequency measurement range is up to 10 GHz. A large microwave frequency measurement ranging from 1–39 GHz as well as a low measurement error of 20 MHz is realized. Furthermore, a measurement resolution for a two-tone signal is as low as 10 MHz.
2. Principle
The proposed measurement schematic is shown in Figure 1. The system consists of one LD, two couplers, an optical frequency comb generator, two dual-parallel Mach-Zehnder modulators (DPMZMs), two erbium-doped fiber amplifiers (EDFAs), a UDWDM, four photonics image rejection mixers, and band pass filters. A continuous-wave (CW) light wave with a frequency of is divided into two parts by the 3 dB coupler. One part is sent to the optical frequency comb (OFC) generator, which consisted of two cascaded MZMs. A 10 GHz local oscillator (LO) signal is applied to the OFC generator to generate four optical LO signals. The obtained optical LO signal can be expressed as
where is the first type of n-th order Bessel function, is the modulation factor, and is the frequency of the LO signals, as well as the frequency interval of the optical frequency comb. The four comb lines are divided into four channels by the UDWDM. The output of the UDWDM plays the role of the optical LO signal. The frequencies of the optical LO signal in the four channels are, respectively, , , , .
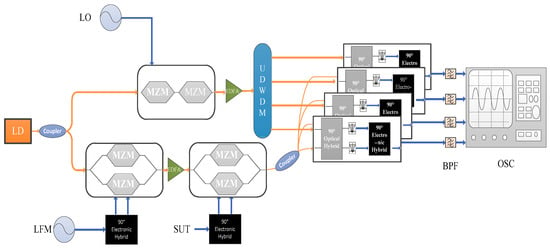
Figure 1.
Schematic diagram of the proposed microwave multi-frequency measurement system. LD: laser diode; LFM: linear frequency modulation; MZM: Mach-Zehnder modulator; EDFA: erbium-doped fiber amplifier; UDWDM: ultra-dense wavelength division multiplexer; BPF: bandpass filter; OSC: oscilloscope.
Another part of the CW light is modulated by two LFM signals, firstly when passing through a dual-parallel MZM (DPMZM). The pair of LFM signals are generated by an arbitrary waveform generator (AWG) with an electrical 90 degree hybrid, thus they have a phase difference of between each other. The DPMZM consists of two sub-MZMs and a main MZM. The two sub-MZMs are located on the two arms of the main MZM and biased at the minimum transmission point (MATP), while the main MZM is biased at the linear transmission point (MITP) to achieve carrier suppressed single sideband (CS-SSB) modulation. Another DPMZM is driven by the signal under test in the same way. The obtained optical signal after the first DPMZMs can be expressed as:
The signal under test is fed into the second DPMZM. The phase difference between the signal under test and the bias point of the MZMs of the second DPMZM are the same as the first one, so the output signal can be expressed as:
After the power splitter, the output signal is divided into four branches. Each of them is combined with an optical LO signal originating from the OFCG in the photonic image rejection mixer, which is a typical Hartley architecture consisting of a 90° optical hybrid, a balanced photodiode, and a 90° electric hybrid coupler [24]. The down-converted signal at the output of the image rejection mixer is then filtered by a 1 GHz band pass filter in each channel. Therefore, a series of pulses can be obtained at the output of bandpass filter. The prerequisite of the output pulse is the relationship of , , and , which is as follows:
where , for the 0–40 GHz input . When the SUT frequencies fall in the range of 0–40 GHz, pulses can be observed at a certain channel or several channels. Therefore, by simply measuring the corresponding time intervals, multi-frequency measurements can be achievable in our proposed system.
3. Simulation and Experiment
A microwave frequency measurement example is numerically studied in the Optisystem software 15.0. Optisystem is an optical communication system simulation package that can not only design optical links in the physical layer of optical networks but also microwave photonic links. Based on the Optisystem 15.0 platform, the proposed IFM system is constructed to verify the correctness of the theoretical results and provide a reference for theoretical research. The simulation model of the proposed IFM system is shown in Figure 2 and the parameters of the devices in the simulation are shown in Table 1, where SUT mixes with the LFM signal and is down-converted. After FTTM, the results are analyzed by an oscilloscope visualizer.
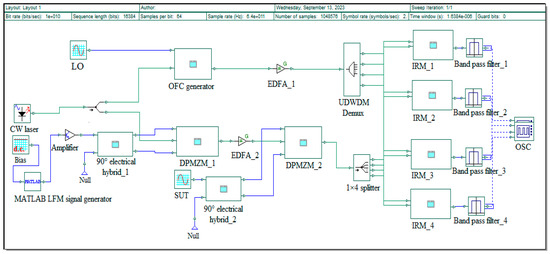
Figure 2.
Simulation system for the proposed architecture based on Optisystem platform.

Table 1.
Parameters of the devices in the simulation.
The laser is divided into two parts through the splitter. One part is the LO light, and another part is the signal light. Figure 3 shows the optical spectrum of the OFC generator and the DPMZM2. Four comb lines are used as optical LO signals. Both the LFM signal and the SUT are up-converted into the optical domain through the CS-SSB modulation with DPMZMs. The carrier suppression ratio is about 37.6 dB. As the signal light sweeps, a beat frequency that can pass through the filter is generated when the frequency difference between the signal light and the LO light is 1 GHz. The photonic image rejection mixers are applied to ensure that only one pulse is generated in one cycle.
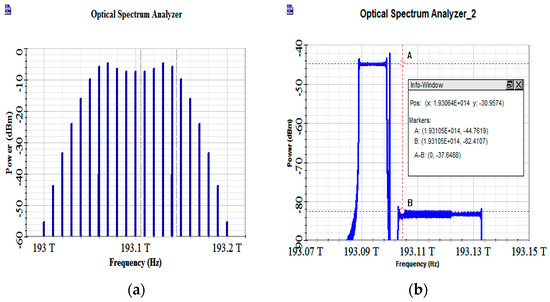
Figure 3.
Optical spectrum of OFC generator (a) and DPMZM2 (b).
To make the pulse delay corresponding to the SUT of the DC signal zero, the frequency of the LFM signal is from 1 GHz to 11 GHz. Figure 4 shows the short-time Fourier transform (STFT) spectrogram of the LFM signal, indicating that the LFM signal has good linearity.
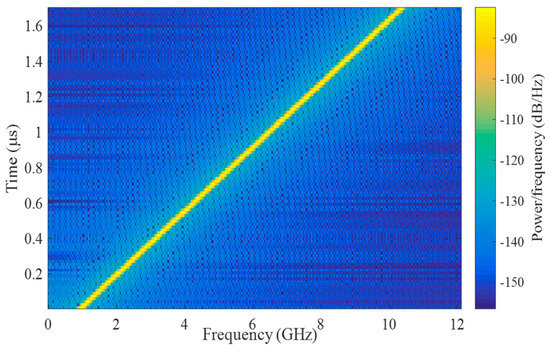
Figure 4.
Short-time Fourier transform spectrogram of the LFM signal.
The simulation results are shown in Figure 5. The frequency of the SUT is swept from 1 GHz to 39 GHz in the 2 GHz step. Figure 5 is a spectrogram of the four channels. The horizontal axis in the figure represents time corresponding to one cycle of the LFM signal, and the vertical axis represents the SUT frequency. The z-coordinate represents the magnitude of the signal, distinguished by different colors. The results indicate that the input signal from 1 to 39 GHz is divided into four parts, with a bandwidth of 10 GHz for each part. The number of channels can directly determine the frequency measurement range of the LFM system. Within each channel, the time delay of the pulse increases as the input frequency signal increases. The first figure of the SUT can be measured in this way.
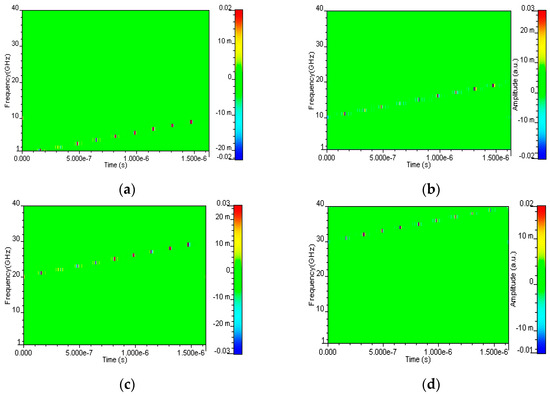
Figure 5.
Oscilloscope waveforms vary with the SUT frequency from 1 to 39 GHz. (a) Channel 1. (b) Channel 2. (c) Channel 3. (d) Channel 4.
The proposed architecture has a self-heterodyned structure, and it will introduce phase-induced intensity noise. To verify the impact of the noise, we analyzed the output waveforms of different laser linewidths, which are directly related to the phase-induced intensity noise. Figure 6 shows the output waveforms vary with the laser linewidth; different time delays are introduced to avoid the overlapping. Figure 6a is the waveform output from the BPD directly; the rectangular shape is the LFM signal mixed with SUT, and the amplitude of waveforms is continuous throughout the entire cycle of the LFM due to the lack of filtering. It can be seen that there is significant intensity noise when the linewidth is larger than 1 MHz. Figure 6b is the waveform output from the BPF. After passing through the BPD, the waveform turned into a pulse, and it is basically consistent for different linewidths. The results indicate that the output waveform is almost unaffected by the phase-induced intensity noise. The BPF not only achieves the last step of FTTM but also filters out most of the phase-induced intensity noise.
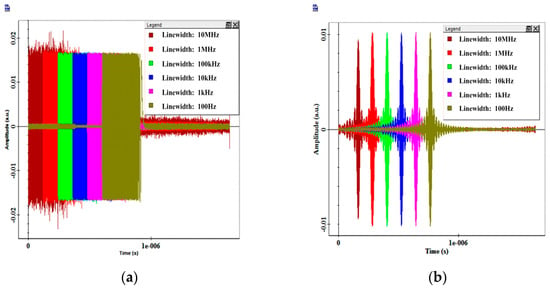
Figure 6.
Oscilloscope waveforms vary with the laser linewidth from 100 Hz to 10 MHz. (a) Before the BPF. (b) After the BPF.
A proof-of-concept experiment is carried out based on the experimental setup in Figure 1. The CW laser is a RIO laser, which operates at a frequency of 193.100 THz and an output power of 13 dBm. The electrical LO is generated by a 10 GHz frequency synthesizer (Talent, TLFS11-0220-M), then the power is amplified to 25 dBm by a low noise amplifier (ZVA-183W-S+). The MZMs in the OFC generator have a 3 dB bandwidth of ~25 GHz, and the DPMZMs have a 40 GHz 3dB bandwidth. The bandwidth of BPD is 1.5 GHz. The LFM signal is generated by a 50 GSa/s sample rate arbitrary waveform generator (AWG, Keysight 70001A). The UDWDM is achieved by a wavelength-selective switch (WSS, Finisar FWS0109BBCFDL-00), which has a spectral resolution of 6.25 GHz, thus the optical combs with 10 GHz free spectral range can be separated easily with the liquid crystal grating in WSS. A 50 GSa/s real-time OSC (Tektronix DPO 70604C) is adopted to record the temporal waveforms. The LFM waveform is shown in Figure 6a, and the output pulse of the bandpass filter is shown in Figure 7b. The LFM signal is generated directly from AWG and the MATLAB waveform file without any processing, so it has high linearity.
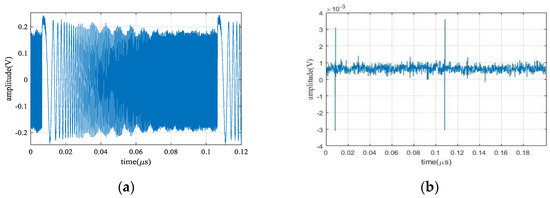
Figure 7.
Measured waveforms in the experiment. (a) LFM signal, (b) output pulse.
To demonstrate and analyze the multi-frequency measurement, a two-tone microwave signal is employed as the SUT. The pulse envelopes are recorded and observed via the OSC. As shown in Figure 8, two sets of pulses are obtained in one period, which is easy to distinguish. The purple waveform in Figure 8 is the LFM signal, as a reference to the relative of the pulse. The vertical axis represents 10 mV per grid, and the horizontal axis represents 4 ns per grid. When a two-tone microwave signal is composed of 5.04 GHz and 5.05 GHz, the measured frequencies are 5.046 and 5.054 GHz, respectively, indicating that the proposed system achieves high-precision in multi-frequency measurement.
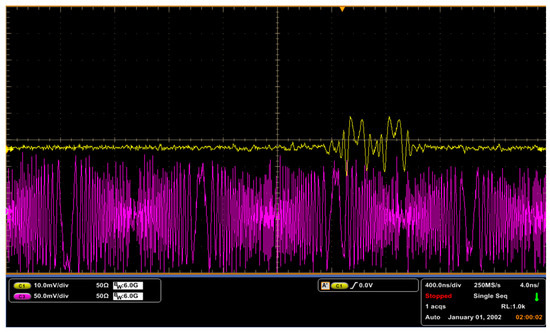
Figure 8.
Measured results of two-tone microwave signals.
Figure 9 shows the measured frequency results as a function of the frequency of the SUT. The frequency of SUT varies between 1 and 39 GHz with an interval of 2 GHz and measured with our proposed system. The ordinal number of channels N and the delay of the pulse are measured using an oscilloscope. The frequency can be calculated based on the expression (4). From Figure 8, it can be seen that a linear relationship has been established over a large range of 1–39 GHz. A linear fit is also performed, and is calculated to be as large as 0.99999, which shows an ultrahigh linearity. Moreover, the measurement errors for the SUT are less than ±20 MHz in the entire frequency range, which is mainly caused by the frequency drift of the laser. It is worth noting that the maximum frequency is limited by the bandwidth of the DPMZM.
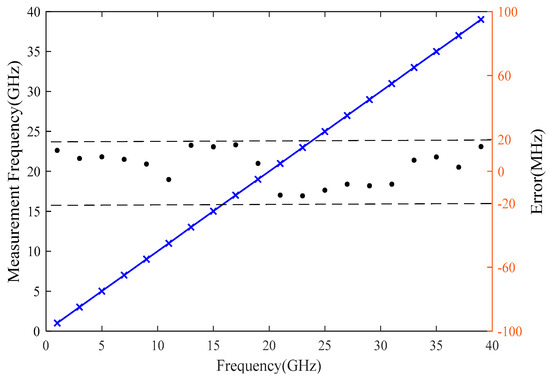
Figure 9.
Frequency measurement results and errors. Blue cross: measured frequencies; solid line: linear fitting; black dots: measurement errors.
4. Conclusions
In summary, a photonics-assisted IFM method is proposed and demonstrated through simulation and experimentation. The simulation analysis shows that the BPD can eliminate the phase-induced intensity noise while achieving FTTM. The experimental results prove that a measurement accuracy of <±20 MHz within a frequency range from 1 to 39 GHz is achieved, and the measurement resolution is 10 MHz. The proposed method has the characteristics of a large frequency range with high accuracy and high resolution, which would be attractive in radar and electronic support measures systems.
Author Contributions
Conceptualization, S.L. and W.Y.; methodology, S.L.; validation, A.L.; formal analysis, Y.L. (Yihan Li); investigation, Y.L. (Yandan Liu); resources, S.L.; writing—original draft preparation, S.L.; writing—review and editing, X.M.; visualization, G.X.; supervision, A.L.; project administration, A.L. All authors have read and agreed to the published version of the manuscript.
Funding
This research received no external funding.
Institutional Review Board Statement
Not applicable.
Informed Consent Statement
Not applicable.
Data Availability Statement
Data are contained within the article.
Conflicts of Interest
Authors Shaobo Li, Anni Liu, Xiang Ma, Wenqi Yu, Yandan Liu, Guansu Xing were employed by the China Electronics Technology Group Corporation 54th. The remaining authors declare that the research was conducted in the absence of any commercial or financial relationships that could be construed as a potential conflict of interest.
References
- Bui, L.A. Recent Advances in Microwave Photonics Instantaneous Frequency Measurements. Prog. Quantum Electron. 2019, 69, 100237. [Google Scholar] [CrossRef]
- Ivanov, A.; Morozov, O.; Sakhabutdinov, A.; Kuznetsov, A.; Nureev, I. Photonic-Assisted Receivers for Instantaneous Microwave Frequency Measurement Based on Discriminators of Resonance Type. Photonics 2022, 9, 754. [Google Scholar] [CrossRef]
- Yao, J. Microwave Photonic Systems. J. Light. Technol. 2022, 40, 6595–6607. [Google Scholar] [CrossRef]
- Shi, J.; Zhang, F.; Ben, D.; Pan, S. Simultaneous Radar Detection and Frequency Measurement by Broadband Microwave Photonic Processing. J. Light. Technol. 2020, 38, 2171–2179. [Google Scholar] [CrossRef]
- Zhou, P.; Tang, Z.; Zhu, J.; Li, N. Instantaneous Frequency Measurement Using Photonics-Assisted Broadband Signal Generation and Processing. IEEE Microw. Wirel. Technol. Lett. 2023, 33, 619–622. [Google Scholar] [CrossRef]
- Shi, N.; Hao, T.; Li, W.; Li, M. A Compact Multifrequency Measurement System Based on an Integrated Frequency-Scanning Generator. Appl. Sci. 2020, 10, 8571. [Google Scholar] [CrossRef]
- Wang, D.; Xu, K.; Dai, J.; Wu, Z.; Ji, Y.; Lin, J. Photonic-Assisted Approach for Instantaneous Microwave Frequency Measurement with Tunable Range by Using Mach-Zehnder Interferometers. Chin. Opt. Lett. 2013, 11, 020604. [Google Scholar] [CrossRef]
- Zhu, W.; Li, J.; Yan, M.; Pei, L.; Ning, T.; Zheng, J.; Wang, J. Photonic Multiple Microwave Frequency Measurement System with Single-Branch Detection Based on Polarization Interference. Electronics 2023, 12, 455. [Google Scholar] [CrossRef]
- Pan, S.; Fu, J.; Yao, J. Photonic Approach to the Simultaneous Measurement of the Frequency, Amplitude, Pulse Width, and Time of Arrival of a Microwave Signal. Opt. Lett. 2011, 37, 7–9. [Google Scholar] [CrossRef][Green Version]
- Zou, X.; Pan, W.; Luo, B.; Yan, L. Photonic Instantaneous Frequency Measurement Using a Single Laser Source and Two Quadrature Optical Filters. IEEE Photonics Technol. Lett. 2011, 23, 39–41. [Google Scholar] [CrossRef]
- Chi, H.; Zou, X.; Yao, J. An Approach to the Measurement of Microwave Frequency Based on Optical Power Monitoring. IEEE Photonics Technol. Lett. 2008, 20, 1249–1251. [Google Scholar] [CrossRef]
- Zou, X.; Yao, J. An Optical Approach to Microwave Frequency Measurement with Adjustable Measurement Range and Resolution. IEEE Photonics Technol. Lett. 2008, 20, 1989–1991. [Google Scholar] [CrossRef]
- Xu, K.; Dai, J.; Duan, R.; Dai, Y.; Li, Y.; Wu, J.; Lin, J. Instantaneous Microwave Frequency Measurement Based on Phase-Modulated Links with Interferometric Detection. IEEE Photonics Technol. Lett. 2011, 23, 1328–1330. [Google Scholar] [CrossRef]
- Wang, C.; Yao, J. Ultrahigh-Resolution Photonic-Assisted Microwave Frequency Identification Based on Temporal Channelization. IEEE Trans. Microw. Theory Tech. 2013, 61, 4275–4282. [Google Scholar] [CrossRef]
- Huang, C.; Erwin; Hao, P. Frequency-To-Space Mapping Based Instantaneous Frequency Measurement System with Improved Accuracy and Resolution. In Proceedings of the 2023 International Topical Meeting on Microwave Photonics, Nanjing, China, 15–18 October 2023. [Google Scholar] [CrossRef]
- Zhou, F.; Chen, H.; Wang, X.; Zhou, L.; Dong, J.; Zhang, X. Photonic Multiple Microwave Frequency Measurement Based on Frequency-To-Time Mapping. IEEE Photonics J. 2018, 10, 5500807. [Google Scholar] [CrossRef]
- Zhang, B.; Zhu, D.; Lei, Z.; Xu, Z.; Zhou, T.; Zhong, X.; Chen, Z.; Pan, S. Impact of Dispersion Effects on Temporal-Convolution-Based Real-Time Fourier Transformation Systems. J. Light. Technol. 2020, 38, 4664–4676. [Google Scholar] [CrossRef]
- Hugues; Cortés, L.R.; Azaña, J. Optical Real-Time Fourier Transformation with Kilohertz Resolutions. Optica 2015, 3, 1–8. [Google Scholar] [CrossRef]
- Duan, Y.; Chen, L.; Zhou, H.; Zhou, X.; Zhang, C.; Zhang, X. Ultrafast Electrical Spectrum Analyzer Based on All-Optical Fourier Transform and Temporal Magnification. Opt. Express 2017, 25, 7520–7529. [Google Scholar] [CrossRef]
- Yang, H.; Brunel, M.; Vallet, M.; Zhang, H.; Zhao, C. Optical Frequency-To-Time Mapping Using a Phase-Modulated Frequency-Shifting Loop. Opt. Lett. 2021, 46, 2336–2339. [Google Scholar] [CrossRef]
- Shi, J.; Zhang, F.; Ben, D.; Pan, S. Photonics-Based Broadband Microwave Instantaneous Frequency Measurement by Frequency-To-Phase-Slope Mapping. IEEE Trans. Microw. Theory Tech. 2019, 67, 544–552. [Google Scholar] [CrossRef]
- Nguyen, L. Microwave Photonic Technique for Frequency Measurement of Simultaneous Signals. IEEE Photonics Technol. Lett. 2009, 21, 642–644. [Google Scholar] [CrossRef]
- Foster, M.A.; Salem, R.; Geraghty, D.F.; Turner-Foster, A.C.; Lipson, M.; Gaeta, A.L. Silicon-Chip-Based Ultrafast Optical Oscilloscope. Nature 2008, 456, 81–84. [Google Scholar] [CrossRef] [PubMed]
- Xi, K.; Yu, Y.; Tang, H.-T.; Zhang, C. Microwave Photonic Image-Reject Mixer Based on a Tunable Microwave Photonic Filter with High Rejection. IEEE Photonics J. 2018, 10, 5502411. [Google Scholar] [CrossRef]
Disclaimer/Publisher’s Note: The statements, opinions and data contained in all publications are solely those of the individual author(s) and contributor(s) and not of MDPI and/or the editor(s). MDPI and/or the editor(s) disclaim responsibility for any injury to people or property resulting from any ideas, methods, instructions or products referred to in the content. |
© 2024 by the authors. Licensee MDPI, Basel, Switzerland. This article is an open access article distributed under the terms and conditions of the Creative Commons Attribution (CC BY) license (https://creativecommons.org/licenses/by/4.0/).