Review

Far-Field Super-Resolution Microscopy Using Evanescent Illumination: A Review

by
Qianwei Zhang
1,
Haonan Zhang
1,
Xiaoyu Yang
1,
Xu Liu
1,2,3,
Mingwei Tang
1,* and
Qing Yang
1,2,3,4,*
1
State Key Laboratory of Extreme Photonics and Instrumentation, College of Optical Science and Engineering, International Research Center for Advanced Photonics, Zhejiang University, Hangzhou 310027, China
2
ZJU-Hangzhou Global Scientific and Technological Innovation Center, Zhejiang University, Hangzhou 311215, China
3
Collaborative Innovation Center of Extreme Optics, Shanxi University, Taiyuan 030006, China
4
Key Laboratory of Smart Biomaterials of Zhejiang Province, College of Chemical and Biological Engineering, Zhejiang University, Hangzhou 310027, China
*
Authors to whom correspondence should be addressed.
Photonics 2024, 11(6), 528; https://doi.org/10.3390/photonics11060528
Submission received: 11 April 2024 / Revised: 27 May 2024 / Accepted: 29 May 2024 / Published: 1 June 2024
(This article belongs to the Special Issue Super Resolution Optical Microscopy: Sensing and Imaging)

Abstract

:
The resolution of conventional optical microscopy is restricted by the diffraction limit. Light waves containing higher-frequency information about the sample are bound to the sample surface and cannot be collected by far-field optical microscopy. To break the resolution limit, researchers have proposed various far-field super-resolution (SR) microscopy imaging methods using evanescent waves to transfer the high-frequency information of samples to the low-frequency passband of optical microscopy. Optimization algorithms are developed to reconstruct a SR image of the sample by utilizing the high-frequency information. These techniques can be collectively referred to as spatial-frequency-shift (SFS) SR microscopy. This review aims to summarize the basic principle of SR microscopy using evanescent illumination and introduce the advances in this research area. Some current challenges and possible directions are also discussed.

1. Introduction

Optical microscopy is the key to the micro-world and one of the most important tools in the development of human science. Until now, the optical microscope is still one of the indispensable tools in laboratories. Although powerful, optical microscopy has one fatal problem that cannot be overcome by improving the processing technology, which is well-known as the Abbe limit. Abbe [1] first found that the resolution limit is dependent on the working wavelength (λ) and the numerical aperture of the microscope, and Helmholtz [2] gives the equation of resolution limit which is expressed as: d = λ / 2 n s i n θ = λ / 2 N A , where n is the refractive index of the medium and θ is the half collective-angle of the objective lens. Therefore, we can never observe a world smaller than 200 nm by a conventional optical microscope using visible light. If we want to further improve the resolution, the direct ways are to decrease the working wavelength or increase the NA of the microscope. The former guided the invention of electron microscopes, while the latter led to the emergence of the solid immersion lens.
Although the electron microscope has extended the resolution limit down to 0.39 angstrom [3], the optical microscope is still irreplaceable because of its low-invasive nature compared to electron microscope. With the development of Fourier optical theory in the middle twenty century, scientists realized that the resolution limit is actually a result of the depletion of evanescent waves in the far-field image plane. Thus, two technical routes have been proposed to achieve super-resolution microscopic imaging: one is to use functional fluorescent labels [4,5] to bypass the limitations of evanescent waves and the other is to physically obtain high frequency information from evanescent waves. Representative methods of the former include stimulated-emission-depletion fluorescence microscopy (STED) [6,7,8], single molecule localization microscopy including photo-activated localization microscopy (PALM) [9,10,11,12,13,14], stochastically optical reconstruction microscopy (STORM) [15,16,17], and so on. The latter include near field scanning optical microscopy (NSOM) [18,19,20,21], which excites and collects information in the evanescent field (depth less than λ / 2 ), and methods that transfer evanescent information to the far-field imaging plane and collect information at a depth much larger than serval wavelength, such as Hyperlens microscopy [22,23,24,25,26], structured illumination microscopy (SIM) [27,28], super-oscillation SR microscopy [29,30,31,32,33], microsphere-assisted SR microscopy [34,35,36,37,38,39,40,41], evanescent illumination SR microscopy [42,43,44,45], and so on. These works are the crystallization of the wisdom of scientists and cannot be summarized in a single review. Therefore, this review will focus on the far-field SR microscopy via evanescent illumination that the authors are interested in. The basic principle of SR microscopy imaging using evanescent illumination will be clarified and methods of generating proper illumination for different conditions will be elaborated. The current challenges and possible future directions will also be discussed in this review.

2. Basic Principle of Super-Resolution Imaging Using Evanescent Illumination

To help understand the principle of evanescent illumination SR imaging, we should first figure out why the resolution limit exists from the perspective of Fourier optics. In the case of a simplified coherent microscope imaging system, a beam of planar illumination light interacts with samples (e.g., the USAF 1951 Target) and emits scattering light in all directions. According to Fourier optics theory, the information of any object can be regarded as a superposition of a series of sinusoidal signals. In other words, the structure of the object can be decomposed into a series of sinusoidal gratings with period d or spatial frequency f = 1/d. Then, according to the grating diffraction formula d s i n α = m λ / n , where α is the diffracting angle and m is the diffraction order, structures with different periods will scatter light at different angles. Obviously only light with a scattering angle smaller than the objective lens’ collection angle θ will enter the microscopy imaging system. Thus, the objective lens plays a role as a low-pass filter that only structure information with a spatial frequency f smaller than cutoff spatial frequency ( f c = N A / λ for coherent illumination and f c = 2 N A / λ for incoherent illumination) can be received by the imaging system (information within the red circle in the spectrum diagram in Figure 1a), resulting in limited imaging resolution, as shown in the low resolution (LR) diagram in Figure 1a. To this extent, breaking the resolution limit is to gather spatial frequency larger than f c .
We can draw inspiration from the field of wireless communication. When transmitting wireless signals, it is necessary to modulate the low-frequency signal wave by a high-frequency carrier wave to improve anti-interference ability. The modulated signal will be received by the receiver and be demodulated by a demodulator to extract the original information. Therefore, we should find a method to modulate the high spatial-frequency “signal wave” by a specific “carrier wave” so that the modulated high spatial-frequency signal can be received by microscope imaging system, which is also named as spatial-frequency-shift (SFS) microscopy [46]. This method is suitable for both label-free and fluorescent labeled samples and the resolution d can be improved to:
d = 1 f s + f c
where f s is the shifting magnitude of spatial frequency provided by the evanescent illumination.
Two mainstream methods have been proposed to achieve this modulation. One method is to continuously generate an evanescent illumination field with determined k-vectors with designed magnitude and directions to obtain a series of resolution limited SFS images. Using demodulated high-frequency information of the sample from these SFS images using proper algorithms, we can realize SR imaging, as shown in Figure 1b. This method is similar to Fourier Ptychographic microscopy (FPM) [47] and classical SIM, but the k-vector of evanescent illumination can be much larger. FPM and SIM can only modulate high spatial frequency f h that can originally be transmitted in the detection medium, resulting in limited resolution improvement; while using evanescent illumination, larger spatial frequency f e that should be bounded in the near-field can be transferred to the low-passband filter of the objective lens, exceeding twice the resolution limit, as shown in Figure 1b. However, there are conditions in which controlling the k-vector of the evanescent illumination precisely will be too difficult due to process limitations, unavoidable speckle, dispersion, and so on. In this condition, another method is to generate a large number of random k-vector evanescent speckle illuminations by a scattering layer and high refractive medium to restore the whole high-frequency information of the sample, as shown in Figure 1c. Typically, there are two strategies that make use of the evanescent speckle illumination. One is to generate a series of uncorrelated evanescent speckle illuminations; their average should be roughly homogeneous, which is known as blind-SIM [48]. The other is to utilize the optical memory effect within small angles [49] and scan the samples with a determined evanescent speckle illumination. Then, the high spatial frequency is modulated randomly by the evanescent speckle illumination and reconstructed by an iterative algorithm.
In the next sections, we will introduce some specific examples to show how to realize far-field super-resolution imaging by evanescent illumination. Since the surface plasmon polaritons (SPP) waves on the metal surface have the same evanescent characteristics as the evanescent waves generated on the waveguide surface, we summarized SPP illumination as another kind of evanescent illumination in this review. We use “waveguide” as the prefix for the default evanescent wave illumination method to distinguish it from SPP illumination. In order to unify the unit, we use k c instead of f c to represent the cutoff vector of the objective lens, where k c = 2 π f c .

3. Super-Resolution Imaging by Determined k-Vector Evanescent Wave Illumination

3.1. Super-Resolution Microscopy via Waveguide Evanescent Wave Illumination

Total internal reflection fluorescent microscopy (TIRFM) is the most typical evanescent wave (EW) illumination microscopy technique, which utilizes its characteristic of exponential attenuation. Since only fluorescent molecules near the interface can be excited, background light noise interference can be greatly reduced in the imaging. Efforts have been undertaken to enhance the imaging speed and axial resolution of TIRFM [50,51,52,53,54,55]. However, conventional TIRFM has not surpassed the lateral resolution limit imposed by Abbe diffraction, thereby rendering it unable to observe some of the more subtle biochemical processes. If we can precisely control the wave vector of the EW illumination in TIRFM then it is possible to demodulate the high-frequency information of the sample to achieve lateral SR imaging.
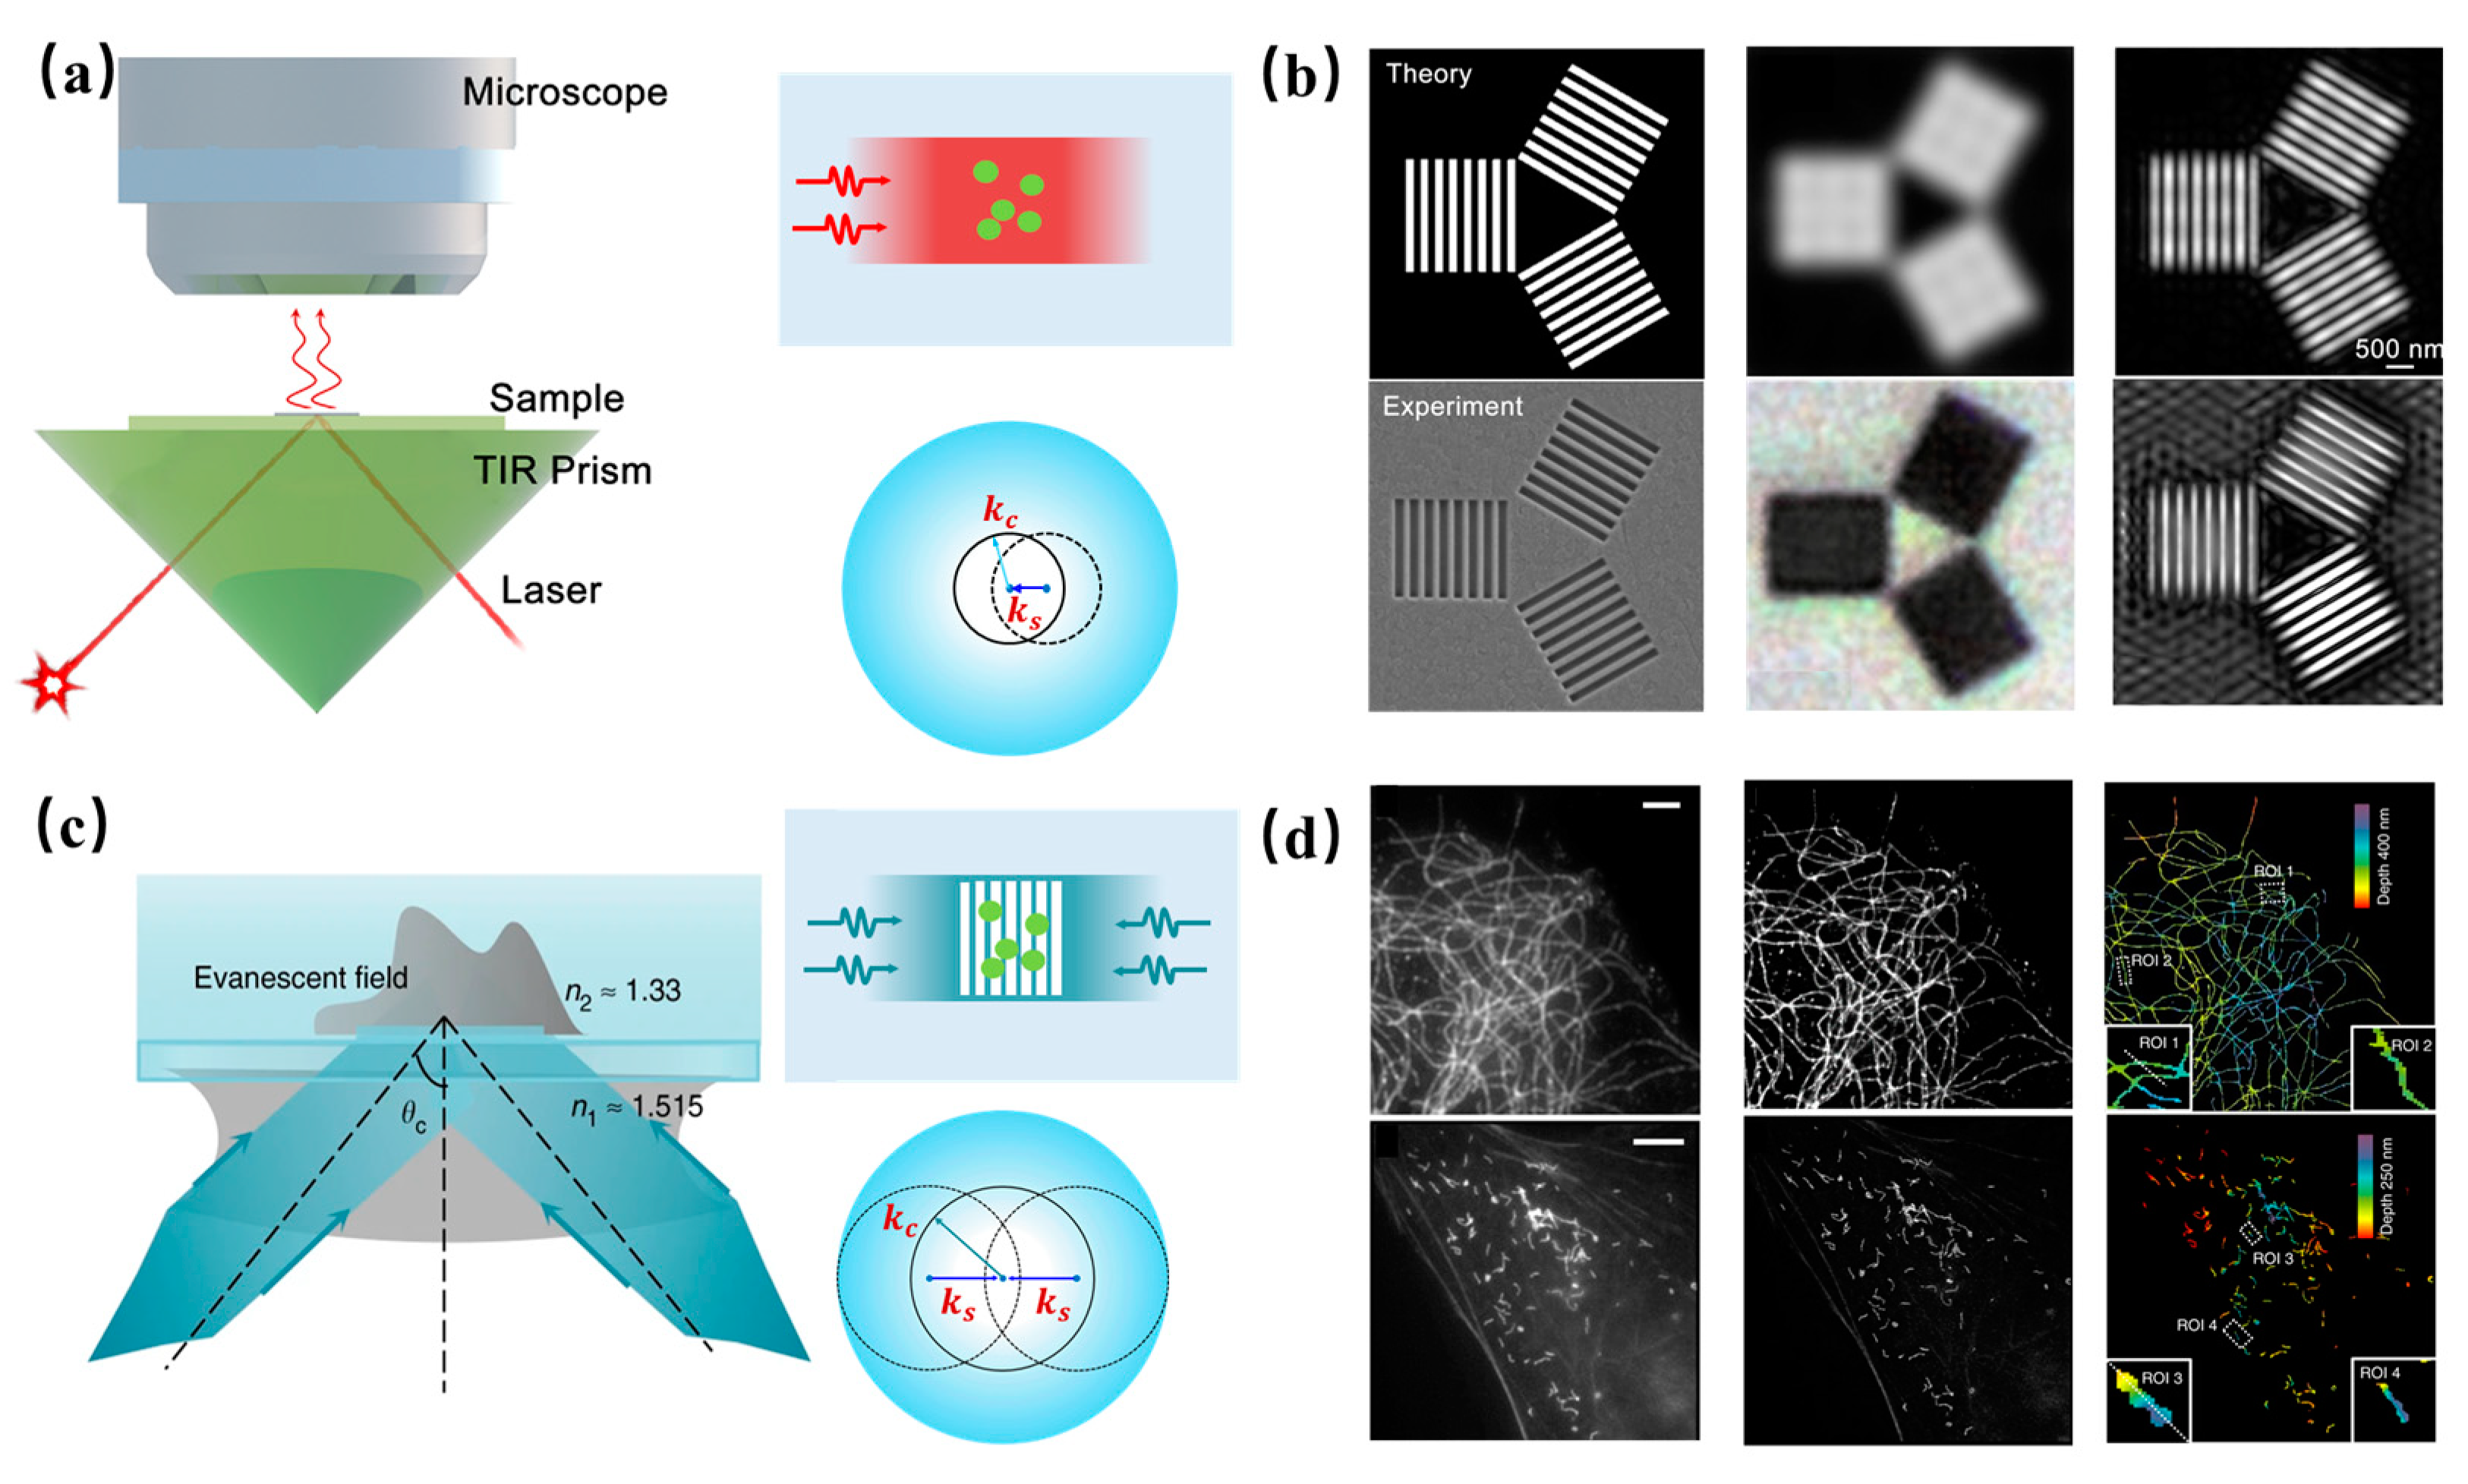
Hao et al. [42] first utilized the total internal reflection interface of prisms (including right angle prisms and Dove prisms) to provide EW illumination for SFS SR imaging in 2013, as shown in Figure 2a. Some grating samples are fabricated by focused ion beam etching (FIB, Carl Zeiss Auriga, Germany) with indium-tin oxide (ITO) coated glass as the substrate. The high spatial-frequency of samples is shifted by the EW illumination generated by the total internal reflection with a large a large k-vector k s into the low-frequency passband of the objective lens ( f c = N A / λ ). Then, effective label-free SR imaging for a channel structure with 130 nm period is resolved using a 100×, NA = 0.8 objective lens, as shown in Figure 2b. The central wavelength of the illumination light is approximately 635 nm with a bandwidth of no more than 10 nm. Compared with the former microfiber-based SR imaging by EW illumination [56], this method provided a wider field of view and a simpler configuration.
Later in 2018, total internal reflection fluorescence structured illumination microscopy (TIRF-SIM) combined with multi-angle EW illumination was proposed by Chen et al. [57] to realize multi-color live-cell SR volume imaging, as shown in Figure 2c. An evanescent structured illumination is generated by two relatively incident total internal reflection beams, which offers a large k-vector k s to shift high spatial-frequency into the low-frequency passband ( f c = 2 N A / λ ). With this method, sub-100-nm lateral resolution and approximately 40 nm axial resolution over a 600 nm depth volume for fluorescent labeled U2OS cells are demonstrated. For better comparison with TIRF images, lateral SR images and 3D volume SR images are presented in Figure 2d.
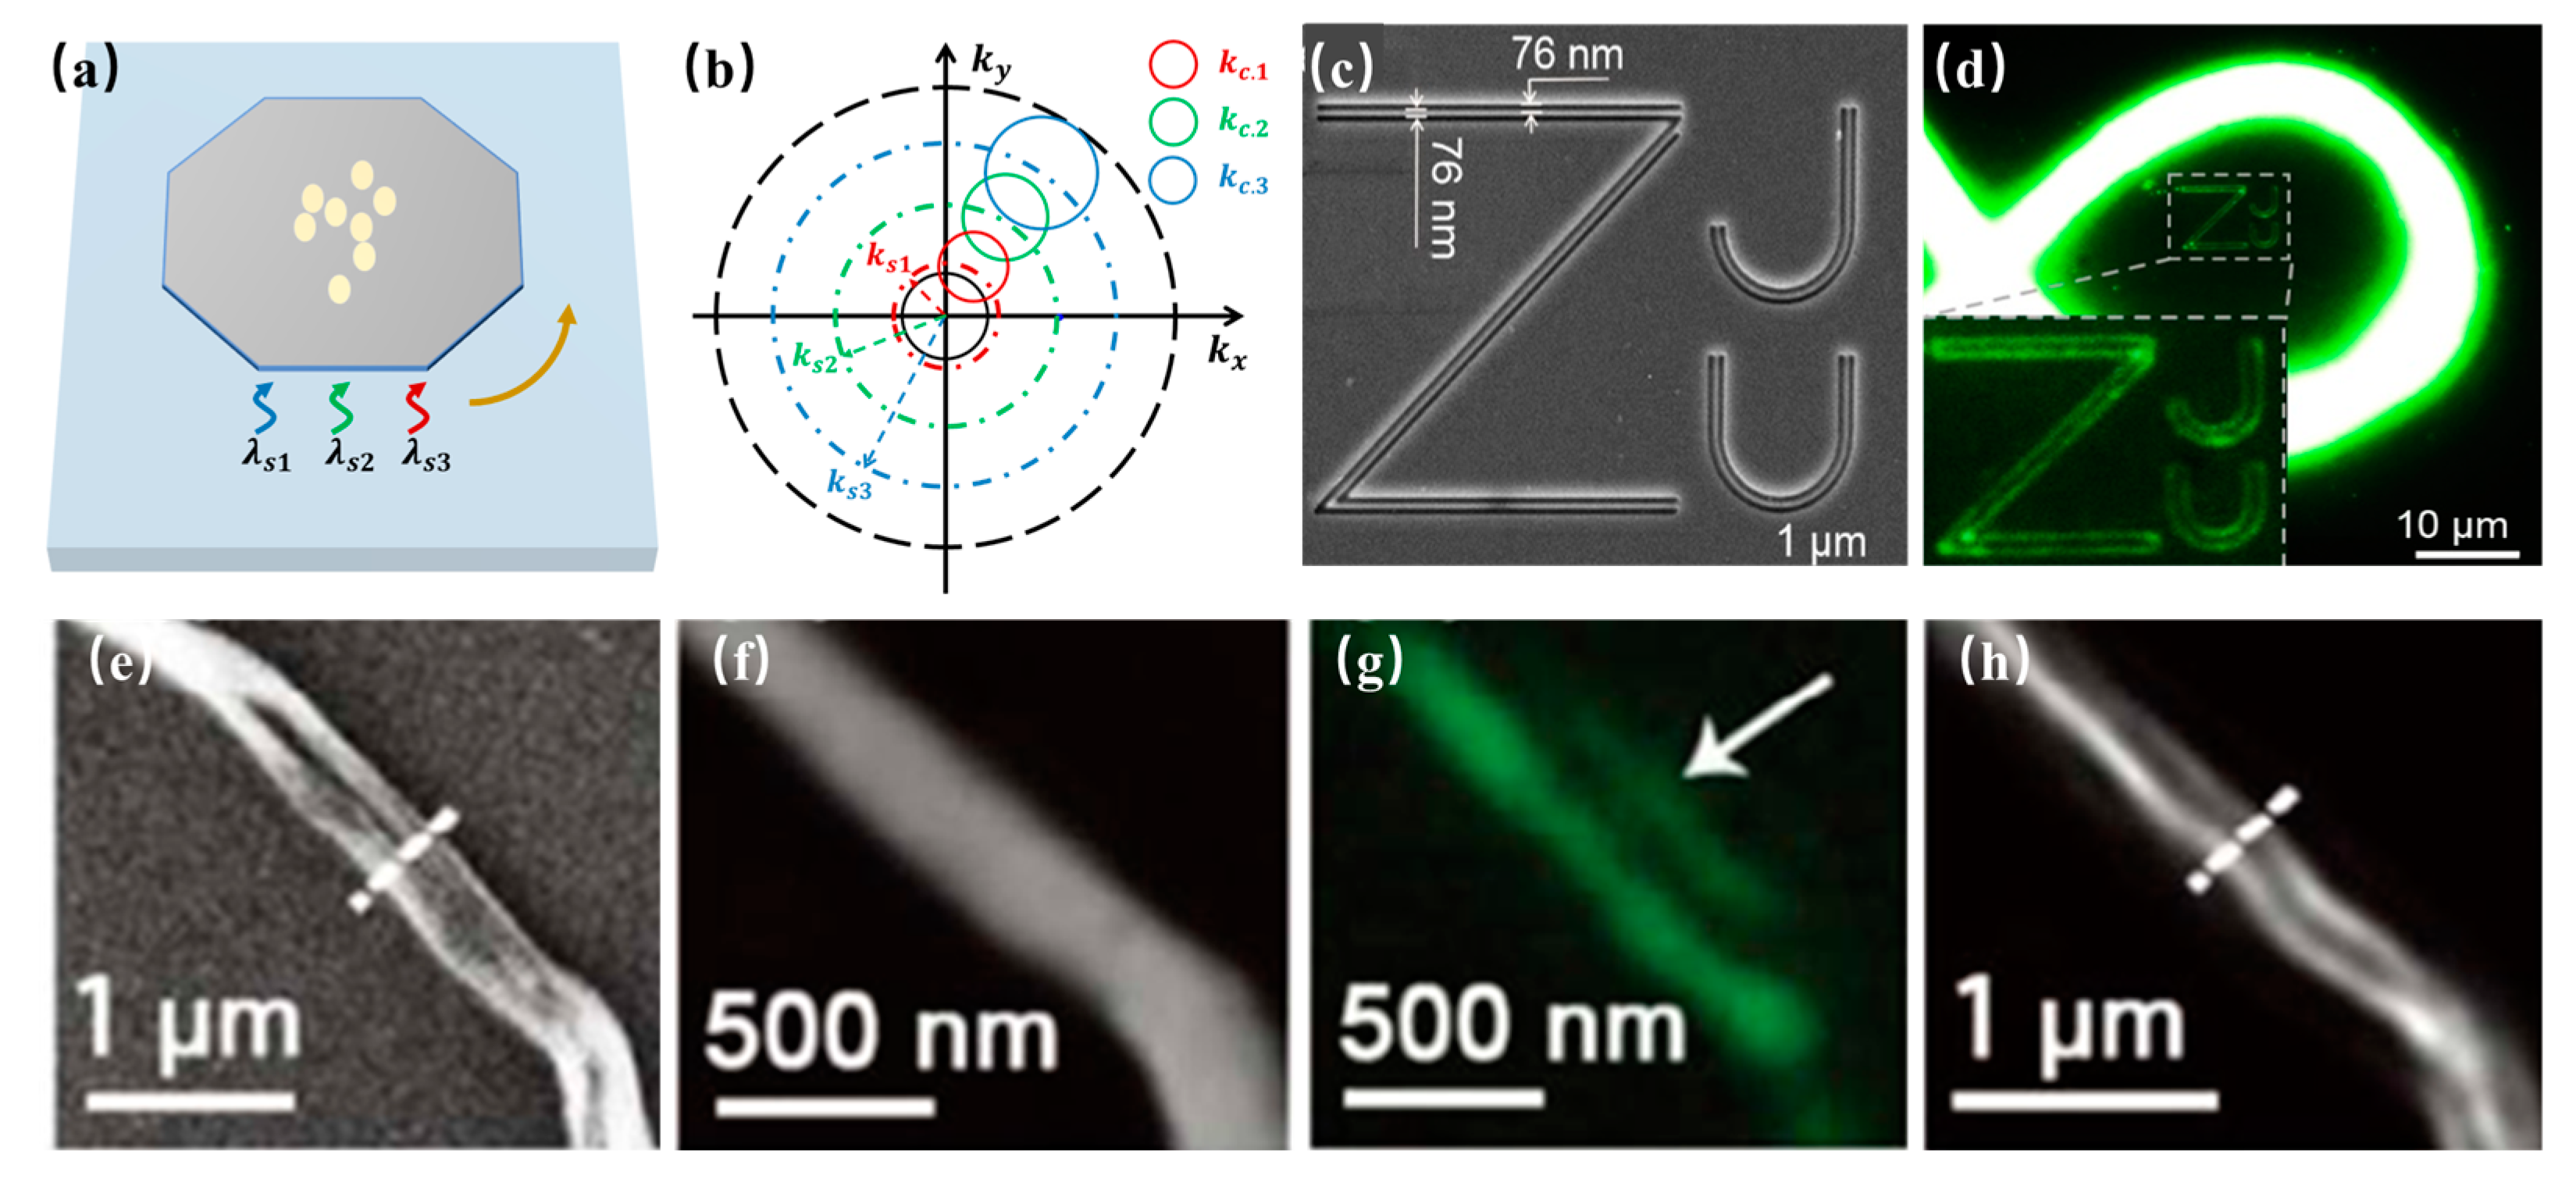
The two representative works above have proved the possibility of improving lateral resolution using EW illumination, but their further applications are limited by the complex total reflection set-up and expensive high-NA objective in TIRFM. In 2017, Liu et al. [43,45] proposed a new EW illumination method named nanowire ring illumination microscopy (NWRIM) for label-free samples, which offers a more flexible method to generate EW illumination. A fluorescent nanowire ring is used as the light source, which is combined with a film waveguide to produce omnidirectional EW illumination. Several types of materials with different refractive indices, including S i O 2 , A l 2 O 3 , and T i O 2 , have been selected as the subwavelength film waveguide. In the SFS images captured by a NA = 0.75 objective lens, subwavelength feature sizes can be resolved in the 2D sub-diffraction SFS images, such as the 76 nm slots and 76 nm spacing of a “ZJU” pattern with a large field of view for approximately 1000 μ m 2 , as shown in Figure 3d. The signal-to-noise ratio of the SR image can be further increased by more than four times by making use of the polarization selection characteristics of the EW field [45].
However, it should be noted that although NWRIM can resolve some subwavelength label-free features, the SFS images cannot represent the true spatial size and location of the samples. The reason is that if the shift k-vector of EW illumination k s is larger than the cut-off vector k c , which is determined by the NA and work wavelength λ , the SFS images of continuous samples will swell and distort because of the frequency gap between the shifted high spatial-frequency and low-frequency passband of objective lens. To solve this problem, Pang et al. [58] utilized fluorescent polymer films as light source to modulate the k-vector of EW illumination and collected complete spatial-frequency of samples. The direction of EW illumination is tuned by locally exciting the fluorescent polymer films around the polygonal planar waveguide, as shown in Figure 3a. The precise control of the k-vector magnitude of the EW illumination is realized by wavelength control and oblique illumination to realize the wide-band acquisition of high spatial-frequency information, as shown in Figure 3b. The black, red, green, and blue solid line circle refer to the high spatial-frequency spectrum of SFS images shifted by oblique illumination and EW illumination λ s , 1 , λ s , 2 , and λ s , 3 . Using a Gerchberg–Saxton (GS) iterative algorithm [47], a 128 nm label-free SR image is reconstructed from the SFS images above. Compared with the direct SFS image in Figure 3g, the SR image reconstructed from the modulated SFS images is much more consistent with the SEM image, which ensures the practical applications in material science and life science. Later, the same group further theoretically and experimentally demonstrated the applicability of the high refractive index S i 3 N 4 waveguide platform for label-free SR microscopy imaging by wavelength control, which can significantly reduce the complexity of optical set-up in super-resolution system by simplify the excitation light method [59,60].
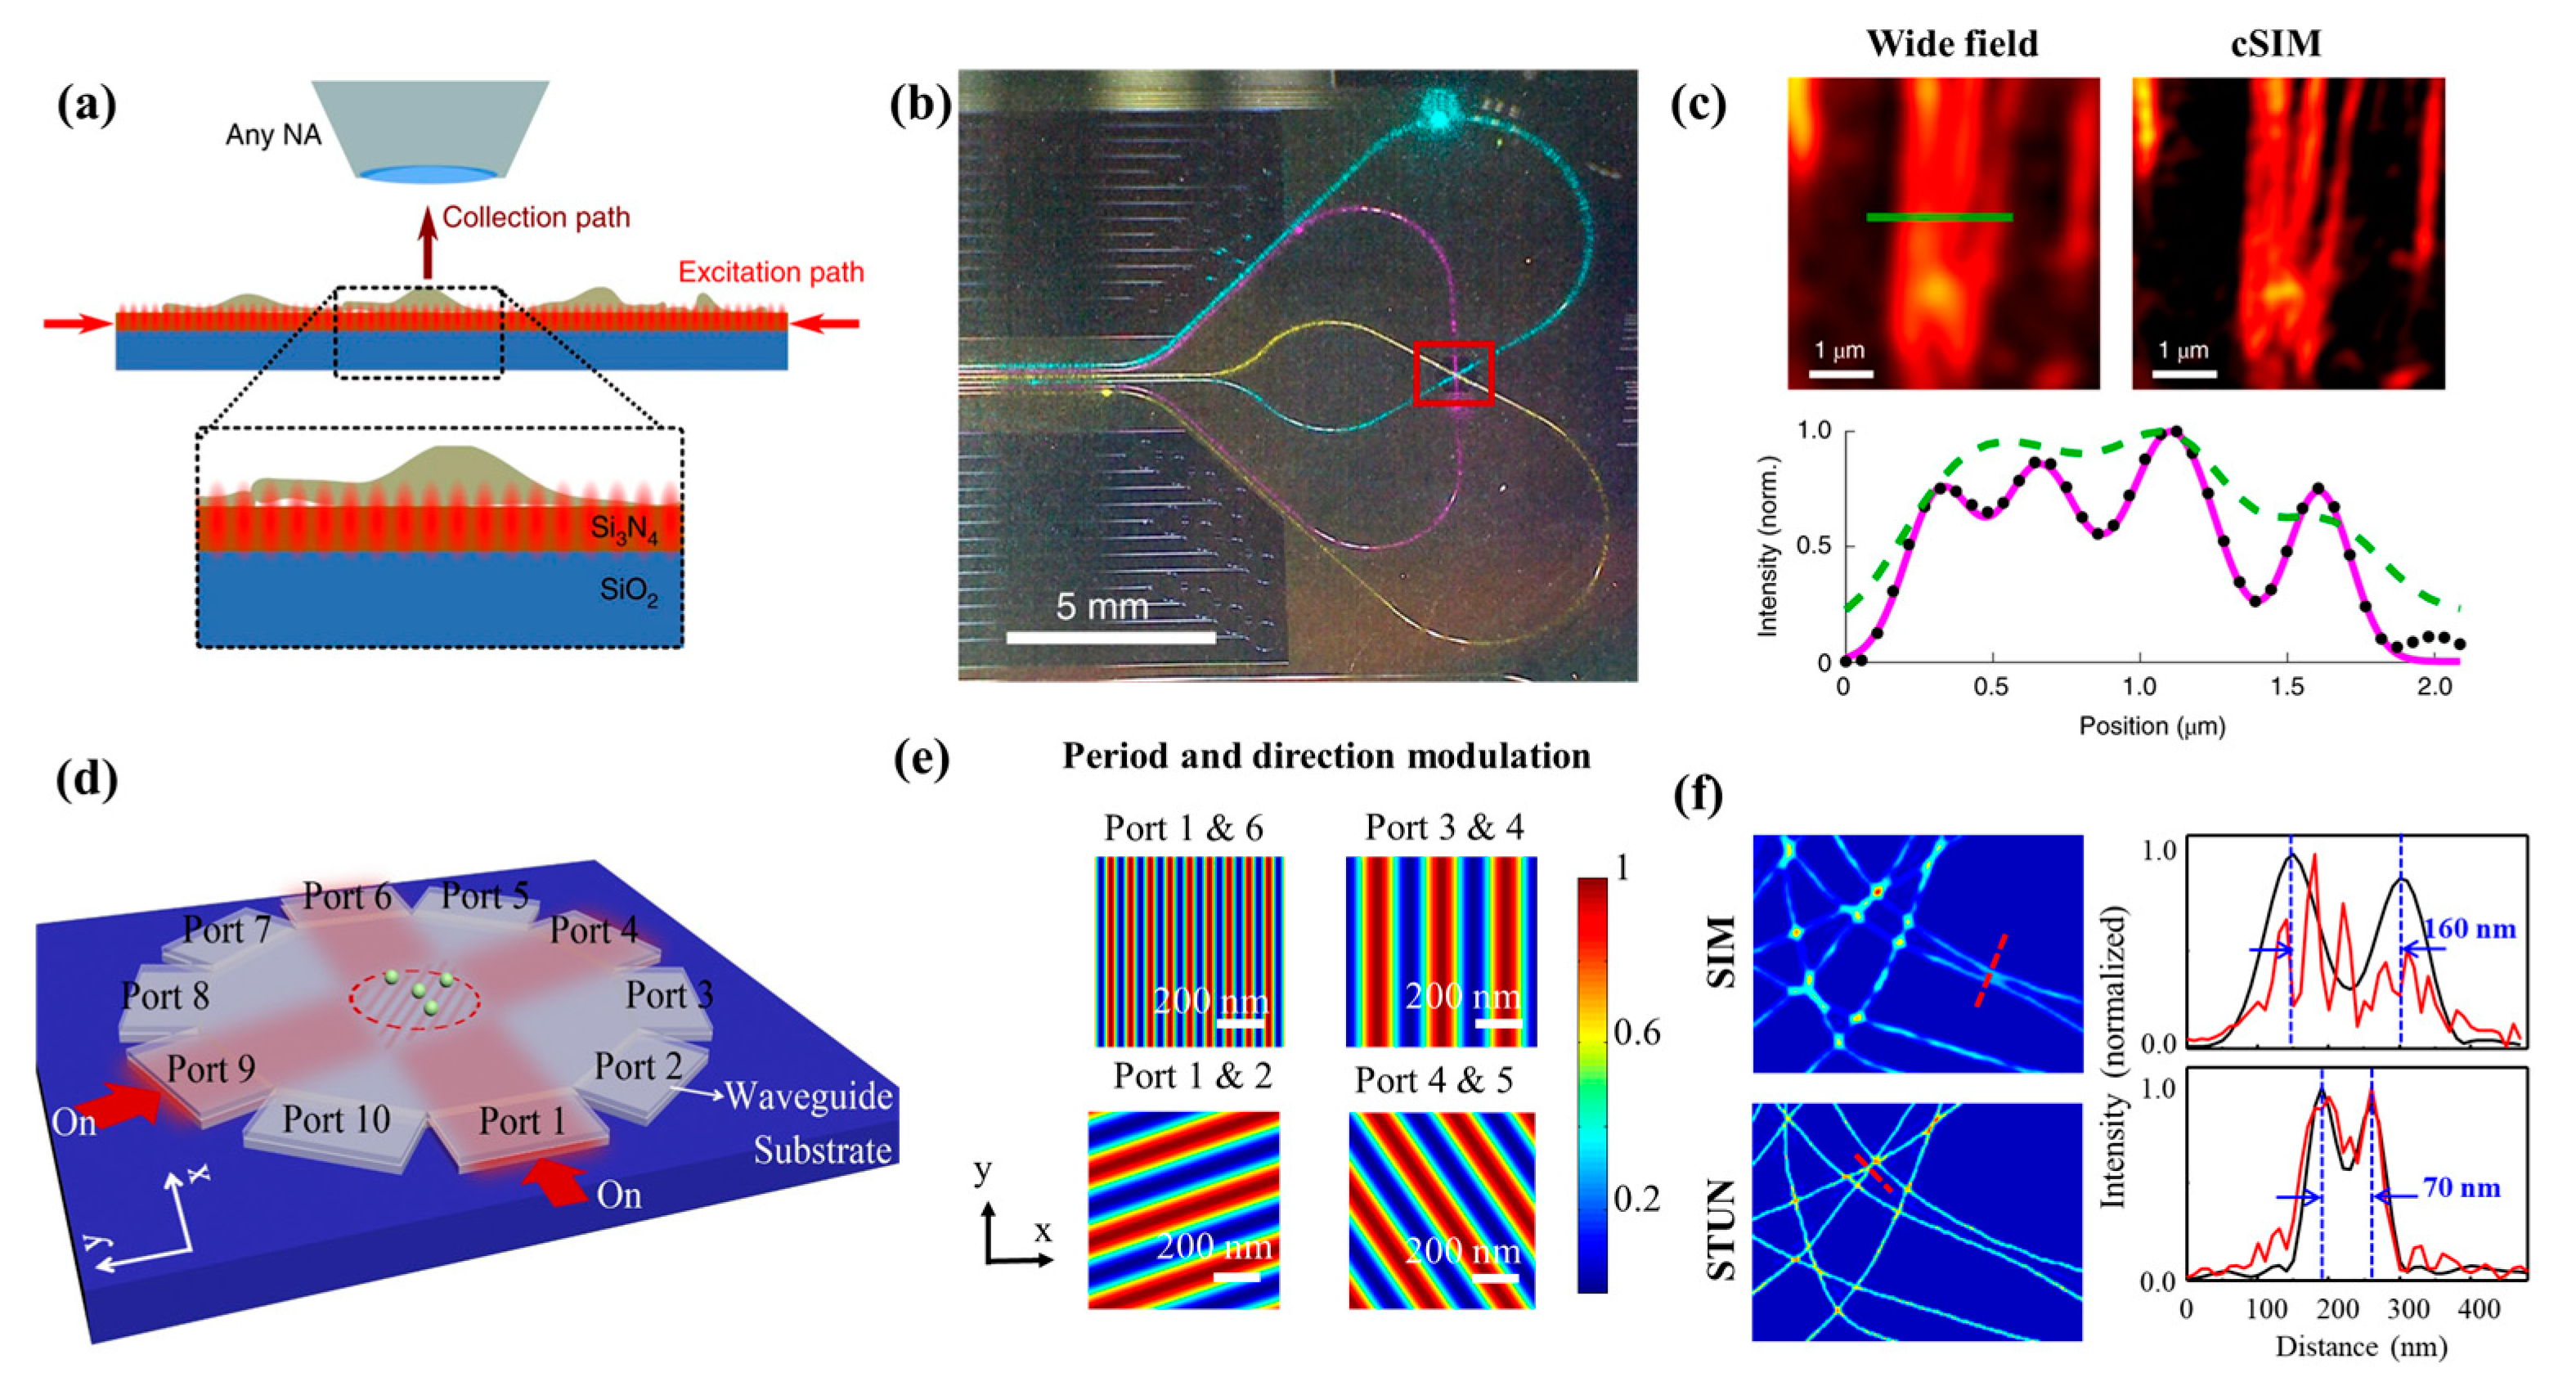
Modulation of evanescent structured illumination on S i 3 N 4 waveguide has also been demonstrated by Balpeet Singh et al. [61] who have been working on the development of chip-based microscopy for a long time [61,62,63,64,65,66]. They implemented a two-dimensional SIM method based on a S i 3 N 4 chip, which is named cSIM, as shown in Figure 4a,b. Evanescent standing wave interference patterns with different k-vectors are generated by an optical waveguide array with different angles, and the maximum k-vector is generated at a waveguide angle of 180 degrees, as shown in Figure 4e. Thus, two beads separated by 117 nm are resolved, corresponding to a 2.3 times resolution improvement, exceeding the typical limit of SIM by two times using a water immersion objective lens (Olympus UPLSAPO60XW). cSIM image of the actin filaments is shown in Figure 4c, which provides clearer structure compared to diffraction-limited image. Further resolution enhancement is proposed by Liu and Tang et al. [67] using a designed gallium phosphide (GaP) waveguide in Figure 4d to actively and widely modulate the k-vector of evanescent structured illumination, which is named SFS tunable nanoscopy (STUN). In STUN, SR imaging resolution can be improved to:
r = λ e 2 n e λ e λ i l l + 2 N A
where λ e is the excitation wavelength, λ i l l is the illumination wavelength, and n e is the effective refractive index of waveguide, which means the resolution is no longer limited by the NA of the objective lens but the effective refractive index of waveguide. Combining the cross-sectional saturation effect, which tunes the vertical k-vector, a lateral resolution of λ/9 (70 nm) as shown in Figure 4f, and a vertical localization precision of ~λ/200 (detection objective NA = 0.9) can be realized in theory.
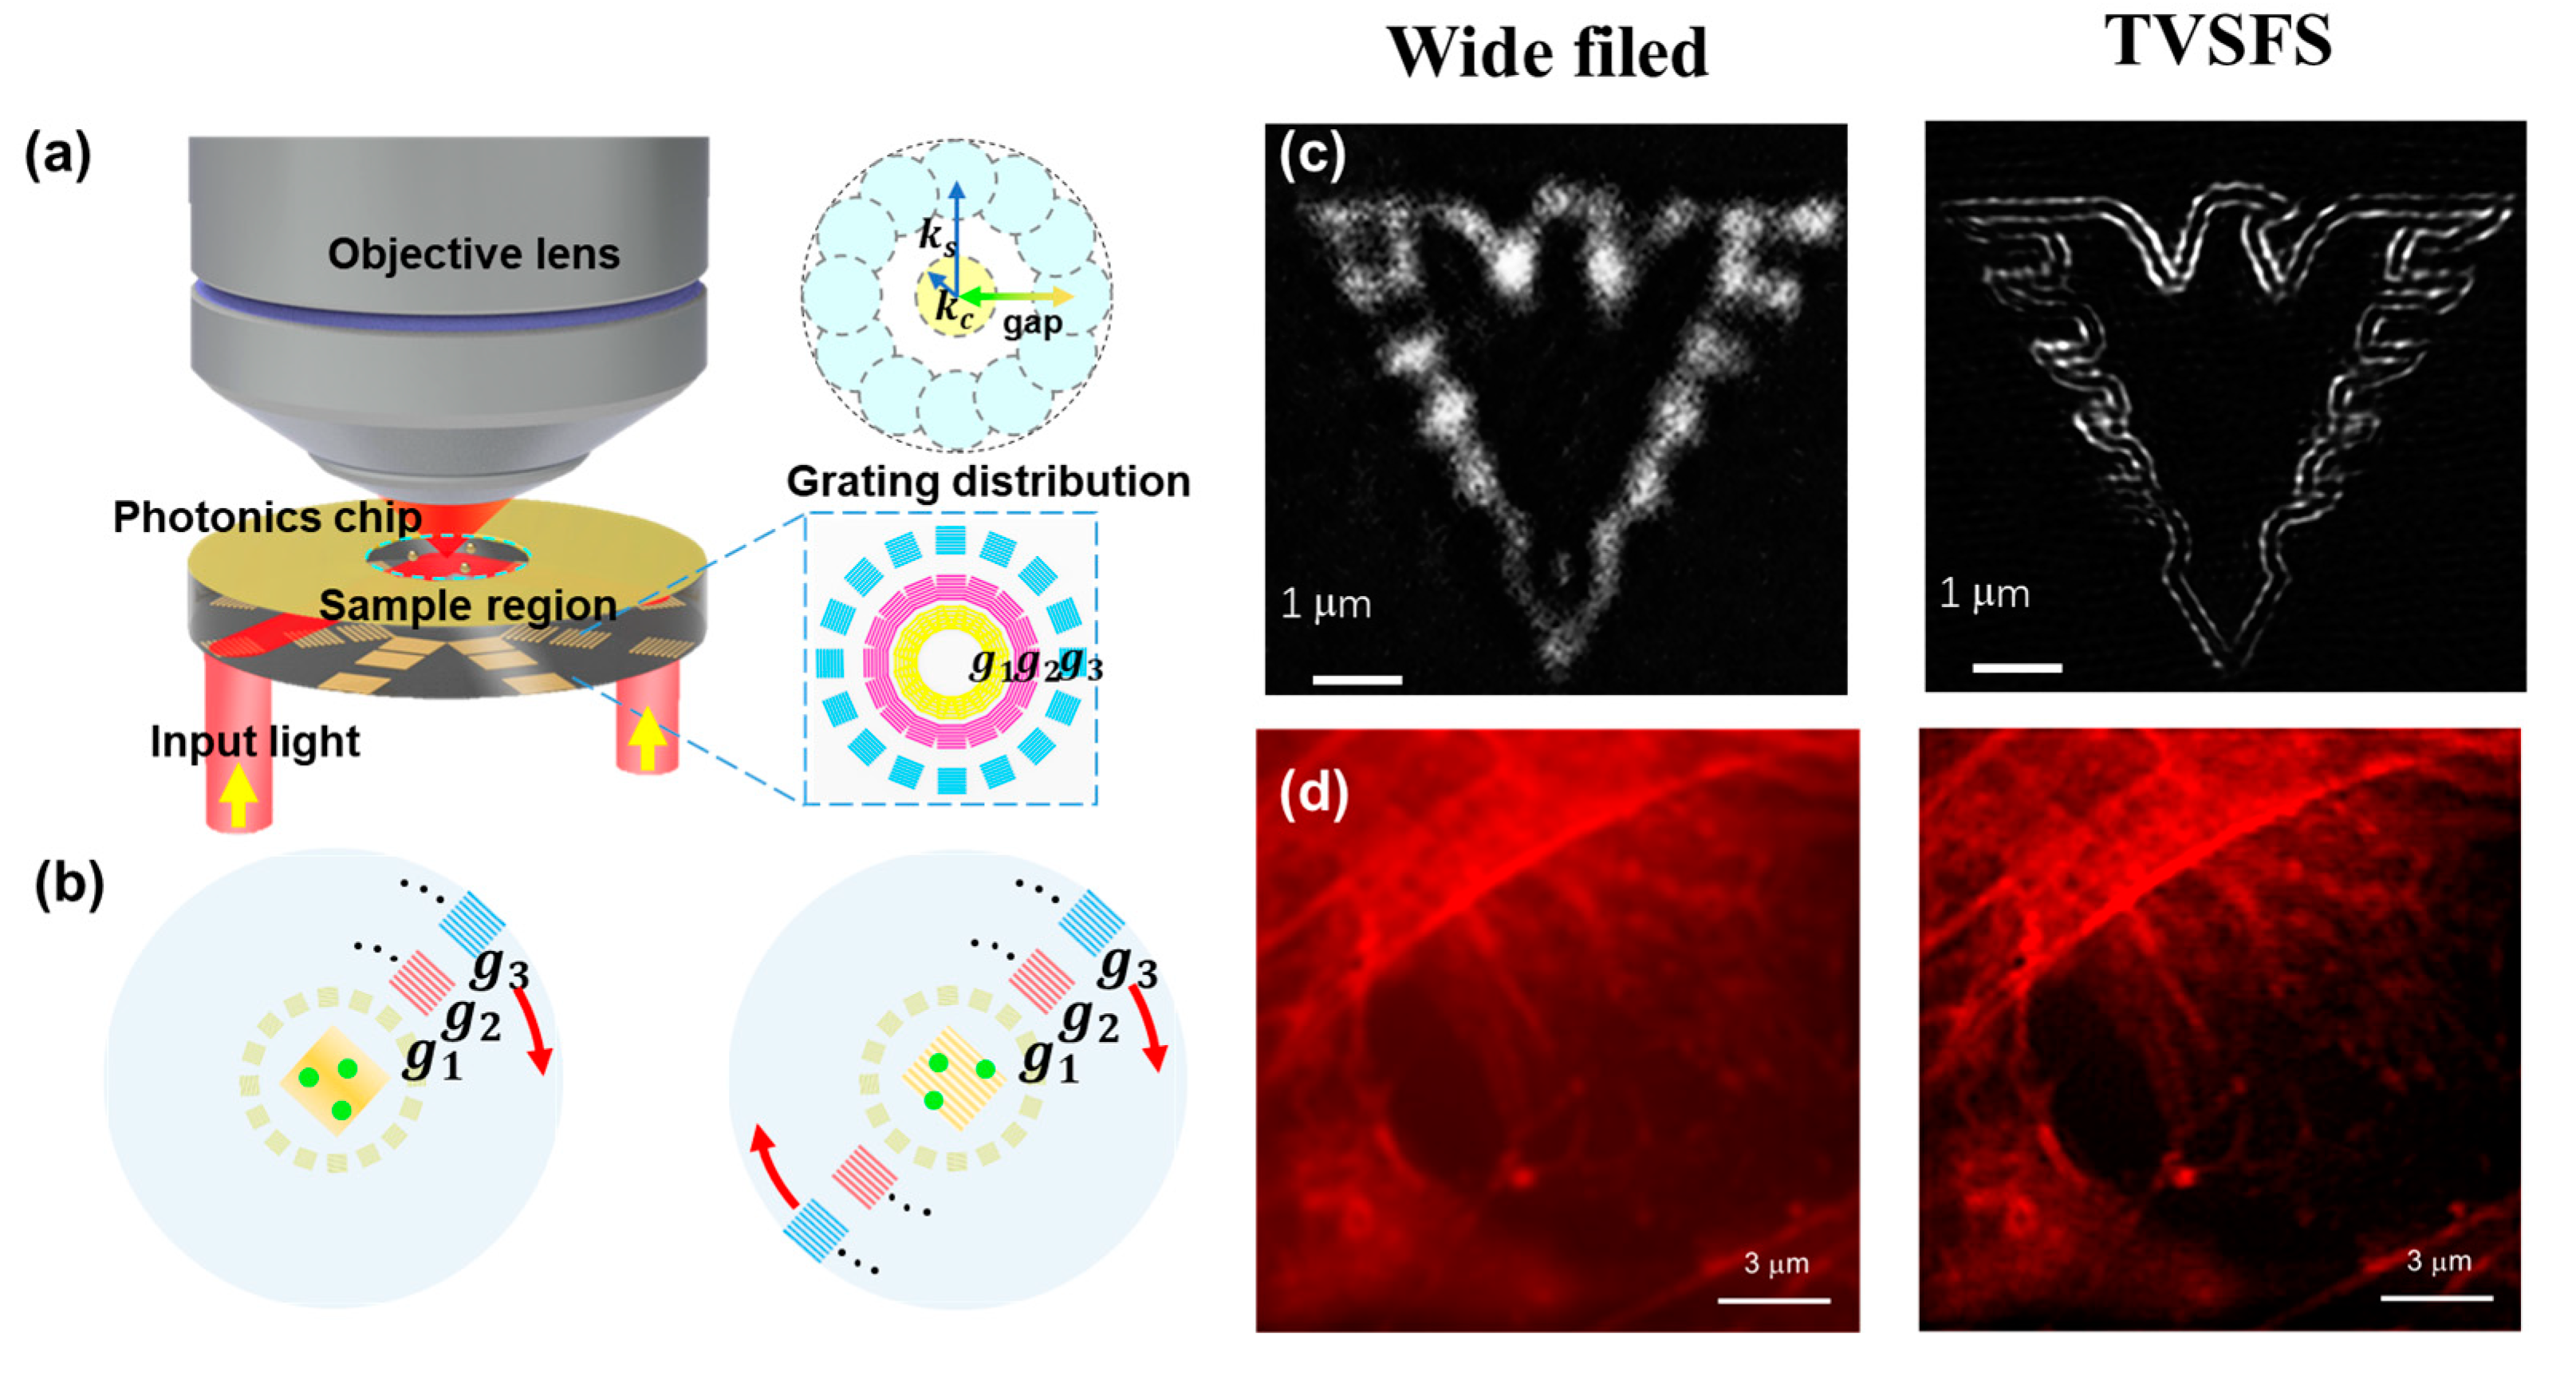
Later in 2022, Tang et al. [68] proposed and experimentally demonstrated tunable virtual-wavevector spatial-frequency-shift (TVSFS) for both label-free imaging and fluorescent label imaging by tuned grating design. Diffractive gratings are fabricated on the GaP chip’s surface to provide EW illumination with determined k-vector on the other side of the chip, as shown in Figure 5a,b. By applying different illumination strategies, a tunable deep spatial-frequency-shift SR microscopy imaging can be realized, which is compatible with both label-free and fluorescent labeled samples. A large field of view and resolution improvements of 4.5 times for label-free imaging (120 nm) and 3.2 times for fluorescent labeled imaging (93 nm) on complex samples are demonstrated in this work, as shown in Figure 5c,d. Further resolution enhancement depends on the increase of the effective index n e of the waveguide. With its compatibility and monolithic integration, the TVSFS method can serve as a multifunctional platform on which many functions (e.g., electrical stimulation, microfluidics, and sensing) can be integrated for application in fields such as biology, materials science, and chemical research.

3.2. Super-Resolution Microscopy via Surface Plasmon Polaritons Illumination

SPP is a surface wave that oscillates collectively with free electrons at the interface between metallic and dielectric media can also be regarded as an evanescent wave [69]. The k-vector of SPP waves k s p is generally determined by the working wavelength ( λ 0 ), the permittivity of the metal material ε m and dielectric material ε d , which can be expressed as:
k s p = k 0 ε d ε m ε d + ε m
where k 0 = 2 π / λ 0 is the k-vector of working wavelength in vacuum. Due to the negative dielectric constant of metals in the working wavelength range, SPP waves often have larger momentum compared to excitation waves, which can provide a larger frequency-shift magnitude in the spatial-frequency domain. In addition, SPP waves also have natural polarization selectivity since they can only be excited by TM waves. Thus, early in 2010, Liu et al. [70] proposed a SPP-based SR imaging technology called plasmonic structured illumination microscopy (PSIM), which combines the structured illumination microscopy technique with the tunable surface plasmon interference.
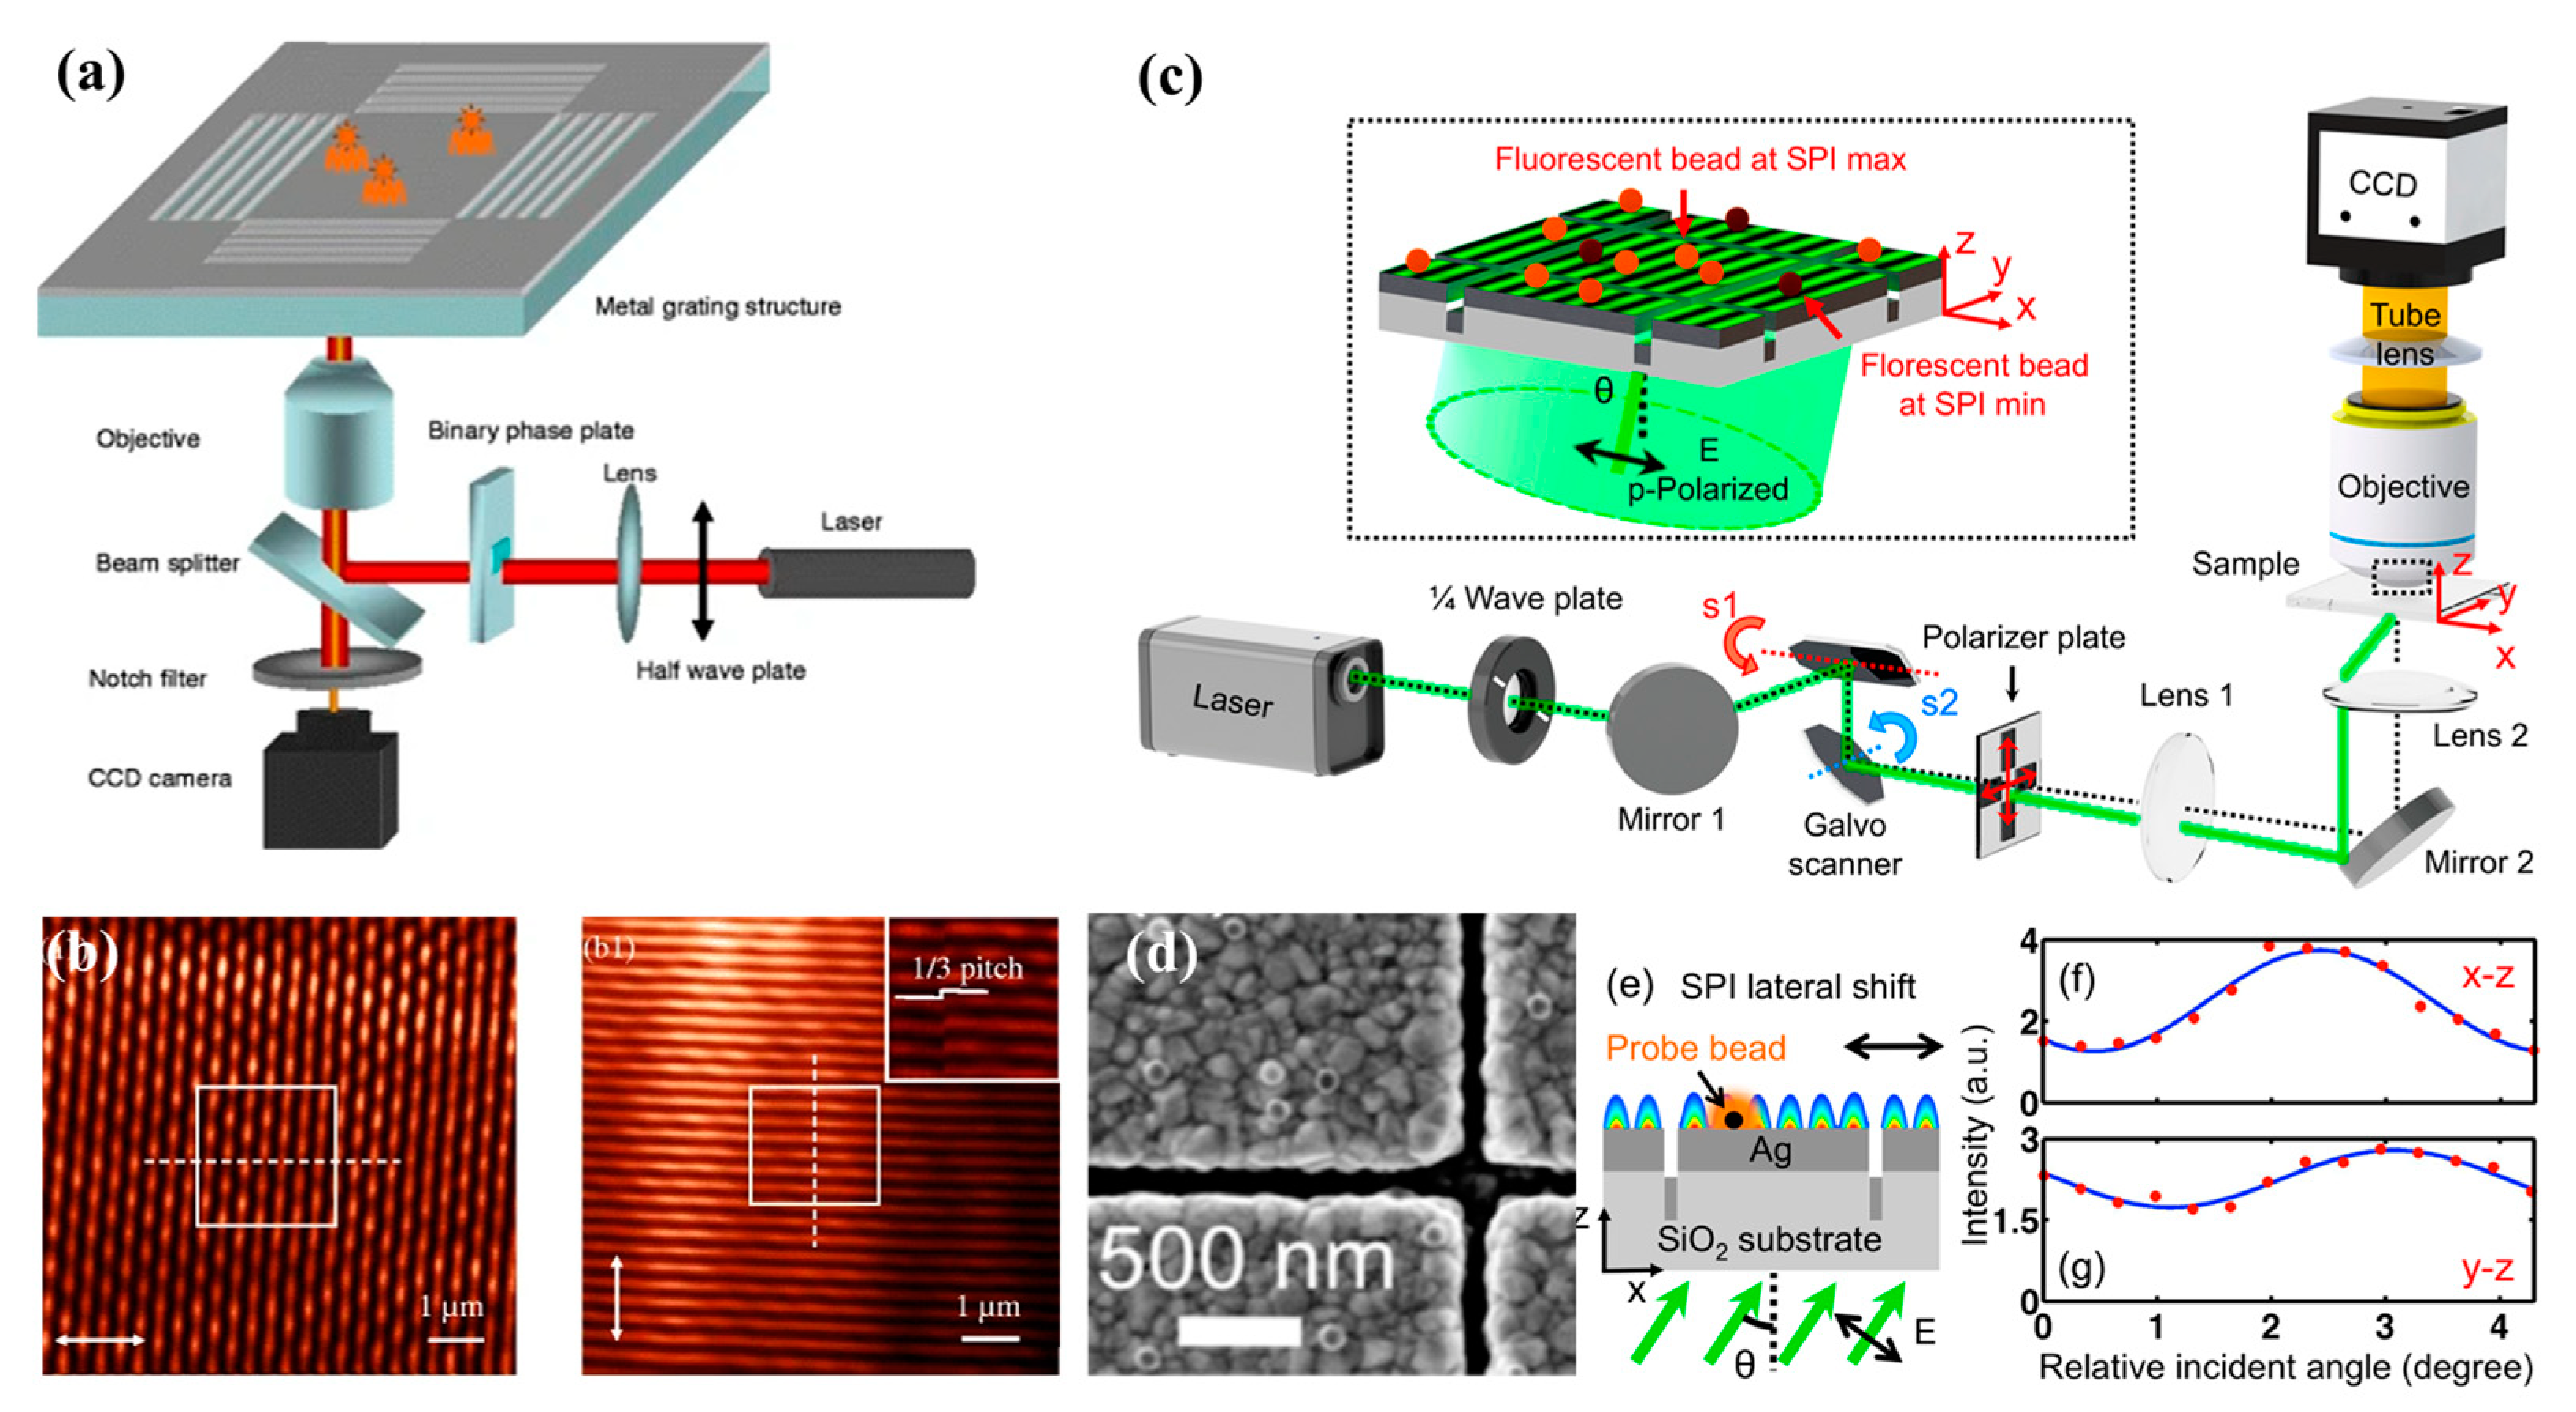
In the same year, Yuan et al. [71] demonstrated a high-resolution wide-field fluorescence microscopy by using standing surface plasmon waves induced by optical vortices (OVs). Later in 2012, Yuan et al. [72] improved their experimental setup using subwavelength slit arrays embedded in a thin silver film to generate surface plasmon standing wave interference patterns, as shown in Figure 6a. By controlling the phase and polarization of the incident light, the interference pattern is shifted, and the direction is changed (Figure 6b). As a result, a resolution of 172 nm for fluorescent samples is achieved by PSIM at a wavelength center of 645 nm using a 1.42-NA objective lens. In 2014, Liu et al. [73] demonstrated an edge excitation method for PSIM. A groove structure with a period of 7.6 μm is etched on a single-layer silver film with a thickness of 250 nm to excite surface plasmon polaritons that propagate relative to each other, as shown in Figure 6c,d. By controlling the incident angle and polarization of the incident light, the interference pattern is shifted and the direction is changed, as shown in Figure 6e–g. In this method, the full width at half height of fluorescent molecule is decreased from 327 nm to 123 nm, achieving a 2.6 times resolution improvement.
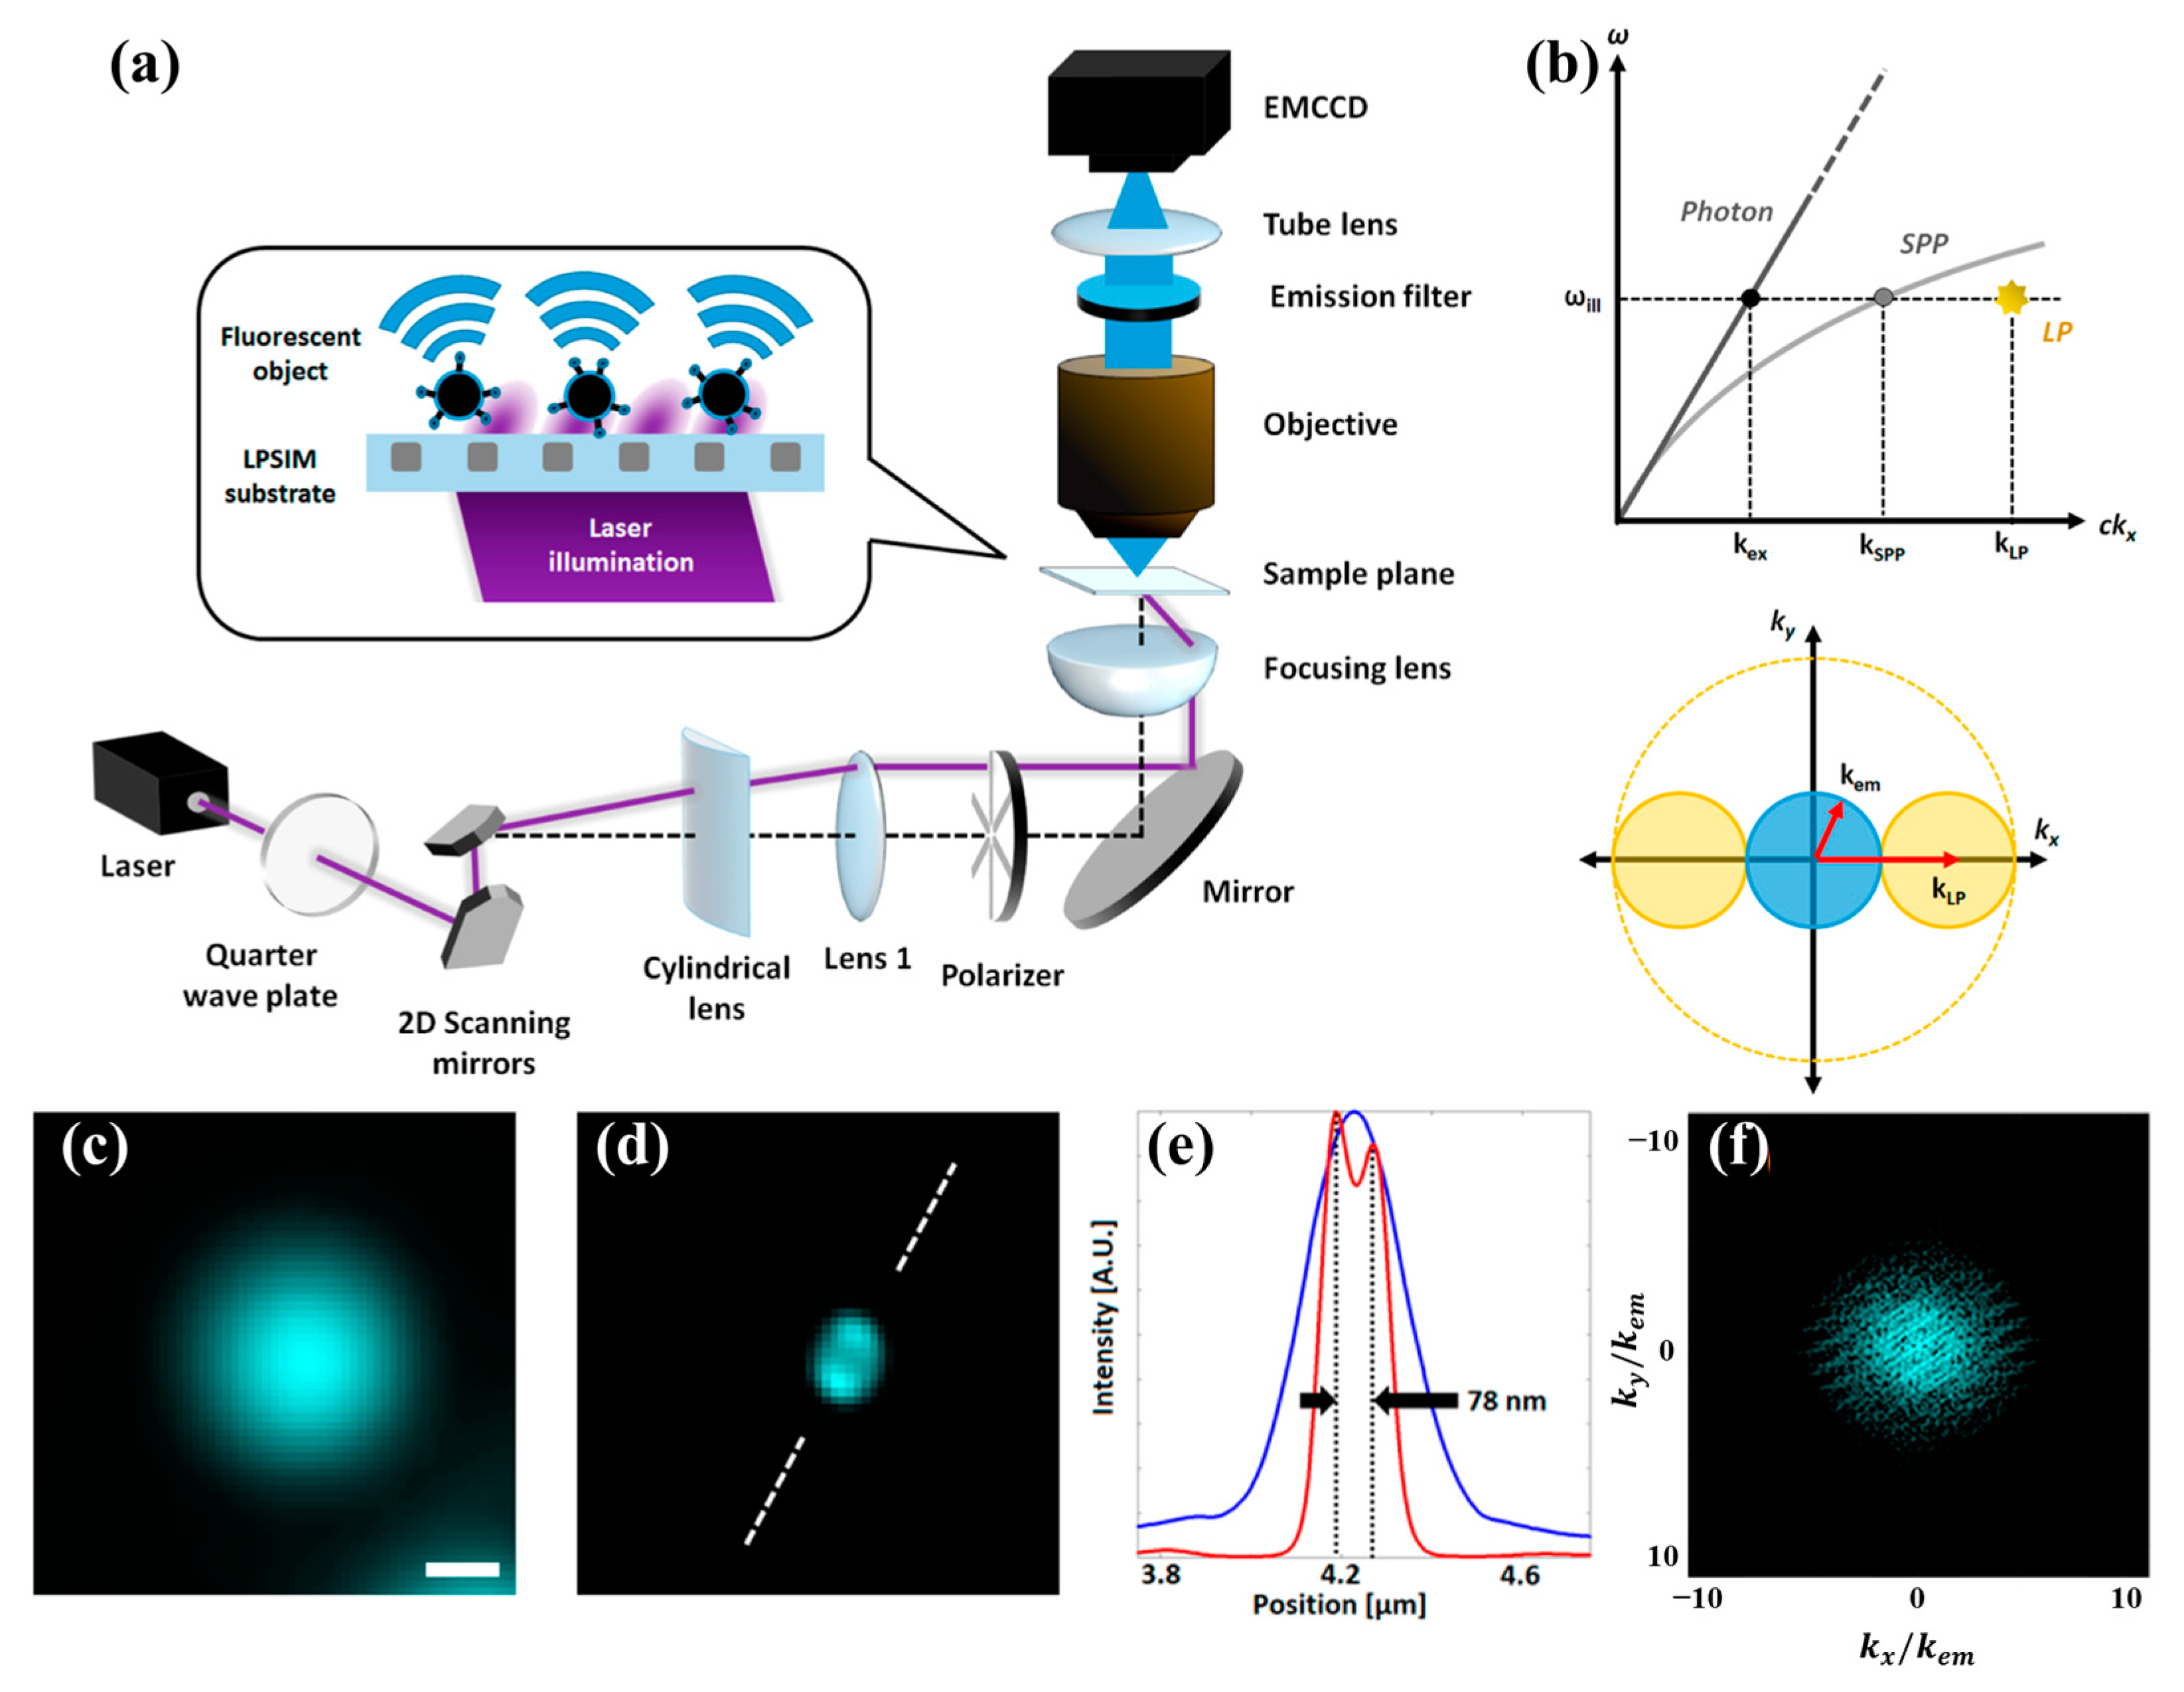
To further improve the resolution, Liu et al. [74,75] proposed and experimentally demonstrated a localized plasmonic structured illumination microscopy (LPSIM), as shown in Figure 7a. Unlike when using propagating wave interference in PSIM, the evanescent illumination of LPSIM is generated by a localized plasmon antenna array manufactured by electron beam etching. The k-vector of the structural illumination pattern in LPSIM is only limited by the period of the antenna array, so theoretically, higher spatial-frequency shift in Fourier space can be obtained as shown in Figure 7b. Assuming the spacing of the antenna array is p, the k-vector of the evanescent localized plasmonic structured illumination can be described as k = 2 π/p. They optimized the size and spacing of the antenna through simulation, setting the antenna diameter to 60 nm and the spacing to 150 nm. Lastly, a resolution of 78 nm ( λ / 5.6 N A ) was achieved when imaging fluorescent polystyrene microspheres (with an emission wavelength of 500 nm), as shown in Figure 7c–f. Although the k-vector can be further improved by control the space p, the resolution of LPSIM is still limited by the spatial-frequency gaps as mentioned previously [76]. Therefore, although Liu’s team validated the possibility of using LPSIM for rapid biological imaging in subsequent work later [77], it is difficult to further improve the resolution with determined k-vector in LPSIM.

4. Super-Resolution Imaging by Random k-Vector Evanescent Speckle Illumination

4.1. Super-Resolution Microscopy Using Waveguide Speckle Illumination

Although achieving SR imaging using determined k-vector EW illumination seems elegant and concise, there are conditions under which controlling the k-vector precisely will be too difficult due to imperfect fabrication, unavoidable speckle, dispersion, and so on. Speckle patterns are unavoidable in most optical set-up and have long been believed to damage the imaging quality. However, with the development of computational imaging, speckle patterns have shown great potential in enhancing the resolution of optical systems. As early as 1970, Labeyrie et al. [78] utilized the correlation of speckle patterns to obtain diffraction limited images of astronomical objects passing through atmospheric turbulence. In 2005, Garcia et al. [79] projected a determined speckle pattern onto the sample to obtain high-frequency information of the sample, and ultimately obtain a high-resolution image higher than the imaging objective. A. P. Mosk et al. [80,81] believed speckles help achieve better focusing effects, and ultimately used the strong scattering layer on the GaP surface combined with a spatial light modulator to form a sub 100 nm focal point, achieving an optical resolution of 97 nm when imaging gold nanoparticles. In 2012, a blind SIM method has been demonstrated by E. Mudry et al. [48], which exploited the statistical properties of speckle patterns and does not require precise knowledge of the illuminating intensity patterns. Thus, the resolution of traditional optical microscopes can be doubled through random speckle illumination, which inspires researchers to develop more speckle-based SR microscopy [49,76,82,83,84].
The new fluorescence imaging method proposed by Hasan Yilmaz et al. [49] in 2015 is classic waveguide based super-resolution microscopy, which enhances the spatial resolution by speckle correlation. This method is named speckle correlation resolution enhancement (SCORE) microscopy. A beam of coherent light illuminates a scattering layer on a GaP substrate and generates a speckle pattern illumination with a large k-vector in the other side. By utilizing the invariance of speckle patterns at small angles, the sample is scanned by changing the angle of incident light and 2500 LR speckle images are captured. Compared with determined k-vector EW illumination, single speckle illumination pattern contains k-vector from 0 to the highest k e = n e k 0 . By demodulating high spatial-frequency information from these LR images, the SR image obtained by SCORE with a spatial resolution of 146 nm is shown in Figure 8b. Although successful, further resolution enhancement is still constrained by the effective refractive index of the illumination substrate similar as the methods described in Section 3.1.

4.2. Super-Resolution Imaging Using Surface Plasmon Polaritons Speckle Illumination

While the resolution of waveguide speckle illumination is limited by the refractive index of waveguide in visible wavelength, with the development of processing technology, the k-vector of localized plasmonic (LP) illumination can be further improved. In 2019, Liu et al. [76] numerically and experimentally demonstrated that using localized plasmonic speckle illumination field can solve the problem of artifacts in traditional frequency shift imaging. This is because, in fact, when a circular antenna generates a large k-vector localized plasmonic, smaller k-vector surface plasmon wave with lower intensity will also be inevitably generated. The traditional SIM algorithm is not designed to separate these mixed frequencies from the captured images, while the new blind SIM algorithm iterates them as a whole, solving the overall spectrum distribution through overall constraints and restoring the super-resolution image information of the samples. With the help of BSIM, Liu increased the resolution of the 0.55 NA objective by more than 5 times and the 1.20 NA objective by more than 4 times, solving the limitation of high NA objective on imaging resolution.
In 2021, Liu et al. [82] further adopted a hyperbolic meta-surface to generate LP random speckle illumination with larger k-vector to improve the resolution of wide field fluorescence super-resolution, which is named as speckle metamaterial-assisted illumination nanoscopy (speckle-MAIN), as shown in Figure 9a,b. HMM is composed of multiple layers of periodic metallic and non-metallic thin films, which was originally conceived by B. Wood and B. Pendry et al. [85] in 2006. The effective refractive index of HMM is largely dependent on the thickness of each film, with a thinner film leading to a higher effective refractive index. Liu et al. processed the hyperbolic meta-surface film composed of 10 nm Ag and 4 nm S i O 2 films using magnetron sputtering method, enabling it to support evanescent illumination with k-vector greater than 10 k 0 and achieving a resolution of 60 nm, as shown in Figure 9c–g. Subsequently, Liu’s group further optimized the processing of the HMM and fabricated a single-layer 2.5 nm thick Ag and MgO ultra-thin hyperbolic meta-surface, which further pushed the resolution down to 24 nm [84,86].
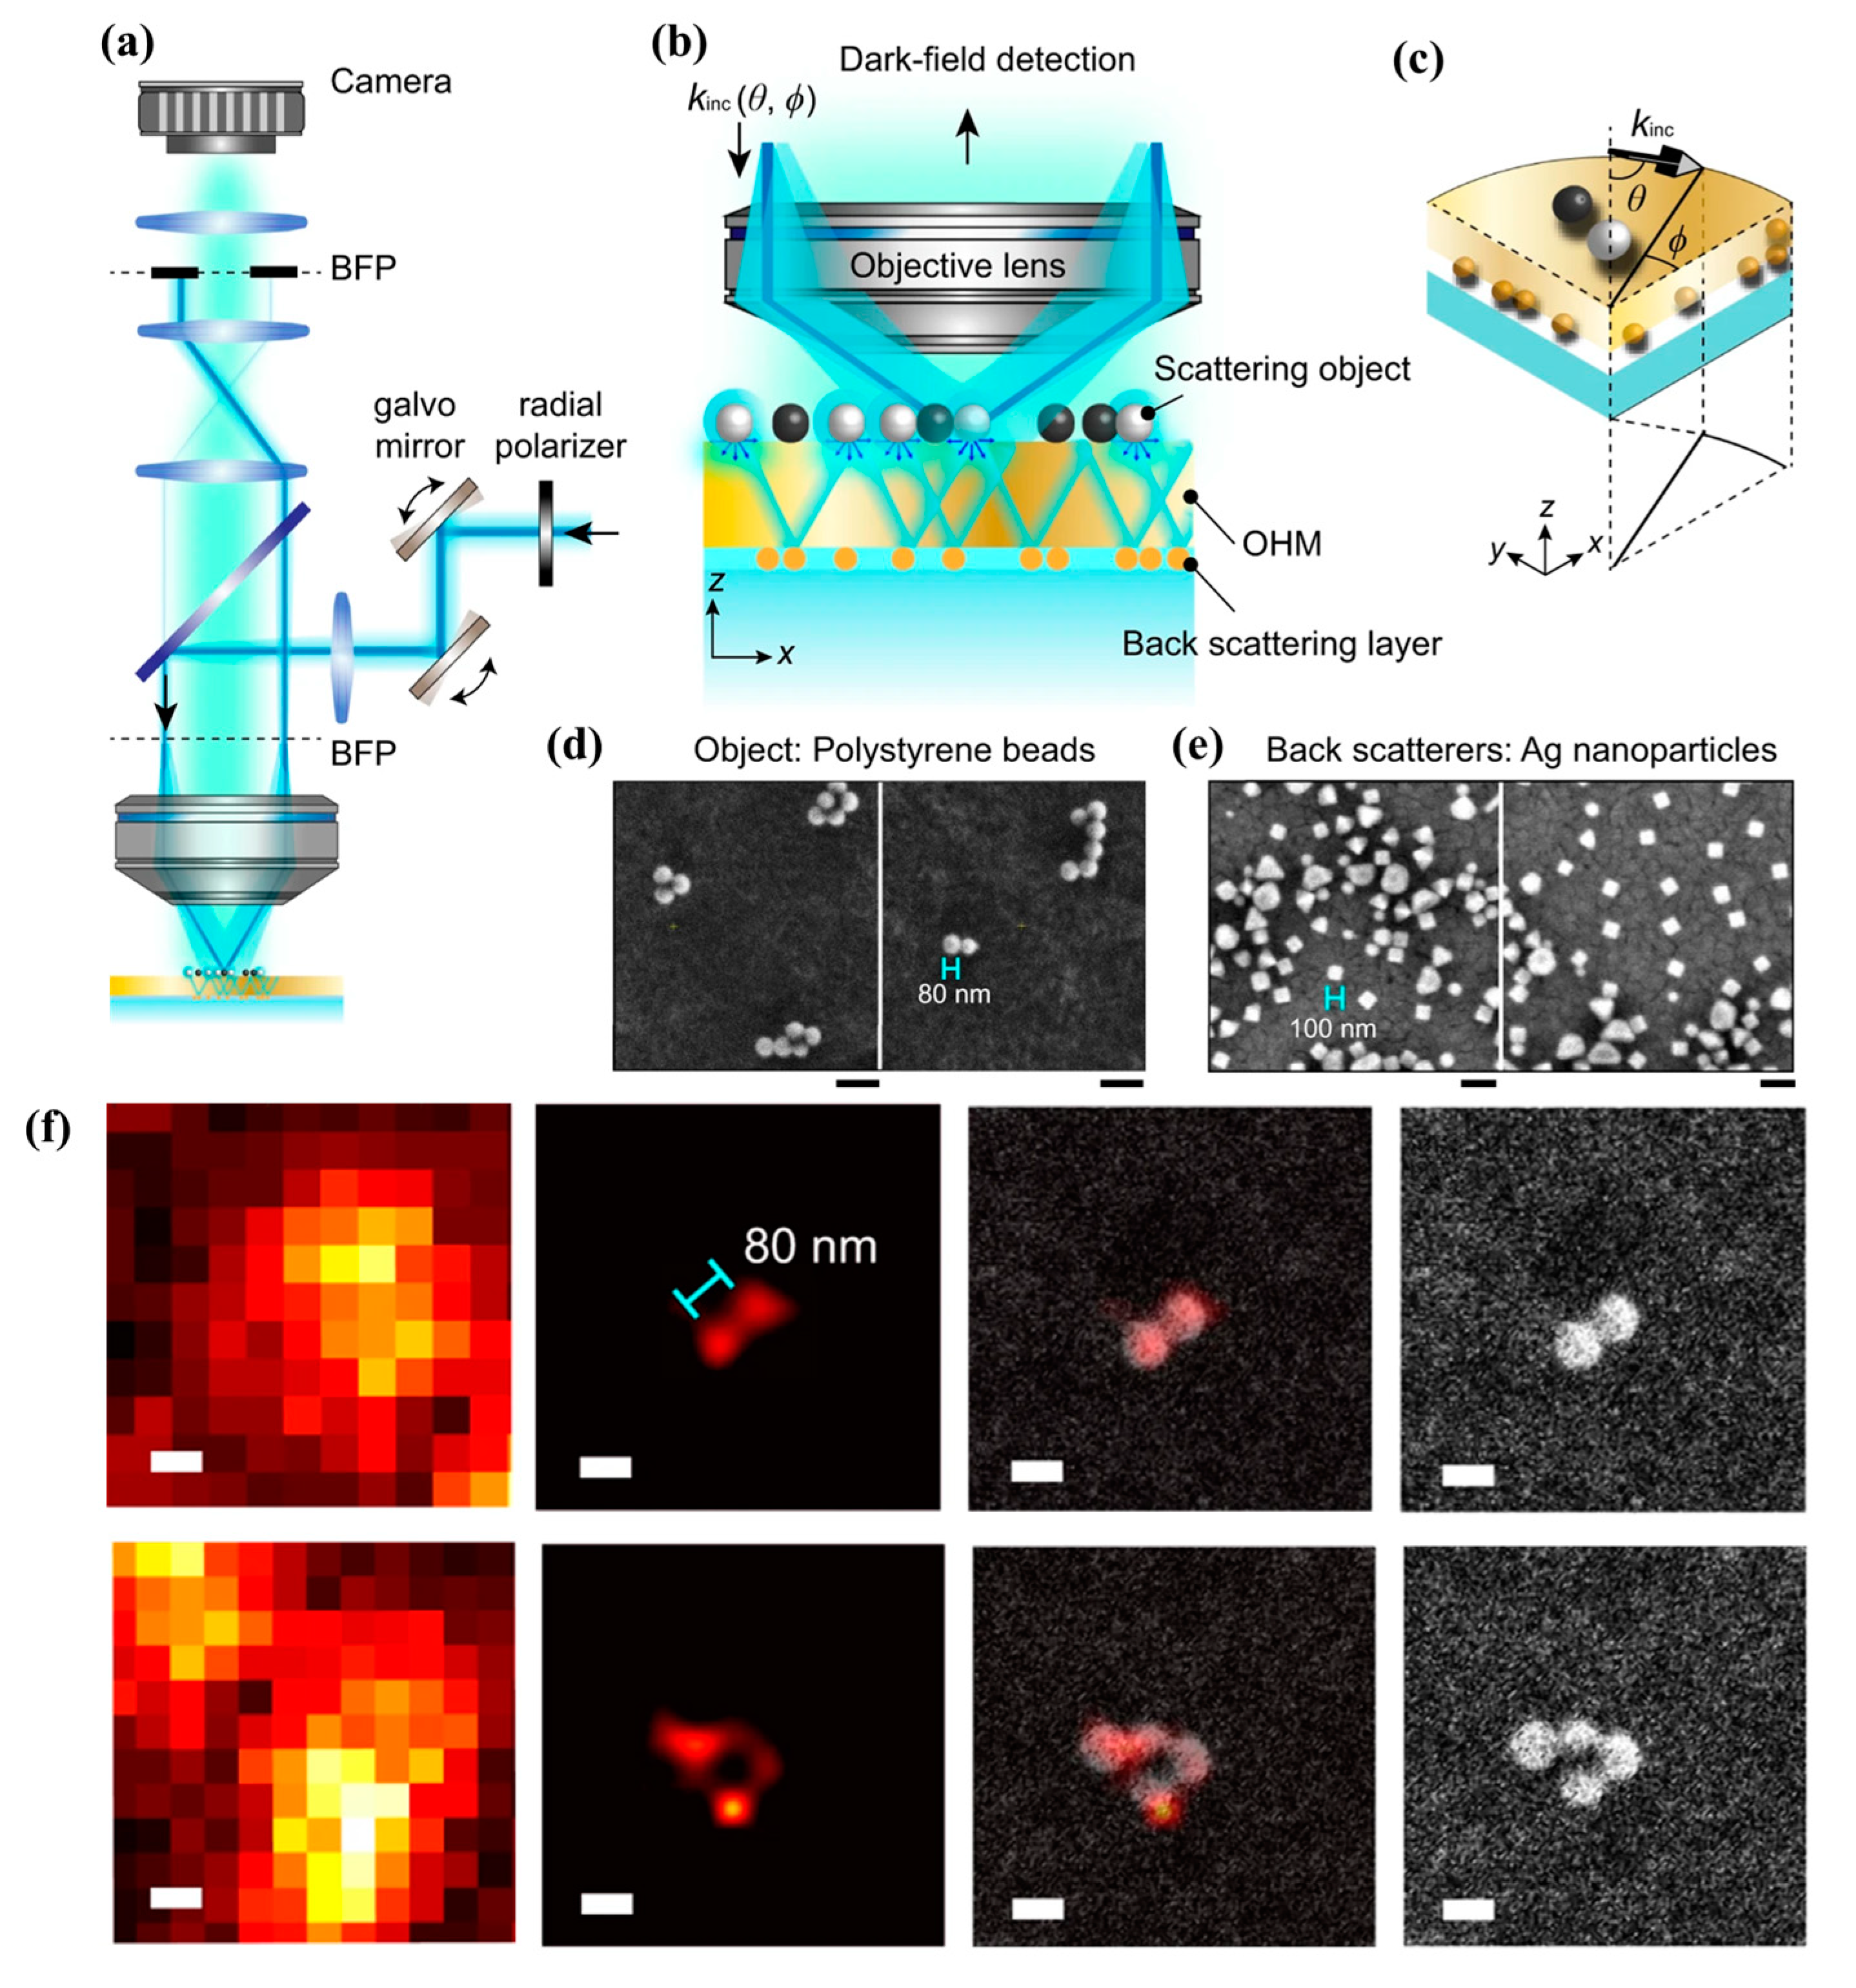
In addition, a label-free SR imaging method using plasmonic material, called hyperbolic material enhanced scattering (HMES) nanoscopy, was first demonstrated by Liu et al. [83], who introduced a hyperbolic material as the substrate to not only enhance the scattering intensities of small objects but also control the illumination/scattered field distributions at deep subwavelength scales, as shown in Figure 10a–c. Ag nanoparticles in Figure 10e are used to enhance the back scattering illumination. A high contrast scattering image with resolution of 80 nm was achieved with a 0.6 NA objective lens and 532 nm working wavelength, resulting in a 5.5-fold resolution improvement, as shown in Figure 10d,f. Although the final reconstructed images may contain some artifacts that need a systematic study to deal with them, this research shows the significant potential of using evanescent plasmonic speckle pattern in label-free SR imaging.

5. Summary and Perspective

In conclusion, this review introduces the basic principle of far-field super-resolution using evanescent illumination. The key point of improving the resolution is to generate evanescent illumination with larger k-vector and demodulated high spatial-frequency information from LR SFS images. With the great works of several researchers, the resolution of super-resolution microscopy imaging via evanescent illumination has achieved sub-25 nm [84] for fluorescent samples and 80 nm [83] for label-free samples, providing new tools for biomedical researchers to study more in the microscopic world. However, there are still some problems, especially when pushing extreme high resolution. First, the improvement of resolution requires more original low-resolution images and more iterative reconstruction time. Second, the scattered light intensity of nanostructures excited by high k-vector evanescent illumination is relatively weak and easily affected by stray light, resulting in a decrease in signal-to-noise ratio and even reconstruction failure. Lastly, the effective refractive index of natural waveguides in visible light is limited, leading to a bottleneck in the resolution improvement. Although HMM has been introduced to support high k-vector transmission, the true physical mechanism and the experimental results still need to be further clarified.
Therefore, there is still a long way to go for SR imaging via evanescent illumination. For practical use, the imaging speed must be accelerated. Deep learning method can be a powerful solution to decrease the large data and time cost for SR imaging [87,88,89,90,91]. Combing the physical scheme is a new trend to realize a universal deep-learning method [92,93]. Nonlinear optics such as four wave mixing may help further enhance the scattering intensity and provide better spatial resolution.
Combining super-resolution methods with other methods are potential research directions that offer multi-dimensional information of samples. For example, chemical detection methods such as Raman and infrared spectroscopy could be realized with SFS method to obtain SR chemical information [94]. Besides, polarization-modulated evanescent illumination could be combined with SFS method to achieve SR orientation imaging [95].
In addition, the on-chip characteristics, miniaturization design, and compatibility with semiconductor processes are also the advantages of evanescent illumination SR microscopy, which can largely reduce the cost of SR imaging and benefit research in bio-medical, environment detection [96,97] and so on.

Author Contributions

Writing—original draft preparation, Q.Z., H.Z. and X.Y.; writing—review and editing, M.T., Q.Y. and Q.Z.; project administration, M.T. and Q.Y.; funding acquisition, X.L. and Q.Y. All authors have read and agreed to the published version of the manuscript.

Funding

This research was funded by the National Natural Science Foundation of China (grant no. 92250304, 62020106002, T2293750, and T2293751) and the Zhejiang University Education Foundation Global Partnership Fund.

Institutional Review Board Statement

Not applicable.

Informed Consent Statement

Not applicable.

Data Availability Statement

Not applicable.

Conflicts of Interest

The authors declare no conflicts of interest.

References

  1. Abbe, E. Beiträge zur Theorie des Mikroskops und der mikroskopischen Wahrnehmung. Arch. Mikrosk. Anat. 1873, 9, 413–468. [Google Scholar] [CrossRef]
  2. von Helmholtz, H. Die Theoretische Grenze für die Leistungsfähigkeit der Mikroskope; Biblio, Inc.: Asheville, NC, USA, 1874. [Google Scholar]
  3. Jiang, Y.; Chen, Z.; Han, Y.; Deb, P.; Gao, H.; Xie, S.; Purohit, P.; Tate, M.W.; Park, J.; Gruner, S.M.; et al. Electron ptychography of 2D materials to deep sub-ångström resolution. Nature 2018, 559, 343–349. [Google Scholar] [CrossRef] [PubMed]
  4. Moerner, W.E.; Kador, L. Optical detection and spectroscopy of single molecules in a solid. Phys. Rev. Lett. 1989, 62, 2535. [Google Scholar] [CrossRef] [PubMed]
  5. Dickson, R.M.; Cubitt, A.B.; Tsien, R.Y.; Moerner, W.E. On/off blinking and switching behaviour of single molecules of green fluorescent protein. Nature 1997, 388, 355–358. [Google Scholar] [CrossRef] [PubMed]
  6. Hell, S.W.; Wichmann, J. Breaking the diffraction resolution limit by stimulated emission: Stimulated-emission-depletion fluorescence microscopy. Opt. Lett. 1994, 19, 780–782. [Google Scholar] [CrossRef] [PubMed]
  7. Klar, T.A.; Jakobs, S.; Dyba, M.; Egner, A.; Hell, S.W. Fluorescence microscopy with diffraction resolution barrier broken by stimulated emission. Proc. Natl. Acad. Sci. USA 2000, 97, 8206–8210. [Google Scholar] [CrossRef] [PubMed]
  8. Wildanger, D.; Patton, B.R.; Schill, H.; Marseglia, L.; Hadden, J.P.; Knauer, S.; Schönle, A.; Rarity, J.G.; O’Brien, J.L.; Hell, S.W.; et al. Solid Immersion Facilitates Fluorescence Microscopy with Nanometer Resolution and Sub-Ångström Emitter Localization. Adv. Mater. 2012, 24, OP309–OP313. [Google Scholar] [CrossRef]
  9. Klar, T.A.; Hell, S.W. Subdiffraction resolution in far-field fluorescence microscopy. Opt. Lett. 1999, 24, 954–956. [Google Scholar] [CrossRef] [PubMed]
  10. Betzig, E.; Patterson, G.H.; Sougrat, R.; Lindwasser, O.W.; Olenych, S.; Bonifacino, J.S.; Davidson, M.W.; Lippincott-Schwartz, J.; Hess, H.F. Imaging Intracellular Fluorescent Proteins at Nanometer Resolution. Science 2006, 313, 1642–1645. [Google Scholar] [CrossRef]
  11. Shroff, H.; Galbraith, C.G.; Galbraith, J.A.; Betzig, E. Live-cell photoactivated localization microscopy of nanoscale adhesion dynamics. Nat. Methods 2008, 5, 417–423. [Google Scholar] [CrossRef]
  12. Betzig, E. Proposed method for molecular optical imaging. Opt. Lett. 1995, 20, 237–239. [Google Scholar] [CrossRef] [PubMed]
  13. Manley, S.; Gillette, J.M.; Patterson, G.H.; Shroff, H.; Hess, H.F.; Betzig, E.; Lippincott-Schwartz, J. High-density mapping of single-molecule trajectories with photoactivated localization microscopy. Nat. Methods 2008, 5, 155–157. [Google Scholar] [CrossRef] [PubMed]
  14. Pavani, S.R.P.; Thompson, M.A.; Biteen, J.S.; Lord, S.J.; Liu, N.; Twieg, R.J.; Piestun, R.; Moerner, W.E. Three-dimensional, single-molecule fluorescence imaging beyond the diffraction limit by using a double-helix point spread function. Proc. Natl. Acad. Sci. USA 2009, 106, 2995–2999. [Google Scholar] [CrossRef]
  15. Huang, B.; Wang, W.; Bates, M.; Zhuang, X. Three-Dimensional Super-Resolution Imaging by Stochastic Optical Reconstruction Microscopy. Science 2008, 319, 810–813. [Google Scholar] [CrossRef] [PubMed]
  16. van de Linde, S.; Endesfelder, U.; Mukherjee, A.; Schüttpelz, M.; Wiebusch, G.; Wolter, S.; Heilemann, M.; Sauer, M. Multicolor photoswitching microscopy for subdiffraction-resolution fluorescence imaging. Photochem. Photobiol. Sci. 2009, 8, 465–469. [Google Scholar] [CrossRef] [PubMed]
  17. Shim, S.-H.; Xia, C.; Zhong, G.; Babcock, H.P.; Vaughan, J.C.; Huang, B.; Wang, X.; Xu, C.; Bi, G.-Q.; Zhuang, X. Super-resolution fluorescence imaging of organelles in live cells with photoswitchable membrane probes. Proc. Natl. Acad. Sci. USA 2012, 109, 13978–13983. [Google Scholar] [CrossRef] [PubMed]
  18. Shiku, H.; Dunn, R.C. Near-field scanning—Optical microscopy. Anal. Chem. 1999, 71, 23A–29A. [Google Scholar] [CrossRef]
  19. Hecht, B.; Sick, B.; Wild, U.P.; Deckert, V.; Zenobi, R.; Martin, O.J.F.; Pohl, D.W. Scanning near-field optical microscopy with aperture probes: Fundamentals and applications. J. Chem. Phys. 2000, 112, 7761–7774. [Google Scholar] [CrossRef]
  20. Bek, A.; Vogelgesang, R.; Kern, K. Apertureless scanning near field optical microscope with sub-10 nm resolution. Rev. Sci. Instrum. 2006, 77, 043703. [Google Scholar] [CrossRef]
  21. Rotenberg, N.; Kuipers, L. Mapping nanoscale light fields. Nat. Photonics 2014, 8, 919–926. [Google Scholar] [CrossRef]
  22. Rho, J.; Ye, Z.; Xiong, Y.; Yin, X.; Liu, Z.; Choi, H.; Bartal, G.; Zhang, X. Spherical hyperlens for two-dimensional sub-diffractional imaging at visible frequencies. Nat. Commun. 2010, 1, 143. [Google Scholar] [CrossRef] [PubMed]
  23. Sun, J.; Shalaev, M.I.; Litchinitser, N.M. Experimental demonstration of a non-resonant hyperlens in the visible spectral range. Nat. Commun. 2015, 6, 7201. [Google Scholar] [CrossRef] [PubMed]
  24. Liu, Z.; Lee, H.; Xiong, Y.; Sun, C.; Zhang, X. Far-Field Optical Hyperlens Magnifying Sub-Diffraction-Limited Objects. Science 2007, 315, 1686. [Google Scholar] [CrossRef] [PubMed]
  25. Chen, L.; Wang, G.P. Pyramid-shaped hyperlenses for three-dimensional subdiffraction optical imaging. Opt. Express 2009, 17, 3903–3912. [Google Scholar] [CrossRef] [PubMed]
  26. Jacob, Z.; Alekseyev, L.V.; Narimanov, E. Optical “Hyperlens”: Imaging in the far field beyond the diffraction limit. In Proceedings of the Frontiers in Optics, Rochester, NY, USA, 10 October 2006; p. FMA2. [Google Scholar]
  27. Gustafsson, M.G. Surpassing the lateral resolution limit by a factor of two using structured illumination microscopy. J. Microsc. 2000, 198, 82–87. [Google Scholar] [CrossRef]
  28. Heintzmann, R.; Cremer, C.G. Laterally modulated excitation microscopy: Improvement of resolution by using a diffraction grating. In Proceedings of the Optical Biopsies and Microscopic Techniques III, Stockholm, Sweden, 9–11 September 1998; pp. 185–196. [Google Scholar]
  29. Wong, A.M.H.; Eleftheriades, G.V. An Optical Super-Microscope for Far-field, Real-time Imaging Beyond the Diffraction Limit. Sci. Rep. 2013, 3, 1715. [Google Scholar] [CrossRef] [PubMed]
  30. Rogers, E.T.F.; Quraishe, S.; Rogers, K.S.; Newman, T.A.; Smith, P.J.S.; Zheludev, N.I. Far-field unlabeled super-resolution imaging with superoscillatory illumination. APL Photonics 2020, 5, 066107. [Google Scholar] [CrossRef]
  31. Pu, T.; Ou, J.Y.; Papasimakis, N.; Zheludev, N.I. Label-free deeply subwavelength optical microscopy. Appl. Phys. Lett. 2020, 116, 131105. [Google Scholar] [CrossRef]
  32. Yuan, G.H.; Lin, Y.H.; Tsai, D.P.; Zheludev, N.I. Superoscillatory quartz lens with effective numerical aperture greater than one. Appl. Phys. Lett. 2020, 117, 021106. [Google Scholar] [CrossRef]
  33. Zheludev, N.I.; Yuan, G. Optical superoscillation technologies beyond the diffraction limit. Nat. Rev. Phys. 2021, 4, 16–32. [Google Scholar] [CrossRef]
  34. Darafsheh, A. Microsphere-assisted microscopy. J. Appl. Phys. 2022, 131, 031102. [Google Scholar] [CrossRef]
  35. Kwon, S.; Park, J.; Kim, K.; Cho, Y.; Lee, M. Microsphere-assisted, nanospot, non-destructive metrology for semiconductor devices. Light Sci. Appl. 2022, 11, 32. [Google Scholar] [CrossRef]
  36. Lai, H.S.S.; Wang, F.; Li, Y.; Jia, B.; Liu, L.; Li, W.J. Super-resolution real imaging in microsphere-assisted microscopy. PLoS ONE 2016, 11, e0165194. [Google Scholar] [CrossRef] [PubMed]
  37. Wang, Z.B.; Guo, W.; Li, L.; Luk’yanchuk, B.; Khan, A.; Liu, Z.; Chen, Z.C.; Hong, M.H. Optical virtual imaging at 50 nm lateral resolution with a white-light nanoscope. Nat. Commun. 2011, 2, 218. [Google Scholar] [CrossRef]
  38. Allen, K.W.; Farahi, N.; Li, Y.C.; Limberopoulos, N.I.; Walker, D.E.; Urbas, A.M.; Liberman, V.; Astratov, V.N. Super-resolution microscopy by movable thin-films with embedded microspheres: Resolution analysis. Ann. Der Phys. 2015, 527, 513–522. [Google Scholar] [CrossRef]
  39. Darafsheh, A.; Walsh, G.F.; Dal Negro, L.; Astratov, V.N. Optical super-resolution by high-index liquid-immersed microspheres. Appl. Phys. Lett. 2012, 101, 141128. [Google Scholar] [CrossRef]
  40. Darafsheh, A.; Limberopoulos, N.I.; Derov, J.S.; Walker, D.E.; Astratov, V.N. Advantages of microsphere-assisted super-resolution imaging technique over solid immersion lens and confocal microscopies. Appl. Phys. Lett. 2014, 104, 061117. [Google Scholar] [CrossRef]
  41. Allen, K.W.; Farahi, N.; Li, Y.C.; Limberopoulos, N.I.; Walker, D.E.; Urbas, A.M.; Astratov, V.N. Overcoming the diffraction limit of imaging nanoplasmonic arrays by microspheres and microfibers. Opt. Express 2015, 23, 24484–24496. [Google Scholar] [CrossRef] [PubMed]
  42. Hao, X.; Kuang, C.; Li, Y.; Liu, X. Evanescent-wave-induced frequency shift for optical superresolution imaging. Opt. Lett. 2013, 38, 2455–2458. [Google Scholar] [CrossRef]
  43. Liu, X.; Kuang, C.; Hao, X.; Pang, C.; Xu, P.; Li, H.; Liu, Y.; Yu, C.; Xu, Y.; Nan, D. Fluorescent nanowire ring illumination for wide-field far-field subdiffraction imaging. Phys. Rev. Lett. 2017, 118, 076101. [Google Scholar] [CrossRef]
  44. Tang, M.; Yang, Q. Spatial-frequency-shift Super-resolution Imaging Based on Micro/nanomaterials. In Optical Imaging and Sensing; Wiley: Hoboken, NJ, USA, 2023; pp. 175–213. [Google Scholar]
  45. Pang, C.; Liu, X.; Zhuge, M.; Liu, X.; Somekh, M.G.; Zhao, Y.; Jin, D.; Shen, W.; Li, H.; Wu, L. High-contrast wide-field evanescent wave illuminated subdiffraction imaging. Opt. Lett. 2017, 42, 4569–4572. [Google Scholar] [CrossRef] [PubMed]
  46. Tang, M.; Liu, X.; Wen, Z.; Lin, F.; Meng, C.; Liu, X.; Ma, Y.; Yang, Q. Far-Field Superresolution Imaging via Spatial Frequency Modulation. Laser Photonics Rev. 2020, 14, 1900011. [Google Scholar] [CrossRef]
  47. Zheng, G.; Horstmeyer, R.; Yang, C. Wide-field, high-resolution Fourier ptychographic microscopy. Nat. Photonics 2013, 7, 739–745. [Google Scholar] [CrossRef]
  48. Mudry, E.; Belkebir, K.; Girard, J.; Savatier, J.; Le Moal, E.; Nicoletti, C.; Allain, M.; Sentenac, A. Structured illumination microscopy using unknown speckle patterns. Nat. Photonics 2012, 6, 312–315. [Google Scholar] [CrossRef]
  49. Yilmaz, H.; van Putten, E.G.; Bertolotti, J.; Lagendijk, A.; Vos, W.L.; Mosk, A.P. Speckle correlation resolution enhancement of wide-field fluorescence imaging. Optica 2015, 2, 424–429. [Google Scholar] [CrossRef]
  50. Jin, L.; Wu, J.; Xiu, P.; Fan, J.; Hu, M.; Kuang, C.; Xu, Y.; Zheng, X.; Liu, X. High-resolution 3D reconstruction of microtubule structures by quantitative multi-angle total internal reflection fluorescence microscopy. Opt. Commun. 2017, 395, 16–23. [Google Scholar] [CrossRef]
  51. Fu, Y.; Winter, P.W.; Rojas, R.; Wang, V.; McAuliffe, M.; Patterson, G.H. Axial superresolution via multiangle TIRF microscopy with sequential imaging and photobleaching. Proc. Natl. Acad. Sci. USA 2016, 113, 4368–4373. [Google Scholar] [CrossRef]
  52. Stabley, D.R.; Oh, T.; Simon, S.M.; Mattheyses, A.L.; Salaita, K. Real-time fluorescence imaging with 20 nm axial resolution. Nat. Commun. 2015, 6, 8307. [Google Scholar] [CrossRef]
  53. Boulanger, J.; Gueudry, C.; Münch, D.; Cinquin, B.; Paul-Gilloteaux, P.; Bardin, S.; Guérin, C.; Senger, F.; Blanchoin, L.; Salamero, J. Fast high-resolution 3D total internal reflection fluorescence microscopy by incidence angle scanning and azimuthal averaging. Proc. Natl. Acad. Sci. USA 2014, 111, 17164–17169. [Google Scholar] [CrossRef]
  54. Stock, K.; Sailer, R.; Strauss, W.S.L.; Lyttek, M.; Steiner, R.; Schneckenburger, H. Variable-angle total internal reflection fluorescence microscopy (VA-TIRFM): Realization and application of a compact illumination device. J. Microsc. 2003, 211, 19–29. [Google Scholar] [CrossRef]
  55. Paszek, M.J.; DuFort, C.C.; Rubashkin, M.G.; Davidson, M.W.; Thorn, K.S.; Liphardt, J.T.; Weaver, V.M. Scanning angle interference microscopy reveals cell dynamics at the nanoscale. Nat. Methods 2012, 9, 825–827. [Google Scholar] [CrossRef] [PubMed]
  56. Hao, X.; Liu, X.; Kuang, C.; Li, Y.; Ku, Y.; Zhang, H.; Li, H.; Tong, L. Far-field super-resolution imaging using near-field illumination by micro-fiber. Appl. Phys. Lett. 2013, 102, 013104. [Google Scholar] [CrossRef]
  57. Chen, Y.; Liu, W.; Zhang, Z.; Zheng, C.; Huang, Y.; Cao, R.; Zhu, D.; Xu, L.; Zhang, M.; Zhang, Y.-H.; et al. Multi-color live-cell super-resolution volume imaging with multi-angle interference microscopy. Nat. Commun. 2018, 9, 4818. [Google Scholar] [CrossRef] [PubMed]
  58. Pang, C.; Li, J.; Tang, M.; Wang, J.; Mela, I.; Ströhl, F.; Hecker, L.; Shen, W.; Liu, Q.; Liu, X.; et al. On-Chip Super-Resolution Imaging with Fluorescent Polymer Films. Adv. Funct. Mater. 2019, 29, 1900126. [Google Scholar] [CrossRef]
  59. Ye, D.; Tang, M.; Liu, X.; Ma, Y.; Liu, X.; Yang, Q. Low loss and omnidirectional Si3N4 waveguide for label-free spatial frequency shift super-resolution imaging. J. Phys. D Appl. Phys. 2021, 54, 315101. [Google Scholar] [CrossRef]
  60. Xu, X.; Liu, X.; Pang, C.; Ma, Y.; Meng, C.; Zhang, J.; Liu, X.; Yang, Q. Si3N4 waveguide platform for label-free super-resolution imaging: Simulation and analysis. J. Phys. D Appl. Phys. 2019, 52, 284002. [Google Scholar] [CrossRef]
  61. Helle, Ø.I.; Dullo, F.T.; Lahrberg, M.; Tinguely, J.-C.; Hellesø, O.G.; Ahluwalia, B.S. Structured illumination microscopy using a photonic chip. Nat. Photonics 2020, 14, 431–438. [Google Scholar] [CrossRef]
  62. Priyadarshi, A.; Dullo, F.T.; Wolfson, D.L.; Ahmad, A.; Jayakumar, N.; Dubey, V.; Tinguely, J.-C.; Ahluwalia, B.S.; Murugan, G.S. A transparent waveguide chip for versatile total internal reflection fluorescence-based microscopy and nanoscopy. Commun. Mater. 2021, 2, 85. [Google Scholar] [CrossRef]
  63. Diekmann, R.; Helle, Ø.I.; Øie, C.I.; McCourt, P.; Huser, T.R.; Schüttpelz, M.; Ahluwalia, B.S. Chip-based wide field-of-view nanoscopy. Nat. Photonics 2017, 11, 322–328. [Google Scholar] [CrossRef]
  64. Villegas-Hernández, L.E.; Dubey, V.; Nystad, M.; Tinguely, J.-C.; Coucheron, D.A.; Dullo, F.T.; Priyadarshi, A.; Acuña, S.; Ahmad, A.; Mateos, J.M.; et al. Chip-based multimodal super-resolution microscopy for histological investigations of cryopreserved tissue sections. Light Sci. Appl. 2022, 11, 43. [Google Scholar] [CrossRef]
  65. Jayakumar, N.; Dullo, F.T.; Dubey, V.; Ahmad, A.; Ströhl, F.; Cauzzo, J.; Guerreiro, E.M.; Snir, O.; Skalko-Basnet, N.; Agarwal, K.; et al. Multi-moded high-index contrast optical waveguide for super-contrast high-resolution label-free microscopy. Nanophotonics 2022, 11, 3421–3436. [Google Scholar] [CrossRef] [PubMed]
  66. Butola, A.; Coucheron, D.A.; Szafranska, K.; Ahmad, A.; Mao, H.; Tinguely, J.-C.; McCourt, P.; Senthilkumaran, P.; Mehta, D.S.; Agarwal, K.; et al. Multimodal on-chip nanoscopy and quantitative phase imaging reveals the nanoscale morphology of liver sinusoidal endothelial cells. Proc. Natl. Acad. Sci. USA 2021, 118, e2115323118. [Google Scholar] [CrossRef] [PubMed]
  67. Liu, X.; Tang, M.; Meng, C.; Pang, C.; Kuang, C.; Chen, W.; Kaminski, C.F.; Yang, Q.; Liu, X. Chip-compatible wide-field 3D nanoscopy through tunable spatial frequency shift effect. Sci. China Phys. Mech. Astron. 2021, 64, 294211. [Google Scholar] [CrossRef]
  68. Tang, M.; Han, Y.; Ye, D.; Zhang, Q.; Pang, C.; Liu, X.; Shen, W.; Ma, Y.; Kaminski, C.F.; Liu, X.; et al. High-Refractive-Index Chip with Periodically Fine-Tuning Gratings for Tunable Virtual-Wavevector Spatial Frequency Shift Universal Super-Resolution Imaging. Adv. Sci. 2022, 9, 2103835. [Google Scholar] [CrossRef] [PubMed]
  69. Barnes, W.L.; Dereux, A.; Ebbesen, T.W. Surface plasmon subwavelength optics. Nature 2003, 424, 824–830. [Google Scholar] [CrossRef] [PubMed]
  70. Wei, F.; Liu, Z. Plasmonic Structured Illumination Microscopy. Nano Lett. 2010, 10, 2531–2536. [Google Scholar] [CrossRef] [PubMed]
  71. Tan, P.S.; Yuan, X.-C.; Yuan, G.H.; Wang, Q. High-resolution wide-field standing-wave surface plasmon resonance fluorescence microscopy with optical vortices. Appl. Phys. Lett. 2010, 97, 241109. [Google Scholar] [CrossRef]
  72. Wang, Q.; Bu, J.; Tan, P.S.; Yuan, G.H.; Teng, J.H.; Wang, H.; Yuan, X.C. Subwavelength-Sized Plasmonic Structures for Wide-Field Optical Microscopic Imaging with Super-Resolution. Plasmonics 2012, 7, 427–433. [Google Scholar] [CrossRef]
  73. Wei, F.; Lu, D.; Shen, H.; Wan, W.; Ponsetto, J.L.; Huang, E.; Liu, Z. Wide field super-resolution surface imaging through plasmonic structured illumination microscopy. Nano Lett. 2014, 14, 4634–4639. [Google Scholar] [CrossRef]
  74. Ponsetto, J.L.; Bezryadina, A.; Wei, F.; Onishi, K.; Shen, H.; Huang, E.; Ferrari, L.; Ma, Q.; Zou, Y.; Liu, Z. Experimental Demonstration of Localized Plasmonic Structured Illumination Microscopy. ACS Nano 2017, 11, 5344–5350. [Google Scholar] [CrossRef]
  75. Ponsetto, J.L.; Wei, F.F.; Liu, Z.W. Localized plasmon assisted structured illumination microscopy for wide-field high-speed dispersion-independent super resolution imaging. Nanoscale 2014, 6, 5807–5812. [Google Scholar] [CrossRef] [PubMed]
  76. Bezryadina, A.; Zhao, J.; Xia, Y.; Lee, Y.U.; Zhang, X.; Liu, Z. Localized plasmonic structured illumination microscopy with gaps in spatial frequencies. Opt. Lett. 2019, 44, 2915–2918. [Google Scholar] [CrossRef]
  77. Bezryadina, A.; Zhao, J.X.; Xia, Y.; Zhang, X.; Liu, Z.W. High Spatiotemporal Resolution Imaging with Localized Plasmonic Structured Illumination Microscopy. ACS Nano 2018, 12, 8248–8254. [Google Scholar] [CrossRef] [PubMed]
  78. Labeyrie, A. Attainment of diffraction limited resolution in large telescopes by Fourier analysing speckle patterns in star images. Astron. Astrophys. 1970, 6, 85. [Google Scholar]
  79. García, J.; Zalevsky, Z.; Fixler, D. Synthetic aperture superresolution by speckle pattern projection. Opt. Express 2005, 13, 6073–6078. [Google Scholar] [CrossRef]
  80. van Putten, E.G.; Akbulut, D.; Bertolotti, J.; Vos, W.L.; Lagendijk, A.; Mosk, A.P. Scattering Lens Resolves Sub-100 nm Structures with Visible Light. Phys. Rev. Lett. 2011, 106, 193905. [Google Scholar] [CrossRef]
  81. Vellekoop, I.M.; Lagendijk, A.; Mosk, A.P. Exploiting disorder for perfect focusing. Nat. Photonics 2010, 4, 320–322. [Google Scholar] [CrossRef]
  82. Lee, Y.U.; Zhao, J.; Ma, Q.; Khorashad, L.K.; Posner, C.; Li, G.; Wisna, G.B.M.; Burns, Z.; Zhang, J.; Liu, Z. Metamaterial assisted illumination nanoscopy via random super-resolution speckles. Nat. Commun. 2021, 12, 1559. [Google Scholar] [CrossRef] [PubMed]
  83. Lee, Y.U.; Li, S.; Wisna, G.B.M.; Zhao, J.; Zeng, Y.; Tao, A.R.; Liu, Z. Hyperbolic material enhanced scattering nanoscopy for label-free super-resolution imaging. Nat. Commun. 2022, 13, 6631. [Google Scholar] [CrossRef]
  84. Lee, Y.U.; Nie, Z.; Li, S.; Lambert, C.-H.; Zhao, J.; Yang, F.; Wisna, G.B.M.; Yang, S.; Zhang, X.; Liu, Z. Ultrathin Layered Hyperbolic Metamaterial-Assisted Illumination Nanoscopy. Nano Lett. 2022, 22, 5916–5921. [Google Scholar] [CrossRef]
  85. Wood, B.; Pendry, J.B.; Tsai, D.P. Directed subwavelength imaging using a layered metal-dielectric system. Phys. Rev. B 2006, 74, 115116. [Google Scholar] [CrossRef]
  86. Lee, Y.U.; Posner, C.; Nie, Z.; Zhao, J.; Li, S.; Bopp, S.E.; Wisna, G.B.M.; Ha, J.; Song, C.; Zhang, J.; et al. Organic Hyperbolic Material Assisted Illumination Nanoscopy. Adv. Sci. 2021, 8, 2102230. [Google Scholar] [CrossRef] [PubMed]
  87. Shah, Z.H.; Müller, M.; Wang, T.-C.; Scheidig, P.M.; Schneider, A.; Schüttpelz, M.; Huser, T.; Schenck, W. Deep-learning based denoising and reconstruction of super-resolution structured illumination microscopy images. Photon. Res. 2021, 9, B168–B181. [Google Scholar] [CrossRef]
  88. Qiao, C.; Li, D.; Liu, Y.; Zhang, S.; Liu, K.; Liu, C.; Guo, Y.; Jiang, T.; Fang, C.; Li, N.; et al. Rationalized deep learning super-resolution microscopy for sustained live imaging of rapid subcellular processes. Nat. Biotechnol. 2023, 41, 367–377. [Google Scholar] [CrossRef]
  89. Jin, L.; Liu, B.; Zhao, F.; Hahn, S.; Dong, B.; Song, R.; Elston, T.C.; Xu, Y.; Hahn, K.M. Deep learning enables structured illumination microscopy with low light levels and enhanced speed. Nat. Commun. 2020, 11, 1934. [Google Scholar] [CrossRef] [PubMed]
  90. Ouyang, W.; Aristov, A.; Lelek, M.; Hao, X.; Zimmer, C. Deep learning massively accelerates super-resolution localization microscopy. Nat. Biotechnol. 2018, 36, 460–468. [Google Scholar] [CrossRef]
  91. Christensen, C.N.; Ward, E.N.; Lu, M.; Lio, P.; Kaminski, C.F. ML-SIM: Universal reconstruction of structured illumination microscopy images using transfer learning. Biomed. Opt. Express 2021, 12, 2720–2733. [Google Scholar] [CrossRef] [PubMed]
  92. Zhang, Q.; Liang, C.; Tang, M.; Yang, X.; Lin, M.; Han, Y.; Liu, X.; Yang, Q. Alternative deep learning method for fast spatial-frequency shift imaging microscopy. Opt. Exp. 2023, 31, 3719–3730. [Google Scholar] [CrossRef]
  93. Wu, H.; Li, Y.; Sun, Y.; Yin, L.; Sun, W.; Ye, Z.; Yang, X.; Zhu, H.; Tang, M.; Han, Y.; et al. Single-frame structured illumination microscopy for fast live-cell imaging. APL Photonics 2024, 9, 036102. [Google Scholar] [CrossRef]
  94. Tang, M.; Han, Y.; Jia, D.; Yang, Q.; Cheng, J.-X. Far-field super-resolution chemical microscopy. Light Sci. Appl. 2023, 12, 137. [Google Scholar] [CrossRef]
  95. Liu, X.; Tang, M.; Zhou, N.; Pang, C.; Wen, Z.; Liu, X.; Yang, Q. 3D orientation super-resolution spatial-frequency-shift microscopy. arXiv 2024, arXiv:2401.09085. [Google Scholar]
  96. Kuai, Y.; Xie, Z.; Chen, J.; Gui, H.; Xu, L.; Kuang, C.; Wang, P.; Liu, X.; Liu, J.; Lakowicz, J.R.; et al. Real-Time Measurement of the Hygroscopic Growth Dynamics of Single Aerosol Nanoparticles with Bloch Surface Wave Microscopy. ACS Nano 2020, 14, 9136–9144. [Google Scholar] [CrossRef] [PubMed]
  97. Kuai, Y.; Chen, J.; Tang, X.; Xiang, Y.; Lu, F.; Kuang, C.; Xu, L.; Shen, W.; Cheng, J.; Gui, H.; et al. Label-free surface-sensitive photonic microscopy with high spatial resolution using azimuthal rotation illumination. Sci. Adv. 2019, 5, eaav5335. [Google Scholar] [CrossRef] [PubMed]
Figure 1. Schematic diagram of conventional microscopy and super-resolution microscopy using evanescent illumination. (a) Simplified conventional microscopy with limited resolution; (b) Schematic diagram of super-resolution imaging by determined k-vector evanescent illumination. (c) Schematic diagram of super-resolution imaging by random k-vector evanescent speckle illumination. f c is the cutoff spatial frequency, f h and f e are the shifting magnitude of spatial frequency provided by transmission illumination and evanescent illumination, respectively.
Photonics 11 00528 g001
Figure 2. SFS SR imaging by total internal reflection. (a) Schematic diagram of label-free SR imaging via total internal reflection. (b) Results of label-free SR imaging in theory and experiment. Reproduced with permission from [42] Copyright 2013 The Optical Society. (c) Schematic diagram of fluorescent-labeled SR imaging via total internal reflection. (d) From left to right are TIRF images, transverse SR images, and 3D volumetric SR images of microtubules and peroxisomes, respectively. Reproduced with permission from ref. [57]. Copyright 2018 Springer Nature.
Photonics 11 00528 g002
Figure 3. Tunable spatial frequency shift SR in waveguide. (a) Schematic diagram of controlling the direction and k-vector of EW illumination in waveguide via wavelength control; (b) Schematic diagram of achieving modulation of spatial-frequency-shift via wavelength control; (c,d) SEM image and SFS image of a “ZJU” pattern. Reproduced with permission from ref. [43] Copyright 2017 Springer Nature. (eh) SEM image, wide-field image, SFS image and reconstructed SR image via wavelength control. Reproduced with permission from ref. [58] Copyright 2019 Wiley.
Photonics 11 00528 g003
Figure 4. Modulation of evanescent structured illumination in waveguide. (a) Schematic diagram of two-dimensional SIM on a photonics chip; (b) Three waveguide pairs interfere at different rotational angles (pseudo-color); (c) Filtered diffraction-limited image and cSIM image of the actin filaments. Reproduced with permission from ref. [61] Copyright 2020 Springer Nature. (d,e) Schematic diagram of further resolution enhancement by STUN. (f) Comparison of a SIM image and a STUN image. Reproduced with permission from ref. [67] Copyright 2021 Springer Nature.
Photonics 11 00528 g004
Figure 5. Schematic of chip-based TVSFS super-resolution imaging. (a) Schematic illustration of chip-based TVSFS super-resolution imaging. Top right: Gap in the Fourier space obtained with high-refractive-index materials, explaining the necessity for multilevel tuning for SFS imaging, k c and k s are the cutoff and SFS k-vectors; (b) Single-beam illumination for label-free imaging and double-beam illumination for fluorescent labeled imaging; (c) Wide field resolution-limited label-free image and TVSFS SR label-free image; (d) Wide field resolution-limited labeled image and TVSFS SR labeled image. Reproduced with permission from ref. [68] Copyright 2022 Wiley.
Photonics 11 00528 g005
Figure 6. SR microscopy via SPP illumination. (a) Schematic diagram of grating excitation method for PSIM; (b) The direction of the interference pattern is controlled by polarization angle of the incident light; Reproduced with permission from ref. [72] Copyright 2012 Springer Nature. (c) Schematic diagram of edge excitation method for PSIM; (d) SEM image of substrate edge; (eg) Schematic diagram of shifting the interference pattern by incident angle. Reproduced with permission from ref. [73] Copyright 2014 American Chemical Society.
Photonics 11 00528 g006
Figure 7. SR microscopy via LP illumination. (a) Schematic diagram of LPSIM; (b) Spatial frequency scheme of LPSIM; (c,d) Diffraction-limited and LPSIM images of a pair of 50 nm fluorescent beads; (e) Normalized intensity profiles of the images in (d); (f) Spatial frequency spectra of LPSIM in (d). Reproduced with permission from ref. [74] Copyright 2017 American Chemical Society.
Photonics 11 00528 g007
Figure 8. SR microscopy using waveguide speckle illumination. (a) Schematic diagram of SCORE; (b) Comparison of conventional image and SCORE image. Reproduced with permission from ref. [49] Copyright 2015 The Optical Society.
Photonics 11 00528 g008
Figure 9. SR imaging using surface plasmon polaritons speckle illumination. (a) Schematic diagram of speckle-MAIN; (b) HMM coated substrate projects ultra-fine structured speckles onto objects lying on its top surface; (c) High k-vector can be generated by HMM; (d) TEM image of HMM; (e,f) Reconstructed image by speckle-MAIN and SEM image of two beads. (g) Normalized intensity cross-section (red curves) of image (d) along indicated direction. Black curves show the corresponding intensity cross-section of conventional wide-field image. Reproduced with permission from ref. [82] Copyright 2021 Springer Nature.
Photonics 11 00528 g009
Figure 10. Label-free SR imaging via HMM. (ac) Schematic of the HMES nanoscopy; (d,e) Scanning electron microscope (SEM) images of test objects, i.e., polystyrene beads (refractive index n = 1.6, radius r = 40 nm) in (d) and back scatters, i.e., Ag nanoparticles in (e). (f) Averaged partial scattering images, SR label-free scattering images, overlay images of the HMES images and SEM images and SEM images. Scale bar: 100 nm. Reproduced with permission from ref. [83] Copyright 2022 Springer Nature.
Photonics 11 00528 g010
Disclaimer/Publisher’s Note: The statements, opinions and data contained in all publications are solely those of the individual author(s) and contributor(s) and not of MDPI and/or the editor(s). MDPI and/or the editor(s) disclaim responsibility for any injury to people or property resulting from any ideas, methods, instructions or products referred to in the content.