1. Introduction
A plastic scintillation optical fiber (PSOF) comprises a core constructed from a thin plastic scintillator, with diameters ranging from hundreds to thousands of micrometers. The core interacts with radiation, emitting scintillation light that is transmitted to both ends via total internal reflection. A notable advantage of the PSOF is its expanded contact area with measurement objects, which surpasses that of conventional cylindrical scintillators [
1]. Consequently, PSOF detectors have been utilized extensively for the localization and quantification of radiation sources across various contaminated areas and for monitoring radiation in liquid environments. Following the Fukushima Daiichi Nuclear Power Plant (FDNPP) accident, the Japan Atomic Energy Agency (JAEA) used a PSOF detector in field studies to evaluate surface contamination in forest areas and to determine radiocesium levels in sediments from Fukushima’s irrigation ponds [
2,
3,
4]. Additionally, in February 2020, the Tokyo Electric Power Company (TEPCO) implemented a PSOF detector in the FDNPP drainage system to monitor
90Sr, commencing operations [
5]. The PSOF detector can be used to monitor daughter nuclides of
238U for process control in mining operations and to assess tritium levels for onsite monitoring in rivers adjacent to nuclear facilities [
6,
7,
8].
Moreover, a PSOF detector offers several benefits, including outstanding flexibility, suitability for extended-length installations, cost-effectiveness, excellent water resistance, and immunity to electromagnetic interference [
9]. It is proficient in determining the position and dosage of gamma radiation sources [
10,
11]. Despite active research on nuclide identification through the analysis of energy spectra from plastic scintillators, the specific energy spectrum for each gamma nuclide measured by the PSOF remains undocumented [
12,
13,
14].
A drawback of plastic scintillators is the absence of a clear full-energy absorption peak (FEP) in energy spectra, which results from their low atomic number and density [
15]. Consequently, energy calibration in plastic scintillators primarily relies on the Compton edge (CE) energy, which is precisely determined for each gamma energy by Compton kinematics. In these spectra, the Compton maximum (CM), which is slightly lower in energy than the CE, is typically observed as a peak due to the energy-broadening effect. Energy calibration commonly employs the relationship between the CM and CE [
16,
17,
18]. However, in the PSOF’s measured pulse-height spectrum, the CM is indiscernible due to substantial energy broadening, necessitating an alternative approach to calibration.
The Compton continuum in the pulse-height spectrum of the scintillator approximates a Gaussian convolution of the Fermi–Dirac distribution function. Utilizing the first-derivative method, the channel corresponding to the CE can be identified by locating the local minimum in the first derivative of the spectrum [
19,
20,
21,
22]. Due to noise amplification by the derivative process, denoising and smoothing techniques can be applied to the spectra to mitigate these effects. In this study, a single-stranded PSOF detector with a length of 10 m and a diameter of 2 mm was constructed. Given the low light yield and significant Gaussian energy-broadening (GEB) effect characteristic of the PSOF, a high-amplification, low-noise, charge-sensitive amplifier was employed for energy calibration. This calibration involved using the first-derivative method to derive the energy spectrum for gamma nuclides. Additionally, the attenuation coefficient of the PSOF was determined by identifying the CE channel at each gamma nuclide position.
2. Materials and Methods
In this study, the PSOF detector system comprised a PSOF (SCSF-78, Kuraray, Tokyo, Japan), a PMT (H6533, Hamamatsu Photonics, Shizuoka, Japan), a charge-sensitive amplifier (CR-110, Cremat, Newton, MA, USA), and a multichannel analyzer (MCA, K102, Kromek, County Durham, UK). The PSOF diameter, set at 2 mm, was determined using the continuous slowing-down approximation (CSDA) range to ensure effective energy transfer from electrons produced through interactions with gamma nuclides. Over 98 wt% of the PSOF’s core material is polystyrene, which has a CSDA range of approximately 1.6 mm for a CE energy of
137Cs (477.3 keV) [
23,
24,
25], allowing for adequate measurement of the CE energy of
137Cs and other low-energy gamma nuclides.
Figure 1 shows the overall experimental setup.
The PSOF was encased in a light-tight, flexible black shrink tube (FP-301, 3M) and optically connected to the PMT window using a silicone rubber-based optical interface (EJ-560, Eljen Technology, Sweetwater, TX, USA). Measurements were conducted with three gamma nuclides (133Ba, 22Na, and 137Cs) positioned 1 m away from the PMT to record the pulse-height spectra. Additionally, the position of the 137Cs gamma-ray source was varied at 1 m intervals within a range of 1–5 m to capture pulse-height spectra at varying distances. These spectra were subjected to noise removal and smoothing, and the first derivative was applied to determine the CE channel as the local minimum. Energy calibration was then performed using the CE channel to convert the pulse-height spectrum of each nuclide into an energy spectrum. The attenuation coefficient of the PSOF was calculated based on the CE from the pulse-height spectrum at each source position.
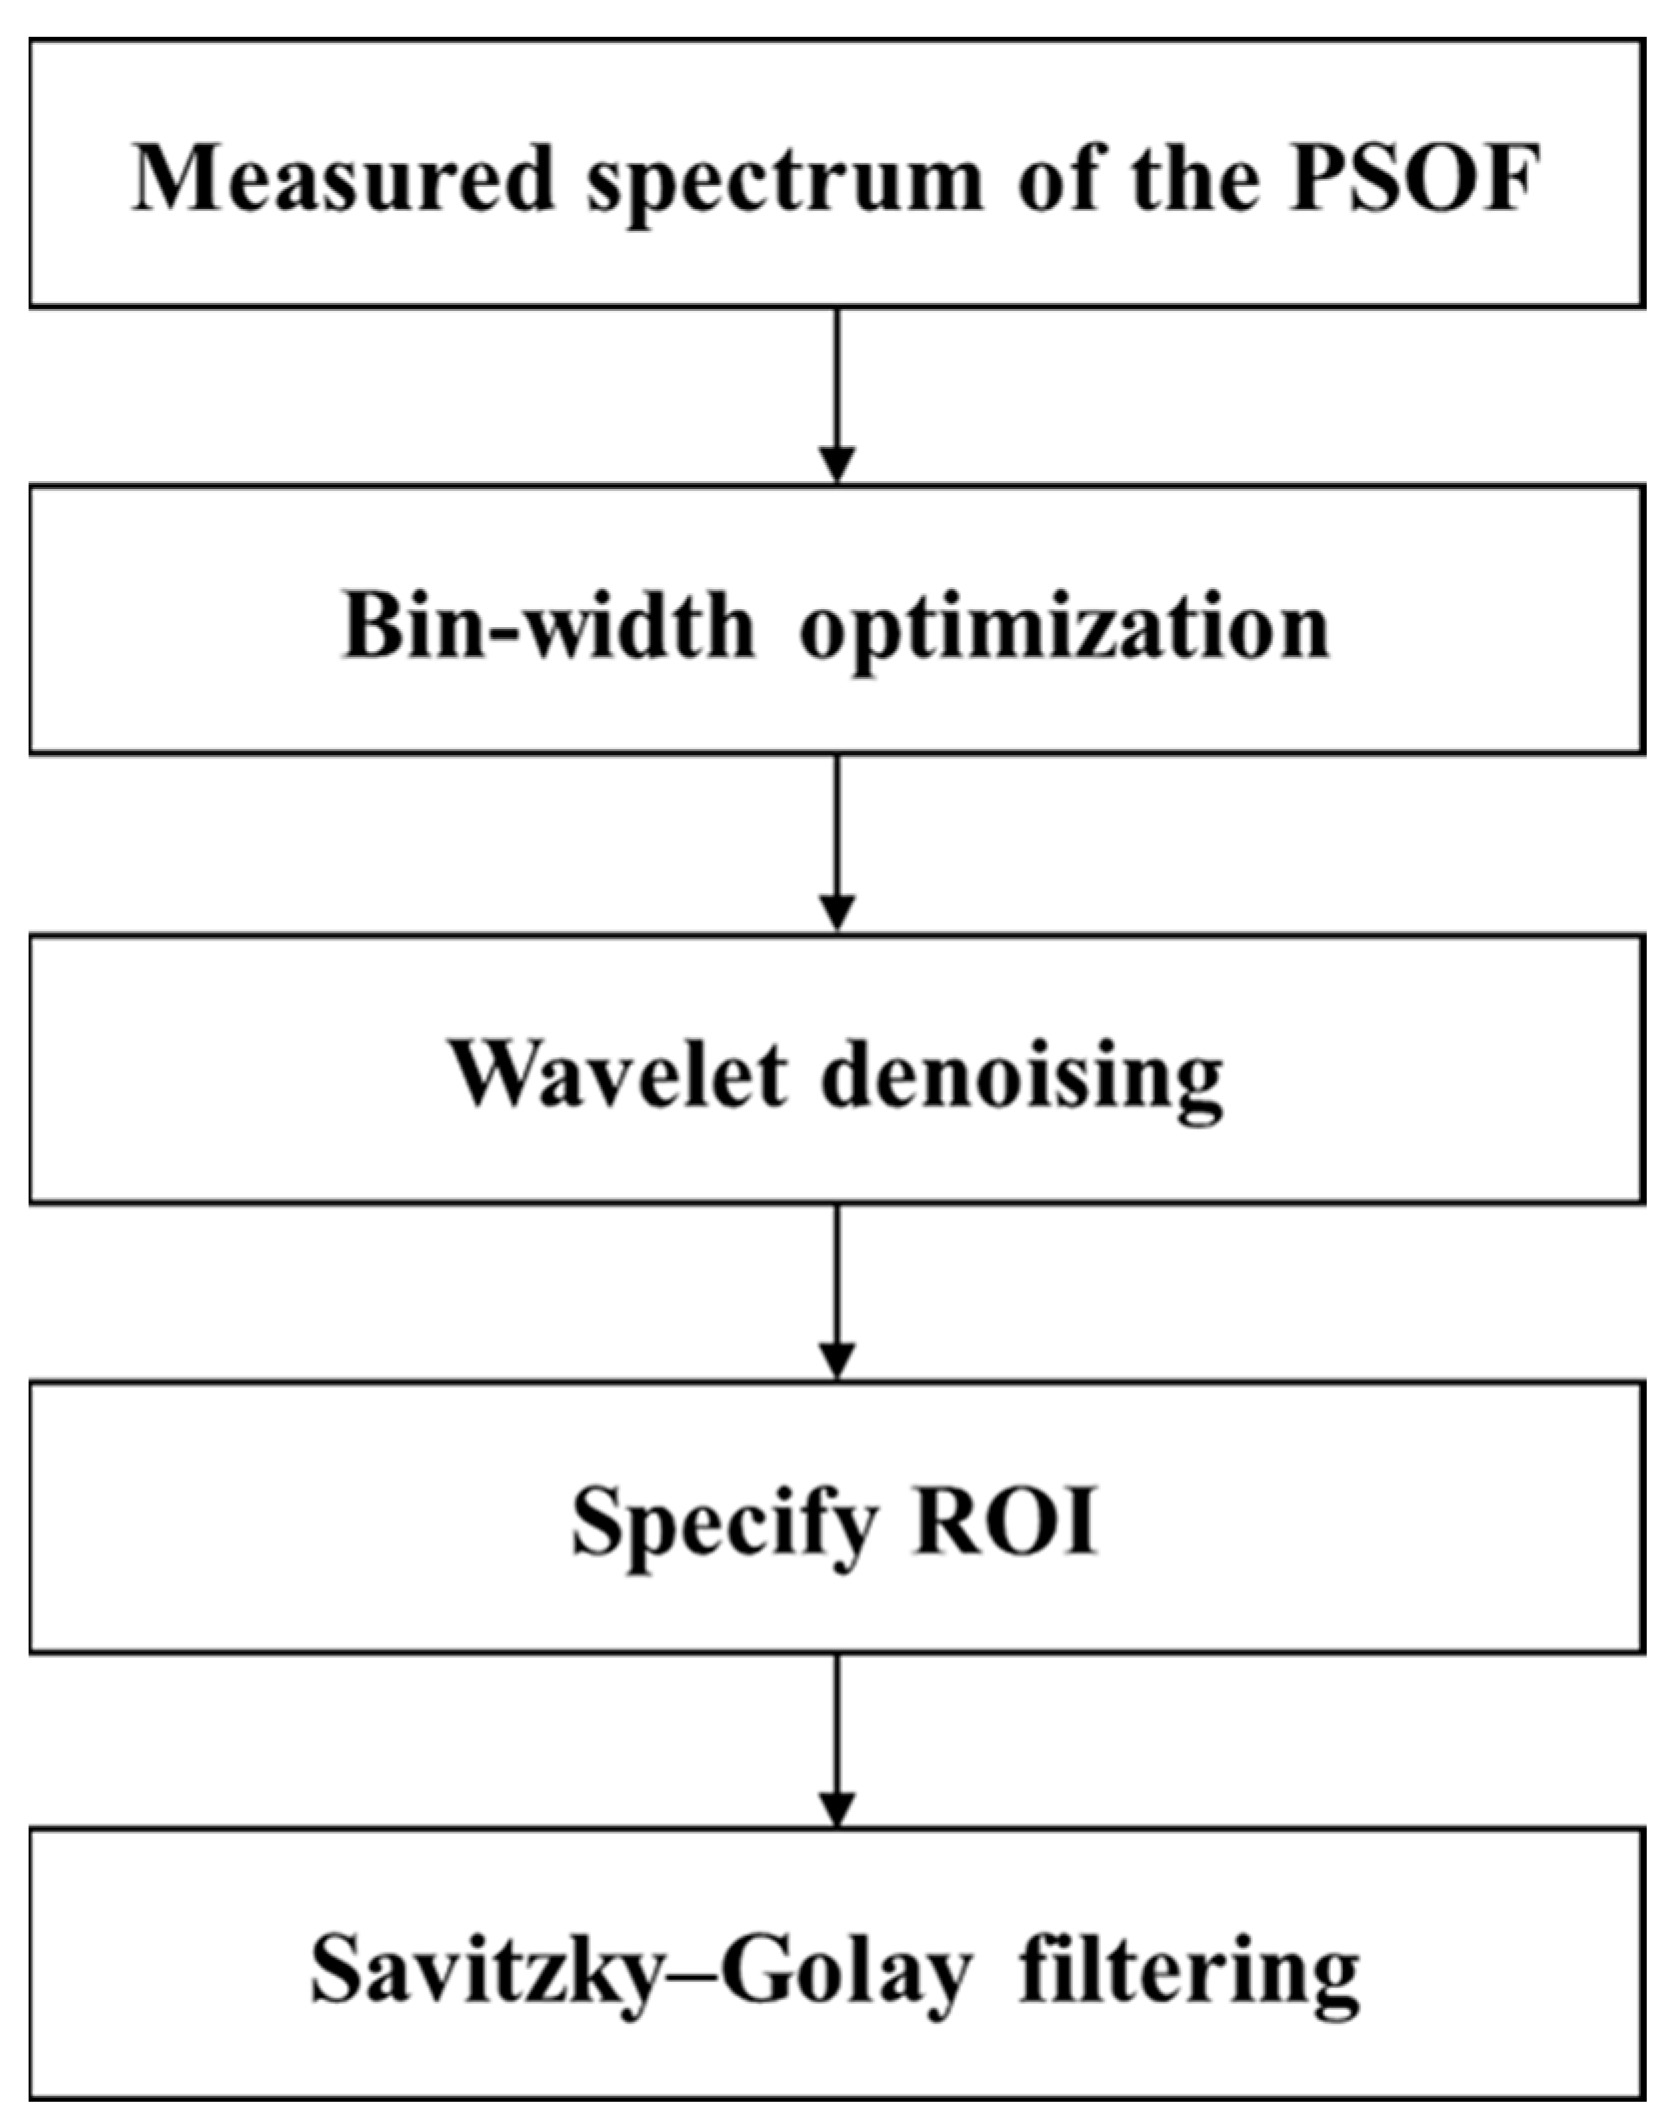
Figure 2 illustrates the process applied for denoising and smoothing the pulse-height spectrum. Initially, the bin width of the pulse-height spectrum was reduced to minimize spectrum oscillations. Noise within the spectrum was then eliminated using wavelet denoising with MATLAB’s “wdenoise” command. Following this, the region of interest (ROI) was established, avoiding the distortion of adjacent channels from edges due to threshold settings during spectrum measurement. The spectrum was subsequently smoothed using Savitzky–Golay filtering to further enhance data quality.
3. Results
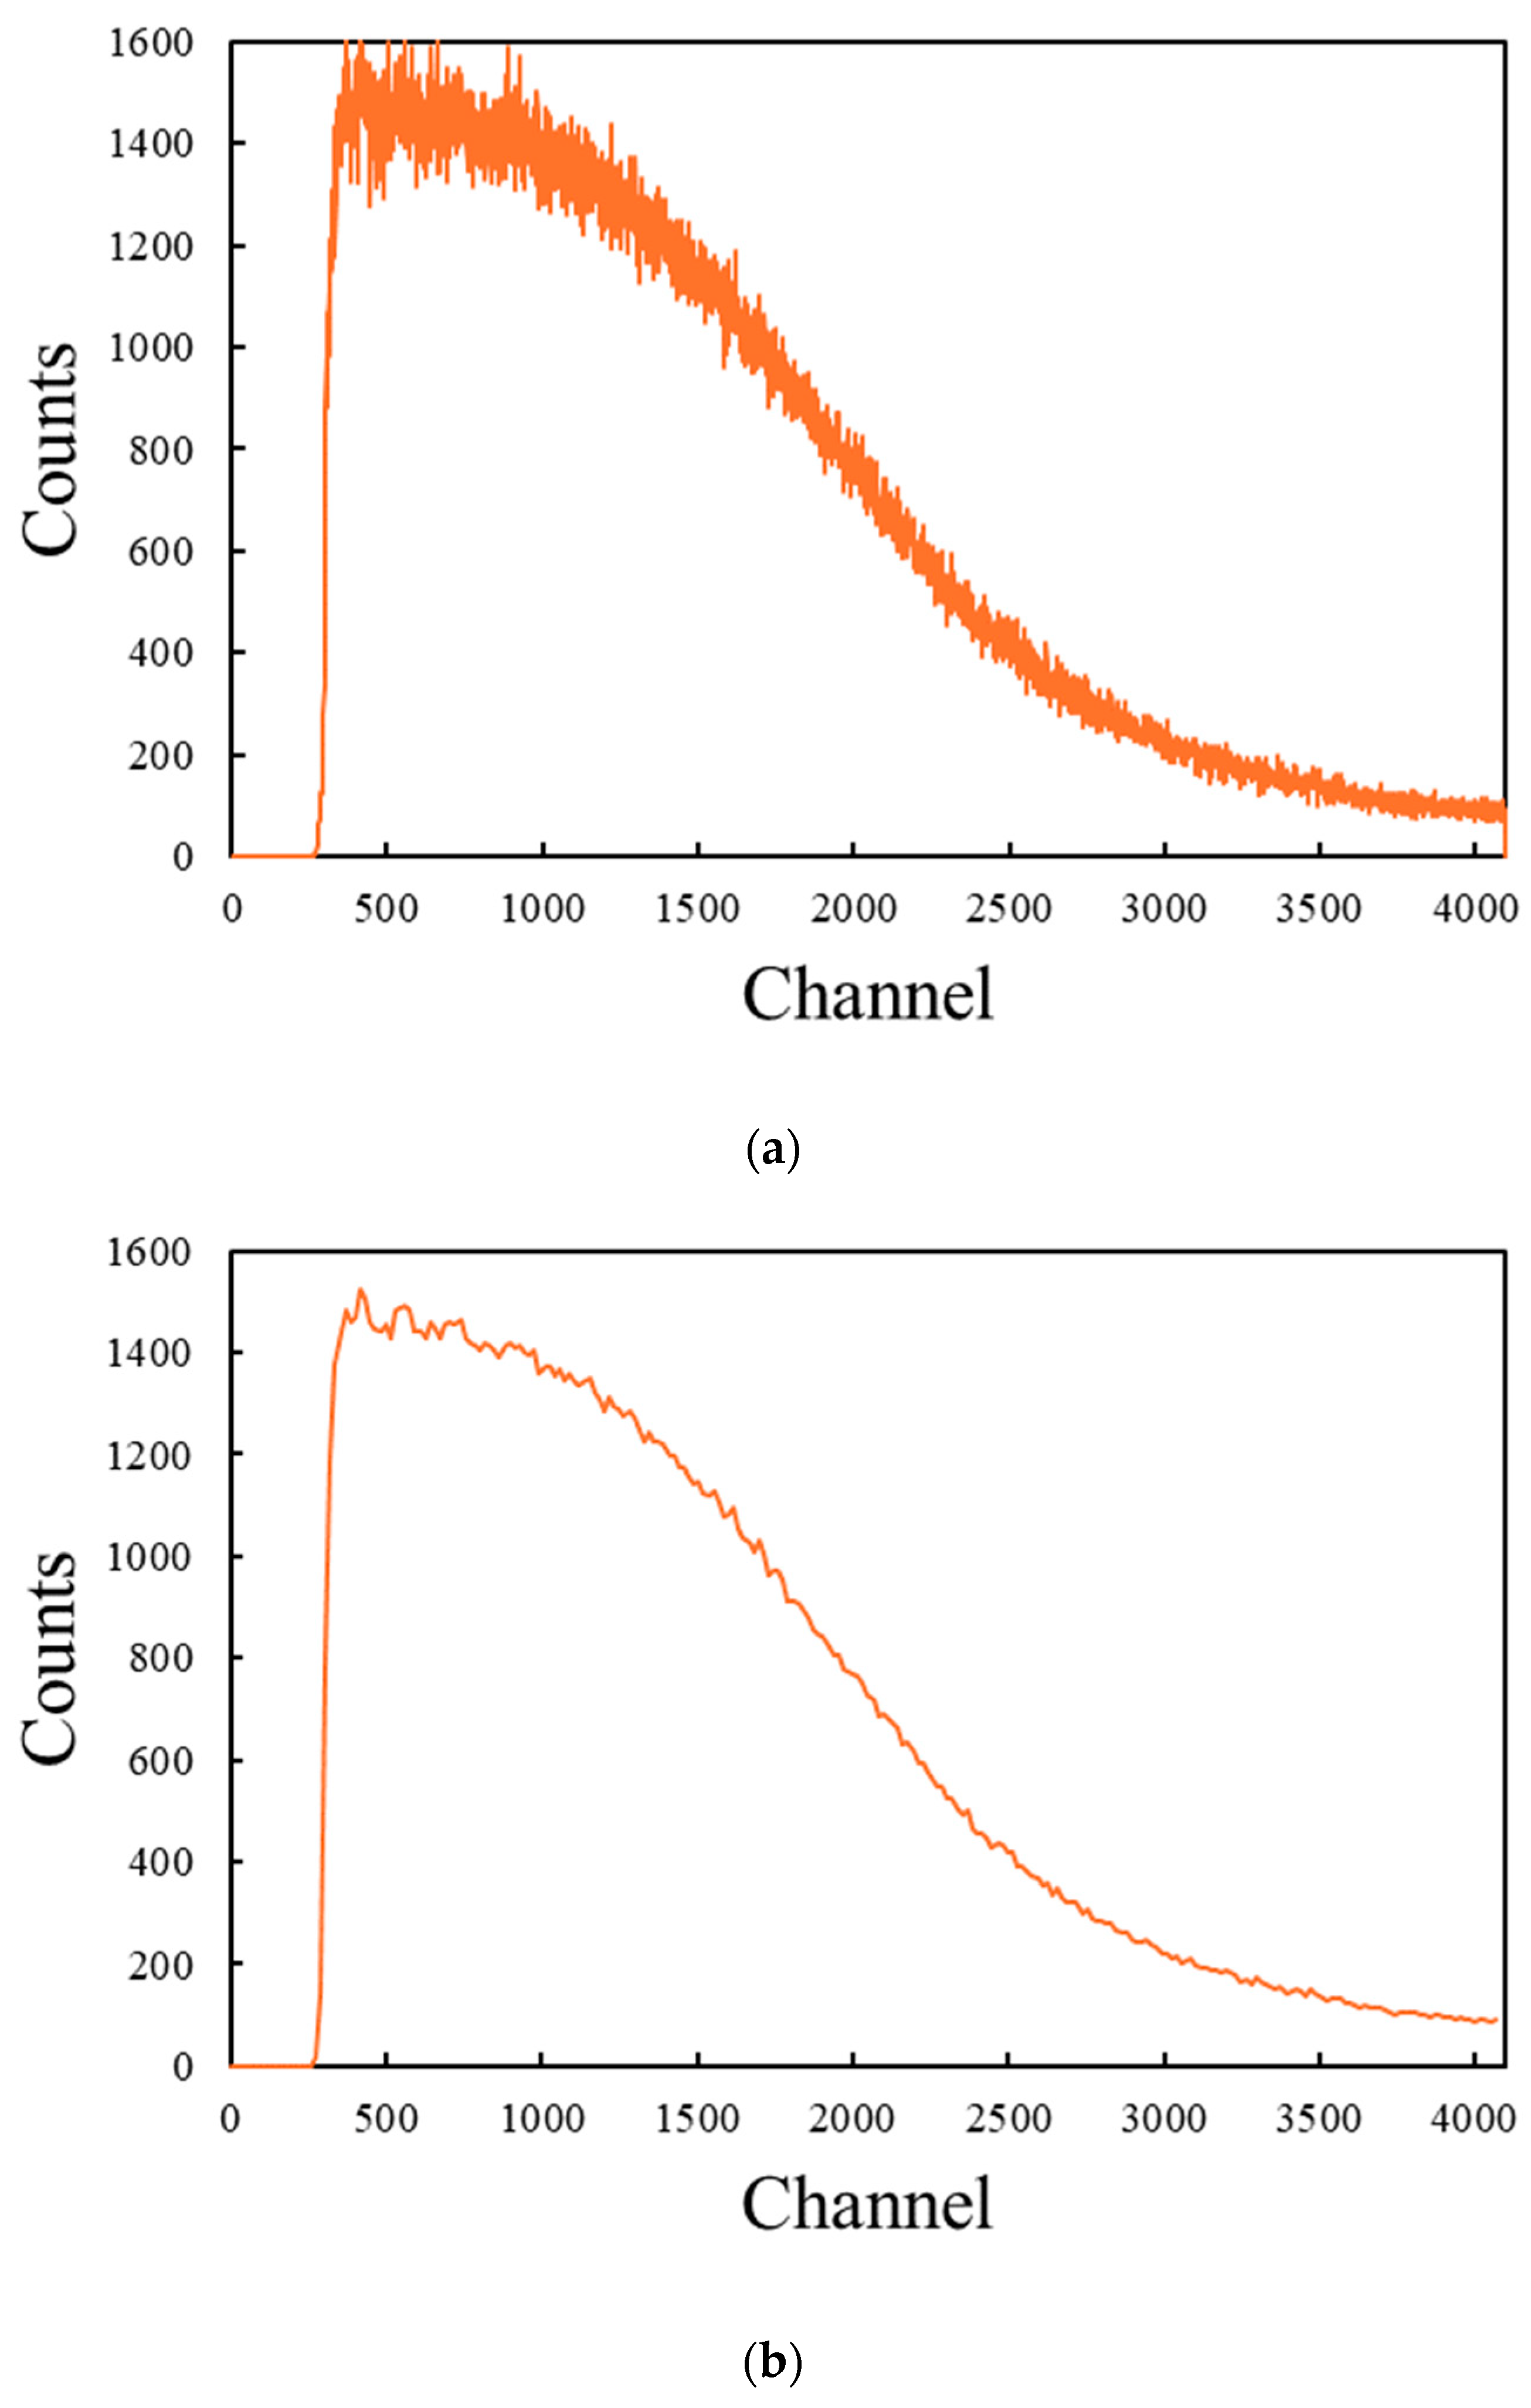
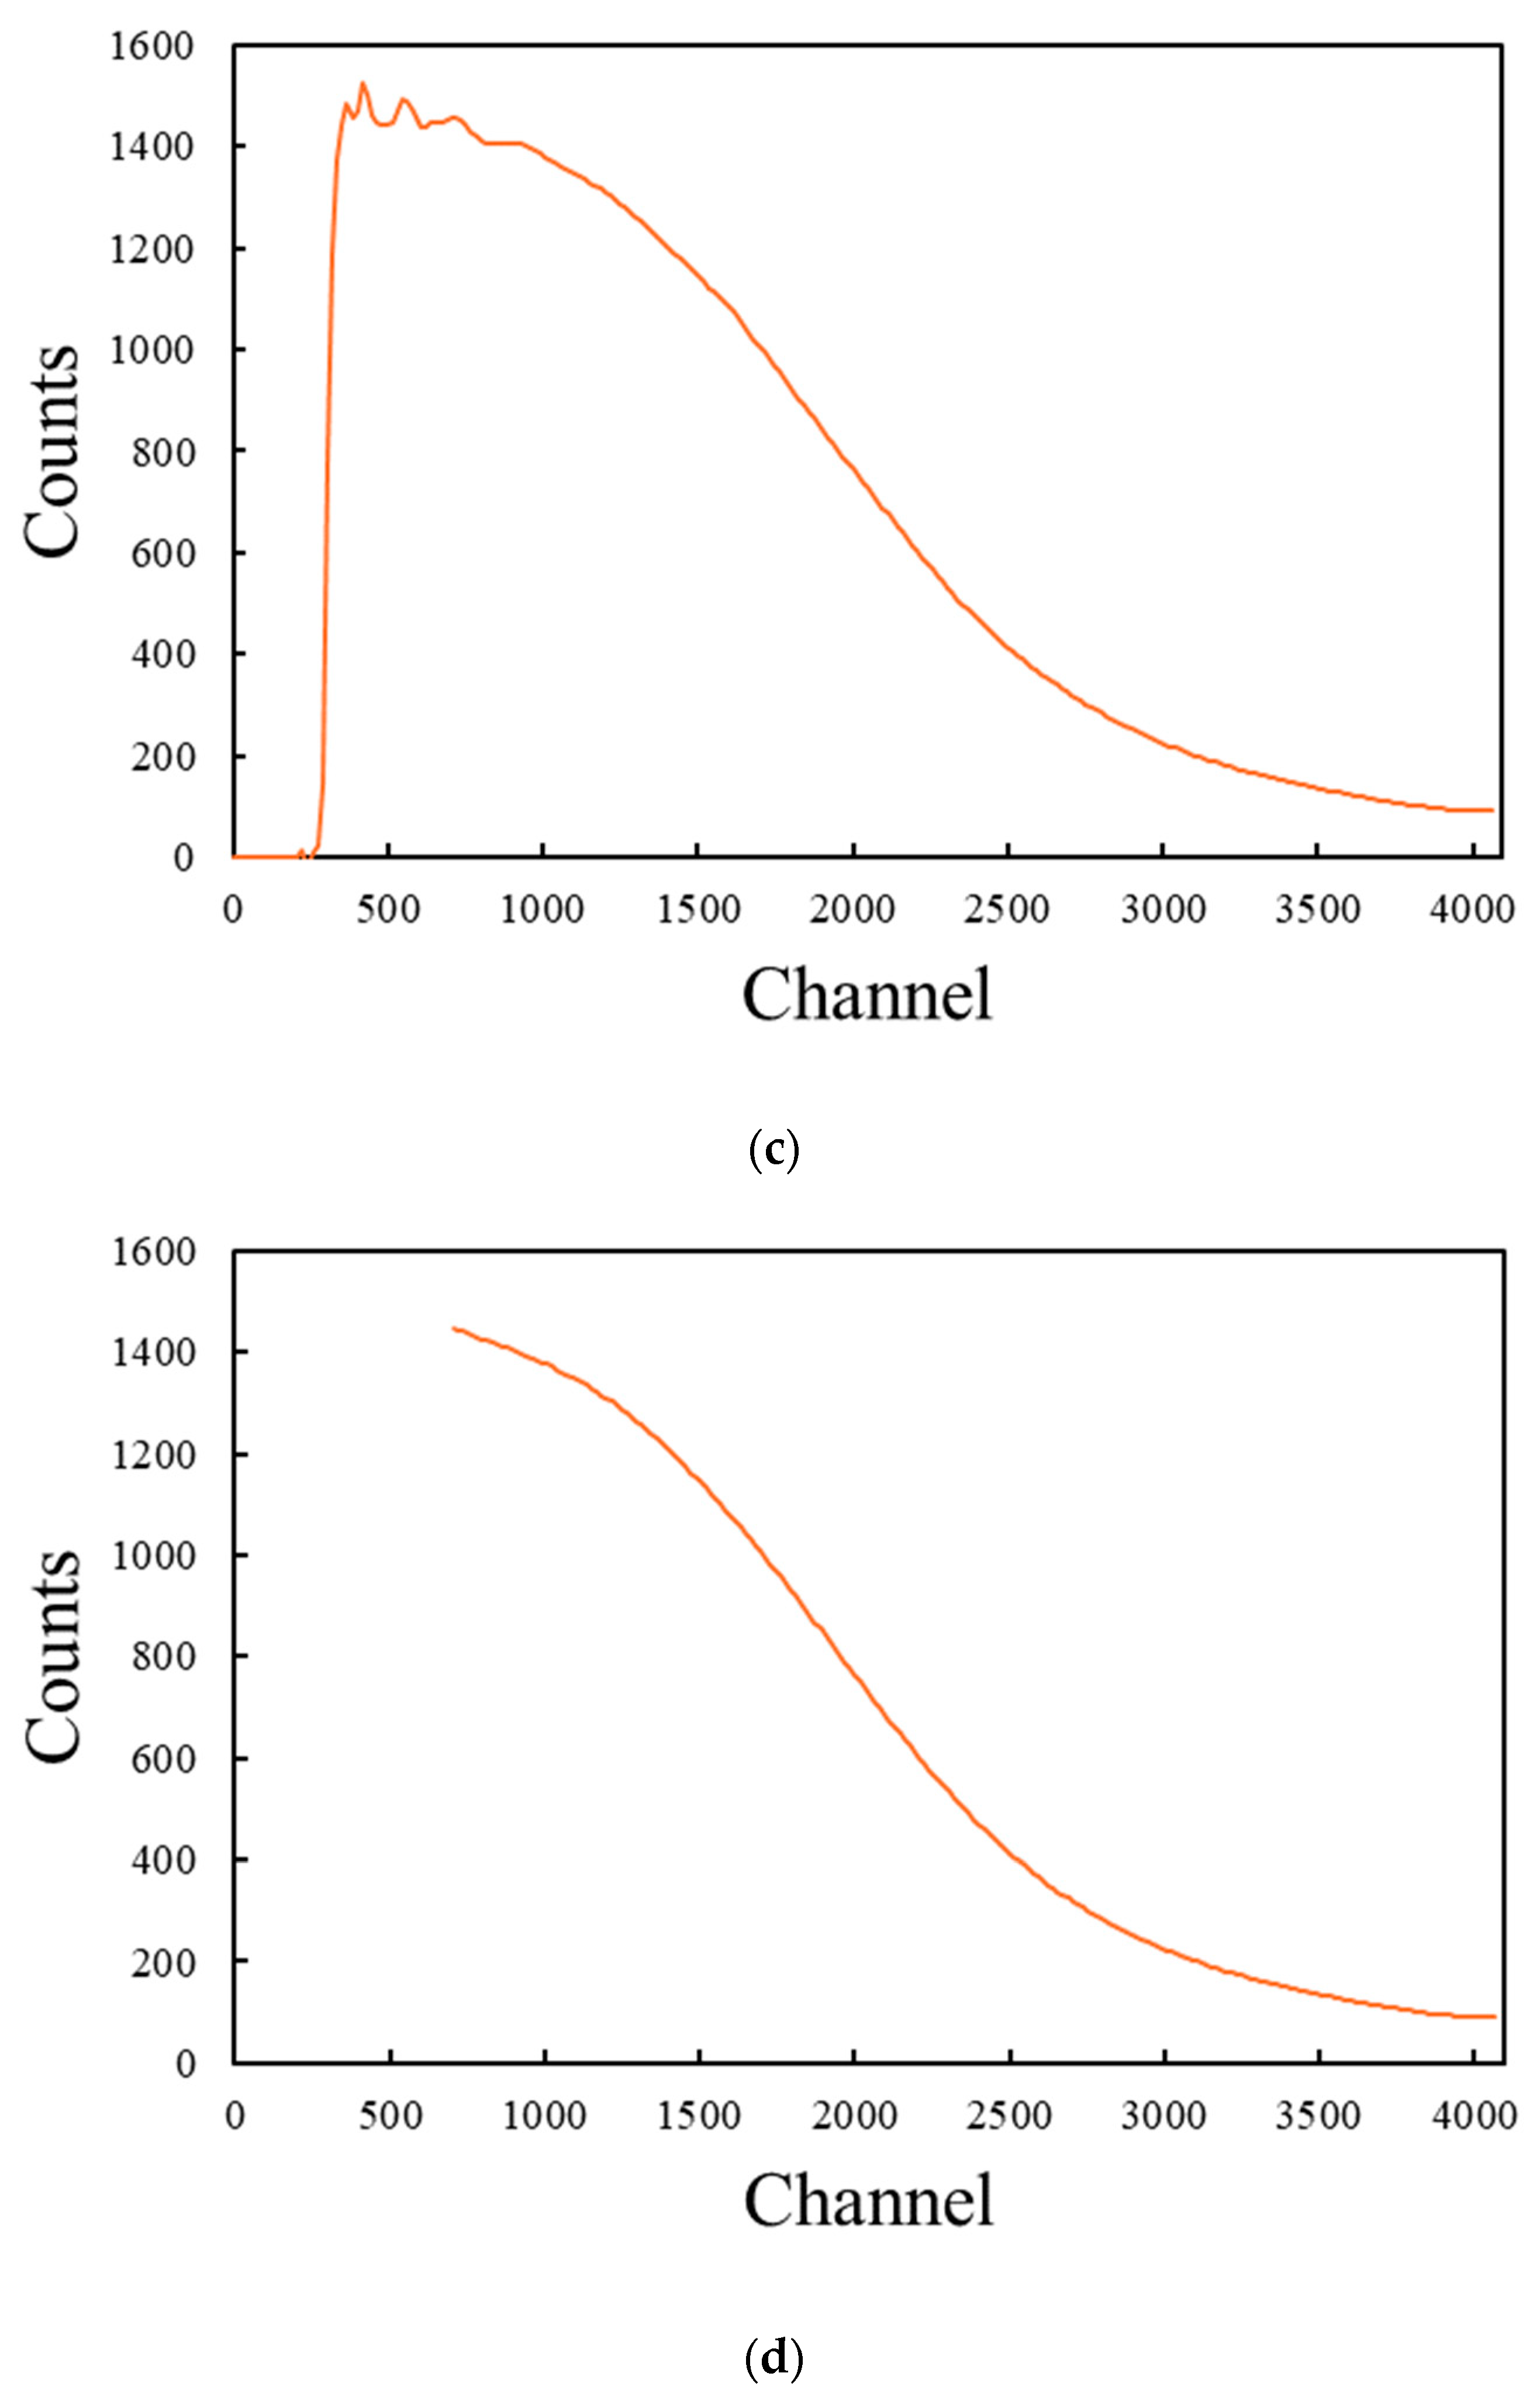
The pulse-height spectrum of the PSOF is devoid of the CM due to the pronounced GEB effect. Consequently, energy calibration of the PSOF necessitates using the CE channel, which is determined through the first-derivative method. This method, however, amplifies the noise present in the measured pulse-height spectrum, requiring the subsequent implementation of noise reduction and smoothing techniques. The full width at half maximum (FWHM) of the scintillator increases with rising energy levels. In particular, the pulse-height spectrum of the PSOF shows a decreasing coefficient value as the channel number increases, underscoring the significant impact of the GEB effect. To address local oscillations in the measured pulse-height spectrum, this study employed a sequence of bin-width optimization, wavelet denoising, and Savitzky–Golay filtering.
Figure 3 illustrates the spectrum at each stage of noise reduction and smoothing applied to the measured pulse-height spectrum.
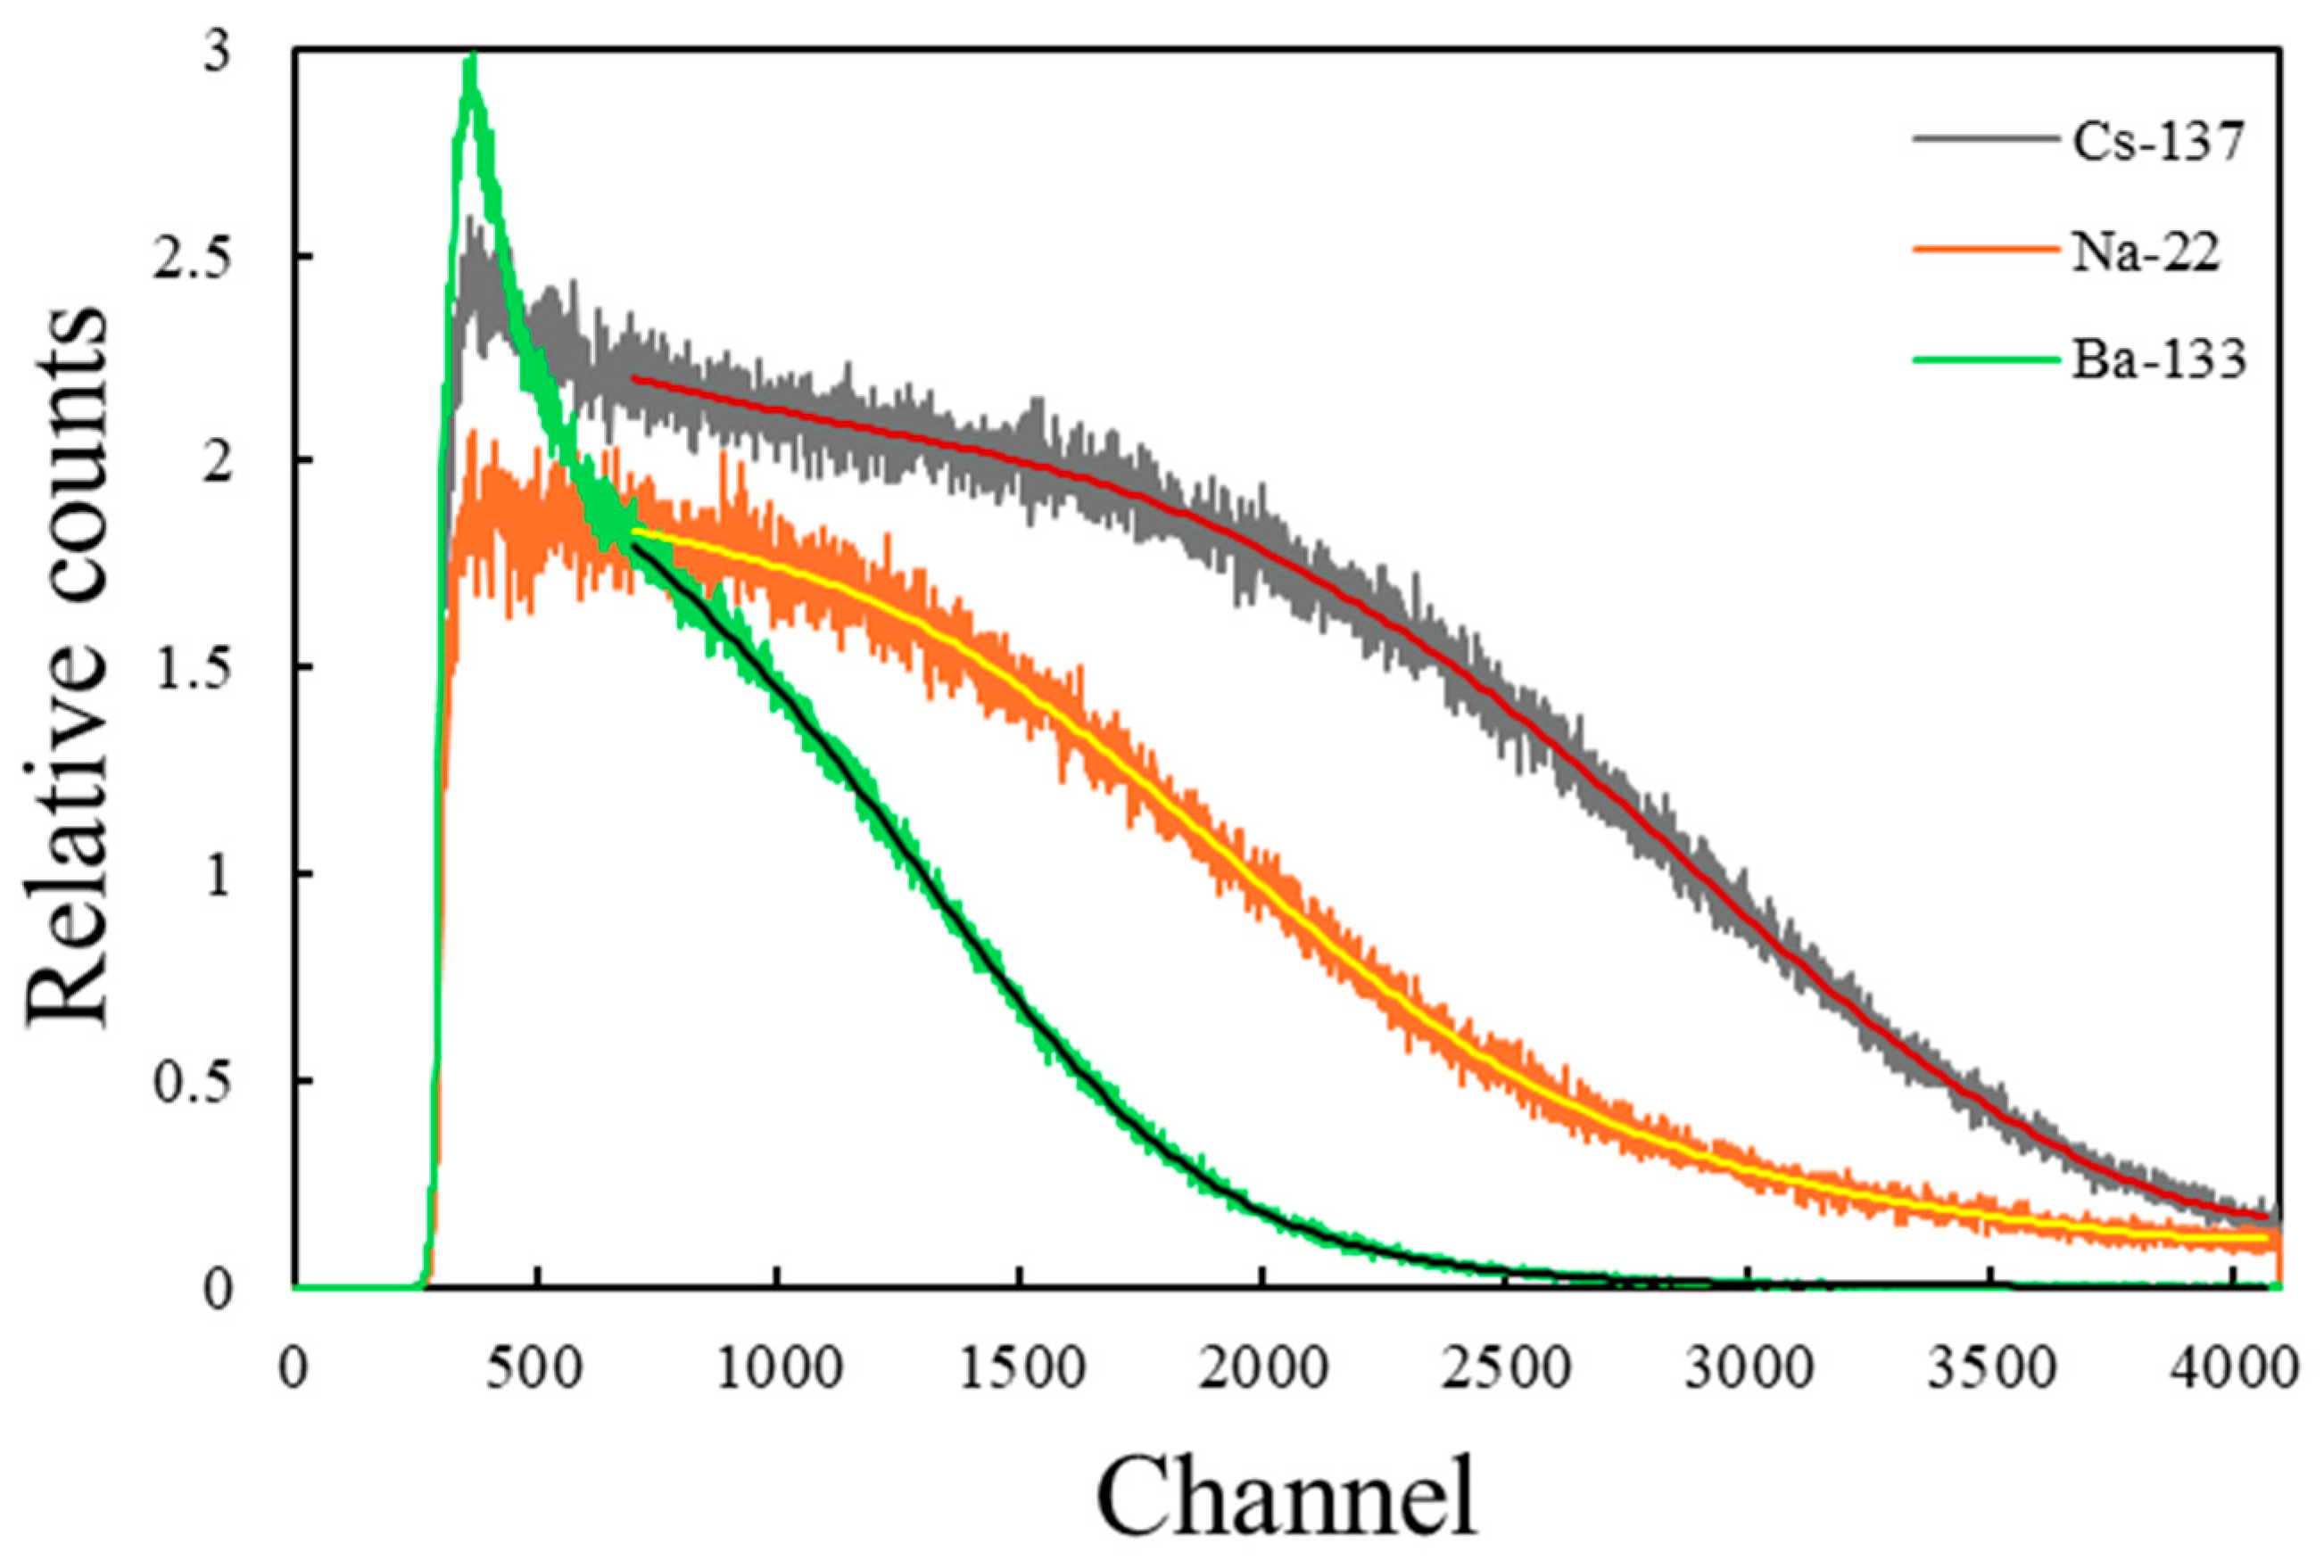
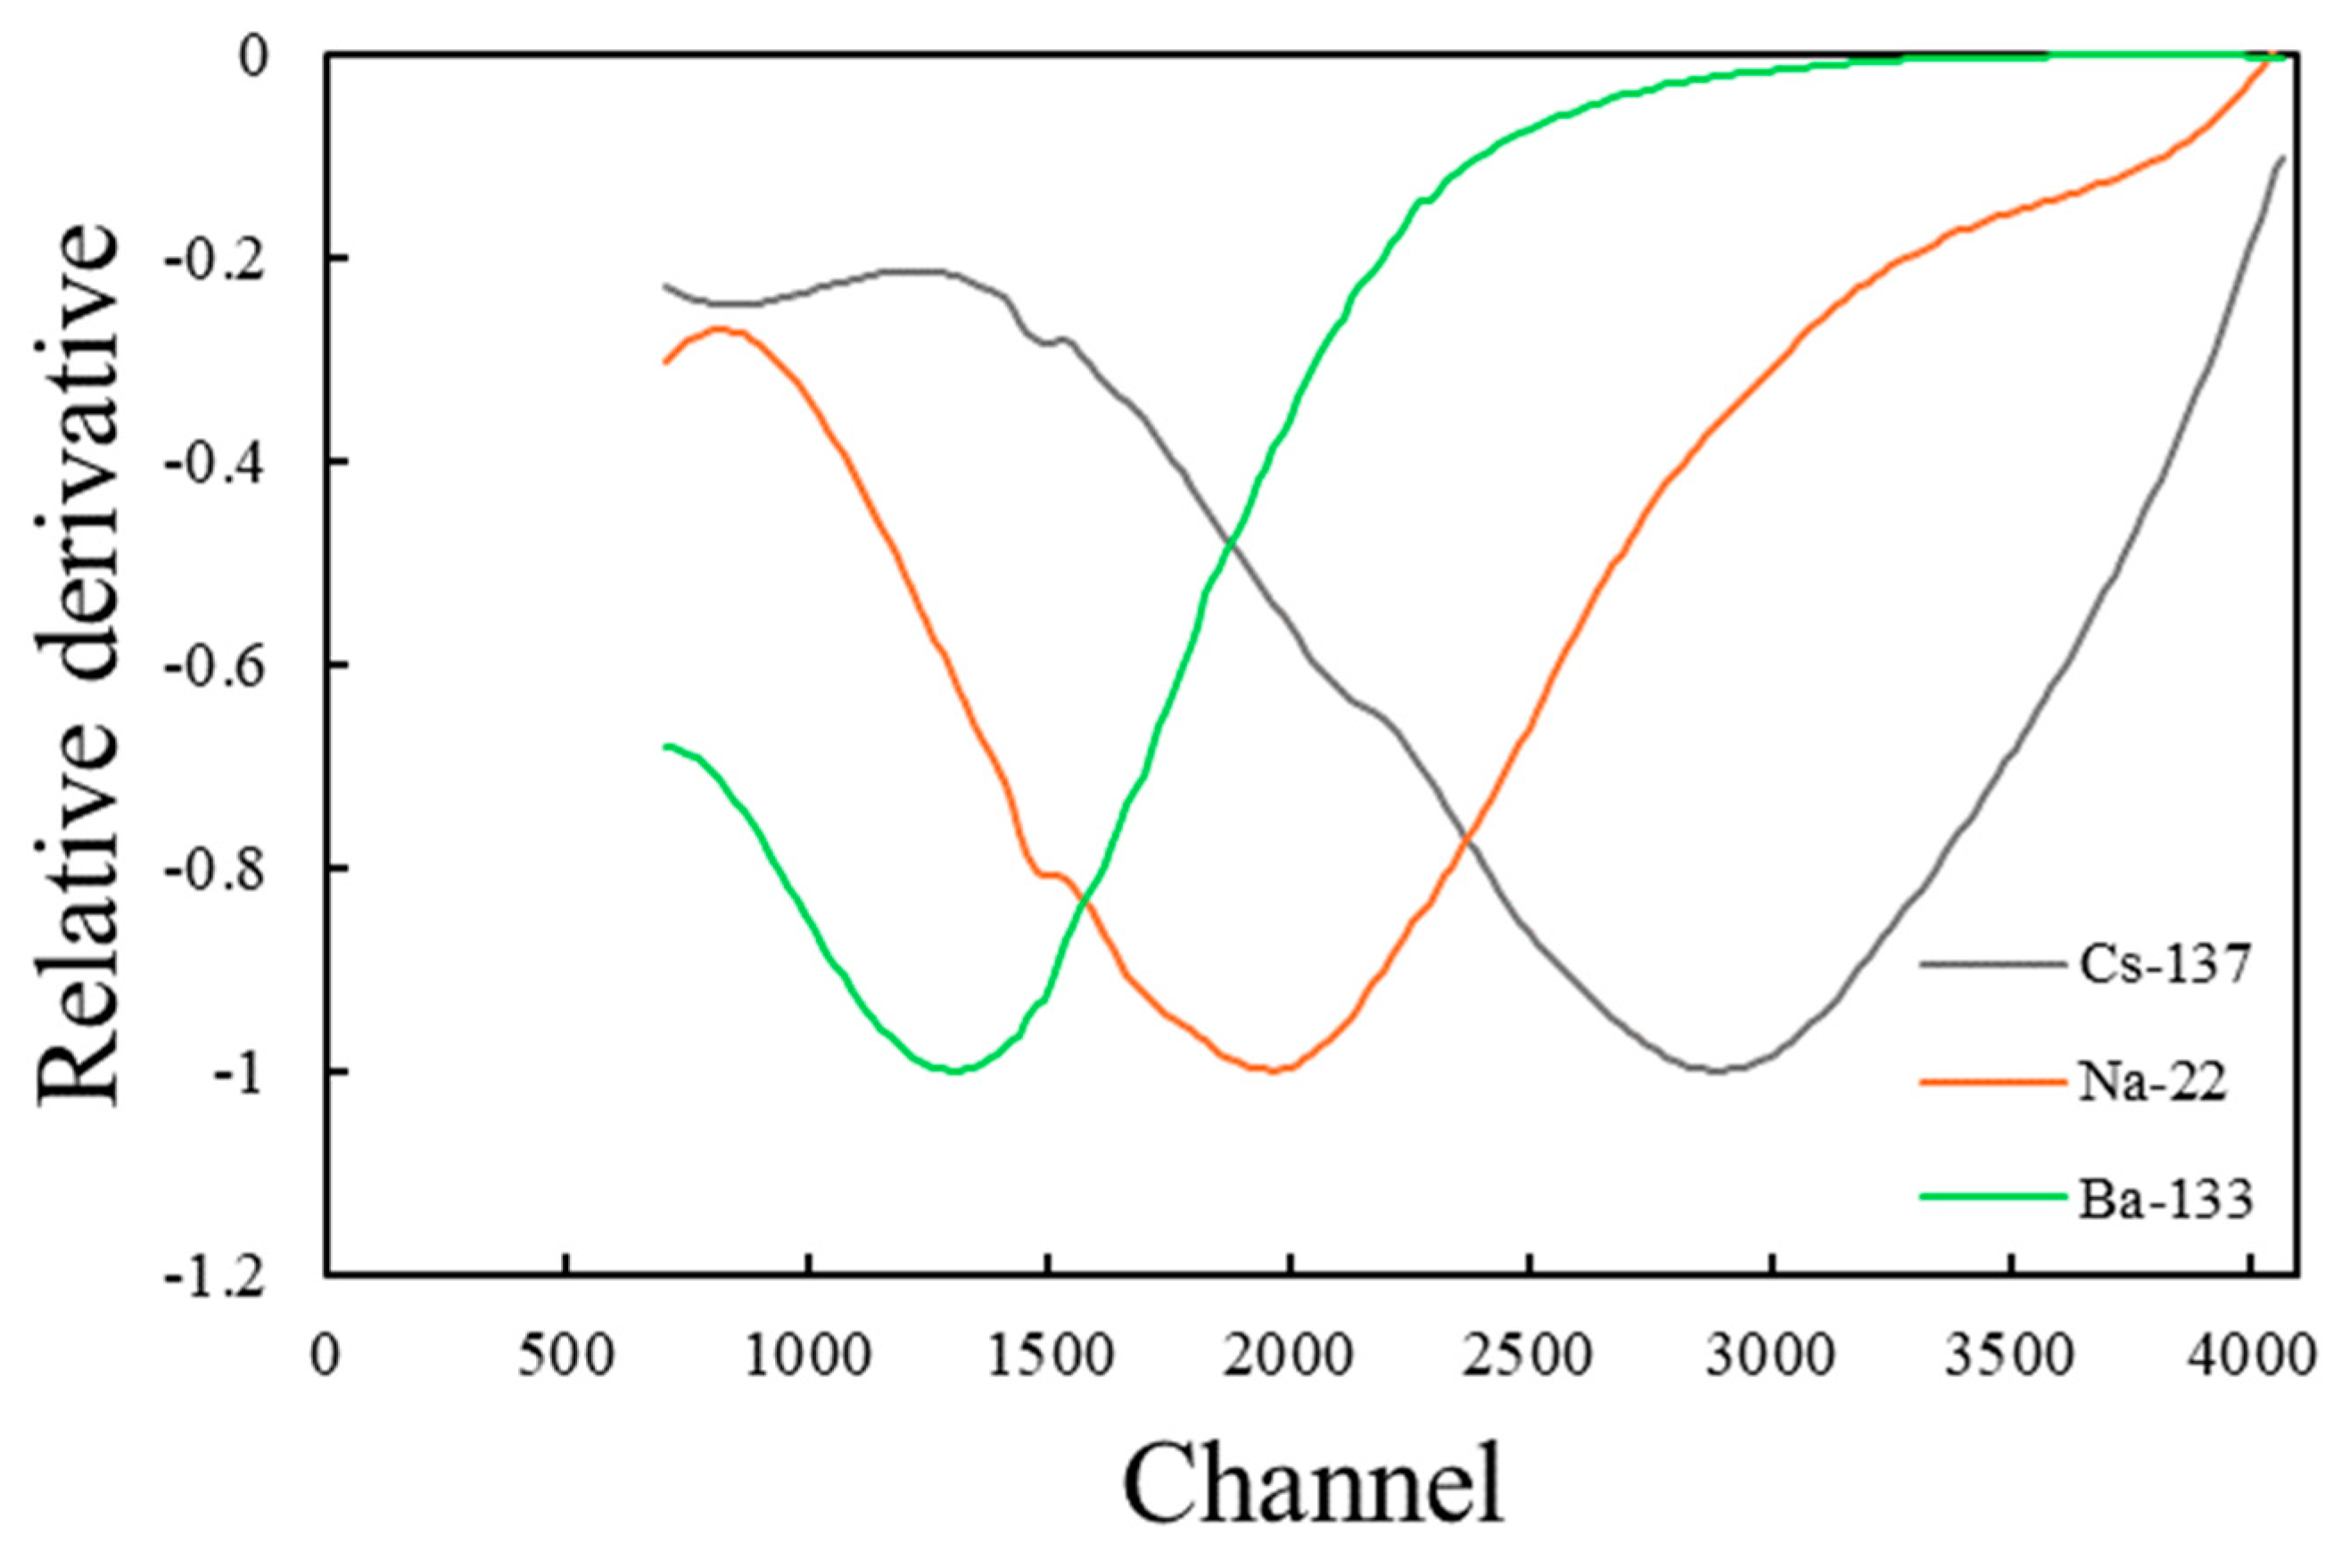
Figure 4 displays the pulse-height spectrum of the PSOF detector for each gamma nuclide following denoising and smoothing, successfully eliminating local oscillations without distorting the spectrum through excessive smoothing. After noise removal, first-order differentiation was applied to the spectrum, and the local minimum was identified to determine the CE channel for each nuclide, resulting in CE channel values of 1296.5, 1968.5, and 2896.5 for the CE energies of 207.3, 340.7, and 477.3 keV corresponding to the
133Ba,
22Na, and
137Cs gamma-ray sources, respectively. The first derivatives of the pulse-height spectra for these gamma nuclides are depicted in
Figure 5.
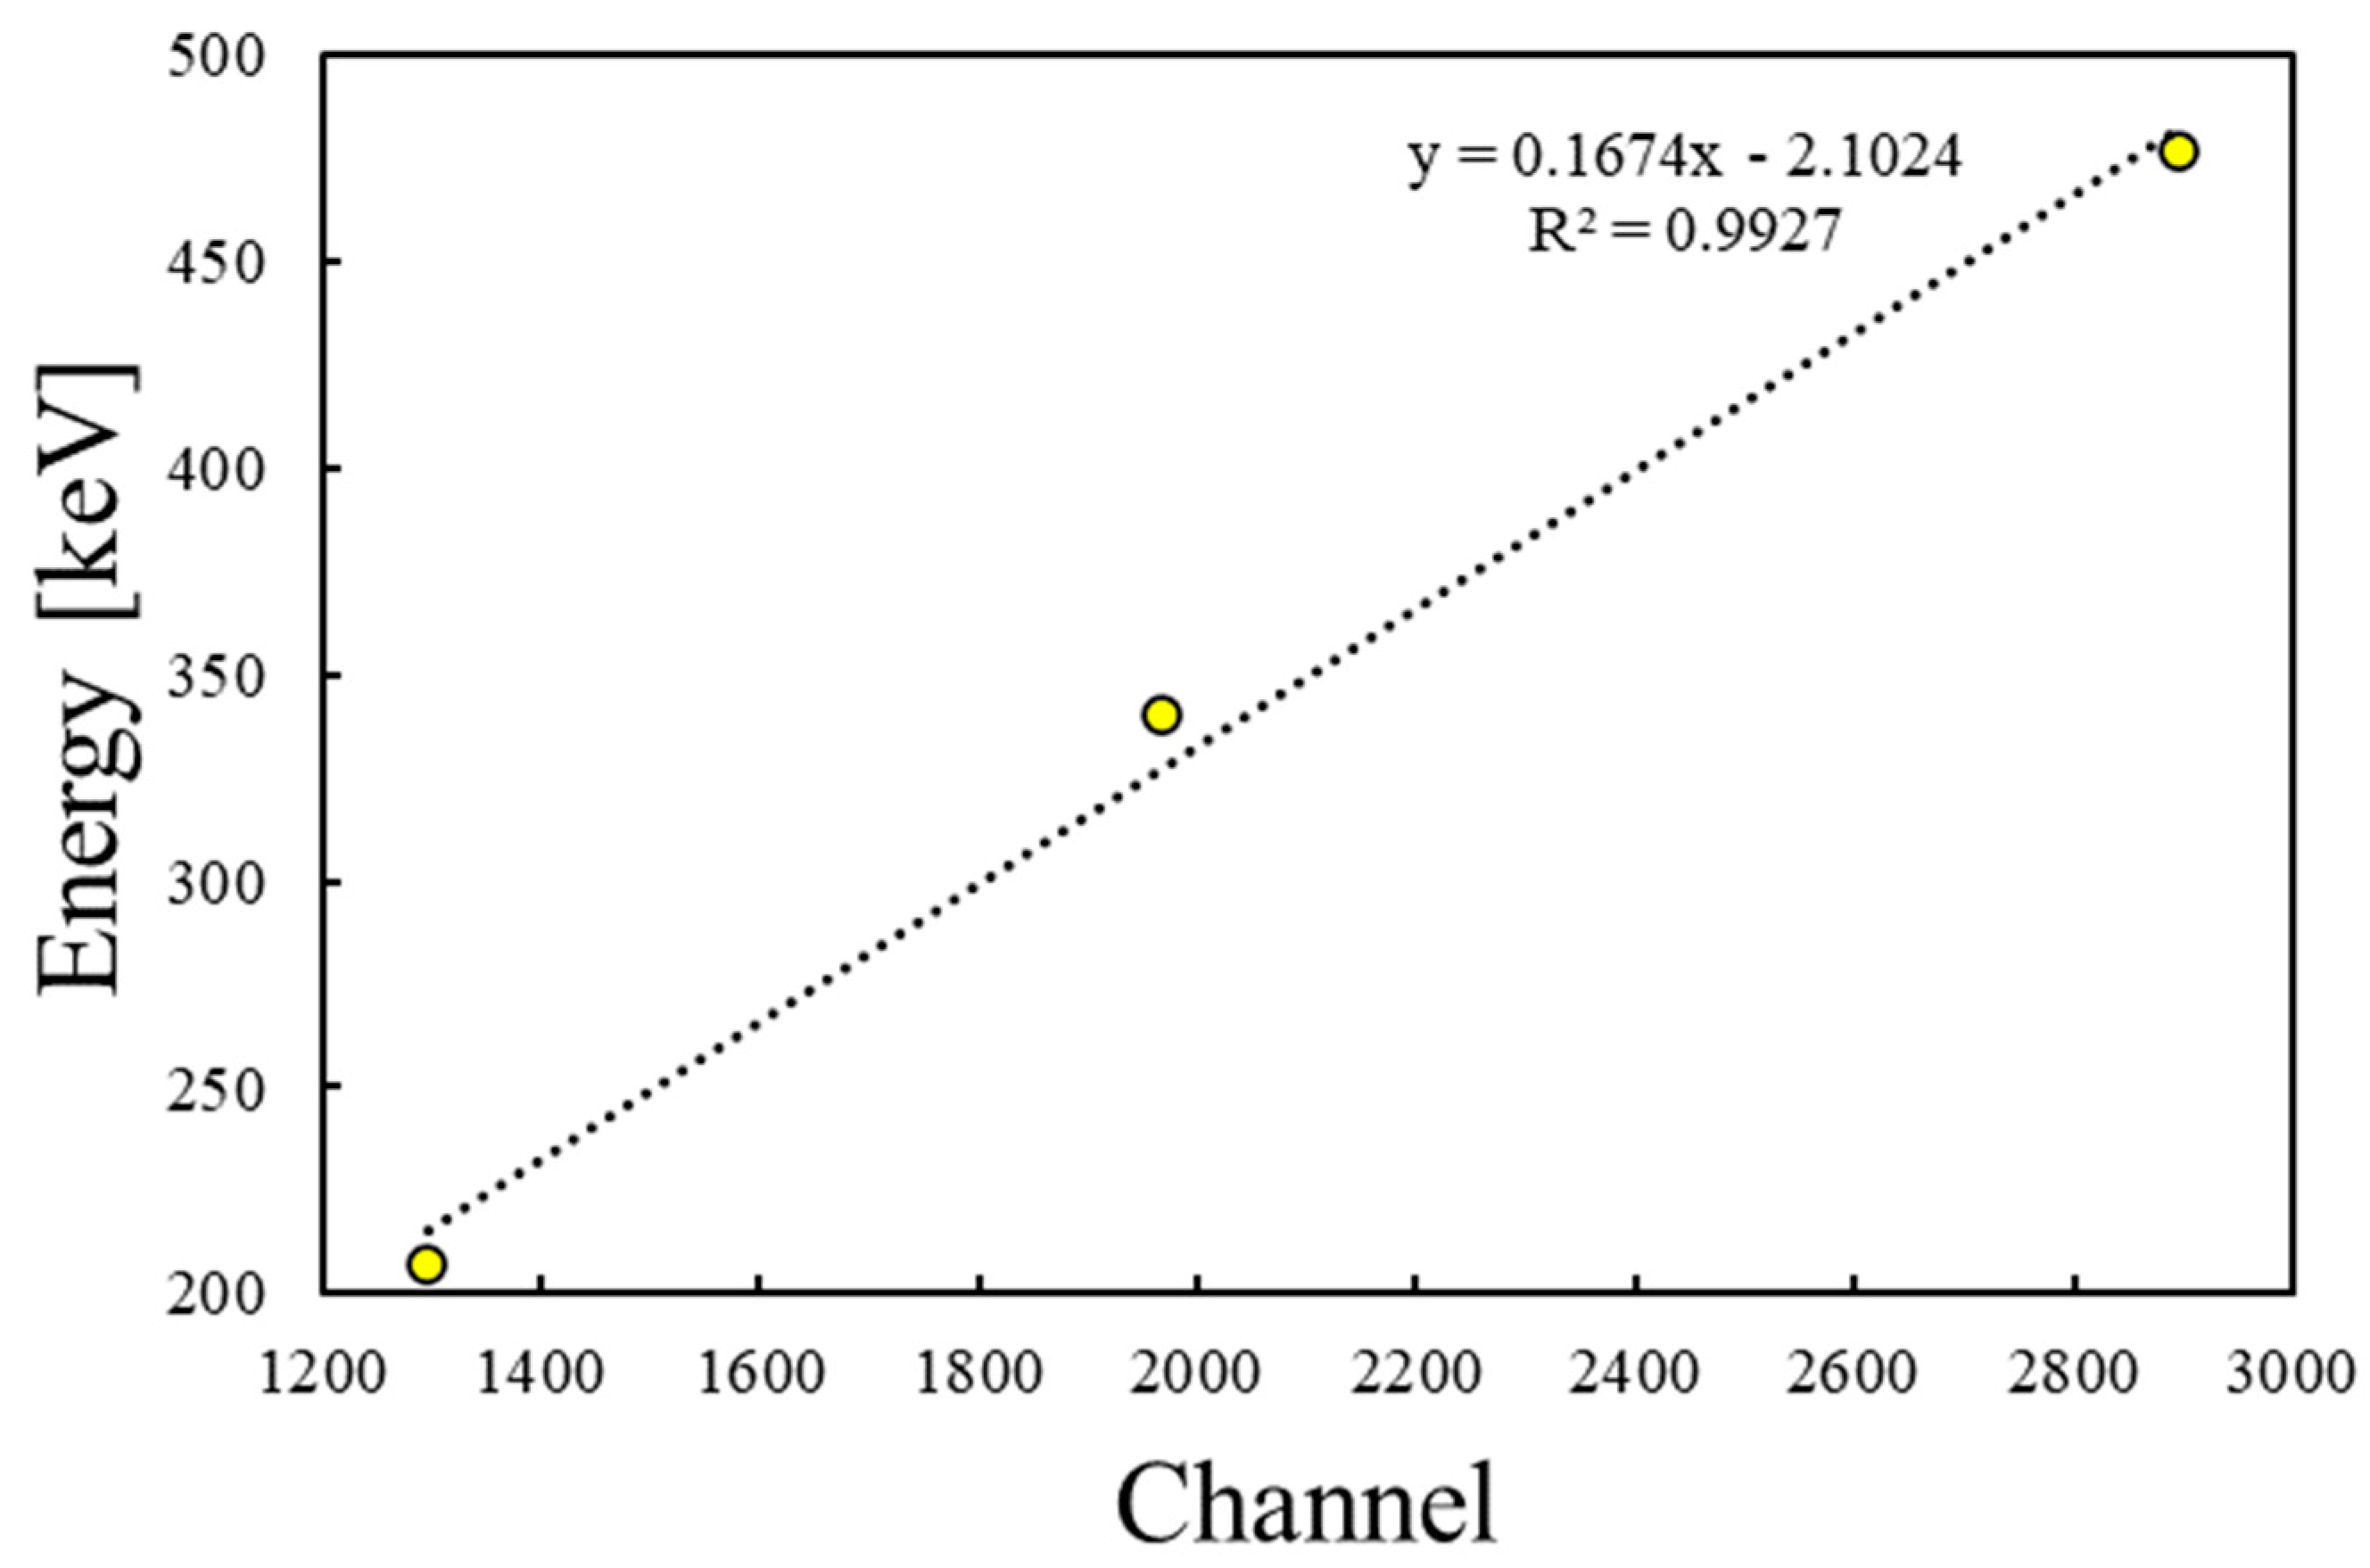
Energy calibration was conducted through linear regression of the CE channel against the CE energy of the gamma nuclides.
Figure 6 presents the linear regression and the linearity between the CE channel and the CE of the measured spectra, yielding a linear regression factor of 0.9927, which signifies successful energy calibration for the three gamma nuclides.
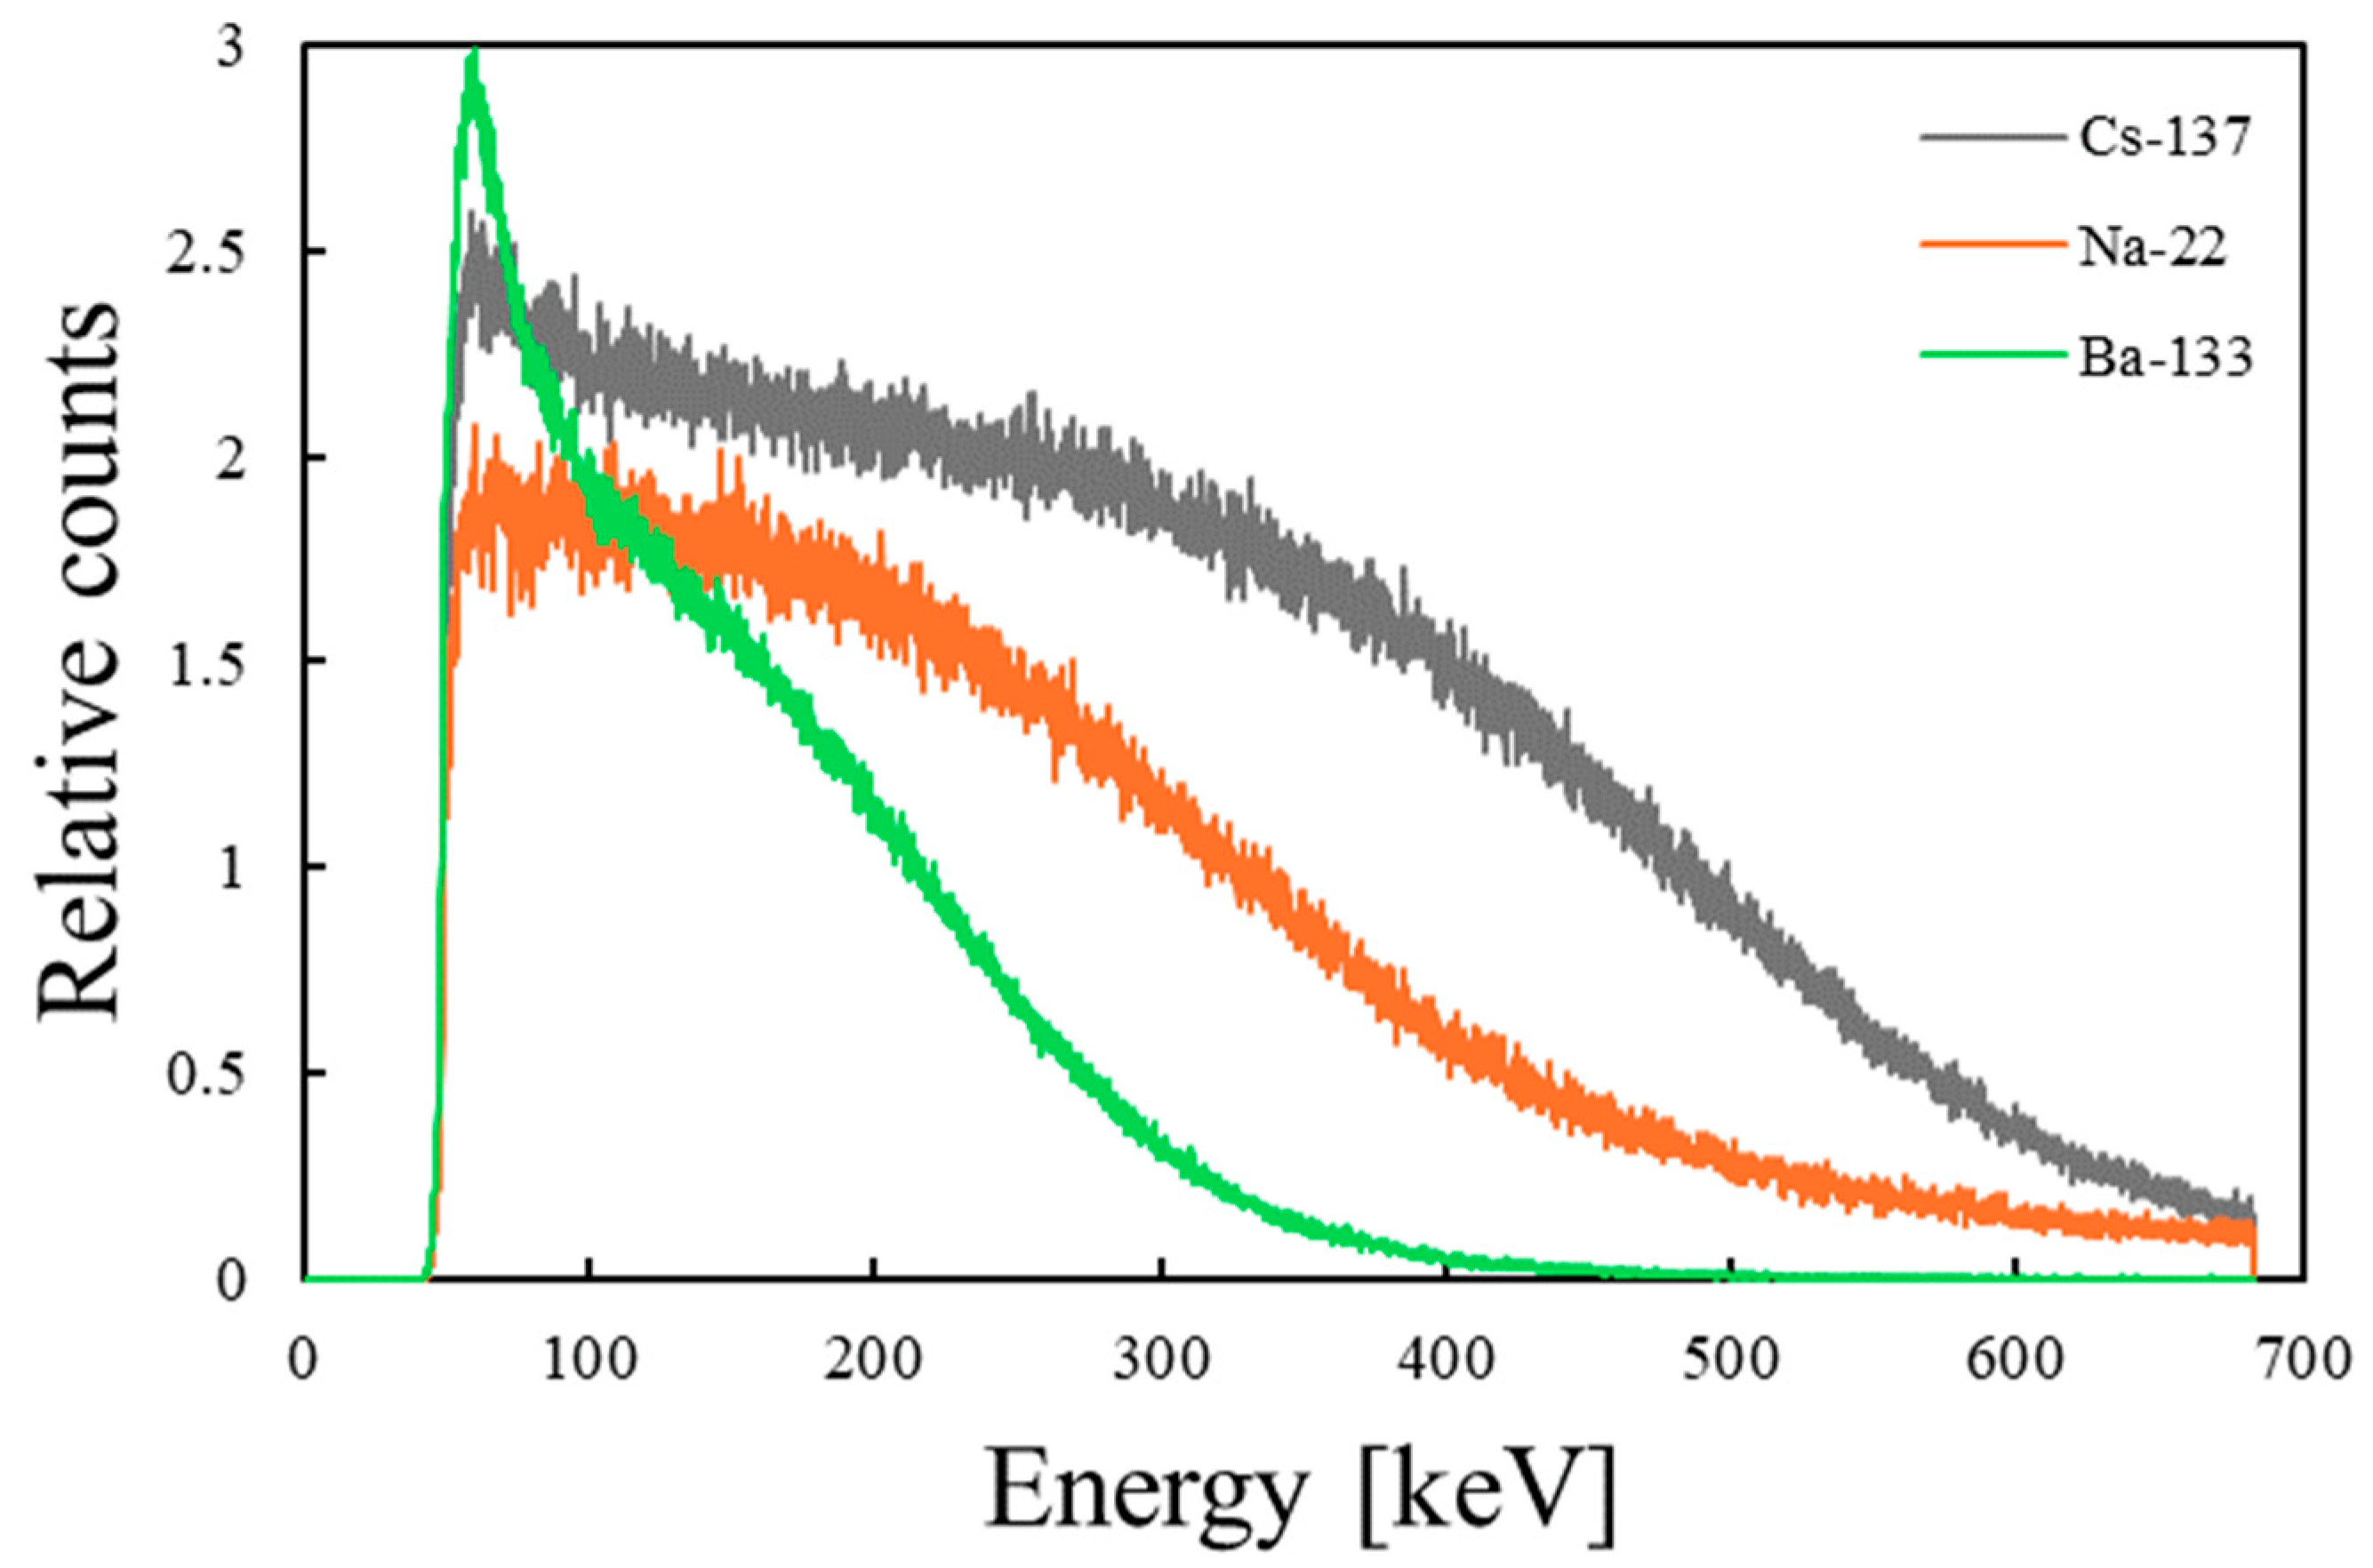
Figure 7 shows the energy spectrum for each nuclide within the PSOF detector, demonstrating that the identification of individual gamma nuclides is feasible.
The pulse-height spectrum of the PSOF exhibits variability dependent on the position of the gamma source. This variability was analyzed by assessing the changes in the CE channel across the pulse-height spectrum at each specific position of the
137Cs gamma-ray source.
Figure 8 illustrates the pulse-height spectrum of the PSOF detector corresponding to each position of the
137Cs gamma-ray source. Through exponential fitting of the pulse-height spectrum at these positions, it was confirmed that the PSOF could effectively distinguish nuclides from gamma-ray sources located at different distances.
Figure 9 shows the CE channels for each position of the
137Cs gamma-ray source.
Furthermore, the maximum length of the PSOF used in the detector was determined by the attenuation coefficient, which is a critical parameter. While PSOF manufacturers typically state that the attenuation length exceeds a certain threshold, these stated lengths do not account for the spectral response and optical coupling characteristics of the optical measurement device in the PSOF detector. Consequently, the attenuation coefficient derived from the CE of the pulse-height spectrum for each gamma source position provides a more accurate measure. Utilizing the first-derivative method, the attenuation coefficient of the PSOF was determined to be 0.2337 m−1, corresponding to an attenuation length of 4.2790 m.
4. Discussion
Effective decontamination of large areas contaminated by significant nuclear events necessitates the deployment of rapid and precise technologies for measuring radiation dose distribution and identifying radionuclides [
9]. Although the PSOF detector has proven effective in rapidly measuring dose distributions across contaminated areas, it previously lacked the capability to identify specific gamma nuclides. In this study, we introduced a method for the energy calibration of spectra measured from gamma-ray sources using the PSOF detector, significantly expanding the applicability of PSOF detectors to include gamma nuclide identification. Additionally, the energy calibration method developed in this research allows for the conversion of pulse-height spectra from alpha, beta, and neutron radiation measured with PSOF detectors in prior studies into energy spectra [
6,
7,
26].
This study employed bin-width optimization, wavelet denoising, and Savitzky–Golay filtering on measured spectra to identify the CE channel using a first-derivative method. Because differentiation inherently amplifies noise, it is crucial to effectively remove this noise without distorting the spectrum’s overall trend. The denoising and smoothing techniques illustrated in
Figure 2 successfully eliminate noise while preserving the trend of the pulse-height spectrum, making them suitable for the precise analysis of spectra from various scintillators, including PSOF.
Additionally, we developed a method to determine the attenuation coefficient of the PSOF within the detector by leveraging the CE channel based on the position of the gamma nuclide. The PSOF features a continuous and skewed emission wavelength, and its attenuation coefficient varies with the wavelength. Moreover, the characteristics of the wavelength transmitted to the light measurement device also depend on the status of the optical connection. Therefore, the approach of measuring the attenuation coefficient using the CE channel proves to be both straightforward and effective for determining the maximum operational length of the PSOF.
5. Conclusions
In this study, we utilized a PSOF detector to obtain and analyze the pulse-height spectra of various gamma-ray source positions and nuclides. The CE channel was determined through the first-derivative method applied to the pulse-height spectrum. Subsequently, the pulse-height spectrum for each nuclide was calibrated into PSOF energy spectra using the identified CE channels. Moreover, the attenuation coefficient for the PSOF detector was calculated based on the CE derived from the pulse-height spectrum at each position. This established PSOF energy spectrum facilitates the identification of nuclides using a PSOF detector, and the derived attenuation coefficient informs the selection of the maximum operational length of the PSOF. However, due to attenuation effects, the pulse-height spectrum of the PSOF varies with the position of the radiation source. Thus, the accurate identification of nuclides from unknown radiation sources necessitates the simultaneous determination of both the nuclide and the source’s position. In future work, we will aim to incorporate the time-of-flight method to enhance the accuracy of nuclide identification and to expand this research to include the analysis of multiple nuclides in a multi-nuclide environment using various PSOF detectors.
Author Contributions
Conceptualization, S.S. and B.L.; methodology, S.S.; software, S.S.; validation, J.H.P., J.K., and B.L.; investigation, S.K., S.J., and S.L.; resources, S.K., S.J., and S.L.; writing—original draft preparation, S.S. writing—review and editing, S.S. and B.L.; visualization, J.H.P. and J.K.; supervision, B.L.; project administration, S.S.; funding acquisition, B.L. All authors have read and agreed to the published version of the manuscript.
Funding
This research was supported by the Chung-Ang University research grant in 2022 and the National Research Foundation of Korea (NRF) grant funded by the Korean government (MSIT) (Nos. 2020M2D2A2062457, 2022M2D4A1084440).
Institutional Review Board Statement
Not applicable.
Informed Consent Statement
Not applicable.
Data Availability Statement
No new data were created or analyzed in this study. Data sharing is not applicable to this article.
Acknowledgments
This research was supported by the Chung-Ang University research grant in 2022 and the National Research Foundation of Korea (NRF) grant funded by the Korean government (MSIT) (Nos. 2020M2D2A2062457, 2022M2D4A1084440).
Conflicts of Interest
The authors declare no conflicts of interest.
References
- Sanada, Y. Development Experience for Plastic Scintillation Fiber after the Accident of the Fukushima Daiichi Nuclear Power Plant. 2021. Available online: https://www.irm.or.jp/news68.pdf (accessed on 20 March 2024). (In Japanese).
- Koarashi, J.; Atarashi-Andoh, M.; Matsunaga, T.; Sanada, Y. Forest type effects on the retention of radiocesium in organic layers of forest ecosystems affected by the Fukushima nuclear accident. Sci. Rep. 2016, 6, 38591. [Google Scholar] [CrossRef] [PubMed]
- Sanada, Y.; Takamura, Y.; Urabe, Y.; Tuchida, K.; Nishizawa, Y.; Yamada, T.; Sato, Y.; Hirayama, H.; Nishihara, K.; Imura, M.; et al. Research and Development of In-Situ Measurement for Radiation Distribution of Waterbed. JAEA-Research 2014-005. 2014. Available online: https://jopss.jaea.go.jp/pdfdata/JAEA-Research-2014-005.pdf (accessed on 20 March 2024). (In Japanese)
- Katengeza, E.W.; Sanada, Y.; Yoshimura, K.; Ochi, K.; Iimoto, T. The ecological half-life of radiocesium in surficial bottom sediments of five pounds in Fukushima based on in-situ measurements with plastic scintillation fibers. Environ. Sci. Process. Impacts 2020, 22, 1566–1574. [Google Scholar] [CrossRef] [PubMed]
- JAEA. Successful Development of Underwater Beta-Ray Real-Time Monitoring Technology. 2020. Available online: https://www.jaea.go.jp/02/press2019/p20013002/ (accessed on 20 March 2024). (In Japanese)
- Whittaker, C.A.; Kalnins, C.A.G.; Ebendorff-Heidepriem, H.; Spooner, N.A.; Ottaway, D. A fibre optic based approach and device for sensing beta radiation in liquids. Sens. Actuators A Phys. 2019, 296, 101–109. [Google Scholar] [CrossRef]
- Whittaker, C.A.; Kalnins, C.A.G.; Ebendorff-Heidepriem, H.; Ottaway, D.; Spooner, N.A. A fibre optic based approach and device for sensing alpha particles in liquids. Sens. Actuators A Phys. 2019, 299, 111573. [Google Scholar] [CrossRef]
- Azevedo, C.D.R.; Baeza, A.; Chauveau, E.; Corbacho, J.A.; Díaz, J.; Domange, J.; Marquet, C.; Martínez-Roig, M.; Piquemal, F.; Pradol, D. Development of a real-time tritium-in-water monitor. JINST 2023, 18, T12008. [Google Scholar] [CrossRef]
- Lee, S.D. Plastic Scintillation Fibers for Radiological Contamination Surveys. EPA/600/R-17/370. 2017. Available online: https://nepis.epa.gov/Exe/ZyPDF.cgi/P100VBOZ.PDF?Dockey=P100VBOZ.PDF (accessed on 20 March 2024).
- Song, S.; Kim, J.; Park, J.H.; Kim, S.; Lim, T.; Kim, J.H.; Moon, J.H.; Lee, B. High-Spatial-Resolution Position-Sensitive Plastic Scintillation Optical Fiber Bundle Detector. Photonics 2021, 8, 26. [Google Scholar] [CrossRef]
- Song, S.; Kim, J.; Park, J.H.; Kim, S.; Lim, T.; Kim, J.H.; Kim, S.; Lee, B. Measurements of low dose rates of gamma-rays using position-sensitive plastic scintillation optical fiber detector. Nucl. Eng. Technol. 2022, 54, 3398–3402. [Google Scholar] [CrossRef]
- Hajagos, T.J.; Liu, C.; Cherepy, N.J.; Pei, Q. High-Z sensitized plastic scintillators: A review. Adv. Mater. 2018, 30, 1706956. [Google Scholar] [CrossRef] [PubMed]
- Jeon, B.; Kim, J.; Lee, E.; Moon, M.; Cho, G. Pseudo-Gamma Spectroscopy Based on Plastic Scintillation Detectors Using Multitask Learning. Sensors 2021, 21, 684. [Google Scholar] [CrossRef] [PubMed]
- Lee, H.C.; Koo, B.T.; Jeon, J.Y.; Cheon, B.W.; Yoo, D.Y.; Chung, H.; Min, C.H. Radionuclide identification based on energy-weighted algorithm and machine learning applied to a multi-array plastic scintillator. Nucl. Eng. Technol. 2023, 55, 3907–3912. [Google Scholar] [CrossRef]
- NIST. XCOM Photon Cross Sections Database. Available online: http://physics.nist.gov/PhysRefData/Xcom/html/xcom1.html (accessed on 20 March 2024).
- Siciliano, E.R.; Ely, J.H.; Kouzes, R.T.; Schweppe, J.E.; Strachan, D.M.; Yokuda, S.T. Energy calibration of gamma spectra in plastic scintillators using Compton kinematics. Nucl. Instrum. Methods Phys. Res. Sect. A Accel. Spectrom. Detect. Assoc. Equip. 2008, 594, 232–243. [Google Scholar] [CrossRef]
- Swiderski, L.; Moszyński, M.; Czarnacki, W.; Iwanowska, J.; Syntfeld-Każuch, A.; Szczęśniak, T.; Pausch, G.; Plettner, C.; Roemer, K. Measurement of Compton edge position in low-Z scintillators. Radiat. Meas. 2010, 45, 605–607. [Google Scholar] [CrossRef]
- Kim, C.; Kim, Y.; Moon, M.; Cho, G. Iterative Monte Carlo simulation with the Compton kinematics-based GEB in a plastic scintillation detector. Nucl. Instrum. Methods Phys. Res. Sect. A Accel. Spectrom. Detect. Assoc. Equip. 2015, 795, 298–304. [Google Scholar] [CrossRef]
- Kornilov, N.V.; Fabry, I.; Oberstedt, S.; Hambsch, F.-J. Total characterization of neutron detectors with a 252Cf source and a new light output determination. Nucl. Instrum. Methods Phys. Res. Sect. A 2009, 599, 226. [Google Scholar]
- Safari, M.J. Differentiation method for Compton edge characterization in organic scintillation detectors. Radiat. Phys. Eng. 2020, 1, 9–16. [Google Scholar]
- Wieczorek, A. Development of Novel Plastic Scintillators Based on Polyvinyltoluene for the Hybrid J-PET/MR Tomograph. Ph.D. Thesis, Jagiellonian University, Kraków, Poland, 2017. [Google Scholar]
- Pan, Z.W.; Wang, Z.; Lin, Z.B.; Li, Y.H.; Xie, F.; He, Z.Y.; Yang, T.Y.; Chen, Z.; Li, Q.; Liu, J.D.; et al. Development of a light yield calibration method for μSR detectors based on Compton edge location. Nucl. Instrum. Methods Phys. Res. Sect. A 2023, 1053, 168368. [Google Scholar] [CrossRef]
- Ruchti, R.C. The use of scintillating fibers for charged particle tracking. Annu. Rev. Nucl. 1996, 46, 281–319. [Google Scholar] [CrossRef]
- NIST. Standard Reference Database 124. Available online: https://physics.nist.gov/PhysRefData/Star/Text/ESTAR.html (accessed on 20 March 2024).
- Kuraray. Plastic Scintillating Fiber. Available online: https://www.kuraray.com/uploads/5a717515df6f5/PR0150_psf01.pdf (accessed on 20 March 2024).
- Nohtomi, A.; Sugiura, N.; Itoh, T.; Torii, T. On-line evaluation of spatial dose-distribution by using a 15-m-long plastic scintillation-fiber detector. In Proceedings of the IEEE Nuclear Science Symposium Conference Record, Dresden, Germany, 19–25 October 2008. [Google Scholar]
| Disclaimer/Publisher’s Note: The statements, opinions and data contained in all publications are solely those of the individual author(s) and contributor(s) and not of MDPI and/or the editor(s). MDPI and/or the editor(s) disclaim responsibility for any injury to people or property resulting from any ideas, methods, instructions or products referred to in the content. |
© 2024 by the authors. Licensee MDPI, Basel, Switzerland. This article is an open access article distributed under the terms and conditions of the Creative Commons Attribution (CC BY) license (https://creativecommons.org/licenses/by/4.0/).

 ,
, 