Article

Compact Quantum Random Number Generator Based on a Laser Diode and a Hybrid Chip with Integrated Silicon Photonics

1
State Key Laboratory of Quantum Optics and Quantum Optics Devices, Institute of Opto-Electronics, Shanxi University, Taiyuan 030006, China
2
Collaborative Innovation Center of Extreme Optics, Shanxi University, Taiyuan 030006, China
3
Hefei National Laboratory, Hefei 230088, China
4
ZJU-Hangzhou Global Scientific and Technological Innovation Center, Zhejiang University, Hangzhou 311215, China
*
Authors to whom correspondence should be addressed.
Photonics 2024, 11(5), 468; https://doi.org/10.3390/photonics11050468
Submission received: 30 March 2024 / Revised: 23 April 2024 / Accepted: 14 May 2024 / Published: 16 May 2024
(This article belongs to the Topic Hybrid and Heterogeneous Integration on Photonic Circuits)

Abstract

:
In this study, a compact and low-power-consumption quantum random number generator (QRNG) based on a laser diode and a hybrid chip with integrated silicon photonics is proposed and verified experimentally. The hybrid chip’s size is 8.8 × 2.6 × 1 mm 3 , and the power of the entropy source is 80 mW. A common-mode rejection ratio greater than 40 dB was achieved using an optimized 1 × 2 multimode interferometer structure. A method for optimizing the quantum-to-classical noise ratio is presented. A quantum-to-classical noise ratio of approximately 9 dB was achieved when the photoelectron current is 1 μ A using a balance homodyne detector with a high dark current GeSi photodiode. The proposed QRNG has the potential for use in scenarios of moderate MHz random number generation speed, with low power, small volume, and low cost prioritized.

1. Introduction

Random numbers are key resources in the information age. They play an essential role in various applications, such as simulation, cryptography, and fundamental physical experiments [1,2,3,4,5,6,7,8,9,10]. A quantum random number generator (QRNG) can produce true random numbers with the characteristics of unpredictability, irreproducibility, and unbiasedness, guaranteed by the basic principles of quantum physics. Over the last two decades, various QRNG schemes have been proposed, such as QRNGs based on branching path [11], time of arrival [12,13,14], photon counting [15,16], attenuated pulse [17], vacuum fluctuations [18,19,20], phase noise [21,22,23], amplified spontaneous emission [24], Raman scattering [25], and optical parametric oscillators [26]. In particular, vacuum-fluctuation-based QRNGs have several advantages [27]. First, the source of entropy, i.e., vacuum noise, is readily available; thus, no bulky external components are required. Second, the inherent canceling of excess noise present in the local oscillator using balanced detection relaxes requirements on the laser and increases the system’s resilience against external perturbation [18]. Third, all optics devices can be integrated into chips. Because of these advantages, several silicon photonics chip-based QRNGs have been implemented [27,28,29,30,31], and a QRNG with 100-GHz-bps generation speed can be achieved [27].
For photonics chip-based QRNGs, although there are several materials for circuits integrating photonics, such as silicon, doped silicon dioxide ( SiO 2 ), indium phosphide (InP) [32], gallium arsenide (GaAs), silicon nitride (Si3Ni4), and lithium niobate ( LiNbO 3 ), circuit technology integrating silicon photonics is dominant. Silicon photonics, which uses silicon-on-insulator (SOI) wafers as semiconductor substrate materials, is compatible with complementary metal oxide semiconductor (CMOS) fabrication. This means that most standard CMOS manufacturing processes can be applied, and silicon photonics technology can monolithically integrate silicon electronics and photonics into the same platform [33]. To achieve a small-volume, low-cost, high-performance QRNG, many researchers have employed silicon photonics integrated technology. Because there are no light sources in silicon due to its indirect bandgap, laser beams are guided into silicon photonics chips by grating or edge coupling in integrated QRNGs [27,28,29,30,31]. To further improve the feasibility and practicability of such QRNGs, the coupling fiber array can be packaged with chips using a copper block [31]. In these studies, a bulky external laser and polarization controller were also used. Nevertheless, research is required to realize a more compact QRNG based on a silicon photonic chip, such as using hybrid or heterogeneous technology to integrate the light source on chips [34] and integrating optical and electrical parts on one chip.
High generation speed is a critical characteristic of QRNGs. However, not all systems require large random numbers [35]. For example, in the aviation field, a 1 MHz/s speed is sufficient for use in airborne radar jump frequency and waveform modulation, with low power, small volume, and low cost prioritized. QRNGs based on circuits integrating photonics seem adequate to meet these requirements.
In this study, to realize a compact, low-power QRNG, a hybrid integrated chip comprising a III–V InP laser diode (LD) chip and a silicon photonics chip is proposed and verified experimentally. The two chips are packaged together via edge coupling. The LD output beam is directly guided into the silicon photonics chip to minimize the QRNG’s volume. An advantage of the proposed QRNG technique is that it generates a megabit quantum random number per second with little power and a small volume. No high-power LD driver, temperature controller, or balancing structures are required. A method for optimizing the quantum-to-classical noise ratio (QCNR), which transforms various noises into current noises, is presented. The theoretical analysis results are consistent with the experimental results. A voltage amplifier is used to flexibly tune the standard deviation of the output voltage noise according to the analog-to-digital converter (ADC) scales of the QRNG. A postprocessing module based on a field-programmable gate array (FPGA) is used to generate quantum random numbers in real time.
The remainder of this article is organized as follows. In Section 2, the structure of the proposed QRNG with a hybrid chip is introduced; the packing process is described in detail. In Section 3, we analyze the various noises in the proposed QRNG; a comprehensive comparison between the noises of balance homodyne detector (BHD) with commercial InGaAs photodiode and BHD with GeSi photodiode is presented, and the common mode rejection ratios (CMRR) are measured. In Section 4, the generation of quantum random numbers is introduced in detail. A method for flexibly tuning the standard deviation of the output voltage according to the ADC scale is presented. Finally, Section 5 presents the conclusions and outlook.

2. QRNG Structure

The proposed compact QRNG comprises three major parts (Figure 1a): a hybrid chip, an analog circuit, and a digital circuit. The hybrid chip mainly comprises a 1550 nm InP edge-emitting LD chip, a silicon photonics chip, and two mounts. The LD is a mature commercial product of the company Lightip, and the silicon photonics chip is fabricated using industry-standard active flow SOI technology CSiP180A1 of CUMEC; these are the QRNG’s optical parts. The maximum output power of the laser is 10 mW, the side mode suppression ratio is greater than 35 dB, and the linewidth is less than 1 MHz. The two mounts are customized using aluminum nitride ceramics with good heat conduction and are used to pack the hybrid chip. The analog circuit mainly comprises a low-noise transimpedance amplifier (TIA) ADA4817, a low-noise voltage amplifier OPA847, a constant current (CC) source, and a high-pass filter (HPF). The two parts above are noted as entropy sources. The digital circuit mainly comprises an ADC and randomness extraction module based on the FPGA.
In the hybrid chip, one side of the InP LD chip is the anode, and the other side is the cathode. The two electrodes are connected to the CC source by the pads of the two mounts. There are two gold-plated pads on mount 1, as shown in Figure 1b. The anode side of the InP LD chip is mounted on one pad of mount 1 using the flip-chip method, and the cathode side is connected to the other pad by wire bonding. The InP chip’s size is 1 × 0.25 × 0.12 mm 3 , with a 40 μ m gap between it and the edge of mount 1 in the length or laser-emitting direction to facilitate the alignment and packaging. In particular, during packaging, the ultraviolet glue can seep into the gap between mount 1 and the silicon photonics chip to make them stick tight, which are then placed on mount 2. Silver glue is overlaid on mount 2’s surface to fasten the conglutination of mount 1 and the silicon photonics chip. The silver glue should have good heat conduction ability. The packaged hybrid chip is shown in Figure 1c. There are also gold-plated welding pads on mount 2. They are used to connect the pads of mount 1 with those of the printed circuit board (PCB) of the analog circuits part. Figure 1d shows an image of the entire analog circuit.
The CC source in the analog circuit is used to drive the InP LD chip to emit a 1550 nm laser beam with a linewidth of 0.5 MHz from the hybrid chip’s edge. Thus, a light beam can be precisely guided into the silicon photonics chip via edge coupling. The emitted beam polarization is parallel to the silicon photonics chip’s plane and is transformed into a transverse electric mode beam in the waveguide. The insertion loss is 3.1 dB. After packing, the insertion loss increases to 5 dB. To test and package the silicon photonics chip, two additional grating couplers (GC1, and GC2) are connected to the transmission waveguide. The remaining beam is then split by a 1 × 2 multimode interferometer (MMI) coupler. The outputs of the two beams are inserted into two GeSi photodiodes. To reduce the system complexity, the 1 × 2 MMI coupler is designed to achieve a high degree of balance, no Mach–Zehnder interferometer (MZI) structures are used to balance the two output ports of 1 × 2 MMI [36].
The length, width, and height of the silicon photonics chip are 5 mm, 2.5 mm, and 0.5 mm, respectively. This is also the size of half block of CUMEC CSiP180AI multi-project wafer technology. The chip is multiplexed and used for other uses. According to the utilized devices, the size of silicon photonics chip can be reduced to about 1 × 0.5 × 0.5 m m 3 in principle. For easy packing, the width should be tuned to 2 mm. Then, the whole size is tuned to 1 × 2 × 0.5 m m 3 . The length of mount 1 can be reduced to the length of laser chip. Thus, the hybrid chip’s length can be reduced to about 2 mm. Then, the packaged hybrid chip can be reduced to about 2 × 2 × 1 m m 3 . The main experimental challenge is packing such small devices, especially along the width direction. When the width is short, the droplets of ultraviolet glue may pollute the laser chip. Thus, the width of silicon photonics chip is tuned from 0.5 mm to 2 mm for feasible packing.
The silicon photonics chip and analog circuit constitute a typical balance homodyne detector (BHD). In the BHD, only the local oscillator (LO) beam is inserted, and the signal beam can be seen as a vacuum beam. The BHD’s output is noise signals, which comprise quantum and classical noises. To improve the BHD balance degree or common mode rejection ratio (CMRR), an optimized 1 × 2 MMI coupler is used. The subtracted photoelectron currents of the two GeSi photodiodes were amplified by a low-noise TIA ADA4817. A feedback resistance with a high value of 510 k Ω is used. To reduce the feedback circuit’s parasitic capacitance, the PCB under the feedback resistance is hollowed out. The reason for this is described in Section 3. The low-noise voltage amplifier OPA847 is used to magnify the output voltage noise 10–100 times to match the ADC scale and generate more random numbers.
In the digital circuit, an ADC with 200 kHz samples per second is used to acquire the output voltage noise, and an FPGA is used to extract the random number with a Toeplitz matrix in real time. This process is described in detail in Section 4.
Owing to the low-power laser beam, large transimpedance gain, and reasonable second-stage selection, no high-power LD driver, additional temperature controller, or balance controller is required, and the total consumption power of the entropy source is 80 mW.

3. QRNG Noise

In this section, various QRNG noises are analyzed and measured. The method for optimizing the QCNR at 1MHz is presented based on a BHD noise model. In this model, all noise densities are transformed into noise current densities, which can be conveniently analyzed. The BHD noises using commercial InGaAs photodiodes are also analyzed for comparison. The experimental results are consistent with the theoretical analysis. The details are as follows.

3.1. BHD Noise Analysis

Figure 2 shows the noise model of the TIA in BHD [37,38]. The measured shunt resistance of the GeSi photodiode is R PD = 2.47 M Ω , and the equivalent capacitance of one photodiode is C PD = 40 fF . The corresponding parameters of the InGaAs photodiode are 10 11 Ω and 0.8 pF. When two photodiodes are in series, as shown in the QRNG scheme in Figure 1, the equivalent shunt resistance in the alternating current (AC) circuit is R PD / 2 , and the shunt capacitance is 2 C PD . The input capacitance of the TIA is C IN = 1.4 pF , and C INP is the input circuit’s parasitic capacitance.
The thermal noise current density i PDT of the GeSi photodiode due to the shunt resistance R PD / 2 is given by
i PDT = 4 k T 4 k T R PD R PD 2 2 R PD R PD 2 2 = 1.155 × 10 13 A A Hz Hz ,
where k is the Boltzmann constant and T = 295 K is the laboratory temperature. i PDT is drawn as the orange solid line in Figure 3a. The thermal noise of resistance is white noise and is invariant with frequency. For comparison, the thermal noise current density of the InGaAs photodiode, drawn as the orange line in Figure 3b, is 5.739 × 10 16 A / Hz at T = 295 K .
The noise current density i PDD due to the GeSi photodiode dark current I PDD can be calculated as follows:
i PDD = 2 e ( 2 · I PDD ) .
The dark current of the GeSi photodiode I PDD , drawn as the green solid line in Figure 3a, is 4 × 10 8 A when the bias voltage is 2 V. The noise current density i PDD , drawn as the green line in Figure 3a, is 1.790 × 10 13 A A Hz Hz and is invariant with frequency. Correspondingly, the dark current of the InGaAs photodiode is 5 × 10 12 A, and the noise current density, drawn as the green solid line in Figure 3b, is 1.790 × 10 15 A A Hz Hz .
The feedback resistance is R F = 510 k Ω , and C F is the feedback circuit’s capacitance. C FP is the feedback circuit’s parasitic capacitance. When the temperature is T = 295 K , the thermal noise current density i RFT due to feedback resistance, drawn as the blue solid lines in Figure 3, is
i RFT = 4 k T / R F = 1.797 × 10 13 A / Hz .
It has no relationship with photodiodes and is invariant with frequency. The noise current density of the TIA, drawn as the purple solid lines in Figure 3, is
i NC = 2.5 × 1 0 15 A A Hz Hz .
The density of the noise current of the TIA is i NC = 2.5 × 10 15 A / Hz . It was drawn as the purple solid lines in Figure 3a,b.
The noise voltage density of the TIA u NV comprises two parts. The first is the white noise voltage, and its density is
u white = 4 nV / Hz .
The second is 1 / f noise voltage, and its density is
u 1 / f = 553.25 nV / f .
The total noise voltage density of the TIA is
u NV = u white 2 + u 1 / f 2 .
Its contribution to the noise current density i NV is
i NV = ( 1 / Z IN + Z F ) · u NV ,
where Z IN denotes the total input impedance of the amplifier, given by
Z IN = 1 2 / R PD + 2 π i f ( 2 C PD + C INP + C IN ) ,
and Z F is the total feedback impedance of the amplifier, given by
Z F = 1 1 / R F + 2 π i f ( C F + C FP ) .
The detailed derivation of Equations (7)–(9) is presented in Appendix A. i NV is drawn as cyan solid lines in Figure 3. The cyan dashed lines represent the white noise current density i white , and the cyan dashed-dotted lines represent the 1 / f noise current density i 1 / f . The two densities vary with frequency. The increase in i white with frequency is mainly due to the decrease in impedance 1 1 1 1 Z IN + 1 / Z F Z IN + 1 / Z F 1 1 Z IN + 1 / Z F Z IN + 1 / Z F .
We now compare the five density types. For the InGaAs photodiode, the thermal noise current density of the photodiode shunt resistance i PDT contributes the least noise and can be neglected. The shunt resistance of the GeSi photodiode is much higher than that of the InGaAs photodiode, and its density i PDT cannot be neglected. The noise current density i PDT of dark current has a similar situation. The noise current density of the TIA i NC can be neglected for both BHDs.
The total noise current density, drawn as the black solid lines in Figure 3, can be calculated as follows:
i = i PDT 2 + i PDD 2 + i NC 2 + i RFT 2 + i NV 2 .
Because of the density i NV , the black solid lines can be divided into three stages. In the first stage, the frequency ranges from direct current (DC) to 1 kHz, and the total density decreases with increasing frequency. In the second state, the frequency ranges from 1 kHz to 1 MHz, and the total density is flat. In the third stage, the frequency is greater than 1 MHz, and the total density increases with frequency. In Figure 3a, the black lines are slightly higher than the blue lines in the second state (flatness region) because of the contribution of the dark current and shunt resistance of the photodiode. The sum of the above five noise types is usually noted as electronics or classical noise. It is different from the quantum or shot noise generated by the photoelectron current I PD . Red solid lines in Figure 3 represent the shot noise current density i s h o t generated by the 1 μ A photoelectron current of the series photodiodes. It can be calculated as follows:
i s h o t = 2 e ( 2 · I PD ) = 8.006 × 10 13 .
It is approximately 9 dB higher than the electronic noise in the flatness region, or the QCNR is 9 dB.
In the GeSi photodiode-based BHD, to achieve a maximum QCNR and sufficient amplification and bandwidth, a reasonable feedback resistance of 510 k Ω is selected. In this case, i RFT is nearly equal to i PDD , and i NV is negligible in the flatness region. In this case, a 3 dB bandwidth of approximately 1.2 MHz can be achieved.
In the above analysis, we transform various noises into the noise current densities to compare their amplitudes. The output noise voltage density can be obtained by multiplying the corresponding noise current density by the magnitude of the TIA gain G ( f ) . The total noise voltage density can then be obtained as follows:
u = i · | G ( f ) | ,
where G ( f ) denotes the TIA gain considering the gain bandwidth product (GBW) of the TIA. It is expressed as follows:
G ( f ) 1 1 Z F + i f GBW ( 1 Z F + 1 Z IN ) = R F 1 + i f GBW + i f R F GBW 2 R PD + 2 π i f C TF R F 2 π f 2 R F GBW C TIN .
The GBW is 410 MHz . A detailed derivation of G ( f ) can be seen in Appendix A. When the input current is a DC, the frequency f is zero, and the gain is R F .
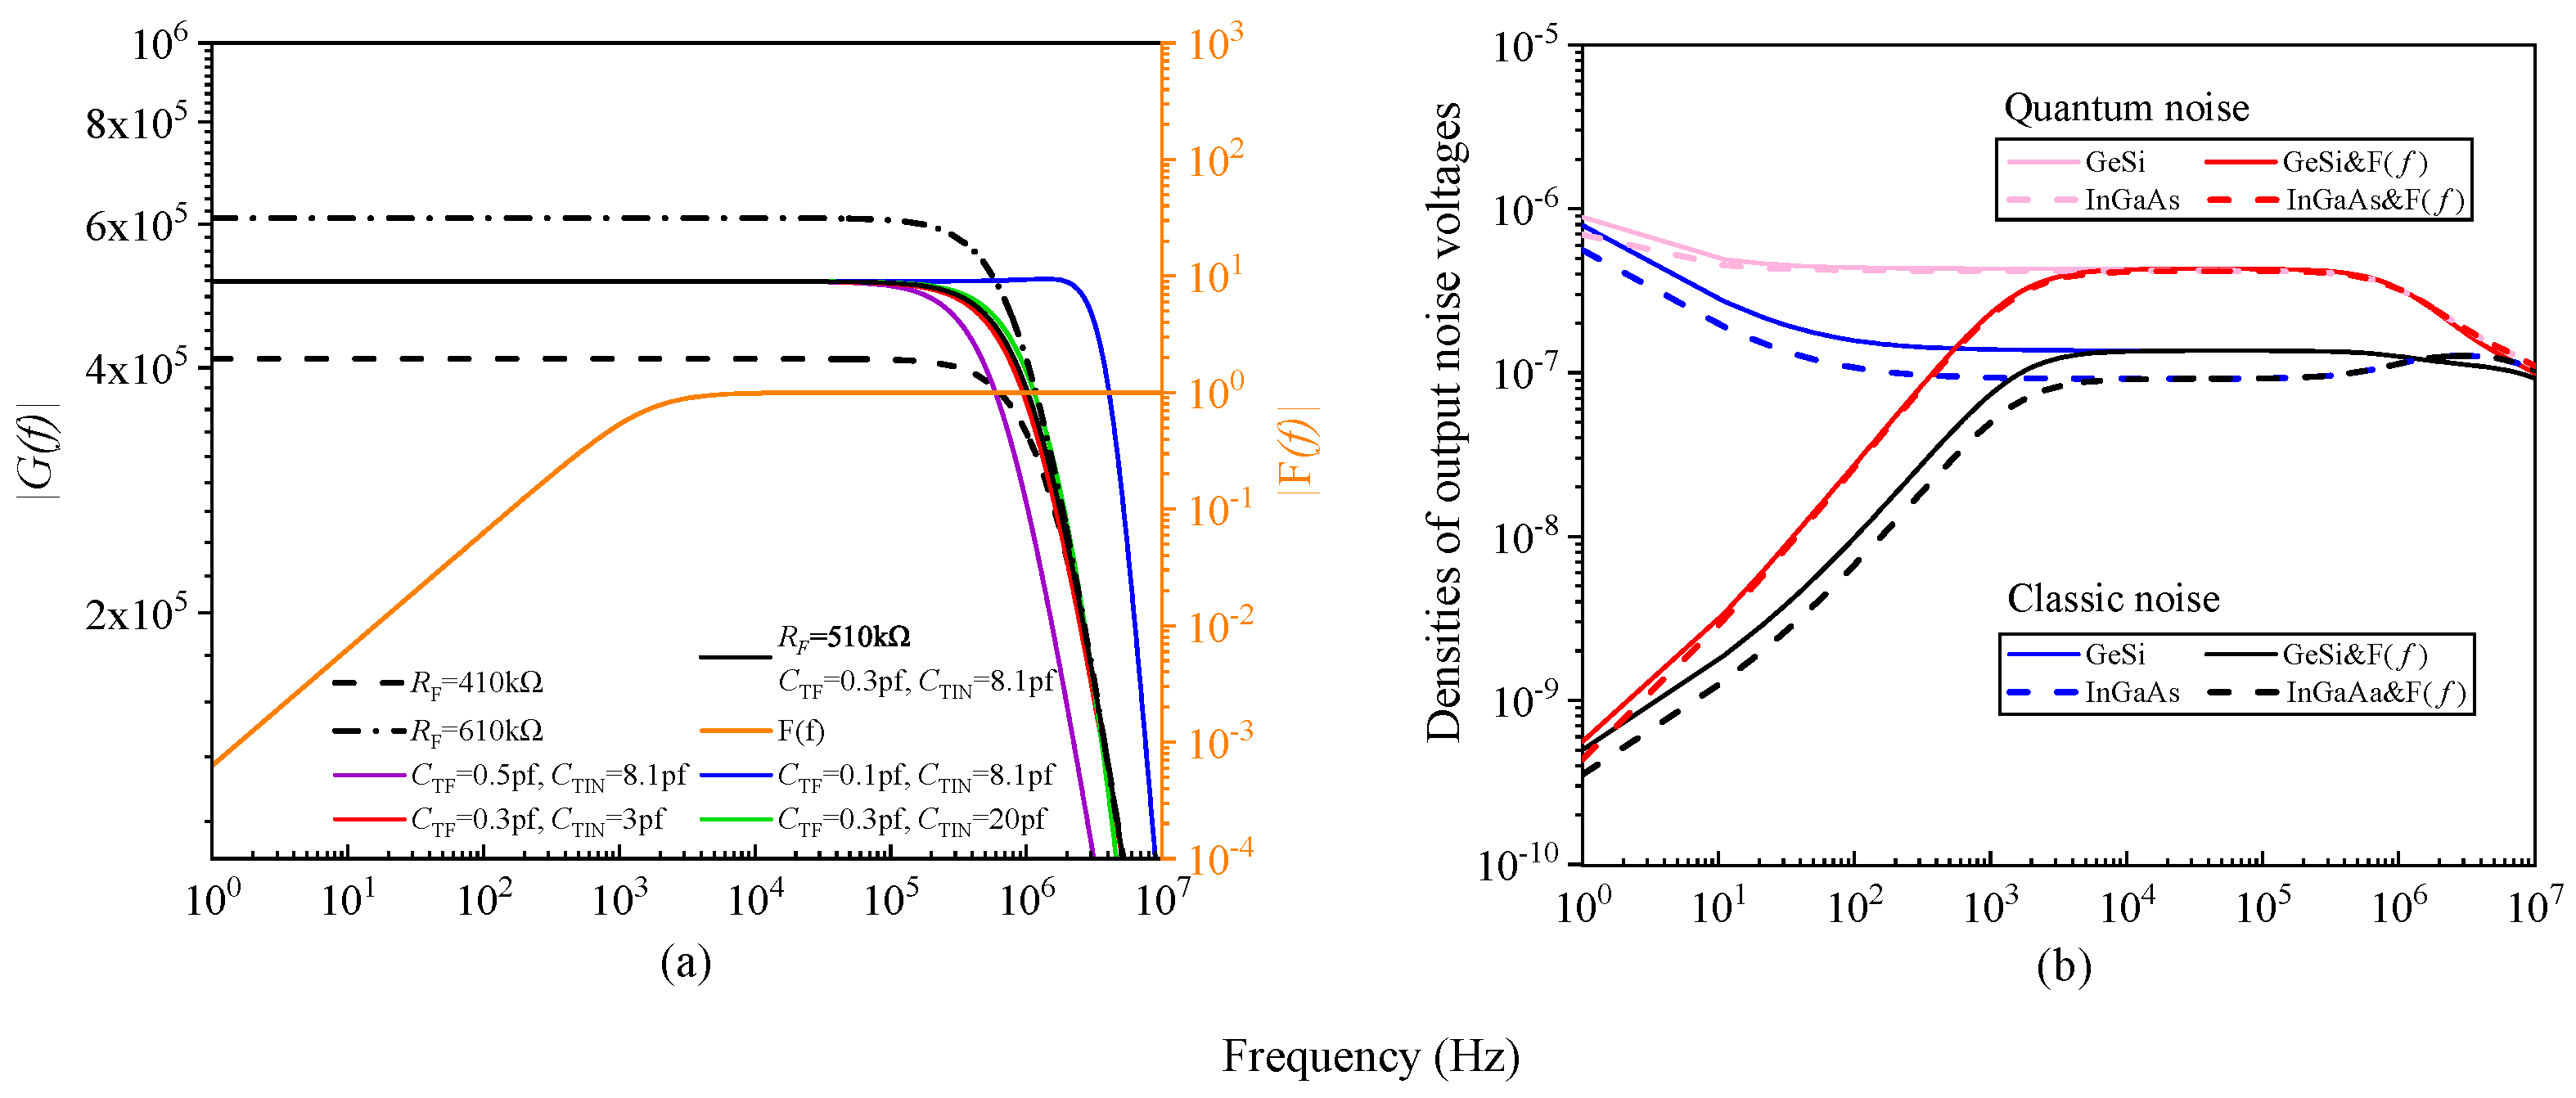
The curves of G ( f ) are shown in Figure 4a. The value of R F determines the gain amplitude of the flatness region. When the value of R F is larger, the gain value in the flatness region is larger. In this case, i NV is smaller and the bandwidth of G ( f ) is smaller. In the experiment, we should choose the value of R F to ensure that i RFT and i NV are as small as possible and the 3 dB bandwidth is larger than 1 MHz. The bandwidth is mainly determined by R F , C TF , and C TIN . Based on the fixed value of R F , we set C TF to 0.1, 0.3, and 0.5 pf, and the curves are the solid blue, black, and purple lines in Figure 4a, respectively. When C TF is smaller, the bandwidth is broader. We also set C TIN to 3, 8.1, and 20 pF, and the curves are the red, black, and green lines in Figure 4b, respectively. The variance in bandwidth is not obvious. Thus, we do not use C F and hollow the PCB below R F to minimize C FP . Because the parasitic capacitance C FP and C INP cannot be measured experimentally, they are determined by comparing the calculated noise power and the measured noise power introduced in Section 3.2. The capacitance C TF and C TIN of GeSi based BHD are determined as 0.3 pf and 8.1 pf. Then, the parasitic capacitance C FP = C TF is 0.3 pF, and C INP = C TIN 2 × C PD C IN is 6.62 pF.
The orange solid line in Figure 4a represents the transmission function F ( f ) of the HPF. The 3 dB bandwidth is 1.6 kHz. The HPF is used to filter the low-frequency noise, in which there is mainly 1 / f noise and the DC signal.
The classical output noise voltage density of the GeSi photodiode-based BHD is drawn as the black solid line in Figure 4b, and the blue solid line represents the density before the HPF. The red solid curve represents the output density of the sum of quantum and classical noise voltages when the photoelectron current is 1 μ A, and the pink solid line represents the density before the HPF. The dashed lines represent the corresponding results for the InGaAs photodiode-based BHD. In the flatness region, the red solid line nearly overlaps with the corresponding red dashed line, and the black solid line is slightly higher than the corresponding black dashed line.

3.2. BHD Noise Power Measurement

The noise power measurement results, which are consistent with the theoretically calculated results, are presented in detail in this section. When the output impedance of the TIA is 50 Ω , and the input impedance of the radio frequency (RF) spectrum analyzer is R = 50 Ω , the noise voltage density u calculated by Equation (13) can be transformed into the noise power density, s, as follows:
s dBm dBm Hz Hz = 10 log 10 G v a · u G v a · u 2 2 2 R · 1 1 × 10 3 W .
The unit of u is V V Hz Hz and the unit of R is Ω . G v a is the gain of the voltage amplifier. The noise power S with the resolution bandwidth Δ f is
S = s · Δ f dBm .
Figure 5a shows the calculated noise power at different photoelectron currents in the frequency range from DC to 2 MHz, with a resolution bandwidth of 10 kHz. The black spectrum curve represents the internal noise power of the RF spectrum analyzer without considering the low-frequency noise. The blue spectrum curve represents the electronics or classical noise power of the GeSi photodiode-based BHD. The green spectrum curve represents the noise power when the photoelectron current is 1 μ A. A 9 dB signal-to-noise ratio can be achieved. The 3 dB bandwidth is 1.2 MHz. The green, purple, and orange spectrum curves represent the noise power when the photoelectron currents are 10 μ A, 100 μ A, and 1 mA, respectively. The interval of the noise power is 10 dB. The spectrum scale was extended from 2 to 10 MHz (Figure 5b).
Figure 5c,d shows the measurement results obtained using the BHD based on the GeSi photodiode of the hybrid chip. The values of the curves are consistent with those of the curves in Figure 5a,b, except for the effect due to the low-frequency noise of the RF spectrum. For comparison, the experimental results of the InGaAs photodiode-based BHD are also shown in Figure 5e,f. The noise power based on the two types of photodiodes is nearly the same. The main difference is that the maximum QCNR of the GeSi photodiode-based BHD is lower, attributable to the non-balancing structure in the hybrid chip. When the photoelectron current is large, the difference in photoelectron currents causes saturation of the BHD. Thus, the noise power of 1 mA in Figure 5c,d is abnormal. The inset figures in Figure 5d,f present low-frequency noise. To decrease the effect of the low-frequency noise of the RF spectrum analyzer, the TIA output noise was magnified 10 times by the voltage amplifier OPA847 and the resolution bandwidth was changed to 100 Hz. From the spectrum, the detectors are shot noise limited in the entire magnified range of the BHD.

3.3. CMRR

A high-CMRR BHD can cancel out the intensity noise of the laser [39,40]. Usually, to achieve a high CMRR, silicon photonics chip-based BHDs use the MZI or p-i-n phase modulator structure to balance the two output ports of a 50/50 MMI coupler [36]. The additional balance structure requires extra balance control, which will confuse the BHD structure and QRNG, and more cost and power will be required. To achieve a high degree of balance in situations without a balance structure, we designed and optimized a symmetrical 1 × 2 MMI structure (Figure 6) to achieve as high a degree of balance as possible. The balance of the two output beams is more insensitive to the variance of size and wavelength than that of the 2 × 2 MMI structure. Furthermore, the size of 1 × 2 MMI is smaller, and the loss is lower. Overall, it is more suitable for use in QRNG than 2 × 2 MMI [33]. In addition, we also symmetrized the structures after the 1 × 2 MMI, such as waveguides and PDs.
The Eigen Mode Expansion (EME) solver in Ansys Lumerical was utilized to optimize the 1 × 2 MMI geometry. The size of the optimized 1 × 2 MMI structure is shown in Figure 6a. The core length is L = 25.2 μ m , and the core width is W = 5 μ m . The top view of the simulated power distribution at 1550 nm wavelength is shown in Figure 6b. The source span is set to 2 μ m × 2 μ m in the simulation. Figure 6c depicts the transmission efficiency versus the core length. The variance is periodic, and we select the first peak point with the highest transmission efficiency. It corresponds to the core length L = 25.2 μ m . The transmission efficiency from port 1 to ports 2 and 3 is T 21 and T 31 , respectively. Figure 6d shows the transmission efficiency as a function of wavelength, and the optimized wavelength is 1550 nm. From the simulation result, we can see that even if the size may have an error in fabrication or the laser beam may change, the balance will be unaffected.
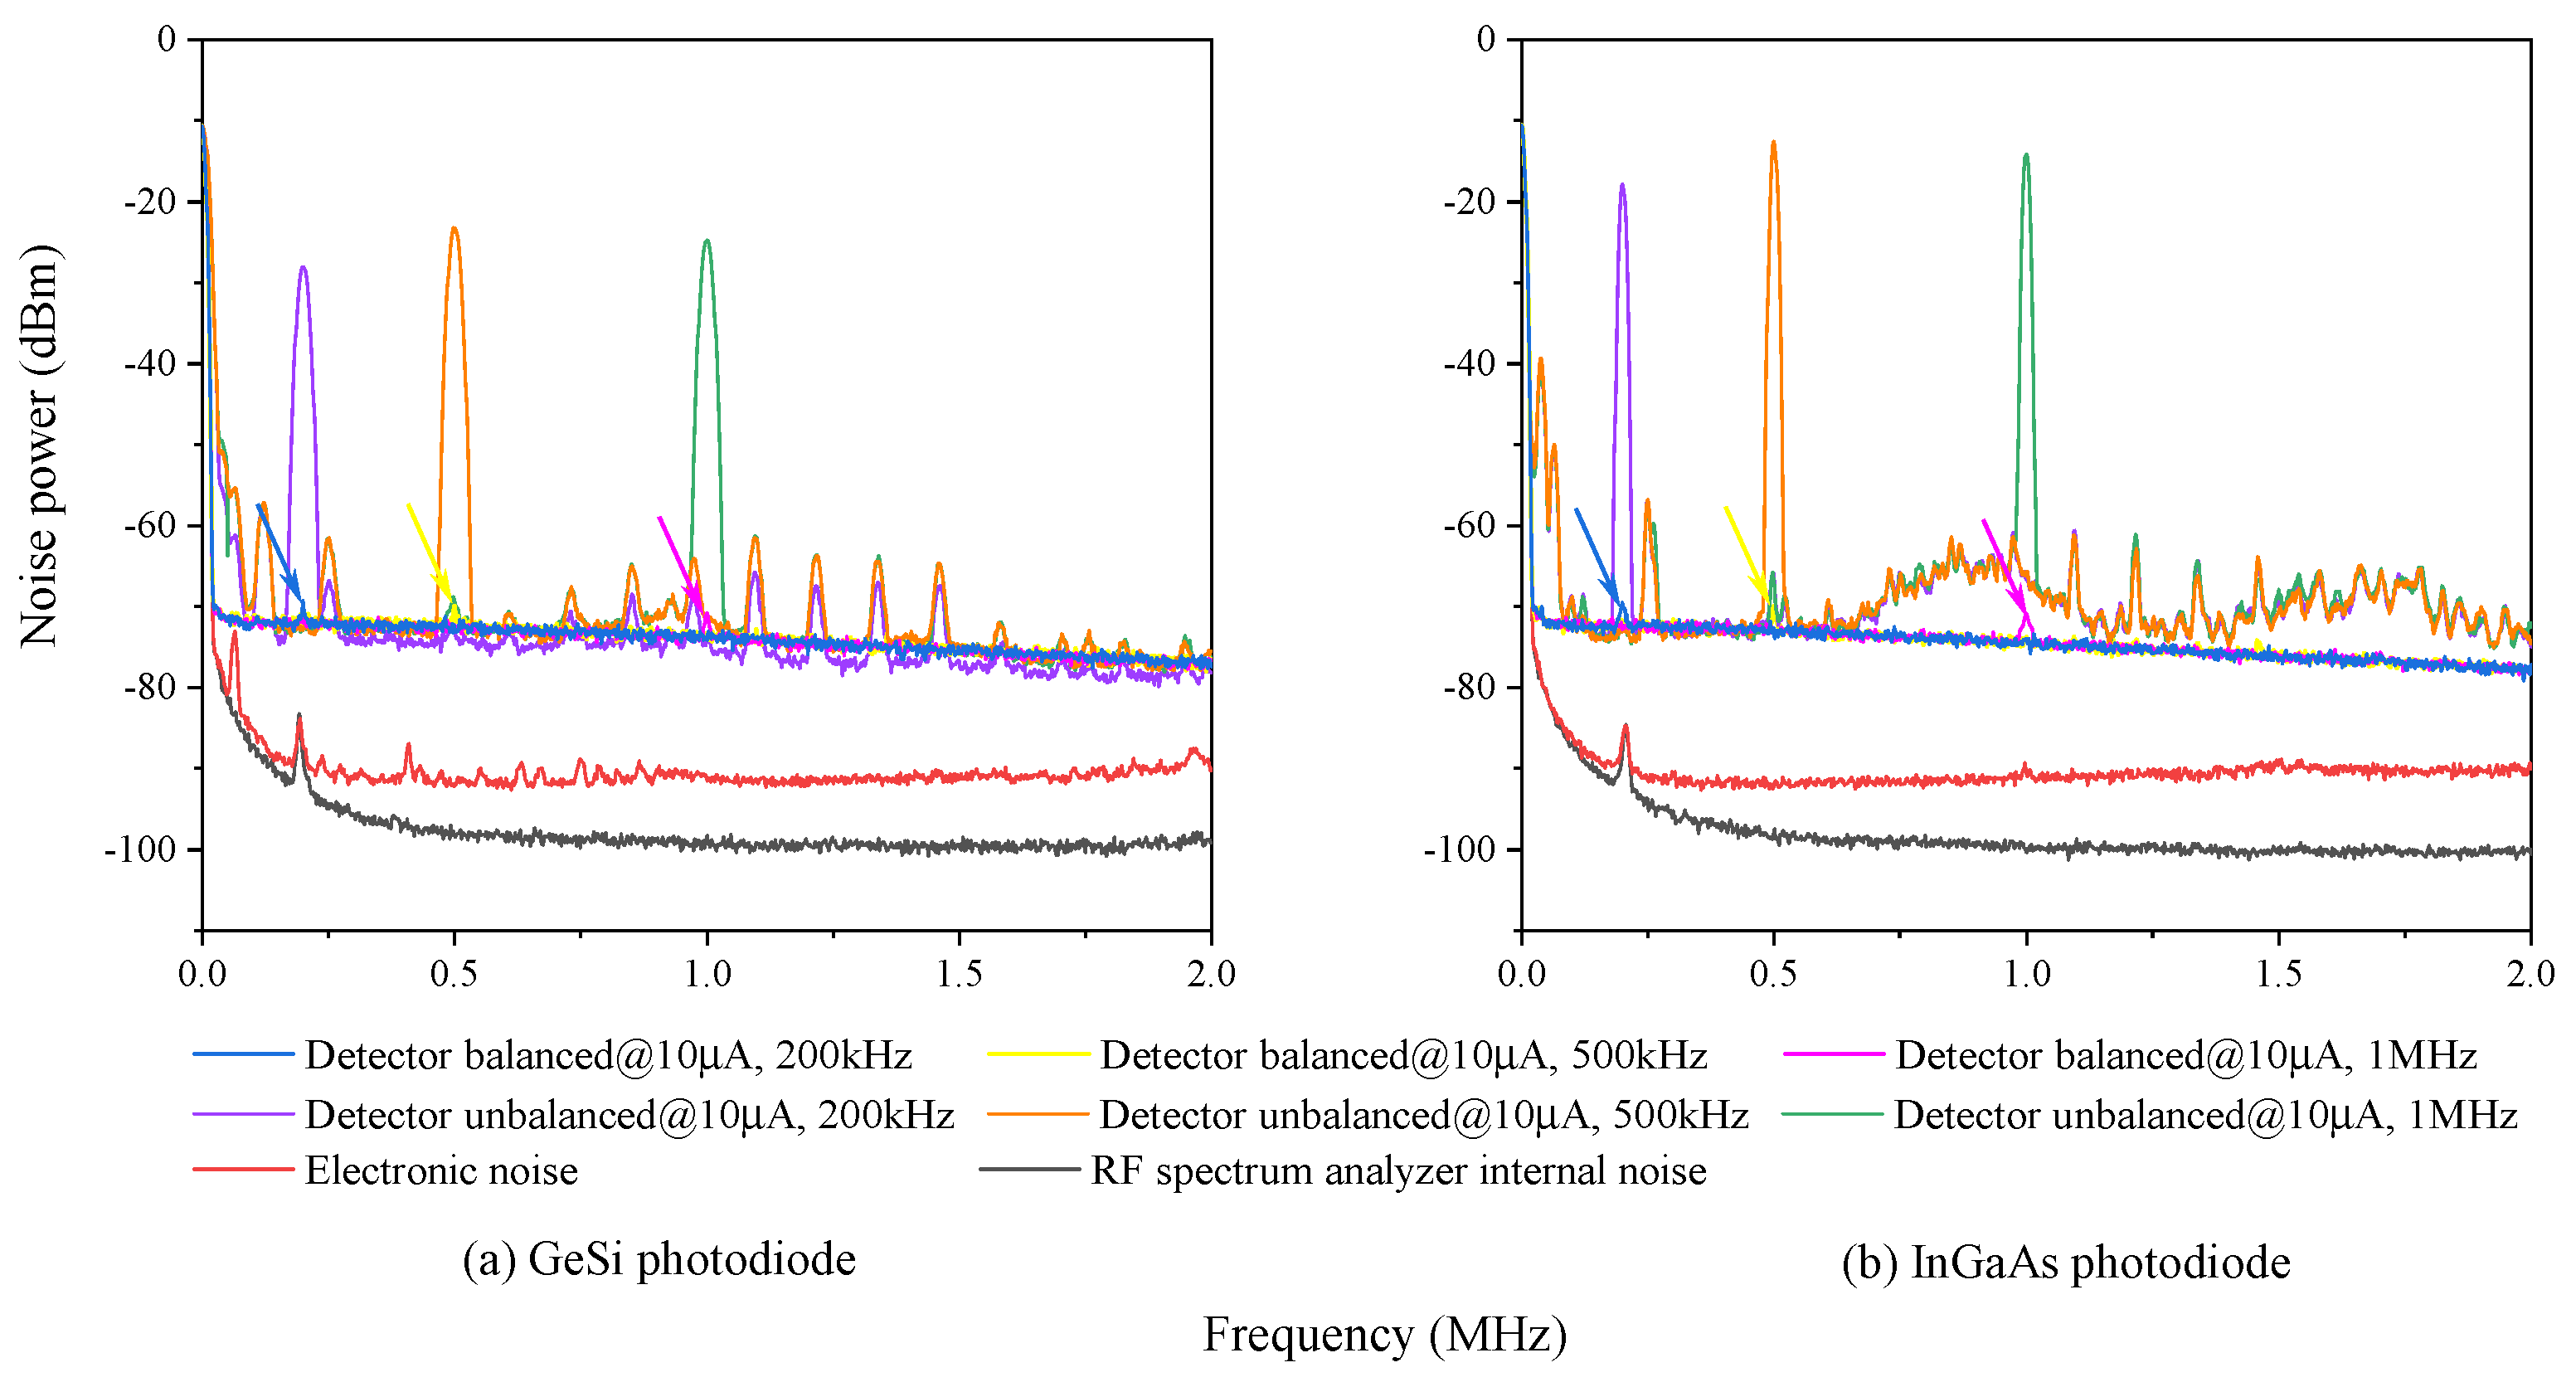
From the measurement results in Figure 7a, a high CMRR greater than 40 dB can be achieved, the photoelectron current is 10 μ A, and the measured frequencies are 200 kHz, 500 kHz, and 1 MHz. Figure 7b shows the measurement results of the CMRR of the InGaAs photodiode-based BHD for comparison. Because the intensities of the two output ports of the BHD can be tunable, the CMRR is higher and the measurement result is greater than 50 dB. When the BHD is balanced in the measurement, the test results are nearly overlapping. We also denote them using different colors. The remaining modulation signal due to limited CMRR has been indicated by the arrows with corresponding colors.
In CMRR measurements, it is inconvenient to directly modulate the amplitude of the laser beam emitted by the InP laser chip. We guide the laser beam emitted by the other InP laser chip into an amplitude modulator and then guide the modulated beam into the silicon photonics chip using GC1. In this process, the shell of the shield metal box is open, with a small disturbance in the electronic noise (Figure 7a).

4. Generation of Quantum Random Number

From the above experimental results, a BHD with integrated silicon photonics and limited shot noise can be achieved. This is the foundation for generating quantum random numbers. Firstly, we should calculate the worst-case conditional min entropy H min or average conditional min entropy H ¯ min . In the worst-case situation, the adversary can not only know the classical noise with arbitrary precision but also has the ability to control the classical noise. Usually, it can be calculated using the following equation.
H min ( M d i s | E ) = log 2 max e R max m i M d i s P M d i s | E ( m i | e ) .
m denotes the measured total output noise data, and e denotes the classical noise data in the real number field R . M dis and E are their probability distributions. The maximum excursion of e is usually bounded in the range 5 σ E e 5 σ E , which is valid in a probability of 99.9999 % . σ E is the standard deviation of electronic noise.
In the average conditional situation, the adversary can only listen to but has no control over the classical noise. The classical noise data e follow a certain distribution E dis . The adversary has maximum power, which includes an infinite ADC range R e and an infinitely small bin δ e 0 . The min entropy H ¯ min can be calculated using Equation (18) as follows. For more detail about Equation (18), a previous study can be referred to [41].
H ¯ min M dis | E = lim δ e 0 H ¯ min M dis | E dis = log 2 + P E e max m i M dis P M dis | E m i | e d e ,
In the calculation, a common ADC range ± R = ± 5 V is used, and the resolution is eight bits. H ¯ min and H min versus the ratio R R σ Q σ Q were drawn at different QCNRs, as shown in Figure 8a,b, where σ Q = σ M 2 σ E 2 denotes the standard deviation of the quantum noise, σ M is the standard deviation of the measured noise. The min entropies have a similar tendency. Compared to the worst-case conditional min entropy, the average conditional min entropy is more robust against the degradation of QCNR; hence, it allows one to extract more secure random bits for a given QCNR [41]. In the following experiment of generating quantum random numbers, we select the average conditional min entropy based on a reasonable assumption that the eavesdropper cannot influence our devices in a shielded metal box in the laboratory.
From the inset figure, when the QCNR increases, the optimized ratio R R σ Q σ Q decreases. If we choose the peak point to calculate H ¯ min , a large σ Q and high gain G v a are required. For example, when the QCNR is 20 dB, the optimized ratio is R R σ Q σ Q = 2.3 . Then, a standard deviation of σ Q = 2.17 V is required. From Table 1, when the laser beam power is 100 μ A and the gain G v a is 100 times, σ Q = 1.376 V, which is still smaller than the required 2.17 V. Under realistic conditions, we should choose a suitable QCNR ratio considering the laser beam power, gain G v a , required random number generation rate, and power together. In the experiment, we decrease R R σ Q σ Q to 20. In this case, H ¯ min decreases from 7.6 to 5.1, and σ Q = 0.25 V is required. The required the Gain G v a decreases to approximately 20 when the photoelectron current is 100 μ A. When the photoelectron current is 10 μ A, a gain G v a between 50 and 100 is required. We can select the parameters flexibly according to the actual application in which the MHz quantum random number generation rate is sufficient.
Based on the selected parameters above, the measured noise with σ M = σ E 2 + σ Q 2 = 0.27 V and the electronics noise with σ E = 0.028 V are drawn with red and black points, respectively, in Figure 9a. Figure 9b shows a histogram of the acquired data with a Gaussian distribution. The sample rate was f A D C = 200 kHz. The calculated H ¯ min using Equation (18) is 5.117 bits per sample. Data processing is based on an FPGA card in real time, which uses the Toeplitz matrix to extract the random number according to H ¯ min [42]. Finally, a quantum random number generation rate f R = f A D C · H ¯ min = 1.02 megabits per second can be achieved.
The NIST SP 800-22 suite was employed to test randomness. The total amount of extracted random numbers used for the test is 1 gigabit. The results in Figure 9c demonstrate that the random numbers successfully passed the test, indicating that the generated random sequence has good statistical characteristics.
When the QCNR works in an untrusted enviroment, and worst-case conditional min entropy should be utilized in extracting the quantum random number. Although the value of H min may be lower, we can choose ADC with a higher rate or resolution to increase the quantum random number generation rate.

5. Conclusions

In conclusion, we have reported a compact and low-power-consumption vacuum noise QRNG based on a hybrid chip comprising a commercial 1550 nm InP LD chip and a silicon chip integrating photonics that was fabricated using industry-standard active flow SOI technology. The packaged hybrid chip’s size is 8.8 × 2.6 × 1 mm 3 . A method for maximizing the QCNR at MHz is presented. The calculated noise power is consistent with the noise measurement results. A QCNR of approximately 9 dB can be achieved when the photoelectron current is 1 μ A. Because a high QCNR can be achieved when a low-power laser beam is injected, no high-value CC or temperature controller is used. Although the balancing structure is deleted, a CMRR greater than 40 dB can still be achieved with an optimized 1 × 2 MMI coupler. Finally, the total power consumption of the entropy source is 80 mW. A tunable and high gain voltage amplifier is used to flexibly tune the standard deviation of the output noise. The required standard deviation according to the input voltage scale of the ADC is also analyzed. The standard deviation of the output noise voltage is adapted to the ADC in the digital circuit. The worst-case conditional min entropy and average conditional min entropy are both introduced, and a simple comparison is presented. QRNG has the potential for use in a scenario of moderate MHz random number generation speed, with low power, small volume, and low cost prioritized.
This study explores a technique for implementing a compact and low-cost QRNG module for practical applications. In the future, a higher generation speed is expected to be obtained based on the hybrid chip by increasing the TIA bandwidth. Further, we will integrate the optical and electrical components on one chip based on a standard CMOS manufacturing processes. Consequently, a more compact and low-cost QRNG can be realized.

Author Contributions

All authors contributed to this work. Writing—original draft preparation, X.W. and T.Z.; writing—review and editing, X.W., T.Z., Y.J., J.H., X.Z., Y.S., N.W., Z.L., J.Z. and Y.L. All authors have read and agreed to the published version of the manuscript.

Funding

This research was funded by the Provincial Natural Science Foundation of Shanxi, China (Grant No. 202103021224010), Shanxi Provincial Foundation for Returned Scholars, China (Grant No. 2022-016), Aeronautical Science Foundation of China (Grant No. 20200020115001), National Natural Science Foundation of China (Grant Nos. 62175138, 62205188, 11904219), the Program of State Key Laboratory of Quantum Optics and Quantum Optics Devices (Grant No. KF202006), the “1331 Project” for Key Subject Construction of Shanxi Province, China, and the Innovation Program for Quantum Science and Technology (2021ZD0300703).

Institutional Review Board Statement

Not applicable.

Informed Consent Statement

Not applicable.

Data Availability Statement

The original contributions presented in the study are included in the article, further inquiries can be directed to the corresponding authors.

Conflicts of Interest

The authors declare no conflicts of interest.

Appendix A

Figure A1. Typical TIA circuit based on an operation amplifier with different noise: (a) without noise, (b) with noise voltage of TIA u NV , and (c) with noise voltage of feedback resistance u RFT .
Photonics 11 00468 g0a1
Figure A1a shows the typical TIA based on the operation amplifier without noise; I denotes the input current, Z IN denotes the total input impedance, and Z F denotes the feedback impedance. The GBW is A 0 f 0 , which is the product of the open loop voltage gain A 0 and measurement frequency f 0 . Usually, the open loop gain of the amplifier can be expressed as follows:
A ( f ) = A 0 1 + i f / f 0 = U OUT U + U .
According to Kirchhoff’s current law,
I = U Z IN + U U OUT Z F .
Using Equations (A1) and (A2), the TIA gain can be calculated as follows:
G ( f ) = U o u t I = A ( f ) U U Z IN + U U o u t Z F = 1 1 Z F + 1 A f ( 1 Z F + 1 Z IN ) = 1 1 Z F + 1 A 0 ( 1 Z F + 1 Z IN ) + i f A 0 f 0 ( 1 Z F + 1 Z IN ) .
In the above derivation, the voltage U + is set to zero. Because A 0 is very large, the term
1 A 0 ( 1 Z F + 1 Z IN ) 1 Z F
can be neglected. The gain can then be simplified as follows:
G ( f ) = 1 1 Z F + i f GBW ( 1 Z F + 1 Z IN ) .
When the input current of the circuit is zero, Equation (A2) can be rewritten as follows:
U OUT = Z IN + Z F Z IN U .
The noise voltage source can be placed at the positive input port of the TIA (Figure A1b). In this case, U + = u NV . Using Equations (A1) and (A6), we obtain
U OUT = 1 1 1 A + Z IN Z IN Z IN + Z F Z IN + Z F A + Z IN Z IN Z IN + Z F Z IN + Z F u NV .
Using Equations (A3), (A5), and (A6), we obtain
U OUT = 1 1 Z IN + 1 1 Z F Z F Z IN + 1 1 Z F Z F u NV G f = i NV G f .
The thermal noise voltage of the feedback resistance is shown in Figure A1c, where the noise voltage density of the feedback resistance is v RFT = 4 k T R F . According to Kirchhoff’s current law,
U Z IN = U o u t U · 2 π i f C F + U o u t U u RFT R F .
Using Equation (A1) and setting U + = 0 , we obtain
U OUT = 4 k T 4 k T R F R F G f = i RFT G f .

References

  1. Herrero-Collantes, M.; Garcia-Escartin, J.C. Quantum random number generators. Rev. Mod. Phys. 2017, 89, 015004. [Google Scholar] [CrossRef]
  2. Ma, X.; Yuan, X.; Cao, Z.; Qi, B.; Zhang, Z. Quantum random number generation. Npj Quantum Inf. 2016, 2, 16021. [Google Scholar] [CrossRef]
  3. Bauke, H.; Mertens, S. Random numbers for large-scale distributed Monte Carlo simulations. Phys. Rev. E Stat. Nonlinear Soft Matter Phys. 2006, 75, 066701. [Google Scholar] [CrossRef]
  4. Martin, A.; Sanguinetti, B.; Lim, C.C.W.; Houlmann, R.; Zbinden, H. Quantum Random Number Generation for 1.25-GHz Quantum Key Distribution Systems. J. Light. Technol. 2015, 33, 2855–2859. [Google Scholar] [CrossRef]
  5. Liu, S.; Lu, Z.; Wang, P.; Tian, Y.; Wang, X.; Li, Y. Experimental demonstration of multiparty quantum secret sharing and conference key agreement. Npj Quantum Inf. 2023, 9, 92. [Google Scholar] [CrossRef]
  6. Tian, Y.; Zhang, Y.; Liu, S.; Wang, P.; Lu, Z.; Wang, X.; Li, Y. High-performance long-distance discrete-modulation continuous-variable quantum key distribution. Opt. Lett. 2023, 48, 2953–2956. [Google Scholar] [CrossRef]
  7. Wei, K.; Li, W.; Tan, H.; Li, Y.; Min, H.; Zhang, W.J.; Li, H.; You, L.; Wang, Z.; Jiang, X.; et al. High-speed measurement-device-independent quantum key distribution with integrated silicon photonics. Phys. Rev. X 2020, 10, 031030. [Google Scholar] [CrossRef]
  8. Wei, K.; Hu, X.; Du, Y.; Hua, X.; Zhao, Z.; Chen, Y.; Huang, C.; Xiao, X. Resource-efficient quantum key distribution with integrated silicon photonics. Photonics Res. 2023, 11, 1364–1372. [Google Scholar] [CrossRef]
  9. Du, Y.; Zhu, X.; Hua, X.; Zhao, Z.; Hu, X.; Qian, Y.; Xiao, X.; Wei, K. Silicon-based decoder for polarization-encoding quantum key distribution. Chip 2023, 2, 100039. [Google Scholar] [CrossRef]
  10. Huang, C.; Chen, Y.; Jin, L.; Geng, M.; Wang, J.; Zhang, Z.; Wei, K. Experimental secure quantum key distribution in the presence of polarization-dependent loss. Phys. Rev. A 2022, 105, 012421. [Google Scholar] [CrossRef]
  11. Jennewein, T.; Achleitner, U.; Weihs, G.; Weinfurter, H.; Zeilinger, A. A Fast and Compact Quantum Random Number Generator. Rev. Sci. Instrum. 2000, 71, 1675–1680. [Google Scholar] [CrossRef]
  12. Stipcevic, M.; Rogina, B.M. Quantum random number generator based on photonic emission in semiconductors. Rev. Sci. Instrum. 2007, 78, 045104. [Google Scholar] [CrossRef]
  13. Wayne, M.A.; Jeffrey, E.R.; Akselrod, G.M.; Kwiat, P.G. Photon arrival time quantum random number generation. J. Mod. Opt. 2009, 56, 516–522. [Google Scholar] [CrossRef]
  14. Wahl, M.; Leifgen, M.; Berlin, M.; Röhlicke, T.; Rahn, H.J.; Benson, O. An ultrafast quantum random number generator with provably bounded output bias based on photon arrival time measurements. Appl. Phys. Lett. 2011, 98, 171105. [Google Scholar] [CrossRef]
  15. Fürst, H.; Weier, H.; Nauerth, S.; Marangon, D.G.; Kurtsiefer, C.; Weinfurter, H. High speed optical quantum random number generation. Opt. Express 2010, 18, 13029–13037. [Google Scholar] [CrossRef]
  16. Ren, M.; Wu, E.; Liang, Y.; Jian, Y.; Wu, G.; Zeng, H. Quantum random-number generator based on a photon-number-resolving detector. Phys. Rev. A 2011, 83, 023820. [Google Scholar] [CrossRef]
  17. Wei, W.; Guo, H. Bias-free true random-number generator. Opt. Lett. 2009, 34, 1876–1878. [Google Scholar] [CrossRef]
  18. Gabriel, C.; Wittmann, C.; Sych, D.; Dong, R.; Mauerer, W.; Andersen, U.L.; Marquardt, C.; Leuchs, G. A generator for unique quantum random numbers based on vacuum states. Nat. Photonics 2010, 4, 711–715. [Google Scholar] [CrossRef]
  19. Shen, Y.; Tian, L.; Zou, H. Practical quantum random number generator based on measuring the shot noise of vacuum states. Phys. Rev. A 2010, 81, 063814. [Google Scholar] [CrossRef]
  20. Symul, T.; Assad, S.M.; Lam, P.K. Real time demonstration of high bitrate quantum random number generation with coherent laser light. Appl. Phys. Lett. 2011, 98, 231103. [Google Scholar] [CrossRef]
  21. Guo, H.; Tang, W.; Liu, Y.; Wei, W. Truly random number generation based on measurement of phase noise of a laser. Phys. Rev. E 2010, 81, 051137. [Google Scholar] [CrossRef]
  22. Qi, B.; Chi, Y.M.; Lo, H.K.; Qian, L. High-speed quantum random number generation by measuring phase noise of a single-mode laser. Opt. Lett. 2010, 35, 312–314. [Google Scholar] [CrossRef]
  23. Jofre, M.; Curty, M.; Steinlechner, F.; Anzolin, G.; Torres, J.; Mitchell, M.; Pruneri, V. True random numbers from amplified quantum vacuum. Opt. Express 2011, 19, 20665–20672. [Google Scholar] [CrossRef]
  24. Williams, C.R.; Salevan, J.C.; Li, X.; Roy, R.; Murphy, T.E. Fast physical random number generator using amplified spontaneous emission. Opt. Express 2010, 18, 23584–23597. [Google Scholar] [CrossRef]
  25. Bustard, P.J.; Moffatt, D.; Lausten, R.; Wu, G.; Walmsley, I.A.; Sussman, B.J. Quantum random bit generation using stimulated Raman scattering. Opt. Express 2011, 19, 25173–25180. [Google Scholar] [CrossRef]
  26. Marandi, A.; Leindecker, N.C.; Vodopyanov, K.L.; Byer, R.L. Twin Degenerate OPO for Quantum Random Bit Generation. In Proceedings of the Nonlinear Optics: Materials, Fundamentals and Applications, Kauai, HI, USA, 17–22 July 2011; Optica Publishing Group: Washington, DC, USA, 2011; p. NME4. [Google Scholar]
  27. Bruynsteen, C.; Gehring, T.; Lupo, C.; Bauwelinck, J.; Yin, X. 100-Gbit/s integrated quantum random number generator based on vacuum fluctuations. PRX Quantum 2023, 4, 010330. [Google Scholar] [CrossRef]
  28. Raffaelli, F.; Ferranti, G.; Mahler, D.H.; Sibson, P.; Kennard, J.E.; Santamato, A.; Sinclair, G.; Bonneau, D.; Thompson, M.G.; Matthews, J.C. A homodyne detector integrated onto a photonic chip for measuring quantum states and generating random numbers. Quantum Sci. Technol. 2018, 3, 025003. [Google Scholar] [CrossRef]
  29. Tasker, J.F.; Frazer, J.; Ferranti, G.; Allen, E.J.; Brunel, L.F.; Tanzilli, S.; D’Auria, V.; Matthews, J.C. Silicon photonics interfaced with integrated electronics for 9 GHz measurement of squeezed light. Nat. Photonics 2021, 15, 11–15. [Google Scholar] [CrossRef]
  30. Bruynsteen, C.; Vanhoecke, M.; Bauwelinck, J.; Yin, X. Integrated balanced homodyne photonic–electronic detector for beyond 20 GHz shot-noise-limited measurements. Optica 2021, 8, 1146–1152. [Google Scholar] [CrossRef]
  31. Bai, B.; Huang, J.; Qiao, G.R.; Nie, Y.Q.; Tang, W.; Chu, T.; Zhang, J.; Pan, J.W. 18.8 Gbps real-time quantum random number generator with a photonic integrated chip. Appl. Phys. Lett. 2021, 118, 264001. [Google Scholar] [CrossRef]
  32. Abellan, C.; Amaya, W.; Domenech, D.; Muñoz, P.; Capmany, J.; Longhi, S.; Mitchell, M.W.; Pruneri, V. Quantum entropy source on an InP photonic integrated circuit for random number generation. Optica 2016, 3, 989–994. [Google Scholar] [CrossRef]
  33. Siew, S.Y.; Li, B.; Gao, F.; Zheng, H.Y.; Zhang, W.; Guo, P.; Xie, S.W.; Song, A.; Dong, B.; Luo, L.W.; et al. Review of silicon photonics technology and platform development. J. Light. Technol. 2021, 39, 4374–4389. [Google Scholar] [CrossRef]
  34. Kaur, P.; Boes, A.; Ren, G.; Nguyen, T.G.; Roelkens, G.; Mitchell, A. Hybrid and heterogeneous photonic integration. APL Photonics 2021, 6, 061102. [Google Scholar] [CrossRef]
  35. Hu, Y.Y.; Ding, Y.Y.; Wang, S.; Yin, Z.Q.; Chen, W.; He, D.Y.; Huang, W.; Xu, B.J.; Guo, G.C.; Han, Z.F. Compact quantum random number generation using a linear optocoupler. Opt. Lett. 2021, 46, 3175–3178. [Google Scholar] [CrossRef]
  36. Jia, Y.; Wang, X.; Hu, X.; Hua, X.; Zhang, Y.; Guo, X.; Zhang, S.; Xiao, X.; Yu, S.; Zou, J.; et al. Silicon photonics-integrated time-domain balanced homodyne detector in continuous-variable quantum key distribution. arXiv 2023, arXiv:2305.03419. [Google Scholar]
  37. Wang, S.; Xiang, X.; Zhou, C.; Zhai, Y.; Quan, R.; Wang, M.; Hou, F.; Zhang, S.; Dong, R.; Liu, T. Simulation of high SNR photodetector with LC coupling and transimpedance amplifier circuit and its verification. Rev. Sci. Instrum. 2017, 88, 013107. [Google Scholar] [CrossRef]
  38. Masalov, A.; Kuzhamuratov, A.; Lvovsky, A. Noise spectra in balanced optical detectors based on transimpedance amplifiers. Rev. Sci. Instrum. 2017, 88, 113109. [Google Scholar] [CrossRef] [PubMed]
  39. Jin, X.; Su, J.; Zheng, Y.; Chen, C.; Wang, W.; Peng, K. Balanced homodyne detection with high common mode rejection ratio based on parameter compensation of two arbitrary photodiodes. Opt. Express 2015, 23, 23859–23866. [Google Scholar] [CrossRef]
  40. Wang, X.Y.; Guo, X.B.; Jia, Y.X.; Zhang, Y.; Lu, Z.G.; Liu, J.Q.; Li, Y.M. Accurate shot-noise-limited calibration of a time-domain balanced homodyne detector for continuous-variable quantum key distribution. J. Light. Technol. 2023, 41, 5518–5528. [Google Scholar] [CrossRef]
  41. Haw, J.Y.; Assad, S.; Lance, A.; Ng, N.; Sharma, V.; Lam, P.K.; Symul, T. Maximization of extractable randomness in a quantum random-number generator. Phys. Rev. Appl. 2015, 3, 054004. [Google Scholar] [CrossRef]
  42. Lu, Z.; Liu, J.; Wang, X.; Wang, P.; Li, Y.; Peng, K. Quantum random number generator with discarding-boundary-bin measurement and multi-interval sampling. Opt. Express 2021, 29, 12440–12453. [Google Scholar] [CrossRef]
Figure 1. QRNG scheme and images: (a) scheme, (b) hybrid chip structure, (c) microphotograph of the hybrid chip, and (d) analog circuit. GC: grating coupler, CC: constant current, PD: photodiode, MMI: multimode interferometer, HPF: high-pass filter, PCB: printed circuit board, ADC: analog-to-digital converter, SPI: silicon photonics integrated.
Photonics 11 00468 g001
Figure 2. BHD noise model. C TF : total capacitance in the feedback loop; C TIN : total capacitance in the input port.
Photonics 11 00468 g002
Figure 3. Noise current densities versus frequency in BHD based on (a) GeSi and (b) InGaAs photodiodes.
Photonics 11 00468 g003
Figure 4. Transimpedance gain mode and output noise voltage densities versus frequency: (a) transimpedance gain mode G ( f ) and (b) output noise voltage densities.
Photonics 11 00468 g004
Figure 5. Calculated and measured noise power of BHD based on two types of photodiodes. Calculated results with GeSi photodiode: (a) DC to 2 MHz and (b) DC to 10 MHz. Measurement results with GeSi photodiode: (c) DC to 2 MHz and (d) DC to 10 MHz. Measurement results with InGaAs photodiode: (e) DC to 2 MHz and (f) DC to 10 MHz.
Photonics 11 00468 g005
Figure 6. Optimized 1 × 2 MMI structure: (a) size of 1 × 2 MMI. (b) Simulated power distribution at 1550 nm wavelength. (c) Transmission efficiency versus core length. (d) Transmission efficiency versus wavelength. The coordinates of black circles corresponding to optimized values are presented in (c,d).
Photonics 11 00468 g006
Figure 7. CMRR measurement results of BHD based on (a) GeSi photodiode and (b) InGaAs photodiode.
Photonics 11 00468 g007
Figure 8. The min entropies versus the ratio R R σ Q σ Q . (a) Average conditional min entropy; (b) Worst-case conditional min entropy.
Photonics 11 00468 g008
Figure 9. (a) Time traces of obtained quantum and classical noise data, (b) histogram of obtained quantum and classical noise data, and (c) randomness test result.
Photonics 11 00468 g009
Table 1. Standard deviations at different gain G v a and photoelectron currents.
Gain G v a σ E (V) σ Q @ 1 μA (V) σ Q @ 10 μA (V) σ Q @ 100 μA (V)
100.00580.01530.04740.1537
200.01120.02670.09330.2923
500.02820.07460.20680.6607
1000.05660.13860.44021.3764
Disclaimer/Publisher’s Note: The statements, opinions and data contained in all publications are solely those of the individual author(s) and contributor(s) and not of MDPI and/or the editor(s). MDPI and/or the editor(s) disclaim responsibility for any injury to people or property resulting from any ideas, methods, instructions or products referred to in the content.