Abstract
The influence of the interference between coherent processes in third-order nonlinear Raman scattering on the spectral shapes of Raman-scattered light waves is numerically modeled and discussed in the cases of commonly used coherent Raman spectroscopy techniques. The effects on the lineshapes depending on the laser intensity are analyzed for the coherent Raman spectroscopy performed via the excitation of molecular systems with focused laser pulses at high intensities. In this case, the interplay between the coherent processes in nonlinear Raman scattering, as well as laser power-induced resonance effects, may be significant and should be taken into account in the spectral lineshape analysis in coherent Raman spectroscopy and its related applications, since the coherent Raman spectra may be considerably modified.
1. Introduction
It is known from the basic theory of nonlinear Raman scattering [1,2,3,4,5,6] that two types of nonlinear optical (NLO) processes may be simultaneously induced by the laser-field excitation of NLO media having Raman responses: stimulated Raman scattering (SRS) and Raman-resonant four-wave mixing (RRFWM), both being described by the third-order (cubic) NLO susceptibility () of the medium (Raman susceptibility). Sharing the common energy levels of the NLO medium, these processes interact within the medium. The interference, i.e., the interplay between them (and in some cases, the competition) through , is well established theoretically and experimentally in atomic/molecular systems, and a large number of studies have been devoted to the characterization of its complex physical mechanism related to the third-order Raman response of NLO media. Examples of interference effects between the key physical processes of coherent Raman scattering in NLO media, that have been known for a long time, are the destructive interference between SRS and RRFWM (the parametric suppression of Raman gain) [7,8], that between stimulated hyper-Raman scattering and RRFWM [9,10], the constructive interference of SRS and optical four-wave mixing (FWM) having a common emission channel [11], Raman gain coherently added to SRS through RRFWM in coherent Raman mixing (biharmonic pumping without probe wave) [2,12], and the combined RRFWM-SRS action resulting in a photon exchange and energy transfer to the Raman-active NLO media [13,14,15].
Conventionally, at a moderate excitation laser intensity, the spectral information from RRFWM (coherent anti-Stokes Raman scattering (CARS) and coherent Stokes Raman scattering (CSRS)) is derived by analyzing the corresponding experimentally obtained lineshapes of coherent Raman spectra (CRS), defined as . At a relatively high excitation laser intensity, however, in the RRFWM lineshape analysis it is reasonable to consider the effect of parallel-running coherently stimulated Raman scattering: SRS in the Stokes region in the CSRS process and the inverse Raman scattering affecting the anti-Stokes wave in the CARS process. To the best of the author’s knowledge, the influence of RRFWM-SRS interference on the spectral shapes of the coherent NLO processes when the Raman-active medium is pumped with focused high-intensity nanosecond (ns) laser pulses has not been considered in coherent Raman spectroscopy, unlike the effects of the laser’s linewidth (e.g., [16,17,18,19,20]), the effects of the temporal profile of the laser pulses (e.g., [21]), and the effects of pump intensity fluctuations (e.g., [17]).
Furthermore, under high-intensity resonant excitation, the Raman susceptibility can not be regarded as constant. In the field of coherent Raman spectroscopy, this situation has been discussed for some cases [22,23,24], but little attention has been paid to the effects of pump laser intensity on CRS. A detailed understanding of all these laser intensity-induced processes is currently of research interest and of practical significance, e.g., for analytical and sensing applications of CRS where lineshape analysis is of central importance. Contemporary research based on the basic concept of the nonlinear interaction and interference of the involved coherent light waves is related to theoretical approaches and numerical analyses under constant-field approximation (e.g., [14]), as well as constant-intensity approximation (e.g., [25]). In the latter case, Kasumova and co-authors reported in their recent study [25] based on the theory of coupled waves, a detailed analysis of CARS near the exact resonance, and the behavior of the intensity of the anti-Stokes scattering component examined as a function of the length of the nonlinear medium, phase mismatch, pump and signal intensity, and the self-action of the light wave in Raman-active NLO media.
In the present work, based on the classical description of nonlinear Raman processes, the aim is to model how the nonlinear RRFWM-SRS interference can change the shapes of CRS excited with intense laser pulses. Also, the impact of the laser beam intensity on and thus on the lineshapes of resonance CRS is numerically modeled in a strong excitation regime. The results will give the possibility to correct the lineshape analysis of CRS for molecular systems, in particular, molecular condensed media, in cases when these effects are significant.
2. CRS in the Presence of SRS
Let us briefly recall the fundamentals and the basic description of the interaction between the processes RRWFM and SRS. In case of slowly varying amplitude approximation and under other common assumptions [1,6], one can take the following coupled equations for the complex field amplitudes and of the Stokes and anti-Stokes wave, respectively [6]:
that describe the propagation of the Stokes and anti-Stokes waves in the absence of pump depletion, i.e., for a small conversion of laser light into scattered light. These equations also describe a forward FWM process. Here is the phase mismatch for RRFWM in the Z-direction (the pump-laser beam), and are the wavenumber vectors of the excitation laser, and Stokes and anti-Stokes waves with frequencies , , and , respectively. (), where is the value of the index of optical refraction as a function of the wave frequency ). The nonlinear-coupling coefficients λ’s include the corresponding Raman susceptibilities χ’s of the NLO medium and determine the spectra. Since , and assuming for the projections and on the z-direction:
it follows
where the complex parameter Y is
with the complex amplitude of excitation laser field assumed to be constant (a non-depleting pump). In the next, the off-resonance interaction with the medium is considered (i.e., when the incoming laser wavelengths are tuned far from any of the electronic absorption edges of the sample), and the linear absorption (coefficients) of the medium and the optical losses are ignored for simplicity.
For an isolated Raman resonance t → g at vibrational frequency , the resonant part of the Raman susceptibility expressed by the Raman linewidth Γtg and the Raman shift (the detuning from the exact Raman resonance) can be taken in the form
where R is a real constant. The addition of non-resonant background B (whose value is assumed to be real and only weakly frequency-dependent, so assumed to be frequency non-dependent) leads to and . For convenience, in calculations, it can be used as
At some experimental conditions, the RRFWM processes are decoupled from the SRS, with which they share common excitation/emission channels, and can be registered separately [5,26]. If the second coherent term in Equation (1a) corresponding to the RRFWM process is neglected, for NLO interaction in the medium extended in space from 0 to , one obtains a simple expression for the intensity of the Stokes wave:
which describes an amplification for the “pure” SRS, as well as the technique “Raman gain spectroscopy” (RG) at . If the same is applied to Equation (1b), then the solution in this case is
which represents the “Raman loss” (RL) .
By taking only the second term in Equations (1a) and (1b), an isolated parametric process of RRFWM is described. This is the case when is relatively low and the threshold of the SRS processes is not reached. Then, one derives from Equation (1a) at const the “pure” CSRS spectrum
and from Equation (1b) at const, the “pure” CARS spectrum
both with lineshapes given by the squared modulus of the Raman susceptibility. This idealization is assumed in CARS/CSRS spectroscopy (and its related applications) and the CRS lineshape analysis is done modeling the spectra with .
In reality, as is known, the SRS and RRFWM coherent processes can act together and interfere [1,6,9,13,27,28]. To account for this situation, one may solve Equation (1b) and derive the corresponding field of the anti-Stokes component (for CARS and RL) at const and const. Similarly, the integration of Equation (1a) alone gives the field of the Stokes component (for CSRS and RG) at const and const. Since the solutions:
present neither SRS, nor pure RRFWM, some differences from the four idealized spectral shapes described by Equations (7) and (8) should occur in the CRS at certain values of Y, z, and . In the following, using the solutions expressed by Equations (9a) and (9b), the corresponding lineshapes of the CRS will be checked and will be verified under what conditions they are still described by using the conventionally accepted lineshapes: for RRFWM, and Lorentzian lineshapes for RG/RL.
The calculations were done using MathCad (v. 2.52) computer software (MathSoft Inc., Cambridge, MA, USA). The spectral shapes were computed for four values of in the range of esu (⇔ laser light intensity 4.5 for the linear polarization of the light and the refractive index of the NLO medium ), i.e., an extreme light intensity is not reached. In a good approximation, one can accept that at off-resonance does not depend on for such intensity values. Any photo-induced changes of , e.g., caused by population redistribution, enhancement due to a molecular alignment induced by the pumping, etc., are also neglected. Additionally, it is assumed that no saturation due to two- or multi-photon absorption and ionization, or other nonlinear processes, takes place. Also, is assumed to be constant in the narrow range of frequencies where the considered lineshapes were calculated for three values , , and (bearing in mind that phase-mismatch is possible in condensed-phase CARS experiments with focused beams). Moreover, in cases of strongly focused beams, similar values of scalar wave-vector mismatch can lead to a nonzero value of the phase-matching integral [29] and can even be optimal for the parametric amplification in FWM of the type [29], which can be a FWM involving Raman () photon.
The length of the active zone of NLO interaction was taken to be cm, which is a reasonable length for experimental conditions in condensed media. The other model parameters necessary for the calculations were fixed to be and , the Raman linewidth , and 2. The non-resonance cubic susceptibility B was taken to be comparable to the Raman susceptibility in order to distinguish, in the spectra, the features of RRFWM processes from those of SRS. The value esu (⇔ 1.4 × according to [30]) was chosen to be between esu (typical for standard organic solvents [31] and transparent organic amorphous polymers [32,33], as evaluated by CARS spectroscopy and lineshape analysis at visible wavelengths) and esu (π-conjugated organic polymers, e.g., some polydiacetylenes [34]). Since the calculated results essentially depend on B, it should be noted that the results for the pairs { esu; esu}, { esu; esu}, and { esu; esu, e.g., measured for semiconductor-doped glasses [35,36,37]} are the same if the other model parameters are kept fixed. In this sense, the meaning of ‘high-intensity off-resonant excitation’ is relative; moreover, the usual small-signal-limited FWM theory is used here.
2.1. CARS and CSRS Spectra Influenced by SRS
The CARS spectroscopy technique implies that the ratio of the input () amplitudes of the Stokes and anti-Stokes waves is high. Figure 1 presents the anti-Stokes spectra calculated by Equation (9a) for and for three values of . As it is seen in Figure 1, the lineshape of the spectrum of the anti-Stokes wave computed for a low value of is close to the FWM lineshape (i.e., the -shape corresponding to the spectrum calculated according to Equation (8b)), and the phase mismatch plays no important role. However, the increase in leads to considerable deviations from -shape. Due to the SRS involved, at a large , the spectrum of the anti-Stokes emission develops from RRFWM-CARS to a spectrum having RL-like features. Furthermore, a broadening and a splitting of the lineshape arise. The effect is different and asymmetrical for positive and negative values of the -pairs, as follows from the coherent character of the process and since .
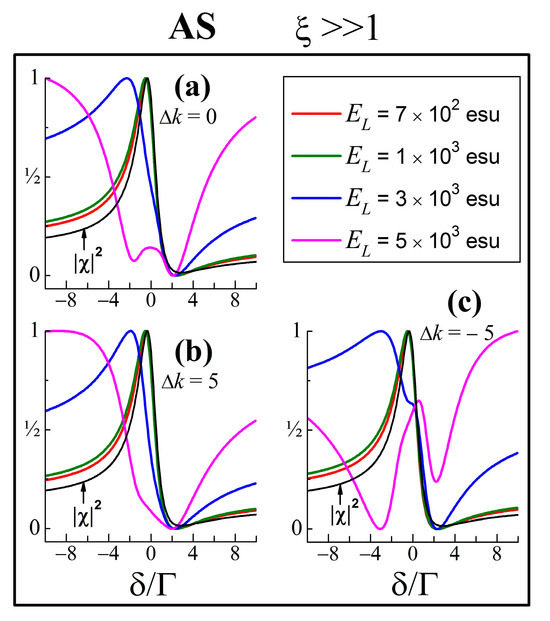
Figure 1.
Normalized anti-Stokes spectra calculated using Equation (9a) for at various values of the amplitude of the excitation laser field and phase mismatch: (a) ; (b) ; (c) ; for the other model parameters, see the text in Section 2.1. The -shape is given for comparison (black line).
The results for the Stokes wave obtained by the use of Equation (9b) with (just for CSRS), and for the same conditions as above, are shown in Figure 2. At a low , the Stokes lineshape is also close to the -profile, but the increase in enhances the influence of SRS, and this can result in a compression of this spectrum to a symmetrical spectral line within the Lorentzian . According to the model, the Stokes wave starts as CSRS, then develops as RG, following the rise in . It can be pointed out that in contrast to the anti-Stokes wave considered above, the changes differ little for different . At a large , the differences disappear since the process becomes essentially stimulated.
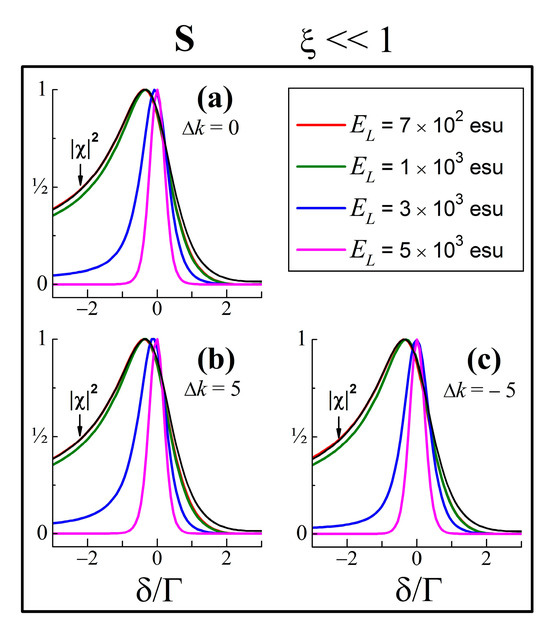
Figure 2.
Normalized Stokes spectra calculated using Equation (9b) for at various values of and . The -shape is given for comparison (black line). The system parameters for this figure are the same as for Figure 1.
Analyzing Equations (9a) and (9b), e.g., for the case where (or ), one obtains a simple condition for the coincidence of the CARS/CSRS spectral shapes with the -spectrum, where = (δ) builds the gain for SRS. In our case, this condition can be re-written as
which also applies to the retention of the Lorentzian shape of the RG/RL spectra that are discussed for completeness below.
2.2. Raman Gain (Loss) Spectra
For , the RG spectra calculated by Equation (9b) for the same values of as above are shown in Figure 3a. In this case, the increase in compresses the lineshape of the Stokes emission within the Lorentzian , i.e., the process remains an RG, but with a spectrum which is not Lorentzian. On the other hand, for Equation (9a) gives the RL spectra (Figure 3b). In contrast to the RG, an increase in leads to a broadening of the RL spectra and may result even in their saturation. In both cases (Figure 3a,b), does not affect the lineshapes, because the condition for RG and RL, imposed by ξ, cancels the second coherent terms in Equations (1a) and (1b).
3. The Effect of Stokes–Anti-Stokes Coupling on the Lineshapes of CRS
3.1. Δk 0
Previously, in Section 2, the processes of the development of Stokes and anti-Stokes waves were considered within the approximation of constant input fields and without coupling between the Stokes and anti-Stokes waves (S-AS coupling). As known [6,27,28], this effect can significantly change their intensity. Its influence on the CRS spectra should be inspected. Using the solution of the coupled Equations (1a) and (1b) [27,28], one can calculate the spectra and under the same assumptions and conditions, and for the same model parameters, as in Section 2.
Let us first consider the case for . Using the analytical solutions for the functions and given in Ref. [27], one obtains:
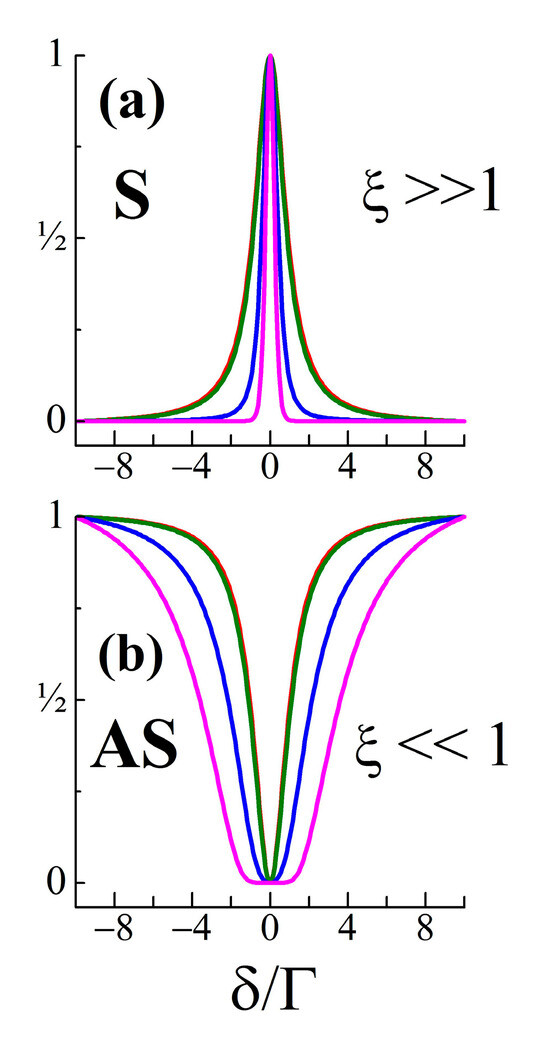
The results for ξ 1 (the condition for the realization of CARS and RG) are shown in Figure 4a,b, as calculated by Equations (11a) and (11b), respectively, for ξ = 103. The same values of used for spectra calculations in the previous section do not change the spectral shape of the anti-Stokes wave (CARS). It is locked to the -shape (Figure 4a) that is described by expression
derived from Equation (11a) for ξ 1 and relation , which is satisfied with the model parameters in our examples.
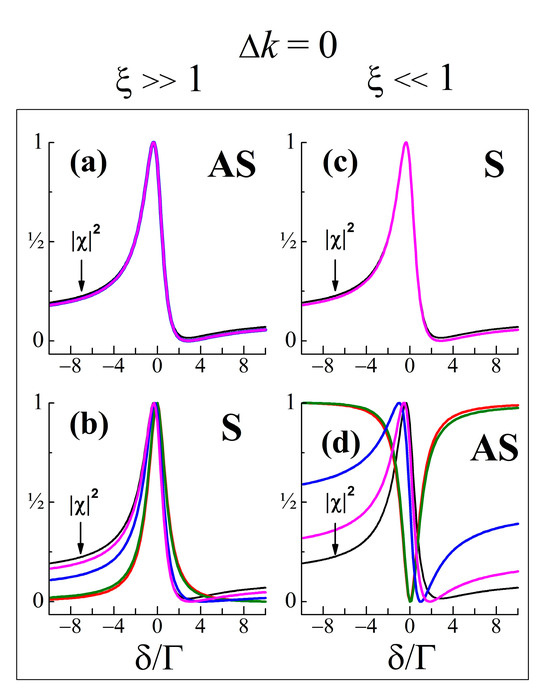
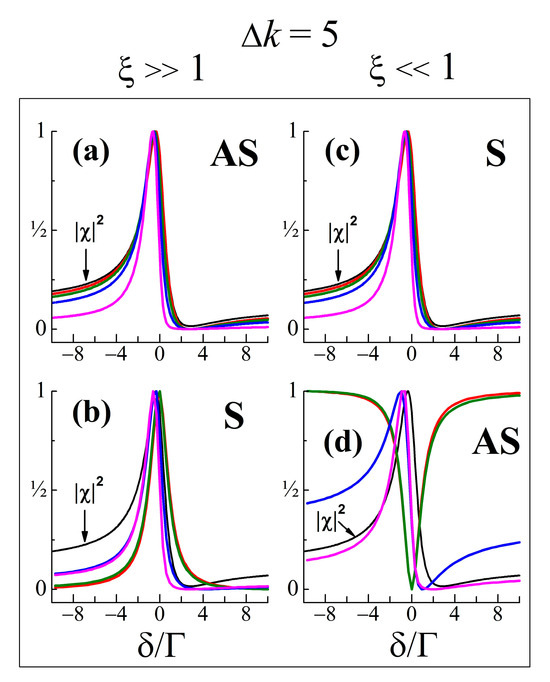
Figure 4.
Spectral shapes of coupled anti-Stokes (AS) (a,d) and Stokes (S) (b,c) light waves at . Calculations by Equations (11a) and (11b), respectively, for the two extreme cases of . The system parameters and the values of are the same as those for Figure 1, Figure 2 and Figure 3 (see the legends in Figure 1 and Figure 2). The -shape is given for comparison (black line).
On the other hand, the same values of do change the spectral shape of the Stokes light wave (Figure 4b). At a low , the Stokes wave has a lineshape of an RG, i.e., one that is close to the Lorentzian (Figure 4b). By increasing , due to amplification through energy transfer, the Stokes wave develops in a coherent emission whose lineshape approaches , which is characteristic of a coherent optical wave-mixing process. Indeed, at the Stokes wave takes the -shape, i.e.,
derived from Equation (11b) when the relation is fulfilled. The latter is reached at higher values of . They lead to a convergence of the spectral shapes of both the Stokes and anti-Stokes waves.
The spectra for (the condition for CSRS and RL) can be interpreted similarly. Calculated by Equations (11a) and (11b) for the same system parameters and values of as above, the Stokes spectrum (Figure 4c) is always locked to the -shape (CSRS), while the anti-Stokes wave at a low exhibits a spectral shape as RL (Figure 4d), and for a higher , it inverses into a coherent emission whose lineshape approaches , i.e., a spectrum of CSRS.
Thus, when the phase-match condition for FWM (, or ) is fulfilled, in the strong excitation regime, the interference between the nonlinear Raman scattering processes due to S-AS parametric coupling and energy exchange leads to the -profile of the CRS, in contrast to the trends shown by the use of the uncoupled equations in the previous section. This represents the known fact that no gain can be obtained in a pure parametric interaction (in this case, it refers to a Raman-gain suppression). The criterion for the convergence of RG/RL spectral shapes to the -spectrum may be written as
in cases of no saturation, as well as in the minimal competition of other possible NLO processes. Here, one can find an interesting potential possibility. Since the RG/RL lineshapes at a strong pump under the electronically off-resonant condition resemble the -spectral profile (i.e., provide almost the same spectral information as the CARS/CSRS spectroscopy), the RG/RL can be used instead of CARS/CSRS since RG/RL spectroscopy techniques enable some advantages in the experiment. Thus, from the complex interference lineshapes obtained by RG/RL experiments, one can evaluate the non-resonant third-order NLO susceptibility (i.e., the magnitude of the pure background contribution, B) of Raman-probed NLO media, without the need to perform FWM. The same applies to the determination of other important characteristics relevant to the studied Raman media, such as the values of the relaxation times, by means of lineshape analysis.
3.2. Δk 0
To analyze the case where (but not ), the solutions of the coupled Equations (1a) and (1b) can be used, in the functional form [27,28]:
where the notations , , and are expressed by [28] (pp. 153–154):
To model the shapes of the CRS, the same parameters as above were used. The spectra calculated for (Figure 5) show a narrowing of the shapes of the Stokes and anti-Stokes light waves with the increase in , because the Raman gain becomes essential (Equation (10) is again the determining condition). At a large the CRS approach a one-and-the-same narrowed lineshape.
For completeness, it should be noted that within the above model, the trend of increasing differences from the -shape in cases of CARS and CSRS with the increasing pump intensity holds by varying the value of , as well as the convergence to a similar narrowed shape for CARS; CSRS; RG; and RL. The narrowing of the lineshapes of the CRS becomes stronger as the dephasor (actually, the phase factor ) increases. As an example, Figure 6 illustrates this effect for the CARS spectra. Also, the lineshapes for the pairs of {negative; positive} values of may be asymmetric (Figure 6). This holds even for . Furthermore, as seen from Figure 6b, at relatively high pump laser intensity the CARS emission may exhibit spectral characteristics of purely stimulated CRS. All these circumstances suggest that at the application of the -form in the lineshape analysis of CARS/CSRS spectra in a strong excitation regime may be unacceptable. In such a case, to obtain adequate spectral information, the experimental data (the recorded CRS) have to be numerically fitted with the functions given by Equations (14a) and (14b). Notably, spectra modifications such as those discussed above for RG/RL were reported for SRS lineshapes in the large light–matter interaction limit under the electronically off-resonant condition in ps and fs regimes (e.g., [38,39]).
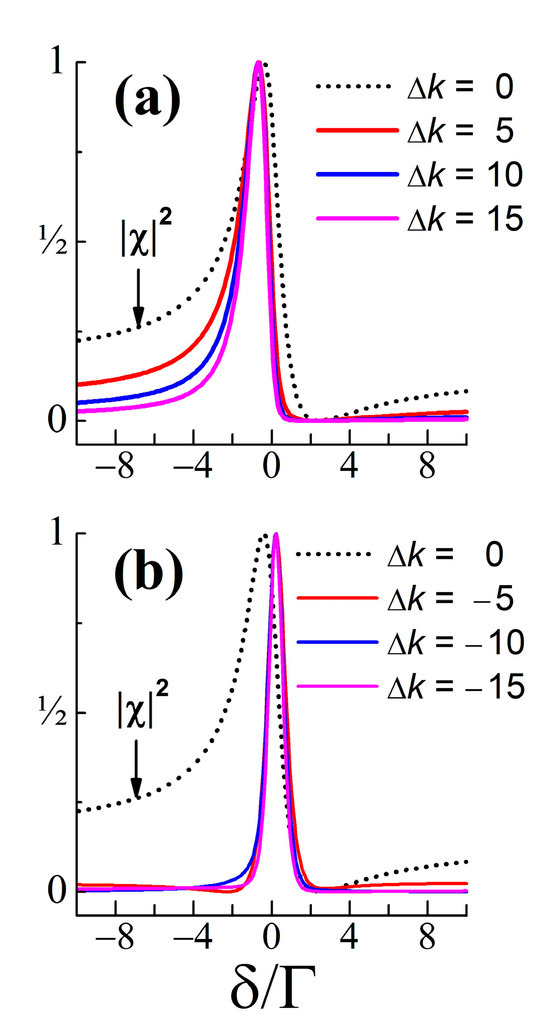
Figure 6.
Lineshapes of CARS spectra simulated by Equation (14a) at various positive (a) and negative (b) values of and for esu. The system parameters are the same as those for Figure 1, Figure 2, Figure 3, Figure 4 and Figure 5. The -shape (relevant to CARS at ) is given for comparison (black line).
3.3. Effect from Pump Depletion
When a depletion of the pump laser field over the NLO interaction length is included in the Raman waves interaction model, one can expect the most complete description of the coherent processes in nonlinear Raman scattering. Accordingly, the effect of the nonlinear pump’s depletion on the shapes of CRS was inspected here, as this is the realistic situation in the usual experiments on coherent Raman generation. For this purpose, the lineshapes of the CRS were calculated using the numerical solution of the set of the three coupled equations in the slowly varying amplitude approximation:
and the same system parameters as above (i.e., the same nonlinear coupling coefficients). The following initial conditions were taken: 10 esu, esu (and vice versa, in order to switch the parameter in the calculations), as well as esu and esu. The results from the numerical simulations with the same model parameters as above (an example is presented in Figure 7 for CARS and RG) show the same trends for the -dependent changes of the CRS lineshapes as in the non-depleted case. However, a significant narrowing of lineshapes takes place even at a low magnitude of the pump electric field. Therefore, if the pump depletion is significant, the CARS (and CSRS) lineshapes will not be close to , and the RG/RL lineshapes will not approximate in a strong excitation regime and at (or ). This is reasonable, bearing in mind that the nonlinear pump depletion gives rise mostly to the gain of SRS, which changes the shapes of the CRS regardless of the relatively short NLO interaction length (0.3 cm) chosen in the calculations.
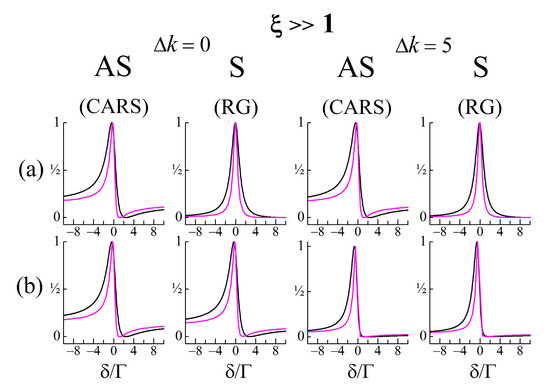
Figure 7.
Lineshapes of anti-Stokes (AS) and Stokes (S) spectra calculated according to the S-AS coupling model. A comparison of the cases with pump depletion (pink lines) and without pump depletion (black lines), for the pump laser field amplitude: (a) esu; (b) esu. The system parameters are the same as those for Figure 1, Figure 2, Figure 3, Figure 4, Figure 5 and Figure 6. Lineshapes corresponding to the non-depleted case (black lines) were calculated using Equations (11a) and (11b) for , and using Equations (14a) and (14b) for .
It should be emphasized that the depletion of the pump and the conversion of the pump into the coupled Stokes and anti-Stokes waves occurs (above a threshold) along the interaction length in the NLO medium. Hence, the eventual effect of pump depletion will be minimal in fs and ps microscopy, whose function is based on the CRS detection at very strong focusing and for very thin samples. Furthermore, the depletion of the laser power in the considered case depends on factors such as both the frequency and the spatial modes of the laser beam, the temporal and spatial fluctuations of the laser pulse/beam intensity, as well as the spatial distribution of the focused laser radiation. Nevertheless, in general, the effect from pump depletion on the generation and amplification of the coherently Raman-scattered waves with S-AS coupling will result in a narrowing of their lineshapes compared to the -profile. However, in some real experiments, a spectral broadening of CRS lineshapes has been observed, even at relatively low-intensity pumping. An example is the so-called ‘partially coherent anti-Stokes Raman scattering’ (pCARS), originally reported by Ishibashi and Hamaguchi [40]. In this specific case, the models described and discussed above can also be applied to explain the difference in pCARS spectral lineshapes from the expected CARS lineshapes.
4. RRFWM-SRS Interference and Lineshape Analysis in Coherent Raman Spectroscopy
As demonstrated in Section 2 and Section 3, at a relatively high , the spectral shape in coherent Raman spectroscopy can be changed due to the interference between the processes of RRFWM and SRS. The strict lineshape analysis has to recognize these changes. Reasonable questions concern the validity and the applicability of both models which mathematically describe the RRFWM-SRS interference and relevant shapes of the CRS: (i) without S-AS coupling and for constant fields of the input waves (constant-field approximation) (Section 2), and (ii) the coupling mechanism (Section 3). The model (i) (Equations (9a) and (9b)) is simple but only valid for excitation of the Raman-active medium at a relatively low laser intensity. The model (ii) (Equations (11a) and (11b) for , and Equations (14a) and (14b) for ) is more complex, however, it is more complete and realistic. It includes the re-bound of Stokes and anti-Stokes waves, hence, a better physical description of the dynamics of the processes and the parametric-stimulated dualism of the CRS upon high-intensity pumping could be expected. The Stokes and anti-Stokes waves are coupled most strongly near the phase-matching direction (). In other directions, they are also coupled, although rather weakly. Since, in reality, S-AS coupling is most efficient by increasing the , at a high pump intensity, we generally need the model (ii).
In the practically important case of CARS/CSRS, according to the coupling model, the pump does not modify the shapes of CARS/CSRS spectra taken at . As seen in Figure 4a,c, they remain close to the -profile and may be interpreted with it. However, besides the perfect phase match (or ), is also possible in the experiment and such CARS/CSRS spectra may need treatment with Equations (14a) and (14b). This happens, for example, when no phase-mismatch correction is undertaken during the record of the entire CARS spectrum when it is relatively broad. Since, except for the arrangements of passive phase matching (for example, [41]), the methods for automatically phase-matching justification (e.g., [42]) require the knowledge of the exact dispersion of the medium understudy, such a correction is not always possible. Also, this is the situation with the multiplex CARS spectra. In that case, by means of a strong reduction in the length (Z) of the NLO interaction (artificially, e.g., by the use of a liquid sample in a jet [43]), one can prevent the spectral restriction onto the broad CARS band [44], and simultaneously, the effects discussed here can be avoided if Equation (13) is not jet satisfied. In the modern laser scanning microscopy utilizing CARS [45,46,47,48,49] and CSRS [50], the phase mismatch is not critical because it is relaxed by strongly focusing the excitation laser beams into the sample.
In order to be compared, Figure 8 summarizes the shapes of CRS (without the normalization of their intensity) simulated by the two models, (i) and (ii), describing the interference between coherent Raman emissions under identical corresponding conditions, at , and for three values of , upon non-resonant (off-resonance) excitation as presumed in all the cases discussed above. At a relatively low , e.g., an esu as in the example in Figure 8, for the present set of model parameters, both models give identical lineshapes for each of the RG, RL, CARS, and CSRS spectra. In such a regime, the Stokes wave does not significantly affect the anti-Stokes wave and the CARS/CSRS spectra could be analyzed by the -shape, and RG/RL—with Lorentzian. At a higher , e.g., an esu, the example in Figure 8 demonstrates the large difference between the spectral shapes obtained with the models (i) and (ii), as well as the difference between their intensity changes. From the intensity changes of both anti-Stokes and Stokes waves, it is clear that an efficient coupling arises in such a strong excitation, i.e., the known parametric effect of an energy transfer between the coherent waves involved in the nonlinear Raman scattering. Hence, model (ii) (Equations (14a) and (14b)) has to be ultimately used for the lineshape analysis of CRS obtained in a strong excitation regime.
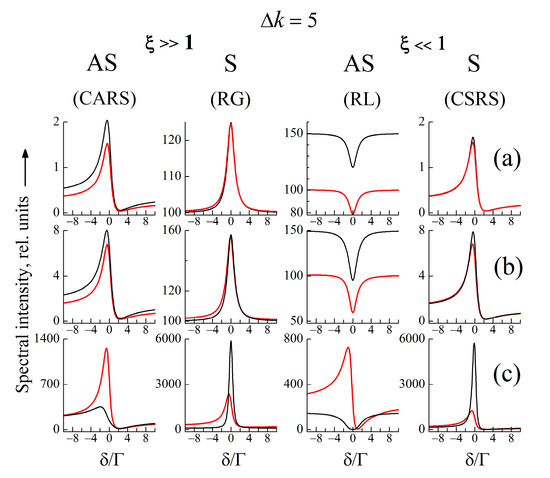
Figure 8.
Calculated spectra of anti-Stokes and Stokes CRS using both models: without coupling (black lines) and with the ‘coupling-effect’ (red lines) for : (a) esu; (b) esu; (c) esu. The system parameters are the same as those for Figure 1, Figure 2, Figure 3, Figure 4, Figure 5, Figure 6 and Figure 7.
5. Effect of the Pump on the Raman Susceptibility
In the previous sections, the Raman susceptibility was assumed to be constant with respect to the amplitude of the excitation (pump) laser. As is known, however, by using a high-intensity pump, an influence of on takes place, especially under resonant excitation [22,23] (for the meaning of ‘high intensity’ in these considerations, see [22]). In the field of laser spectroscopy, the problem with intensity-dependent material properties, in particular, the effect of the pump laser intensity on the NLO susceptibilities, has been thoroughly analyzed by many researchers. The possibility of a direct impact of the pump laser intensity on , which could affect the CRS obtained in a strong excitation regime, has to also be accounted for, since, in some cases, the intensity effects on the spectral shapes may be even larger than the effects analyzed in Section 2 and Section 3.
As a comparison with the above calculations, one can estimate the effect of the pump on the resonant Raman susceptibility , and hence, on the RRFWM spectral shapes. At a strong-intensity resonant excitation, cannot be regarded as constant. In a case of three-frequency resonance CARS (RCARS) , this effect has the following functional form given by Hurst and Wright [24] for one strong pump field and a four-level molecular system (g;t;k;j) with Raman transition g t (Figure 9):
where , and and are the frequency and relaxation constant of the transition i j, respectively, and is the Rabi frequency corresponding to the strong interaction (pump transition g k, with dipole moment ). The calculations of the RCARS spectral profiles were performed for the following system parameters: , ,,, , and without non-resonant background (B). Figure 10 presents the calculated RCARS spectra versus the detuning where and . For these values of the relaxation constants and , the RCARS spectral profile may be totally changed under strong excitation.
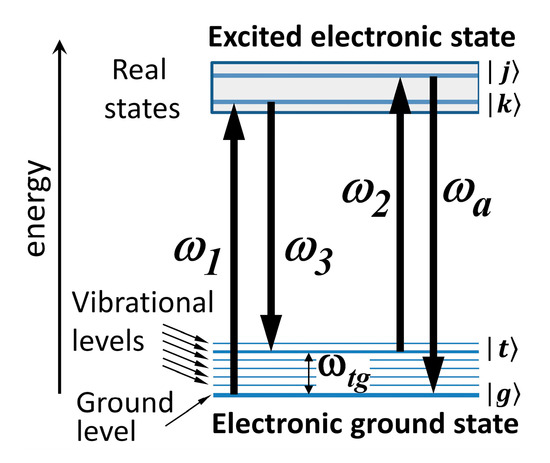
Figure 9.
Schematic of an energy-level configuration of a molecular system and a three-color variant of resonance CARS process .
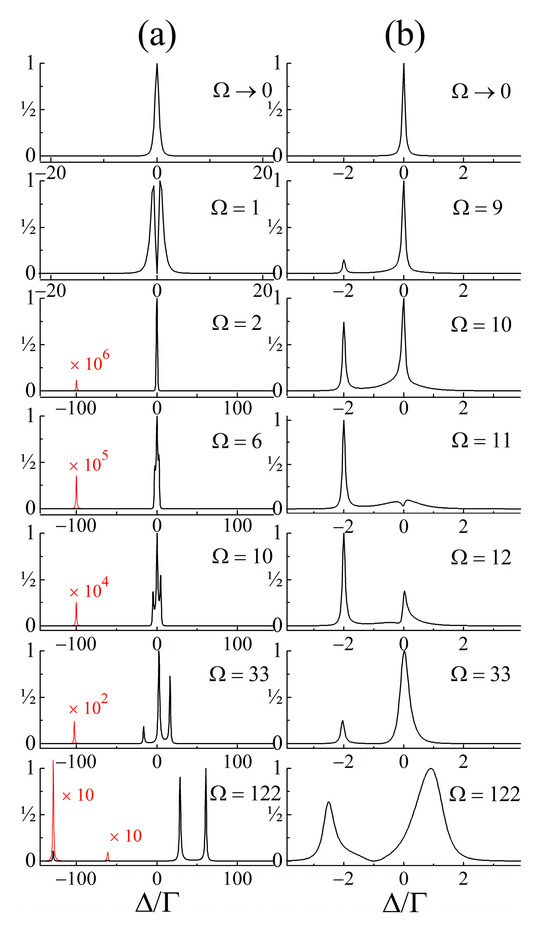
Figure 10.
Calculated three-frequency resonance CARS spectral profile , where is given by Equation (16) in the text. The values of Rabi frequency are in []. For value of 1 D of the transition dipole moment, corresponds to the amplitude esu of the driving electro-magnetic field (optical intensity ). For the system parameters used in cases (a,b), see the text.
In particular, the RCARS spectral shape computed for shown in Figure 10a is consistent with the experimental data for a fully resonant nonlinear line-narrowing demonstrated in an amorphous system by three-laser RCARS at nearly the same value of [24]. With the increasing pump laser intensity, the RCARS lineshape calculated according to Equation (16) can undergo transformation from a single line to a spectrum with four lines, in accordance with the predictions [51] for a splitting of resonances and the appearance of power-induced extra resonances in parametric processes, e.g., CARS, under strong excitation. The value of the Rabi frequency is reached, for example, at laser-field amplitude esu (optical intensity ) if , which is a typical value for a transition dipole moment of dipole-allowed optical transition. It has to be noted that the calculations in the example shown in Figure 10 are done under an all-resonant condition, i.e., for pump and probe (see Figure 9). Any detuning from these exact resonances leads to additional changes in the lineshape, or to completely other spectral profiles.
The simulated RCARS spectrum is strongly dependent on the set of Γ’s. To illustrate this, Γ’s in the example in Figure 10a are chosen to be small. On the other side, Figure 10b displays the spectral components in an RCARS spectrum calculated for the same other system parameters as those above, but with and , which are more realistic relaxations for an organic molecule, e.g., organic dye. In this case, when or greater, a laser power-induced spectral broadening is evident, as that in Ref. [51]. As seen from Figure 10b, the spectra transformations can appear at which is considerably lower than . Affected by a number of various factors and parameters, the trends in these changes in the resonance RRFWM spectra cannot be straightforwardly analyzed. Essential to the scope of this work is the fact that the -effect can mask the interference effects discussed above and even cancel them. In any case, for a proper lineshape analysis of the CRS at a strong excitation in this resonant case, Equation (16) has to be used. In general, with this functional form, one can perform complex multi-parameter fits of CRS recorded by frequency domain experiments, and thereby an information about the unknown relaxation constants of the probed NLO Raman medium can be obtained.
6. Discussion: Additional Remarks
The considered laser-induced modifications of the lineshapes of CRS at a relatively high laser intensity of excitation have not been analyzed in detail and discussed in the research and application fields of nonlinear Raman spectroscopy (e.g., [1,2,3,4,5,6,52,53,54,55]), since such hardly observed fine effects are displayed at specific conditions. To detect the effects discussed in Section 2 and Section 3, the CRS have to be recorded with a high spectral resolution (, or less) and with an excellent spectral purity. Obviously, this is not the case when employing broadband ps and fs laser pulses, or spectral continuum (supercontinuum) pulses, i.e., we need narrowband pulses (bandwidth , or less) provided by ns laser sources. The present modeling is actually performed considering such an excitation with monochromatic laser light.
To register the effect induced by the pump on the CRS lineshapes, the CRS recorded at a high pump laser intensity should be compared with the corresponding CRS obtained at a low laser pulse energy—a little above the threshold for the nonlinear Raman scattering. The reference spectrum should be taken under identical experimental conditions, except for the pump laser pulse energy value. Reasonably, isolated Raman lines with no adjacent Raman lines/bands are more suitable for such a comparison.
Further, for the correct interpretation of the effect, the value of in the experiment has to be known, since it can be crucial for the change of the lineshape of CRS (as shown in Section 3.2). Hence, the laser beam configuration geometry should be well-defined in the CRS measurements. With modern high-performance nonlinear Raman microscopy techniques, such as CARS, CSRS, and SRS, being widely used to provide chemical and spatial information at a microscale, the CRS signal is generated only at the focus, within a very small volume along a short length (Z). Due to the very strong focusing (Z ~ several micrometers) of the laser light on thin samples, numerous spatial projections in a range of many values of are possible beside = 0, for which the nonlinear coherent amplification of the parametric processes (CARS/CSRS) is the maximum. Thus, the effect of on the CRS lineshapes is hardly distinguishable in condensed-phase CARS experiments with focused and crossed laser beams (slightly crossed) in a phase-matching configuration.
The above considerations for CARS/CSRS also apply to narrowband ns or combined narrowband ns and broadband excitation (e.g., multiplex ns CARS using powerful Q-switched ns lasers). In any case, however, the maximum coherent output signal corresponds to the fulfilment of the phase-matching requirement for FWM (). As discussed in Section 3.1, in this case, the interference between the simultaneously induced nonlinear Raman scattering processes always results in -lineshapes of the CRS, or those tending to it upon strong excitation. That is why, the laser-induced effect on CRS lineshapes can be proven under special experimental conditions. Furthermore, the studied Raman-active materials (substances) are limited due to their resistivity to laser-induced damage. To some extent, molecular liquids such as benzene, nitrobenzene, toluene, which have a relatively strong Raman response, are proper samples to display the laser impact on the lineshapes of the CRS. However, mixtures of these liquids or their solutions in other organic solvents are not suitable for this purpose because the contribution of the local micro-interface effects and Rayleigh scattering [40] in these molecular systems can mask the -effect on the CRS lineshapes. Molecular crystals, organic polymers, and liquid crystals, even if they are optically transparent, exhibit strong Raman resonances and have relatively high NLO susceptibility , are also not suitable due to their low photodegradation/photodamage threshold.
A proper example of experimentally obtained results suggesting the effect induced by the pump laser pulses on the CRS lineshapes that can be straightforwardly analyzed is the phase-mismatched CARS—the so-called ‘partially coherent anti-Stokes Raman scattering’ (pCARS) observed by two-laser CARS experiments in neat toluene and benzene liquids [40]. Both these substances have distinct spectral signatures—strong (sharp and narrow) single Raman lines attributed to benzene ring Raman-active vibrations at (benzene) and (toluene) that have been investigated by pCARS experiments [40]. pCARS is a nonlinear Raman effect in which collinearly superimposed laser beams (pump and Stokes, with timely synchronized, spatially overlapped and frequency detuned pulses) focused in a Raman-active medium do not satisfy the phase-matching condition for FWM () but generate nonlinearly enhanced anti-Stokes signal. pCARS has been realized at a relatively low intensity of the pump in ns regime, and under the electrically non-resonant condition, i.e., the frequencies of the pump, Stokes and anti-Stokes waves are far from any electronic resonance of the medium. pCARS is an interesting spectroscopy tool because this kind of nonlinear Raman probe has some advantages over the conventional CARS technique. pCARS is a microsurface-specific vibrational optical spectroscopy, sensitive to optically inhomogeneous systems such as surfaces and colloids, for which the conventional CARS technique is not effective. pCARS can be used to investigate the local microstructure of such systems, and the fluctuations and intermolecular interactions in condensed media, such as liquids and solutions, as well as micro-interfaces.
In collinear geometry, the wavevector mismatch in neat benzene and toluene can be relatively large. Under the experimental conditions in Ref. [40], and , for benzene and toluene, respectively, as calculated using the data for dispersion of the refractive index of these liquids (at 27 °C) [56]. Therefore, the S-AS coupling at a Raman resonance is considerably weakened. Thus, unlike the ordinary phase-matched CARS, the amplification in pCARS during the wave interaction cannot be purely parametric. In this case, pCARS cannot be described by the model in Section 3. Also, the pump depletion is not effective in a weak excitation regime, as that of the pCARS realized in [40]. However, the mechanism of the amplification/generation in pCARS controlled by can be described with Equation (9a) when the input fields are not very strong.
The analysis of the spectral shapes of the emitted anti-Stokes spectrum in pCARS [40] indicated that they are close to the lineshape as modeled using the relevant parameters for toluene and benzene molecules. In fact, such a response corresponds to a parametric process (RRFWM-CARS). This is reasonable, taking into account the relatively low magnitude of the laser fields up to (laser pulse energy 0.02 mJ, laser fluence (optical energy density) ; laser pulse intensity used in the pCARS research work [40]. The impact of such a pump on a CARS lineshape should be considerably lower (recall Figure 1). Nevertheless, a broadening of pCARS lineshapes has been reported, which increases with the laser pulse intensity [40]. The experimentally obtained increase of the spectral linewidth (Γ) of the generated anti-Stokes light was from 1.05 to 1.2 for toluene, and from 1.3 to 2.2 for benzene [40]. This effect has not been explained. In accordance with the range of the laser pulse intensity used in [40], the spectral broadening of the anti-Stokes emission in pCARS in toluene and benzene can be numerically simulated with Equation (9a) by the use of model parameters consistent with the physical conditions in the pCARS experiments in [40]. In this case, despite the relatively low pump, lineshape broadening is evident. It results from the large and increases with the pump laser intensity, as shown in Figure 1.
7. Conclusions
Through the numerical modeling of coherent Raman scattering spectra, it is shown that under specific conditions, the complex interaction between the simultaneously running coherent Raman scattering processes can modify their spectral lineshapes. Cases are specified when such changes are important and should be considered in the lineshape analysis of coherent Raman scattering spectra in a strong excitation regime, when these spectra could not be modeled by the -shape, which is conventionally accepted. The spectra modeling considered here is for nanosecond laser excitation; as known, the excitation with ultrashort pulses (ps/fs) requires non-stationary theoretical modeling.
In the electronically off-resonance case, simple models based on classical equations were used here for analysis, disregarding all possible effects except those of the parametric interaction, i.e., the energy exchange between the Stokes, anti-Stokes, and pump waves. Even in this extremely simplified situation, in a strong excitation regime, the lineshapes of coherent Raman spectra could differ from the conventionally accepted ones. As expected, at a fixed length and in the other conditions for nonlinear optical interaction, this effect depends on the pump intensity and phase mismatch. In particular, the broadband CARS spectra generated at a relatively high pump-laser intensity should have spectral regions where the discussed interference effects take place.
The effects modeled here can be exploited to obtain spectroscopic information (the values of the material parameters of the studied Raman-active media) from data obtained by coherent Raman spectroscopy techniques: (1) in a strong excitation regime, RG/RL spectroscopy can be applied instead of CARS/CSRS, and (2) the resonance Raman-resonant four-wave mixing interaction can be used to derive the value of the dipole moments of strongly pumped molecular (electronic, vibronic) transitions, and to characterize the relaxation rates of molecular states (in specific cases of molecular systems).
Funding
This research was carried out within the framework of the project CoE “National Center of Mechatronics and Clean Technologies”, BG05M2OP001-1.001-0008-C01 (by the European Regional Development Fund) as a part of the Operational Program “Science and Education for Smart Growth 2014–2020”.
Institutional Review Board Statement
Not applicable.
Informed Consent Statement
Not applicable.
Data Availability Statement
No data were used in this study.
Conflicts of Interest
The author declares no conflicts of interest. The funders had no role in the design of the study; in the collection, analyses, or interpretation of data; in the writing of the manuscript; or in the decision to publish the results.
References
- Bloembergen, N. Nonlinear Optics; W.A. Benjamin Inc.: New York, NY, USA, 1965. [Google Scholar]
- Hanna, D.C.; Yuratich, M.A.; Cotter, D. Nonlinear Optics of Free Atoms and Molecules; Springer Series in Optical Sciences; Springer: Berlin/Heidelberg, Germany, 1979; Volume 17. [Google Scholar]
- Levenson, M.D.; Song, J.J. Coherent Raman spectroscopy. In Coherent Nonlinear Optics: Recent Advances; Topics in Current Physics; Feld, M.S., Letokhov, V.S., Eds.; Springer: Berlin/Heidelberg, Germany, 1980; Volume 21, pp. 293–371. [Google Scholar]
- Akhmanov, S.A.; Koroteev, N.I. Methods of Nonlinear Optics in Spectroscopy of Light Scattering; Nauka: Moscow, Russia, 1981. (In Russian) [Google Scholar]
- Eeslley, G.L. Coherent Raman Spectroscopy; Pergamon Press: Oxford, UK, 1981. [Google Scholar]
- Bloembergen, N.; Shen, Y.R. Coupling between vibrations and light waves in Raman laser media. Phys. Rev. Lett. 1964, 12, 504–507. [Google Scholar] [CrossRef]
- Malakyan, Y.P. Self-induced destructive interference suppression of stimulated electronic Raman scattering. J. Phys. B 1990, 23, 131–146. [Google Scholar] [CrossRef]
- Sogomonian, S.; Grigorian, G.; Grigorian, K. Parametric suppression of Raman gain in coherent Raman probe scattering. Opt. Commun. 1998, 152, 351–354. [Google Scholar] [CrossRef]
- Moore, M.A.; Garrett, W.R.; Payne, M.G. Suppression of electronic hyper-Raman emission by four-wave mixing interference. Opt. Commun. 1988, 68, 310–316. [Google Scholar] [CrossRef]
- Deng, L.; Garrett, W.R.; Payne, M.G.; Moore, M.A. Gain suppression involving both stimulated Raman and hyper-Raman photons in two-step stimulated emissions. Chem. Phys. Lett. 1997, 270, 299–303. [Google Scholar] [CrossRef]
- Dinev, S.G.; Hadjichristov, G.B.; Stefanov, I.L. Interference effects between Raman and parametric stimulated emission. Appl. Phys. B 1989, 49, 521–525. [Google Scholar] [CrossRef]
- Qian, S.X.; Snow, J.B.; Chang, R.K. Coherent Raman mixing and coherent anti-Stokes Raman scattering from individual micrometer-size droplets. Opt. Lett. 1985, 10, 499–501. [Google Scholar] [CrossRef] [PubMed]
- Bobbs, B.; Warner, C. Raman-resonant four-wave mixing and energy transfer. J. Opt. Soc. Am. B 1990, 7, 234–238. [Google Scholar] [CrossRef]
- Vermeulen, N.; Debaes, C.; Thienpont, H. The behavior of CARS in anti-Stokes Raman converters operating at exact Raman resonance. IEEE J. Quantum Electron. 2008, 44, 1248–1255. [Google Scholar] [CrossRef]
- Vermeulen, N.; Debaes, C.; Thienpont, H. Coherent anti-Stokes Raman scattering in Raman lasers and Raman wavelength converters. Laser Photon. Rev. 2010, 4, 656–670. [Google Scholar] [CrossRef]
- Yuratich, M.A. Effects of laser linewidth on coherent antiStokes Raman spectroscopy. Mol. Phys. 1979, 38, 625–655. [Google Scholar] [CrossRef][Green Version]
- Agarwal, G.S.; Singh, S. Effect of pump fluctuations on line shapes in coherent anti-Stokes Raman scattering. Phys. Rev. A 1982, 25, 3195–3205. [Google Scholar] [CrossRef]
- Kataoka, H.; Maeda, S.; Hirose, C. Effects of laser linewidth on the coherent anti-Stokes Raman spectroscopy spectral profile. Appl. Spectrosc. 1982, 36, 565–569. [Google Scholar] [CrossRef]
- Teets, R.E. Accurate convolutions of coherent anti-Stokes Raman spectra. Opt. Lett. 1984, 9, 226–228. [Google Scholar] [CrossRef] [PubMed]
- Aben, I.; Ubachs, W.; van der Zwan, G.; Hogervorst, W. Linewidth effects in resonant CARS processes. Opt. Commun. 1993, 95, 97–102. [Google Scholar] [CrossRef]
- Marrocco, M.; Nordström, E.; Bengtsson, P.E. Sensitivity of coherent anti-Stokes Raman lineshape to time asymmetry of laser pulses. Opt. Lett. 2014, 39, 5748–5751. [Google Scholar] [CrossRef] [PubMed]
- Dick, B.; Hochstrasser, R.M. Resonant non-linear spectroscopy in strong fields. Chem. Phys. 1983, 75, 133–155. [Google Scholar] [CrossRef][Green Version]
- Dick, B.; Hochstrasser, R.M. Absorption and emission spectroscopies of homogeneous and inhomogeneously broadened multilevel systems in strong light fields. J. Chem. Phys. 1984, 81, 2897–2906. [Google Scholar] [CrossRef]
- Hurst, G.B.; Wright, J.C. Vibronic spectroscopy of amorphous materials using higher order, multiresonant coherent anti-Stokes Raman spectroscopy. Chem. Phys. 1992, 97, 3940–3949. [Google Scholar] [CrossRef]
- Kasumova, R.J.; Kerimli, N.V.; Safarova, G.A. Phase effects on coherent anti-Stokes Raman light scattering. J. Appl. Spectrosc. 2021, 88, 12–18. [Google Scholar] [CrossRef]
- Dinev, S.G.; Hadjichristov, G.B. Polarization decoupling of stimulated processes sharing a common emission channel. Appl. Phys. B 1990, 51, 263–266. [Google Scholar] [CrossRef]
- Shen, Y.R.; Bloembergen, N. Theory of stimulated Brillouin and Raman scattering. Phys. Rev. 1965, 137, A1787–A1805. [Google Scholar] [CrossRef]
- Shen, Y.R. The Principles of Nonlinear Optics; Wiley: New York, NY, USA, 1984; pp. 152–156. [Google Scholar]
- Bjorklund, G.C. Effects of focusing on third-order nonlinear processes in isotropic media. IEEE J. Quant. Electron. 1975, QE-11, 287–296. [Google Scholar] [CrossRef]
- Boyd, R.W. Nonlinear Optics; Academic Press: London, UK, 1992; p. 431. [Google Scholar]
- Levenson, M.D.; Bloembergen, N. Dispersion of the nonlinear optical susceptibilities of organic liquids and solutions. J. Chem. Phys. 1974, 60, 1323–1327. [Google Scholar] [CrossRef]
- Hadjichristov, G.B.; Kircheva, P.P. Optical four-wave mixing in bulk polymers. Appl. Phys. B 1992, 55, 373–377. [Google Scholar] [CrossRef]
- Hadjichristov, G.B.; Petkov, I.; Deligeorgiev, T.; Funk, J.M.; Bischof, T.; Kiefer, W. Resonance CARS spectroscopy of 2-phenylbenzothiazoles in PMMA matrix. J. Mol. Struct. 1998, 443, 17–25. [Google Scholar] [CrossRef]
- Garter, G.M.; Chen, Y.J.; Rubner, M.F.; Sandman, D.J.; Thakur, M.K.; Tripathy, S.K. Degenerate third-order nonlinear optical susceptibility of polydiacetylenes. In Nonlinear Optical Properties of Organic Molecules and Crystals; Chemla, D.S., Zyss, J., Eds.; Academic Press: New York, NY, USA, 1987; Volume 2, pp. 85–120. [Google Scholar]
- Remilland, J.; Steel, D. Narrow nonlinear-optical resonances in CdSe-doped glass. Opt. Lett. 1988, 13, 30–32. [Google Scholar] [CrossRef] [PubMed]
- Jain, R.K.; Lind, R.C. Degenerate four-wave mixing in semiconductor-doped glasses. J. Opt. Soc. Am. 1983, 73, 647–653. [Google Scholar] [CrossRef]
- Ohtsuka, S.; Koyama, T.; Tsunetomo, K.; Nagata, H.; Tanaka, S. Nonlinear optical property of CdTe microcrystallites doped glasses fabricated by laser evaporation method. Appl. Phys. Lett. 1992, 61, 2953–2964. [Google Scholar] [CrossRef]
- Lim, S.; Chon, B.; Rhee, H.; Cho, M. Spectral modulation of stimulated Raman scattering signal: Beyond weak Raman pump limit. J. Raman Spectrosc. 2018, 49, 607–620. [Google Scholar] [CrossRef]
- Batignani, G.; Fumero, G.; Mai, E.; Martinati, M.; Scopigno, T. Stimulated Raman lineshapes in the large light–matter interaction limit. Opt. Mater. X 2022, 13, 100134. [Google Scholar] [CrossRef]
- Ishibashi, T.; Hamaguchi, H. Partially coherent antiStokes Raman scattering (PCARS): A comparative bandshape analysis of the spontaneous Raman and PCARS spectra of toluene. J. Chem. Phys. 1995, 103, 1–5. [Google Scholar] [CrossRef]
- Maeda, S.; Kamisuki, T.; Adachi, Y. Condensed phase CARS. In Advances in Non-Linear Spectroscopy; Advances in Spectroscopy; Clark, R.J.H., Hester, R.E., Eds.; Wiley: Chichester, UK, 1988; Volume 15, pp. 253–297. [Google Scholar]
- Carreira, L.A.; Horovitz, M.L. Coherent anti-Stokes Raman spectroscopy in condensed media. In Nonlinear Raman Spectroscopy and Its Chemical Applications; Kiefer, W., Long, D.A., Eds.; D. Reidel: Dordrecht, The Netherlands, 1982; pp. 367–389. [Google Scholar]
- Toleutaev, B.N.; Tahara, T.; Hamaguchi, H. Broadband (1000 cm−1) multiplex CARS spectroscopy: Application to polarization sensitive and time-resolved measurements. Appl. Phys. B 1994, 59, 369–375. [Google Scholar] [CrossRef]
- Kircheva, P.P.; Hadjichristov, G.B. On the phase match in multiplex CARS of condensed media. Appl. Spectrosc. 1993, 47, 470–474. [Google Scholar] [CrossRef]
- Li, S.; Li, Y.; Yi, R.; Liu, L.; Qu, J. Coherent anti-Stokes Raman scattering microscopy and its applications. Front. Phys. 2020, 8, 598420. [Google Scholar] [CrossRef]
- Gong, L.; Zheng, W.; Ma, Y.; Huang, Z. Higher-order coherent anti-Stokes Raman scattering microscopy realizes label-free super-resolution vibrational imaging. Nat. Photon. 2020, 14, 115–122. [Google Scholar] [CrossRef]
- Xu, S.; Camp, C.H., Jr.; Lee, Y.J. Coherent anti-Stokes Raman scattering microscopy for polymers. J. Polym. Sci. 2022, 60, 1244–1265. [Google Scholar] [CrossRef]
- Vernuccio, F.; Bresci, A.; Talone, B.; de la Cadena, A.; Ceconello, C.; Mantero, S.; Sobacchi, C.; Vanna, R.; Cerullo, G.; Polli, D. Fingerprint multiplex CARS at high speed based on supercontinuum generation in bulk media and deep learning spectral denoising. Opt. Express 2022, 30, 30135–30148. [Google Scholar] [CrossRef] [PubMed]
- Choi, D.S.; Rhee, H.; Cho, M. Discriminating congested vibrational peaks of condensed organic materials with time- and frequency-resolved coherent anti-Stokes Raman scattering spectroscopy. J. Phys. Chem. B 2023, 127, 3958–3968. [Google Scholar] [CrossRef]
- Heuke, S.; Rigneault, H. Coherent Stokes Raman scattering microscopy (CSRS). Nat. Commun. 2023, 14, 3337. [Google Scholar] [CrossRef] [PubMed]
- Dick, B.; Hochstrasser, R.M.; Trommsdorff, H.P. Resonant molecular optics. In Nonlinear Optical Properties of Organic Molecules and Crystals; Chemla, D.S., Zyss, J., Eds.; Academic Press: New York, NY, USA, 1987; Volume 2, pp. 159–212. [Google Scholar]
- Kiefer, W.; Long, D.A. (Eds.) Non-Linear Raman Spectroscopy and Its Chemical Applications; Reidel: Dordrecht, The Netherlands, 1982. [Google Scholar]
- Kiefer, W. Nonlinear Raman Spectroscopy. In Infrared and Raman Spectroscopy: Methods and Applications; Schrader, B., Ed.; VCH: Weinheim, Germany, 1995; pp. 162–188. [Google Scholar]
- Kiefer, W. Nonlinear Raman spectroscopy, Applications. In Encyclopedia of Spectroscopy and Spectrometry, 3rd ed.; Lindon, J.C., Tranter, G.E., Koppenaal, D.W., Eds.; Elsevier, Academic Press: Amsterdam, The Netherlands, 2016; Volume 3, pp. 388–401. [Google Scholar]
- Sun, M.; Mu, X.; Li, R. Linear and Nonlinear Optical Spectroscopy and Microscopy; Progress in Optical Science and Photonics; Springer: Singapore, 2024; Volume 29. [Google Scholar]
- Moutzouris, K.; Papamichael, M.; Betsis, S.C.; Stavrakas, I.; Hloupis, G.; Triantis, D. Refractive, dispersive and thermo-optic properties of twelve organic solvents in the visible and near-infrared. Appl. Phys. B 2013, 116, 617–622. [Google Scholar] [CrossRef]
Disclaimer/Publisher’s Note: The statements, opinions and data contained in all publications are solely those of the individual author(s) and contributor(s) and not of MDPI and/or the editor(s). MDPI and/or the editor(s) disclaim responsibility for any injury to people or property resulting from any ideas, methods, instructions or products referred to in the content. |
© 2024 by the author. Licensee MDPI, Basel, Switzerland. This article is an open access article distributed under the terms and conditions of the Creative Commons Attribution (CC BY) license (https://creativecommons.org/licenses/by/4.0/).