Article

Research on the Frequency Stabilization System of an External Cavity Diode Laser Based on Rubidium Atomic Modulation Transfer Spectroscopy Technology

1
College of Electrical Engineering, Naval University of Engineering, Wuhan 430033, China
2
College of Ordnance Engineering, Naval University of Engineering, Wuhan 430033, China
*
Author to whom correspondence should be addressed.
Photonics 2024, 11(4), 298; https://doi.org/10.3390/photonics11040298
Submission received: 2 February 2024 / Revised: 8 March 2024 / Accepted: 24 March 2024 / Published: 25 March 2024
(This article belongs to the Special Issue Technologies and Applications of Spectroscopy)

Abstract

:
To achieve high-frequency stability on the external cavity diode laser (ECDL), a 780 nm ECDL serves as the seed light source, and its frequency is precisely locked to the saturated absorption peak of rubidium (Rb) atoms using modulation transfer spectroscopy (MTS) technology. For improving the performance of frequency locking, the scheme is designed to find the optimal operating conditions. Correlations between the frequency discrimination signal (FDS) and critical parameters, such as the temperature of the Rb cell, the power ratio of the probe and pump light, and the frequency and amplitude of the modulation and demodulation signals, are observed to attain the optimal conditions for frequency locking. To evaluate the performance of the frequency-stabilized 780 nm ECDL, a dual-beam heterodyne setup was constructed. Through this arrangement, the laser linewidth, approximately 65.4 kHz, is measured. Then, the frequency stability of the laser, quantified as low as 4.886 × 10⁻¹² @32 s, is determined by measuring the beat-frequency signal with a frequency counter and calculating the Allan variance. Furthermore, using the realized frequency locking technology, the 780 nm ECDL can achieve long-term stabilization even after 25 h. The test results show the exceptional performance of the implemented frequency stabilization system for the 780 nm ECDL.

1. Introduction

Laser frequency stabilization technology finds numerous applications in quantum mechanics, precision measurement, laser spectroscopy, gravitational wave detection, etc. [1,2,3,4,5,6]. The atomic interferometry precision measurement experiments require a series of laser-assisted processes, such as laser cooling, pump, and probe laser. The quality of light significantly impacts the performance of atomic interferometry, particularly concerning the Raman interference of atoms. Ensuring a fixed frequency difference, a laser linewidth of less than 100 kHz, and a frequency stability better than 10−10 are imperative in this context [7,8,9].
A 780 nm ECDL serves as the seed light source, which is based on traditional diode lasers. By incorporating external optical feedback elements to establish an external cavity, it enhances spectral purity and narrows linewidth, offering an effective means for achieving mode-hop-free tuning across a wide range of diode lasers [10]. Temperature, current, and mechanical vibration significantly influence laser frequency, leading to drift during unrestricted operation, and posing challenges in meeting linewidth and stability requirements. Consequently, locking the laser frequency becomes imperative [11,12].
Laser frequency stabilization locks the frequency to a specific frequency source, such as an atomic transition frequency characterized by a stable center and narrow linewidth. External interference affects the laser frequency, leading to a frequency offset that generates an error signal. This signal is then fed into the server to adjust the laser current and piezoelectric ceramic transducer (PZT) voltage to lock frequency. The following frequency stabilization methods have been used in the past: the saturated absorption spectroscopy (SAS) method [13], the modulation transfer spectroscopy (MTS) method [14], the frequency modulation spectroscopy (FMS) method [15], the dichroic atomic vapor laser lock (DAVLL) method [16], and the polarization spectroscopy (PS) method [17], etc. In particular, the MTS occurs under sub-Doppler resonance conditions, eliminating the Doppler background and exhibiting high sensitivity, high resolution, and long-term continuous locking capabilities [18]. This method only modulates the external pump light, which avoids the noise introduced by direct modulation of the laser signal. The error signal in MTS that can reflect the frequency changes is called FDS. It has a significant FDS slope and is insensitive to temperature, magnetic fields, and light-intensity jitter [19].
The MTS method is gradually garnering increasing attention in research circles due to its notable advantages. G. Galzerano et al. [20,21] accomplished frequency stabilization of a 612 nm He-Ne laser and a 532 nm Nd:YAG laser, respectively, using the Iodine absorption line as a reference. K. Nakagawa et al. [22] realized frequency stabilization of the 1542 nm ECDL by utilizing the 13C2H2 absorption line as a reference. F. Bertinetto et al. [23] and Z.Y. Xu et al. [24] achieved frequency stabilization of 852 nm distributed Bragg reflector (DBR) diode lasers by using the 133Cs absorption line. W. Wang et al. [25] and M. Á lvaro M. G. de et al. [26] employed the second harmonic generation (SHG) method to stabilize a 798 nm diode laser on the Yb absorption line and an 1112 nm diode laser on the 127I2 absorption line, respectively. F. Yu et al. [27] stabilized the distributed feedback (DFB) laser on the Cs absorption line. L. Sharma et al. [28] selected the I2 absorption line as the reference to achieve the frequency stabilization of the ECDL at 739 nm. B. Cheng et al. [29] optimized the vapor temperature and the pump and probe light intensity to achieve a laser linewidth of 280 kHz. D. Sun et al. [30] improved the spectral signal-to-noise ratio (SNR) through optimization of the probe beam light intensity. T. Preuschoff et al. [31] proposed an analytical approach for determining the best modulation parameters of the MTS scheme. B. Wu et al. [32] analyzed the dependency of the MTS signal on the temperature of the vapor cell and realized a spectrum with high SNR.
Existing studies indicate that the current MTS method mainly focuses on frequency stabilization of various lasers by using different absorbing media or optimizing specific variables. The simultaneous optimization of both the spectral characteristics and electro-optical parameters of the MTS system is less discussed. The MTS signal is derived by demodulating the SAS signal following near-degenerate four-wave-mixing (ND-FWM) [33]. Consequently, the SNR of the SAS signal, the power ratio of the probe light to the pump light, and the frequency and amplitude of the modulation and demodulation signals all affect the peak-to-peak value and slope of the FDS [34,35]. It is imperative to consider the aforementioned factors to obtain the optimal frequency-locking result. Acknowledging some of the limitations of current research, this paper conducts a focused study.
This paper presents a method to achieve the frequency locking of ECDL using MTS technology. Frequency locking is achieved at the saturation absorption peaks of T3 (87Rb: Fg = 2 → Fe = 3) and T4 (85Rb: Fg = 3 → Fe = 4) with the D2 line frequency of Rb. Firstly, the principle and general scheme of MTS are introduced, followed by an analysis of the effects of Rb cell temperature, the power ratio of probe and pump light, and the amplitude and frequency of modulation and demodulation signals on frequency locking. This analysis culminates in determining the peak-to-peak value and slope of the optimal FDS. Additionally, an optical path employing double-beam heterodyne techniques was designed to effectively evaluate the frequency stabilization system. Laser stabilization was assessed by using a frequency counter to collect the beat-frequency signal, while the laser linewidth was measured using a spectrum analyzer. The long-term stabilization of the laser was monitored by measuring its wavelength.

2. Basic Principle

The light field of linearly polarized light E 0 at frequency ω C , passing through an electro-optical phase modulator (EOPM), can be expressed as [36]:
E ( t ) = E 0 sin [ ( ω c + δ sin ω m ) t ] = E 0 n = 0 J n ( δ ) sin ( ω c + n ω m ) t + n = 0 ( 1 ) n J n ( δ ) sin ( ω c n ω m ) t ,
where δ is the modulation depth, ω m is the modulation frequency, t is the modulation time, and J n ( δ ) is the nth-order Bessel function.
The modulated pump light and unmodulated probe light, which co-propagate in sub-Doppler resonance conditions, simultaneously illuminate the atomic medium, generating ND-FWM within the Rb cell. This process results in the probe light also generating modulation sidebands, i.e., realizing the transfer of the modulation. The probe light passes through the atomic cell and irradiates into the photodetector (PD). Its modulated sidebands generate a beat-frequency signal, which is denoted as:
S ω m = C Γ 2 + ω m 2 n = J n ( δ ) J n 1 ( δ ) × L ( n + 1 ) / 2 + L ( n 2 ) / 2 cos ω m t + ϕ d + D ( n + 1 ) / 2 + D ( n 2 ) / 2 sin ω m t + ϕ d .
Here, C is the amplitude constant, which is related to the PD performance and probe light intensity. Γ is the natural linewidth of the atom, and ϕ d is the phase of the modulated pump light relative to the PD. L n and D n are the absorption and dispersion coefficient of the beat-frequency signal, respectively, which can be described as:
L n = Γ 2 Γ 2 + Δ n ω m 2 , D n = Γ Δ n ω m Γ 2 + Δ n ω m 2 ,
where Δ = ω c ω 0 is the detuning of the laser frequency relative to the atomic resonance frequency ω 0 . Assuming the modulation depth δ < 1 and considering only the first-order sidebands, Equation (2) can be simplified as:
S ω m = C Γ 2 + ω m 2 J 0 ( δ ) J 1 ( δ ) × L 1 L 1 / 2 + L 1 / 2 L 1 cos ω m t + ϕ d + D 1 D 1 / 2 D 1 / 2 + D 1 sin ω m t + ϕ d ,
where L ( ω m ) = L 1 L 1 / 2 + L 1 / 2 L 1 and D ( ω m ) = D 1 D 1 / 2 D 1 / 2 + D 1 are the absorption and dispersion components, and C ( ω m , δ ) = C J 0 ( δ ) J 1 ( δ ) / Γ 2 + ω m 2 is the beat-frequency amplitude. Correlation demodulation of S ω m , and mixing with demodulated signals of the same frequency but different phases can be expressed as:
S ω m sin ω m t + ϕ q = C ( ω m , δ ) 2 × L ω m sin ( ϕ q ϕ d ) + sin 2 ω m t + ϕ q + ϕ d + D ω m cos ( ϕ q ϕ d ) cos 2 ω m t + ϕ q + ϕ d .
Filtering out the high-frequency signal of 2 ω m , the FDS can be obtained and expressed as:
FDS = C ( ω m , δ ) 2 × L ω m sin ( ϕ q ϕ d ) + D ω m cos ( ϕ q ϕ d ) .
Adjusting the phase difference ϕ q ϕ d can change the magnitude of the absorption and dispersion components so that the peak-to-peak value and slope of the FDS reach the maximum value together. At this time, the optical frequency can fall better in the center of the cross resonance, which is conducive to the operation of frequency locking [34].

3. Overall Scheme and MTS Signal Optimization
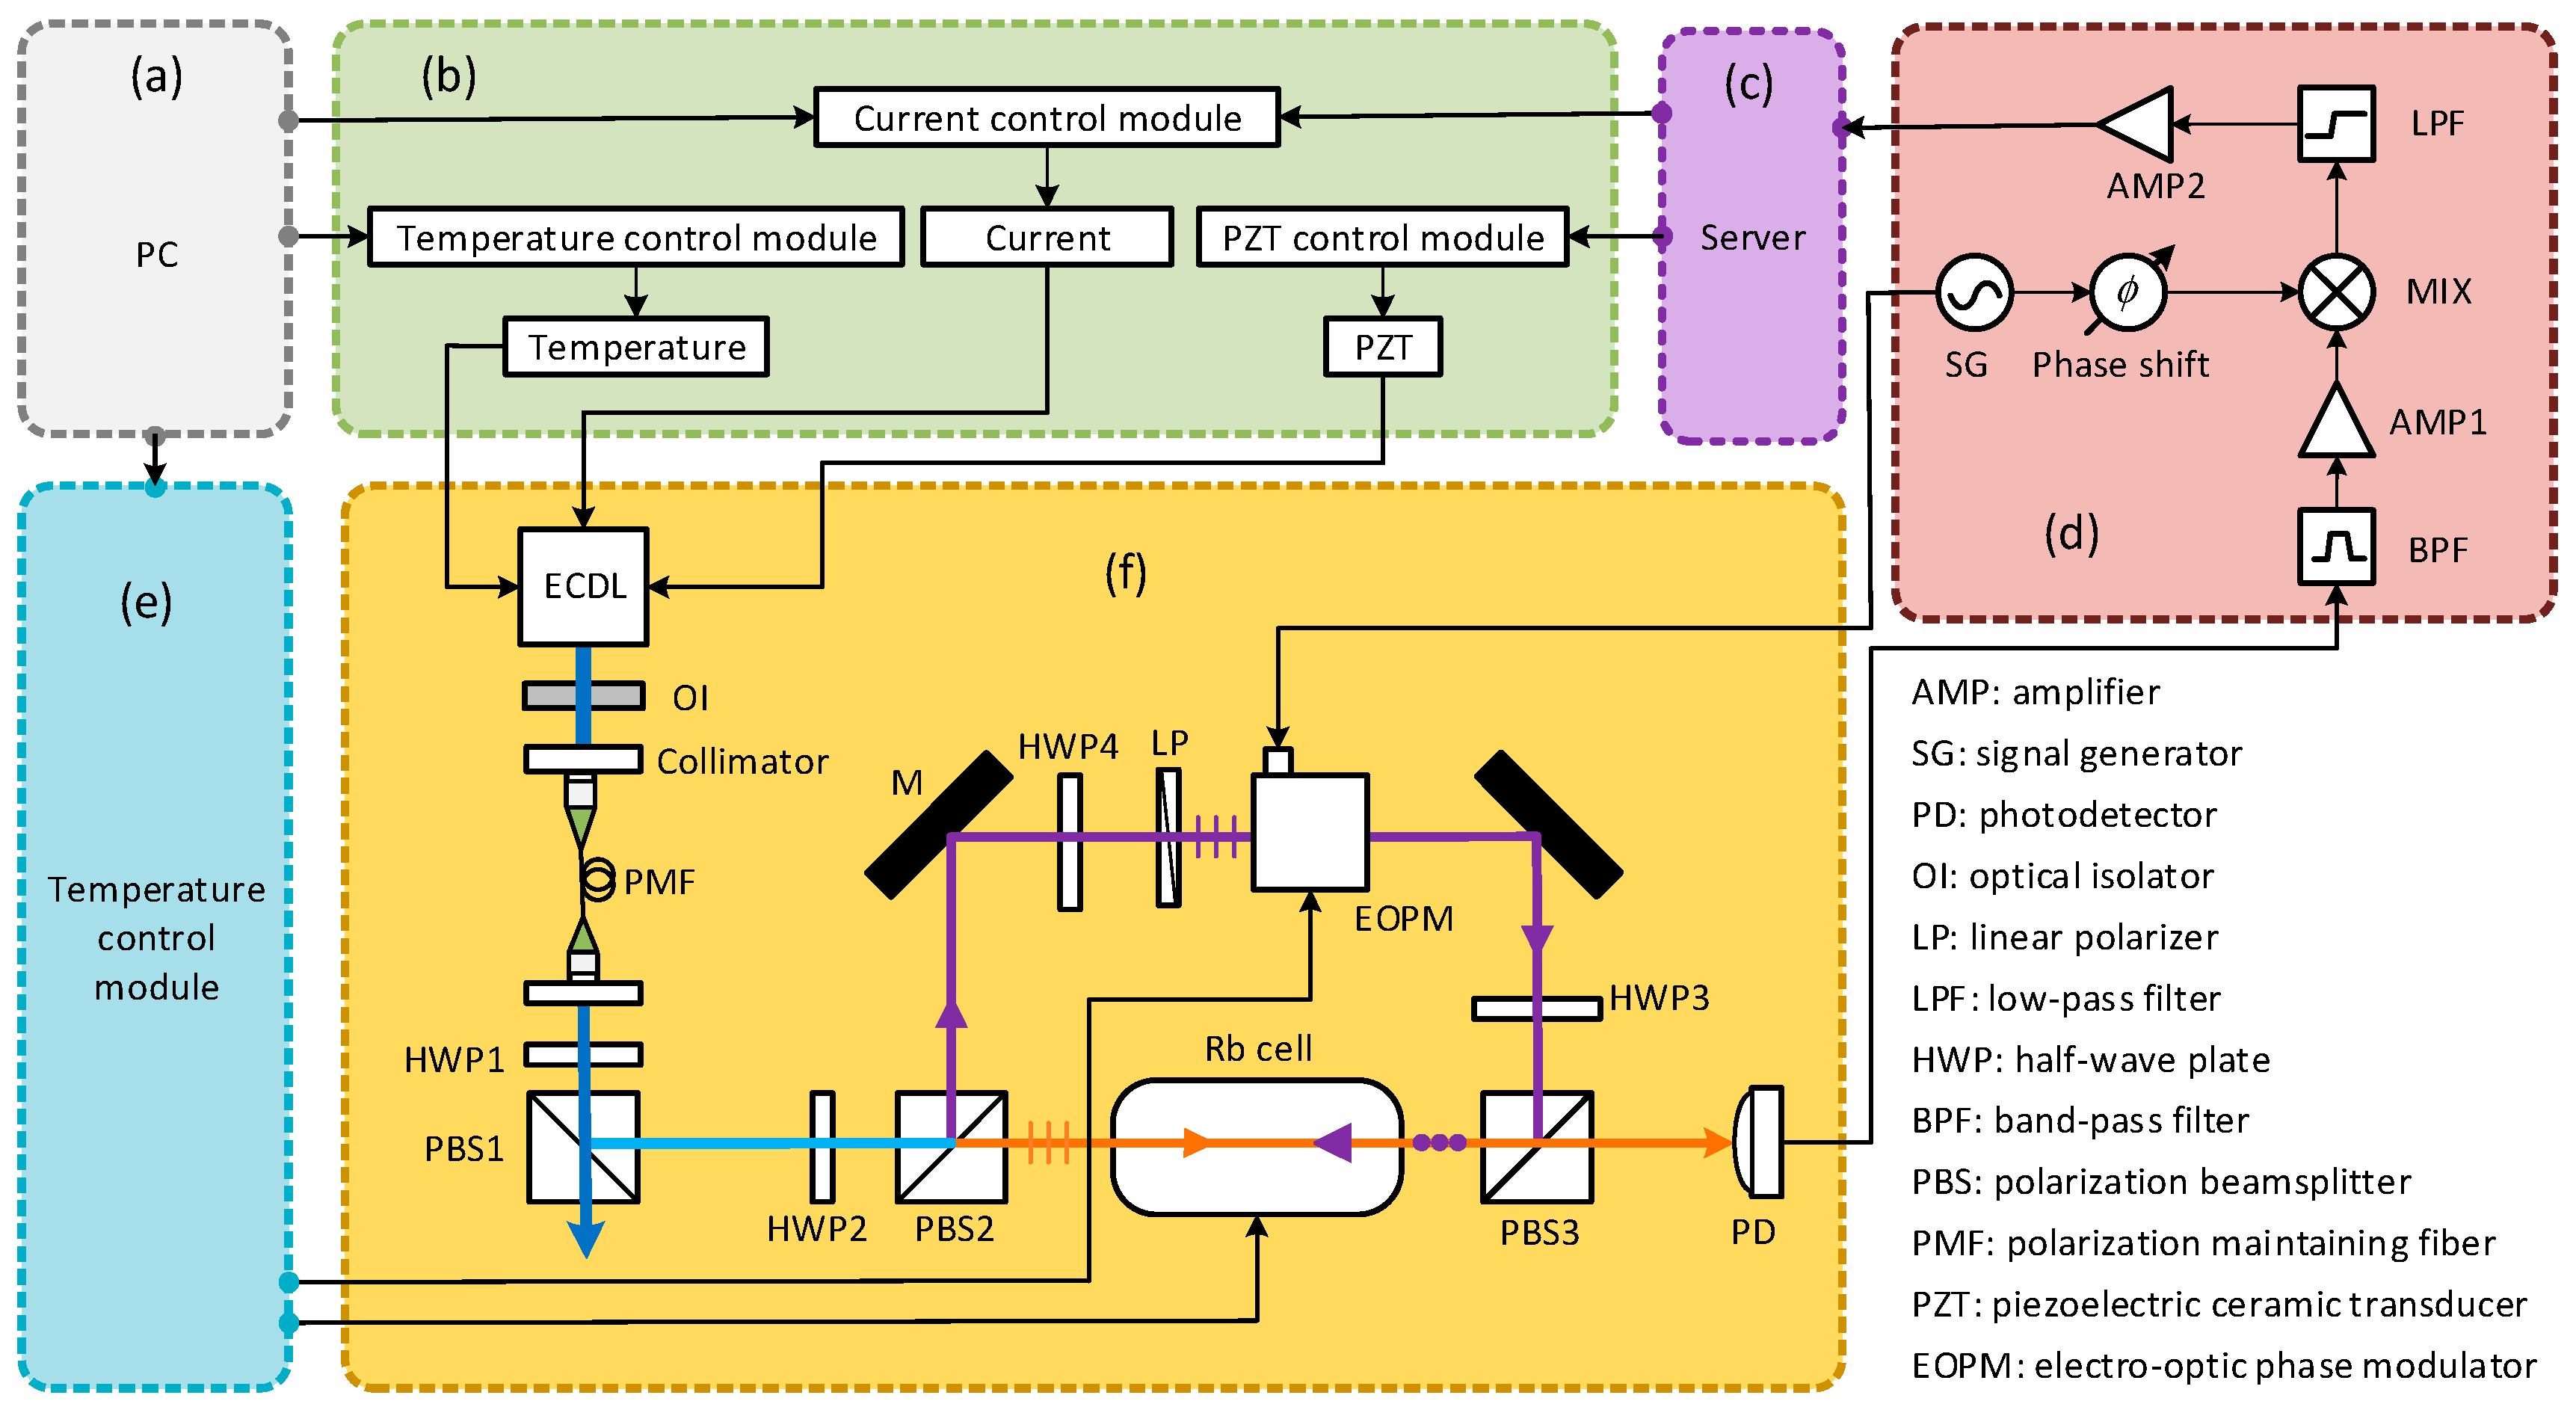
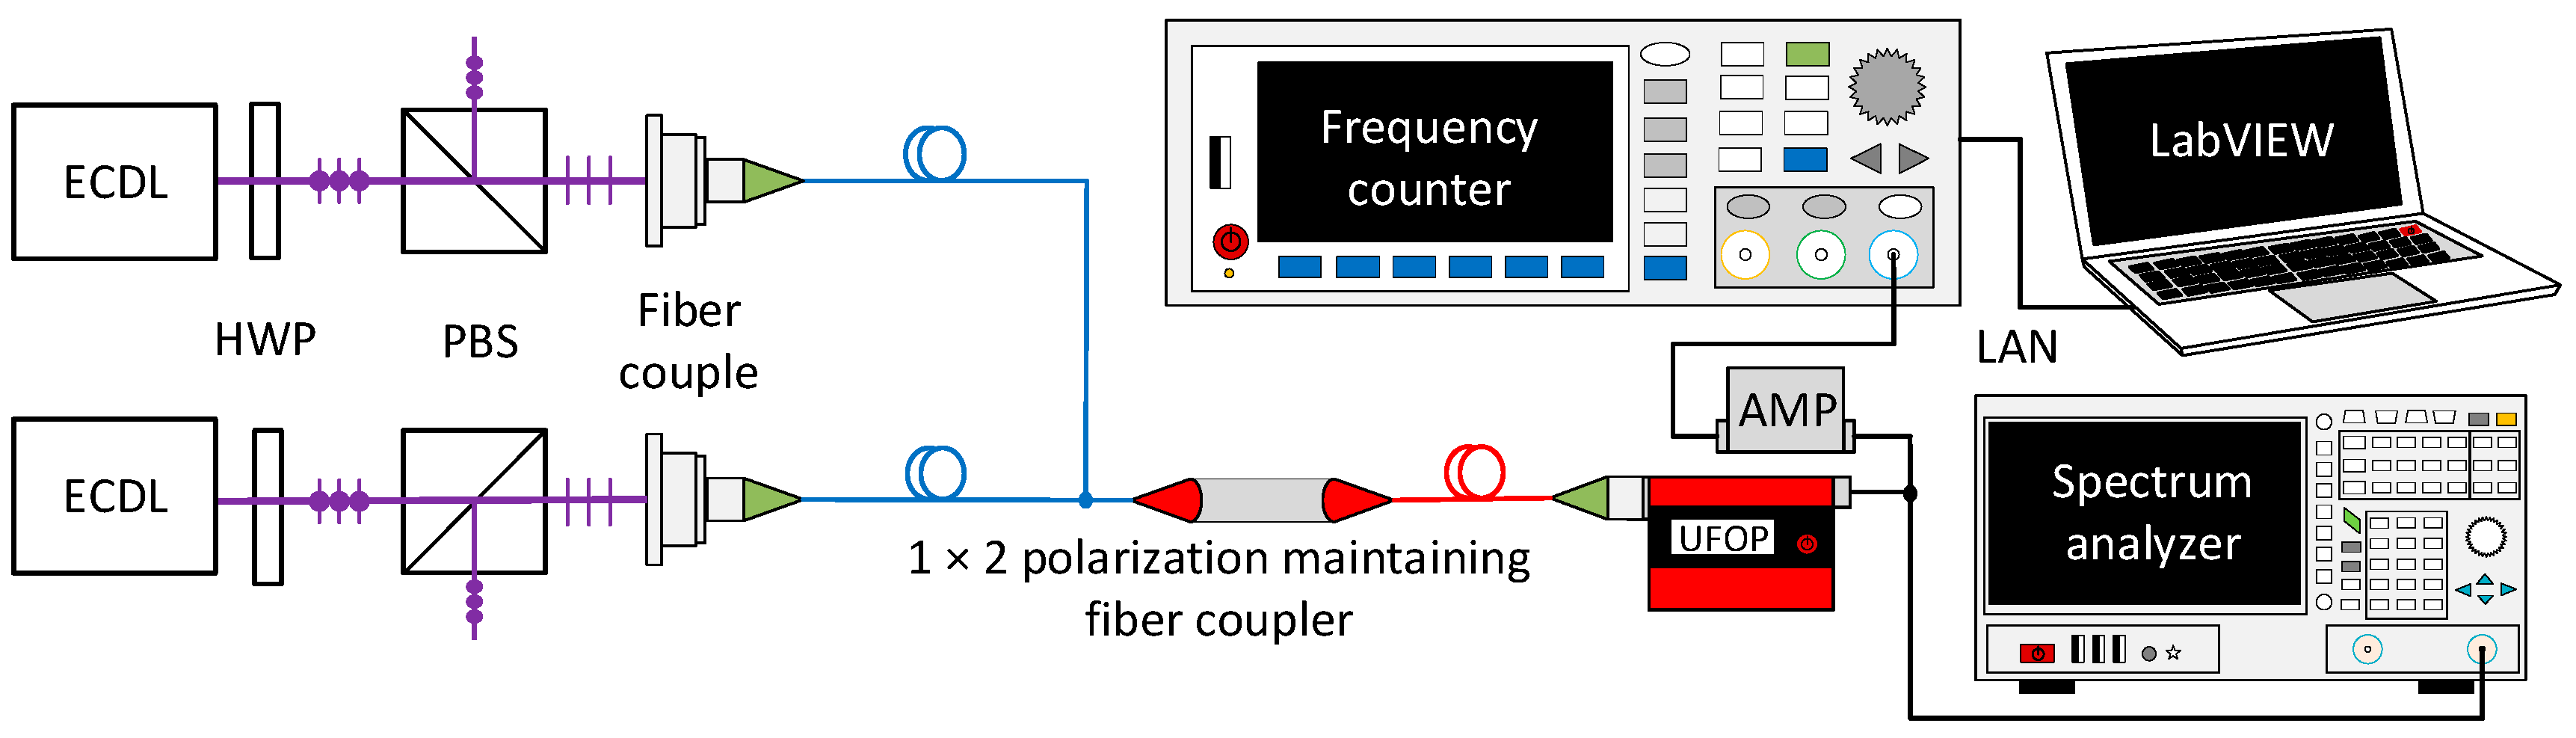
3.1. Overall Scheme

The overall scheme of the MTS frequency stabilization system is shown in Figure 1a–f, depicting the personal computer (PC), ECDL chassis, commercial server, modem, dual-channel temperature control module, and frequency-stabilized optical path, respectively.
(a) The PC mainly controls the ECDL chassis and the dual-channel temperature control module. (b) The ECDL chassis controls the 780nm laser and changes the current, temperature, and PZT voltage of the ECDL to achieve the tuning of the laser wavelength within 780.235~780.255 nm. It reserves the current and PZT voltage feedback control interface. (c) The commercial server (Vescent: D2-125-PL) is capable of implementing proportional-integral-differential (PID) control and offering fast and slow feedback to the current and the PZT voltage of the ECDL. (d) The modem comprises a low-pass filter (LPF), a band-pass filter (BPF), a low-noise amplifier (AMP), a mixer (MIX), and a dual-channel signal generator (SG). The dual-channel SG incorporates a phase shifter function, which generates two local oscillator signals. One channel applies a modulation signal to the EOPM, while the other applies a demodulation signal with a phase shift to the MIX. (e) The dual-channel temperature control module (TCM-M207) regulates the temperature of the Rb cell and the EOPM, achieving relative stability of temperature control at ±0.002 °C, which meets the experimental requirements [37]. (f) The frequency-stabilized optical path comprises the half-wave plate (HWP), the EOPM, the polarization beam-splitter (PBS), the polarization-maintaining fiber (PMF), the linear polarizer (LP), the mirror (M), the optical isolator (OI), the PD, and the Rb cell. The cylindrical Rb cell is filled with natural Rb, with dimensions 75 mm in length and 25.4 mm in diameter. EOPM is a PM7-NIR_4 from QUBIG, resonating at a frequency of 3.95 MHz. The modulation voltage amplitude versus modulation depth is denoted as δ = 0.474 E m .
In this experiment, the ECDL and EOPM were maintained near room temperature at 23 °C, while the Rb cell was maintained at 30 °C. The laser emitted by the ECDL initially passed through the OI to mitigate the impact of optical feedback on frequency stability. The current of the ECDL was adjusted to 117 mA, and subsequently converted to free-space seed light through a fiber collimator and a PMF. The seed light was split into two beams by PBS1 and HWP1, with about 22 mW as the output light and about 3 mW as the frequency-stabilized light. Frequency-stabilized light is divided into probe and pump light through PBS2 and HWP2. Pump light passes through HWP4 and LP to ensure that the light entering the EOPM maintains horizontal polarization. The EOPM, under the action of the local oscillator signal, externally modulates the pump light and then reflects it to the Rb cell through HWP3 and PBS3. HWP3 can adjust the power of the pump light entering the Rb cell. The horizontally polarized probe light and the vertically polarized pump light overlap in the Rb cell. ND-FWM generated a SAS signal within the probe light containing modulation information. PD converts the optical signals into electrical signals, filtered to remove the DC signals and high-frequency noise using a BPF (Mini-Circuits: ZABP-4R5-S+) with a bandwidth of 2~7 MHz. The electrical signal passes through AMP1 (Mini-Circuits: ZFL-500+) before being input to MIX (Mini-Circuits: ADE-6), where it undergoes demodulation by the local oscillator signal with phase shift. The demodulated signal from the MIX is then processed through an LPF (Mini-Circuits: BLP-1.9+) with a cut-off frequency of 1.9 MHz, followed by an AMP2 (ADI: AD623), to obtain an FDS. The FDS is input to the server, which dynamically adjusts the current and PZT voltage through dual-channel feedback to achieve frequency stabilization.

3.2. MTS Signal Optimization

According to Equation (6), the factors influencing the FDS include the frequencies ω m of modulation and demodulation signals, the phase difference ϕ q ϕ d , the amplitude constant C, and the modulation depth δ . Optimization of those parameters leads to an improvement in the SNR of the MTS signal, consequently achieving a better frequency locking effect.
In this experiment, the Rb cell temperature is maintained at 30 °C, the power of the frequency-stabilized light is 1.4 mW, the ratio of pump light power to probe light power is 3:1, and the amplitudes of the modulation and demodulation signals are 2.5 V and 0.23 V, respectively, with the frequency of the modem set at 3.95 MHz. Additionally, the demodulation phase ϕ d is adjusted. By adjusting the demodulation phase to the appropriate position, the SAS, MTS, and scanning signals are shown in Figure 2.

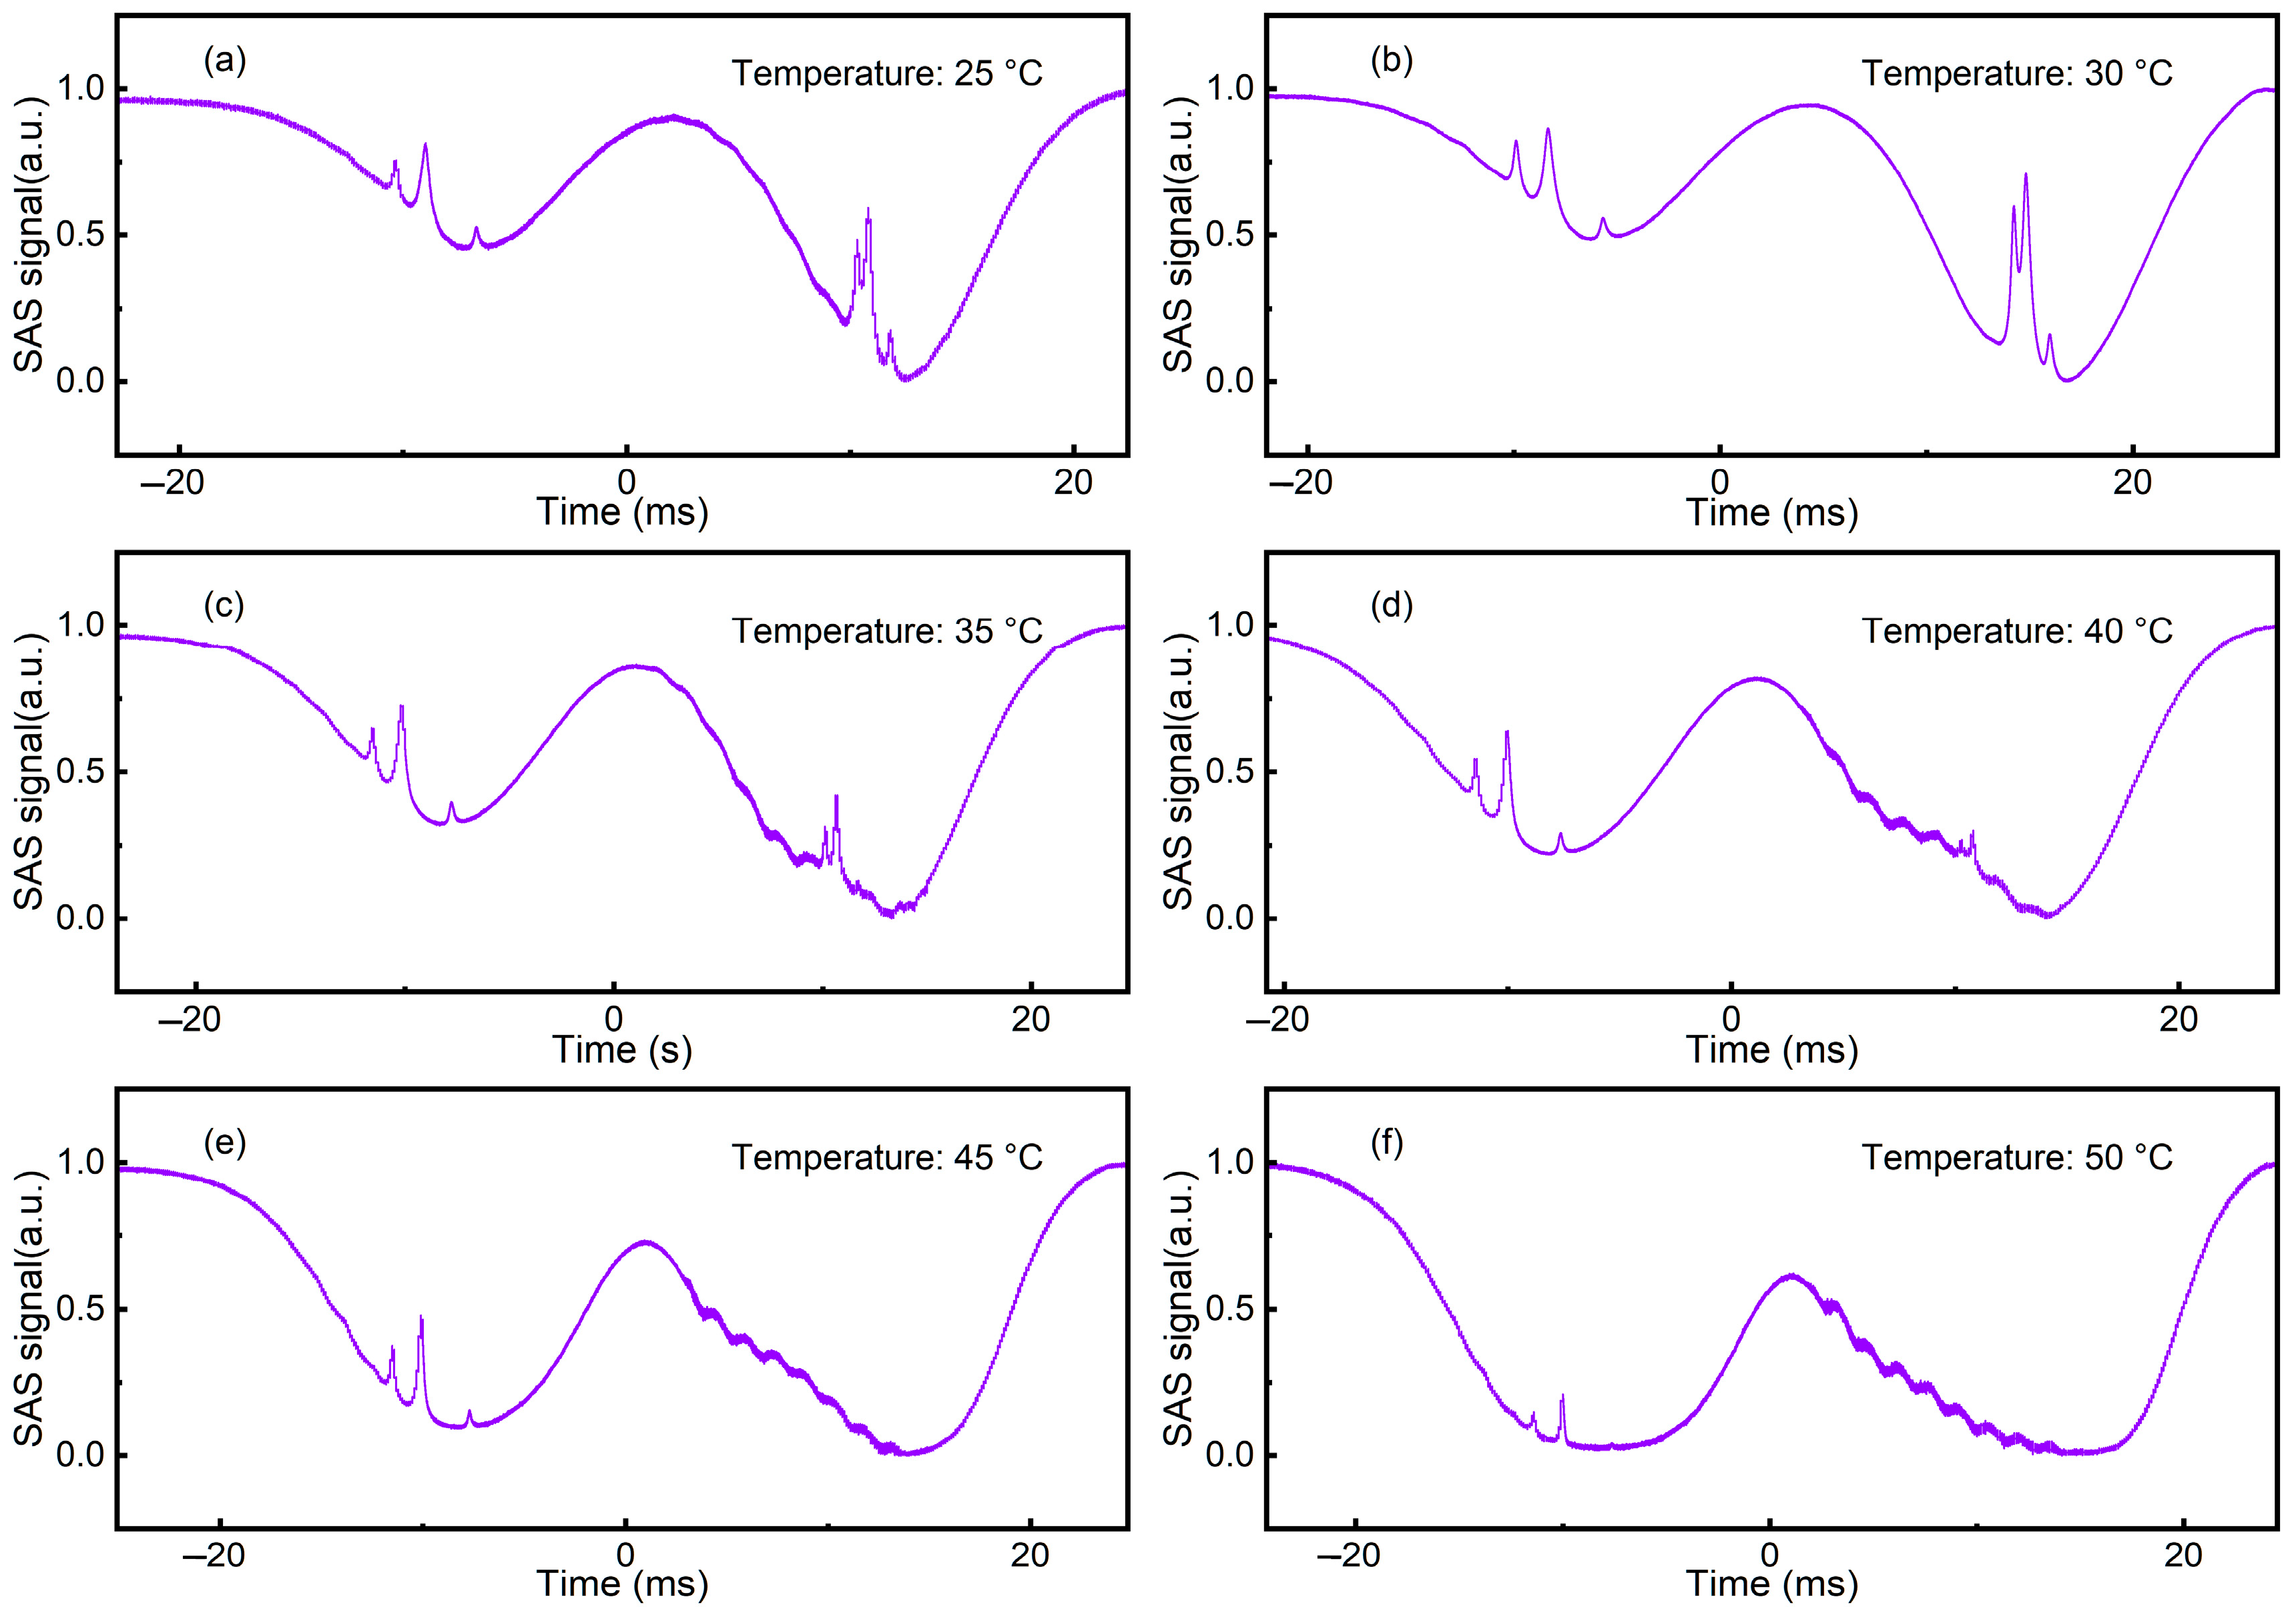
3.2.1. Rb Cell Temperature Regulation

The MTS signal is obtained by demodulating the SAS signal containing modulation information. The temperature affects the vapor density and spectral linewidth of saturated atoms in the Rb cell, affecting the SNR of the SAS signal [32,38]. Observations were conducted at 5 °C intervals within the temperature range of 25 °C to 50 °C. The normalized SAS signals (depicted in Figure 2) were recorded after the temperature had stabilized, and are shown in Figure 3a–f.
SAS signals from 87Rb exhibited higher quality between 25 °C and 45 °C, whereas SAS signals from 85Rb demonstrate superior performance within the range of 25 °C to 30 °C. Optimal SAS signals for 87Rb and 85Rb were achieved at around 40 °C and 30 °C, respectively. At 50 °C, SAS signals from 87Rb and 85Rb exhibited varying degrees of distortion. The analysis above indicates that the optimal temperature for 87Rb is approximately 10 °C higher than that of 85Rb. The discrepancy is primarily attributed to their differing abundance in nature [39]. The abundance of 87Rb and 85Rb in nature is 27.9% and 72.1%, respectively [40,41]. The temperature of the Rb cell was maintained at 30 °C to optimize the SAS signals of both 87Rb and 85Rb.

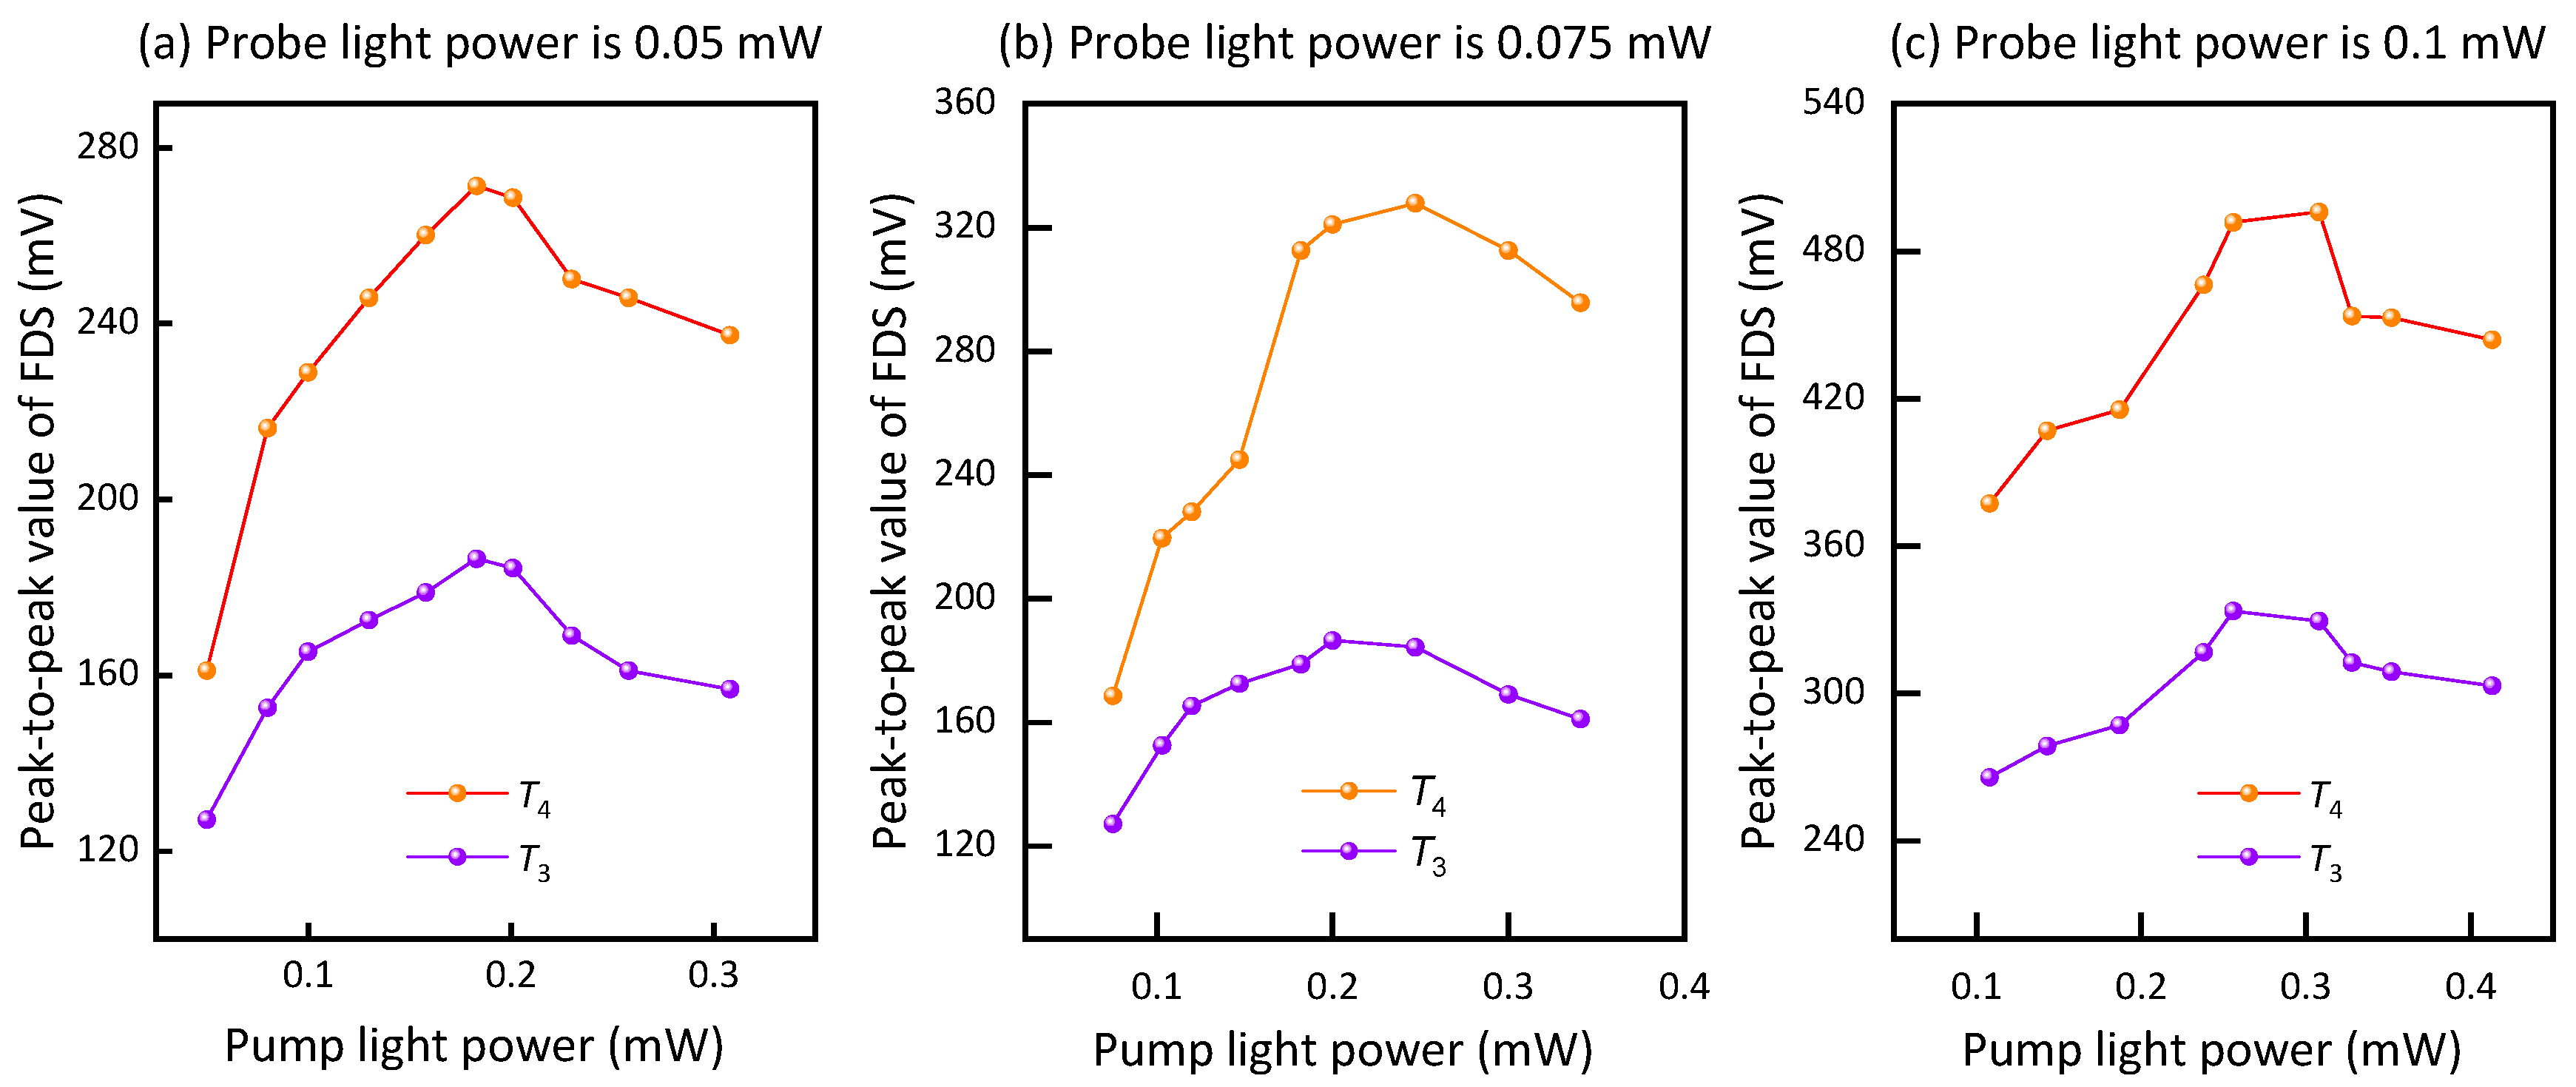
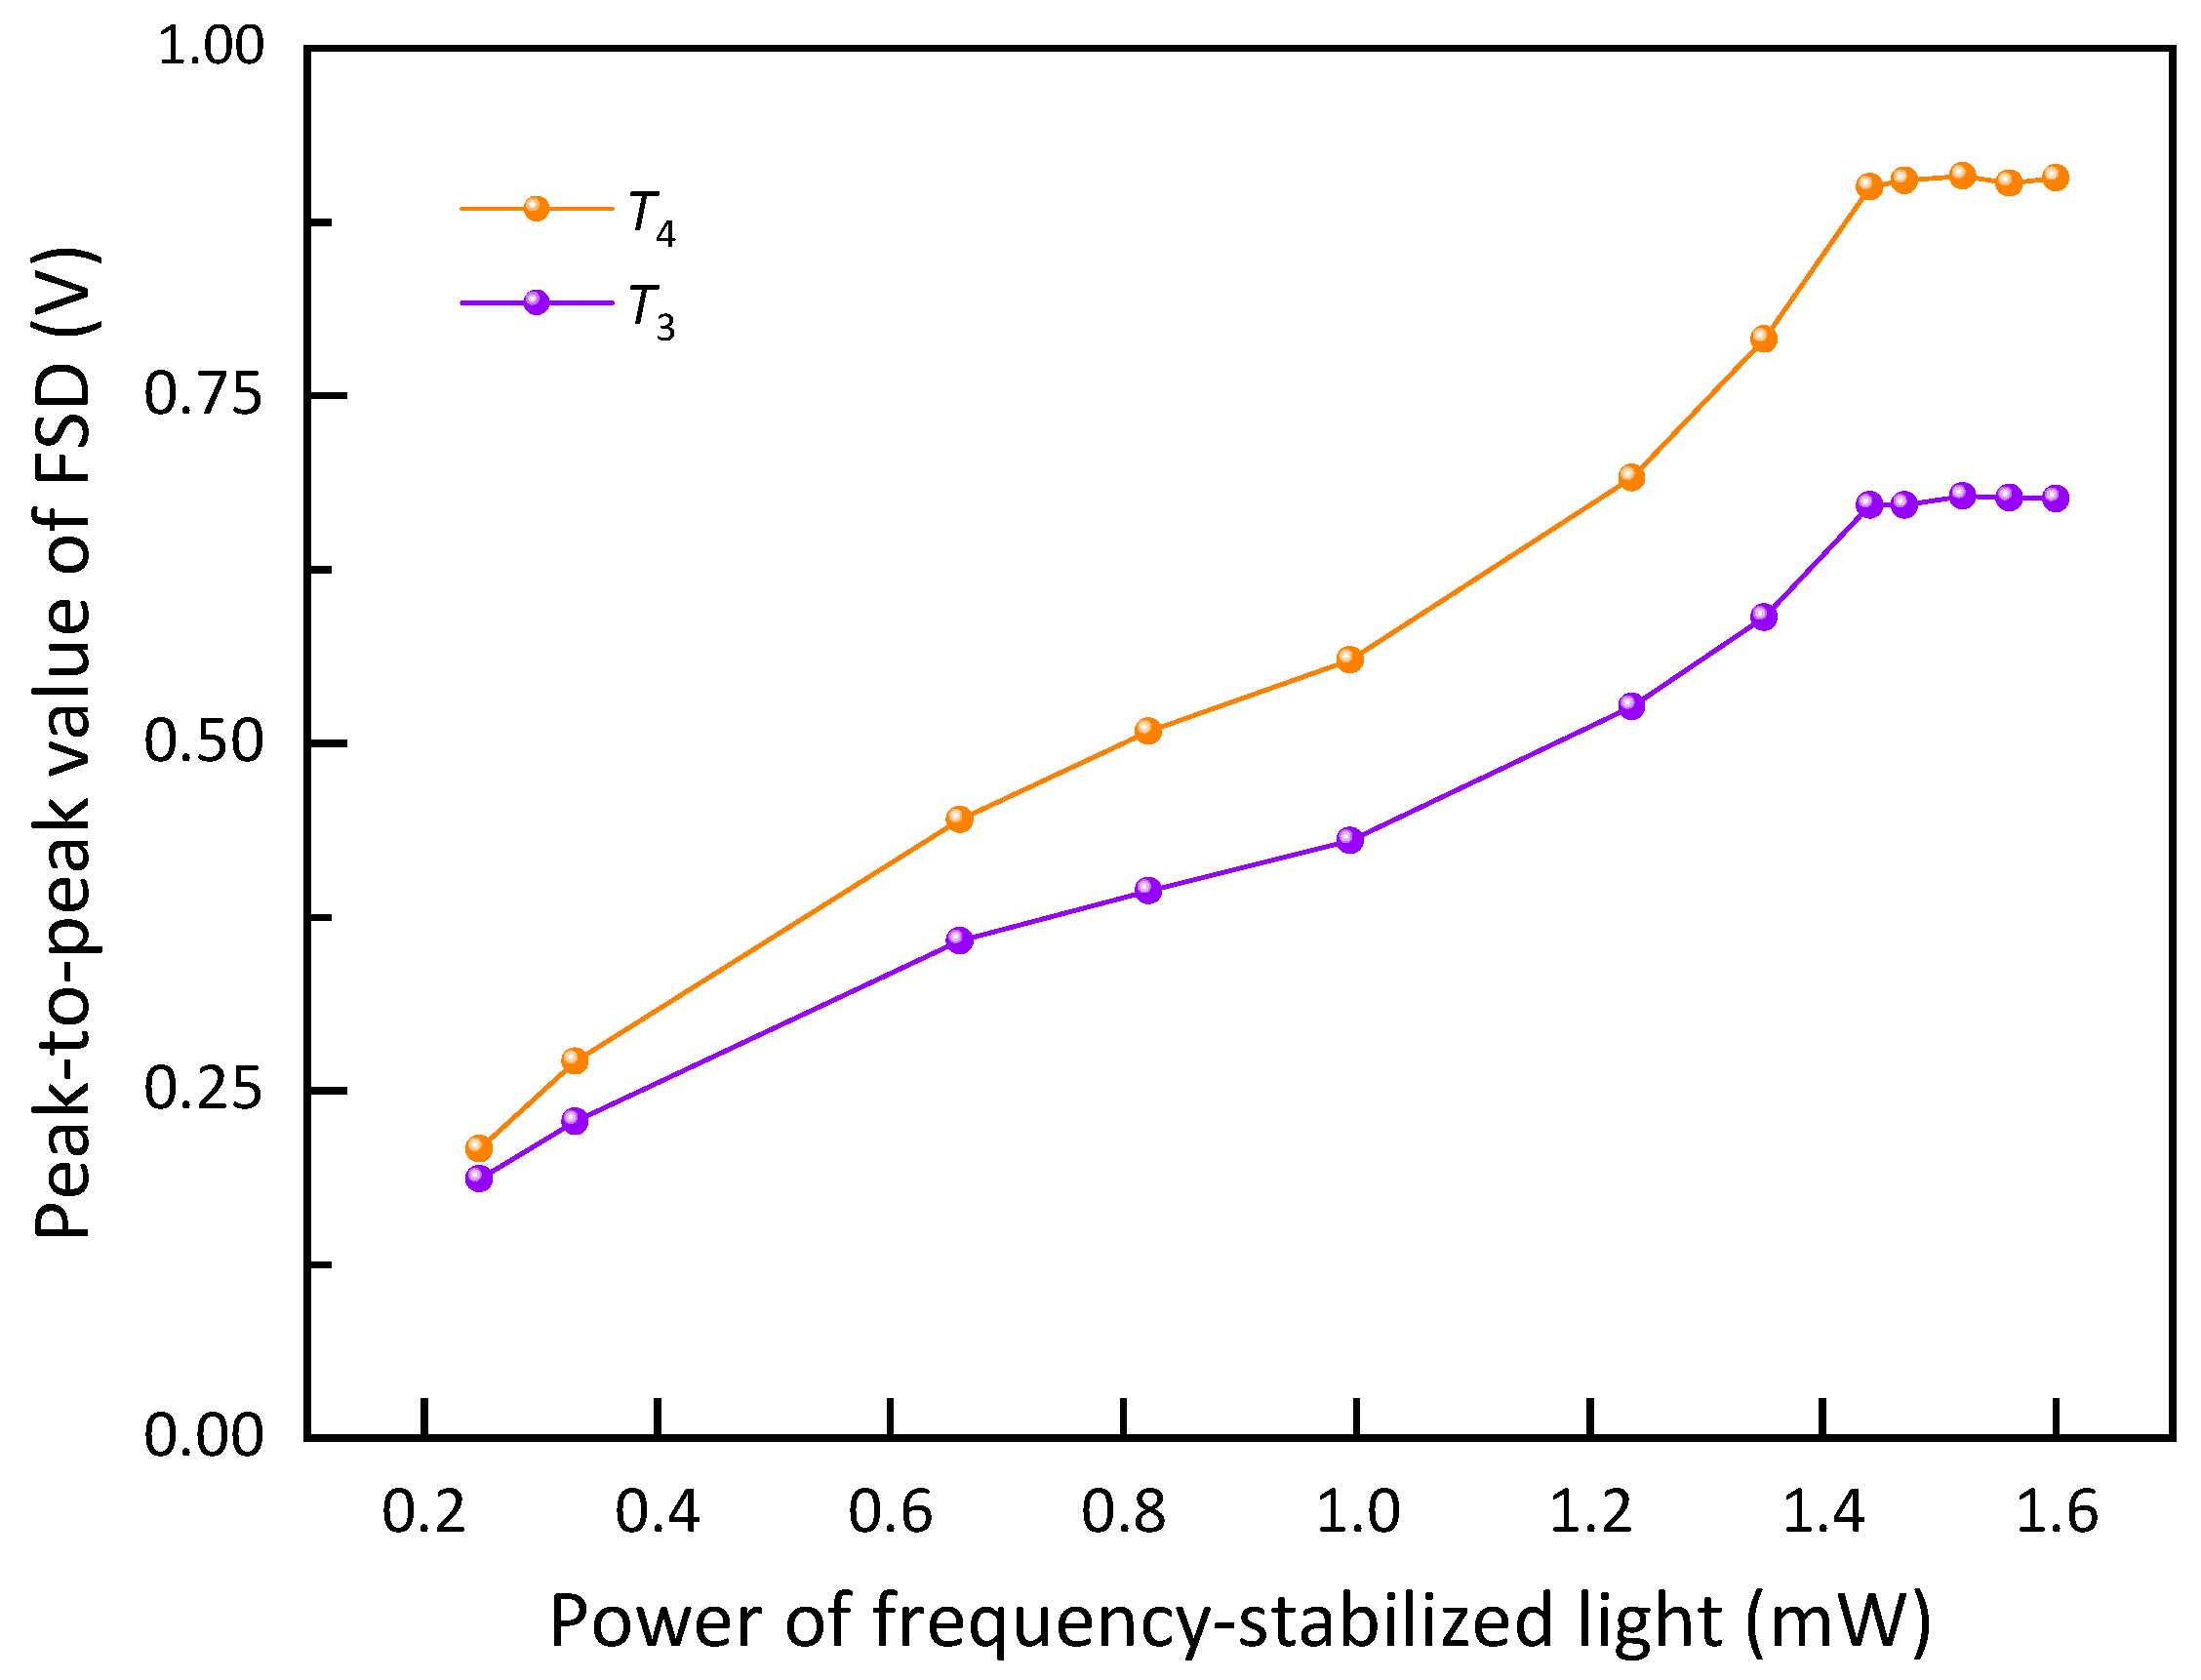
3.2.2. Optical Power Ratio Regulation

While maintaining the above conditions, the power ratio of the probe light and the pump light is adjusted. The power of the pump light was adjusted to 0.05 mW, 0.075 mW, and 0.1 mW, respectively. Meanwhile, the power of the pump light was adjusted by rotating HWP3 of Figure 1f. The peak-to-peak values of the FDS corresponding to T3 and T4 are shown in Figure 4a–c.
When the ratio of pump light power to probe light power is set to 3:1, the peak-to-peak maximum value of FDS increases with the probe light power. Adjusting HWP1 in Figure 1f to modify the power utilized for frequency-stabilized light, changes in the peak-to-peak value of FDS changes corresponding to T3 and T4 are shown in Figure 5. The peak-to-peak value of FDS increases with the rise in the optical power of the frequency-stabilized light, reaching its maximum at approximately 1.45 mW. However, the peak-to-peak value of FDS saturates as the optical power of the frequency-stabilized light further increases. To prevent saturation of the optical power received by the PD, the optical power of the stabilized frequency was set to 1.4 mW in the experiment.

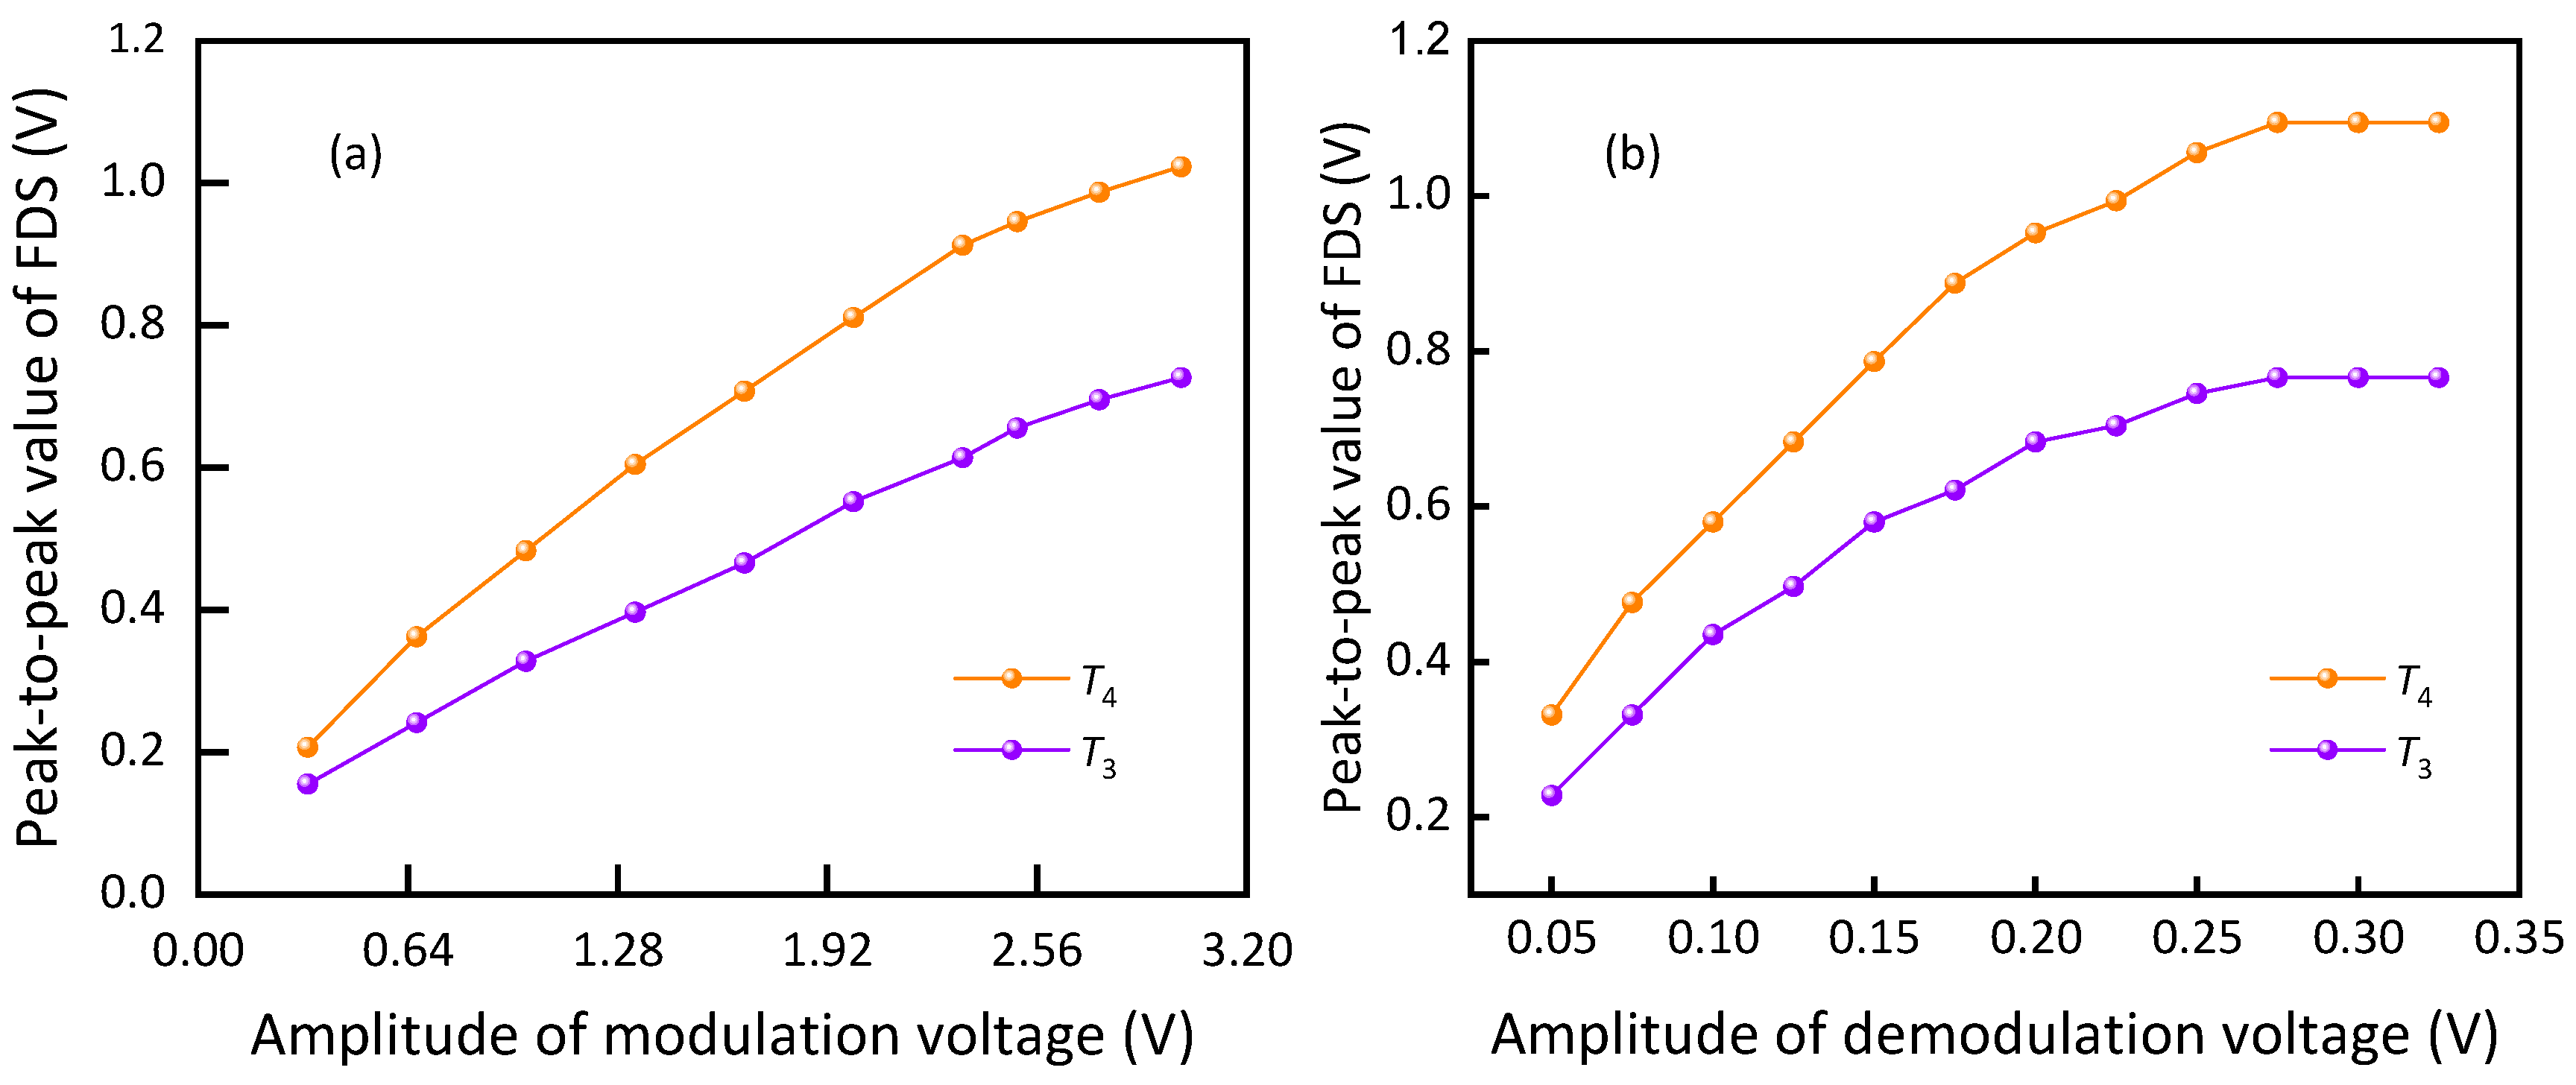
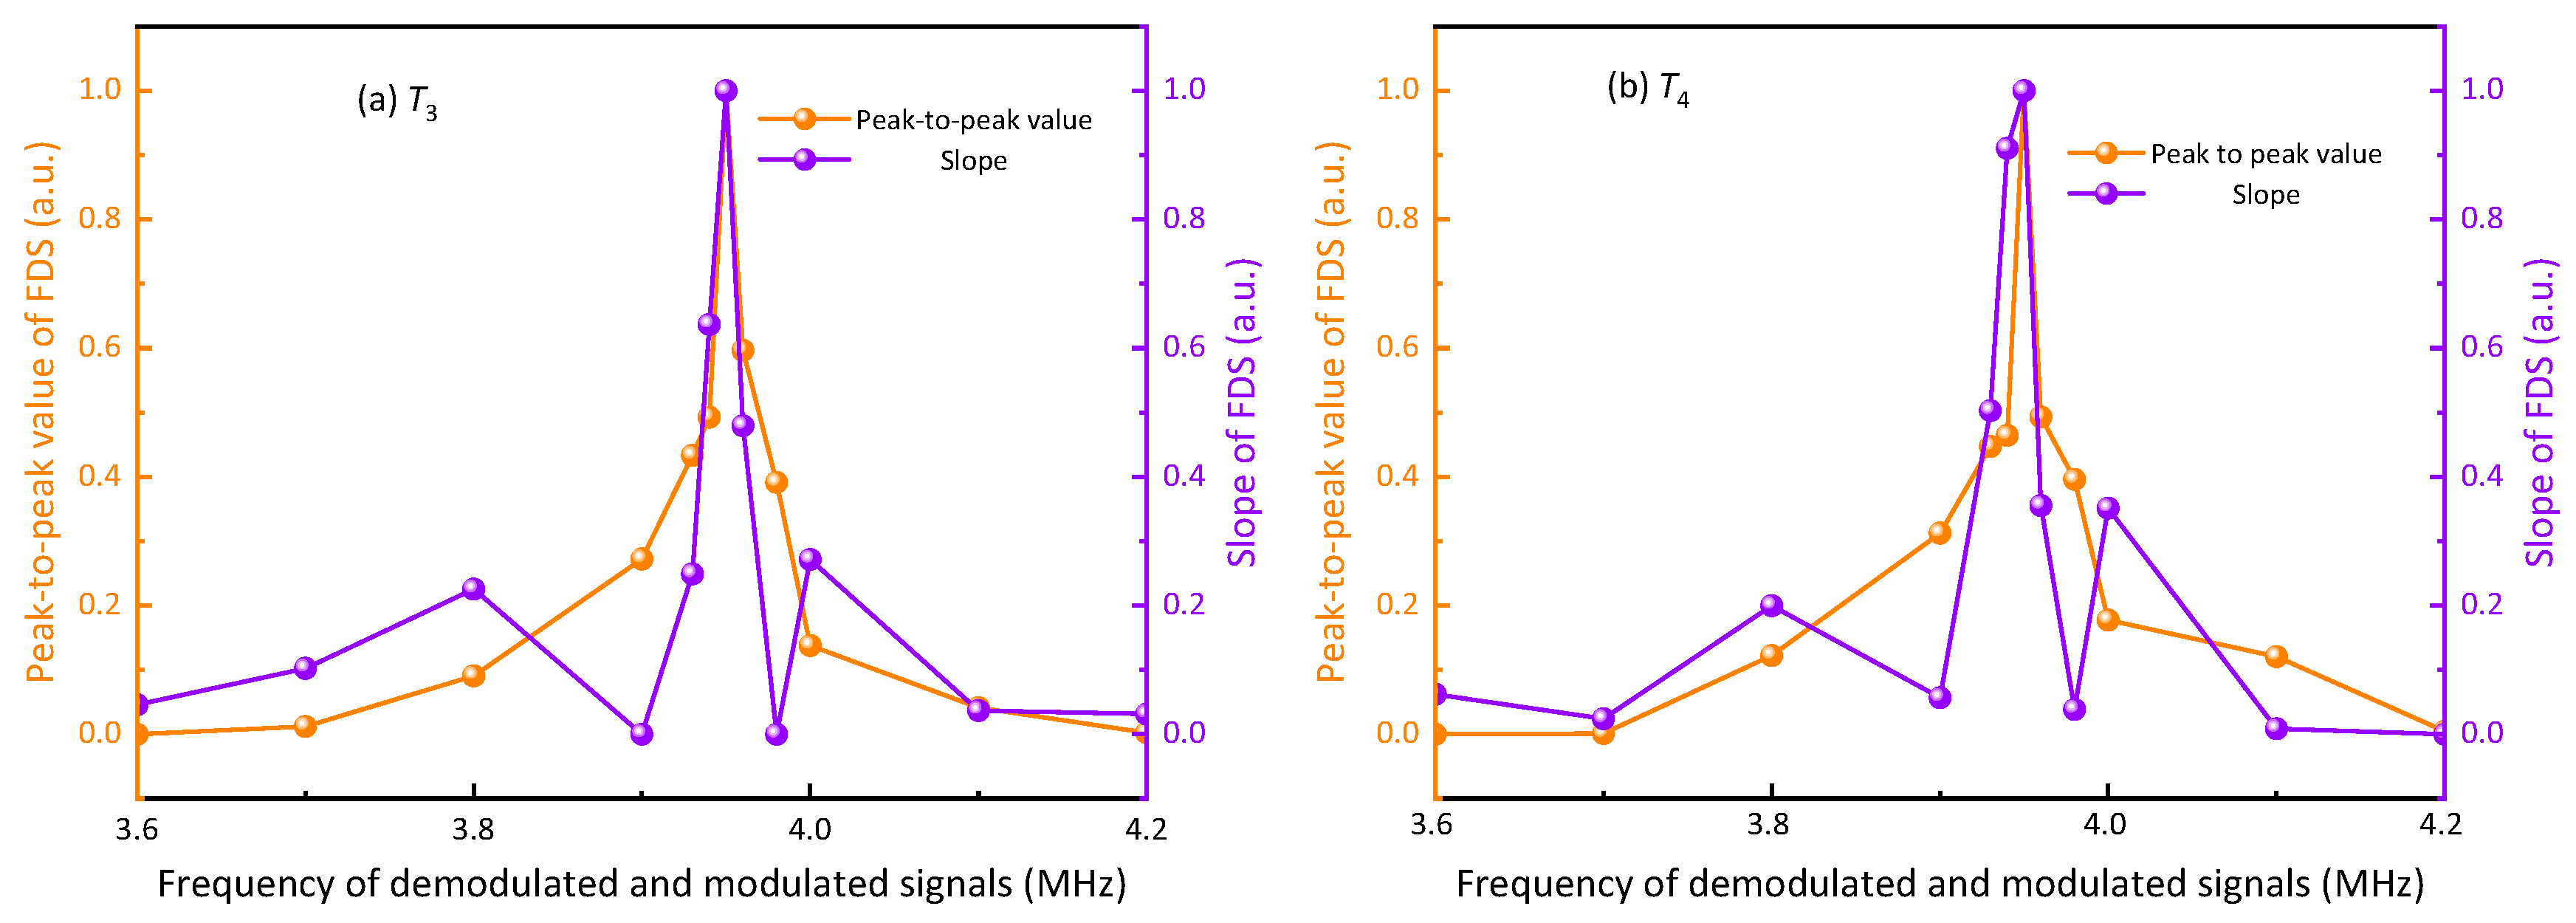
3.2.3. Modulation and Demodulation Signal Regulation

When keeping the aforementioned conditions constant and adjusting only the amplitude of the modulation or demodulation signal, the peak-to-peak value of FDS is measured and shown in Figure 6. From Figure 6a, the peak-to-peak value of FDS increases as the amplitude of the modulation voltage gradually increases to 3 V. To achieve an improved modulation effect, the modulation amplitude can be suitably increased to generate the first-order modulation sidebands. However, it is essential to ensure that δ 1.2 [42]. The modulating signal amplitude E m 2.53 V can be calculated from Section 3.1.
Analysis of Figure 6b reveals that when the demodulation signal amplitude exceeds 0.25 V, the peak-to-peak value of the FDS remains nearly constant. The input amplitude of the server must fall within |±0.5V|. To prevent saturation of the input amplitude to the server, it is advisable to keep the amplitude of the modulation and demodulation signals below 2.8 V and 0.25 V, respectively. Furthermore, increasing the amplitude of the modulation and demodulation voltages raises the performance demands on the device. In this experiment, the modulation and demodulation voltages had amplitudes of 2.5 V and 0.23 V, respectively.
When keeping the aforementioned conditions constant, the frequency of the modulation and demodulation signals is adjusted within the range of 3.6 to 4.2 MHz. As shown in Figure 7a,b, the maximum values of the normalized peak-to-peak value and slopes of FDS at T3 and T4 are attained at the resonance frequency of 3.95 MHz. Consequently, the modulation and demodulation frequencies for this experiment were set to 3.95 MHz.

4. Experimental Results

4.1. Beat Frequency Test

The beat frequency method involves two light beams traveling in the same direction, with the same polarization and similar amplitudes, nearly coinciding during their transmission while maintaining a constant phase relationship. During this process, they are superimposed to create a wave with a frequency equal to the difference between the frequencies of the two incident beams. This method can be used to measure the linewidth and frequency stability of lasers [43]. The frequency stability of a beat frequency signal is quantified by the Allan variance, denoted as [44]:
S b e a t ( τ ) = σ b e a t 2 ( τ ) f ¯ = 1 f ¯ i = 1 N ( Δ f i + 1 Δ f i ) 2 2 N
where σ b e a t ( τ ) is the Allan standard deviation of the frequency drift of the beat signal, τ is the integration time, f ¯ is the average frequency of the laser, Δ f i + 1 Δ f is the frequency drift during the integration time, and N is the number of samples. When two independent lasers produce a beat frequency, the square of the stability of the beat frequency signal equals the sum of the squares of the stabilities of the two lasers.
S b e a t 2 ( τ ) = S 1 2 ( τ ) + S 2 2 ( τ )
where S 1 ( τ ) and S 2 ( τ ) are the stabilities of the two lasers, respectively.
The beat frequency test of two lasers of the same model is shown in Figure 8. After the aforementioned method, another frequency stabilization system of ECDL was constructed, with each of the two ECDLs being locked to T3 (384,228,115.203 MHz) of 87Rb and T4 (384,229,241.687 MHz) of 85Rb, respectively. The frequency difference between the two peaks was 1126.484 MHz.
The output light from both ECDLs was directed through the HWP and PBS, resulting in both beams becoming polarized in parallel. Two fiber couplers directed the two beams into a 1 × 2 PMF coupler (50:50). The combined beam is directed to an ultrafast fiber optic photoreceiver (UFOP) manufactured by Thorlabs (RXM10CF), which operates within a bandwidth of 40 kHz to 10 GHz. The signal captured by UFOP is divided into two parts. One channel is linked to a spectrum analyzer (ROGIL: RSA3030N), while the other channel is amplified using an AMP (Mini-Circuits: ZX60-P162LN+) and connected to a frequency counter (Keysight: 53230A).

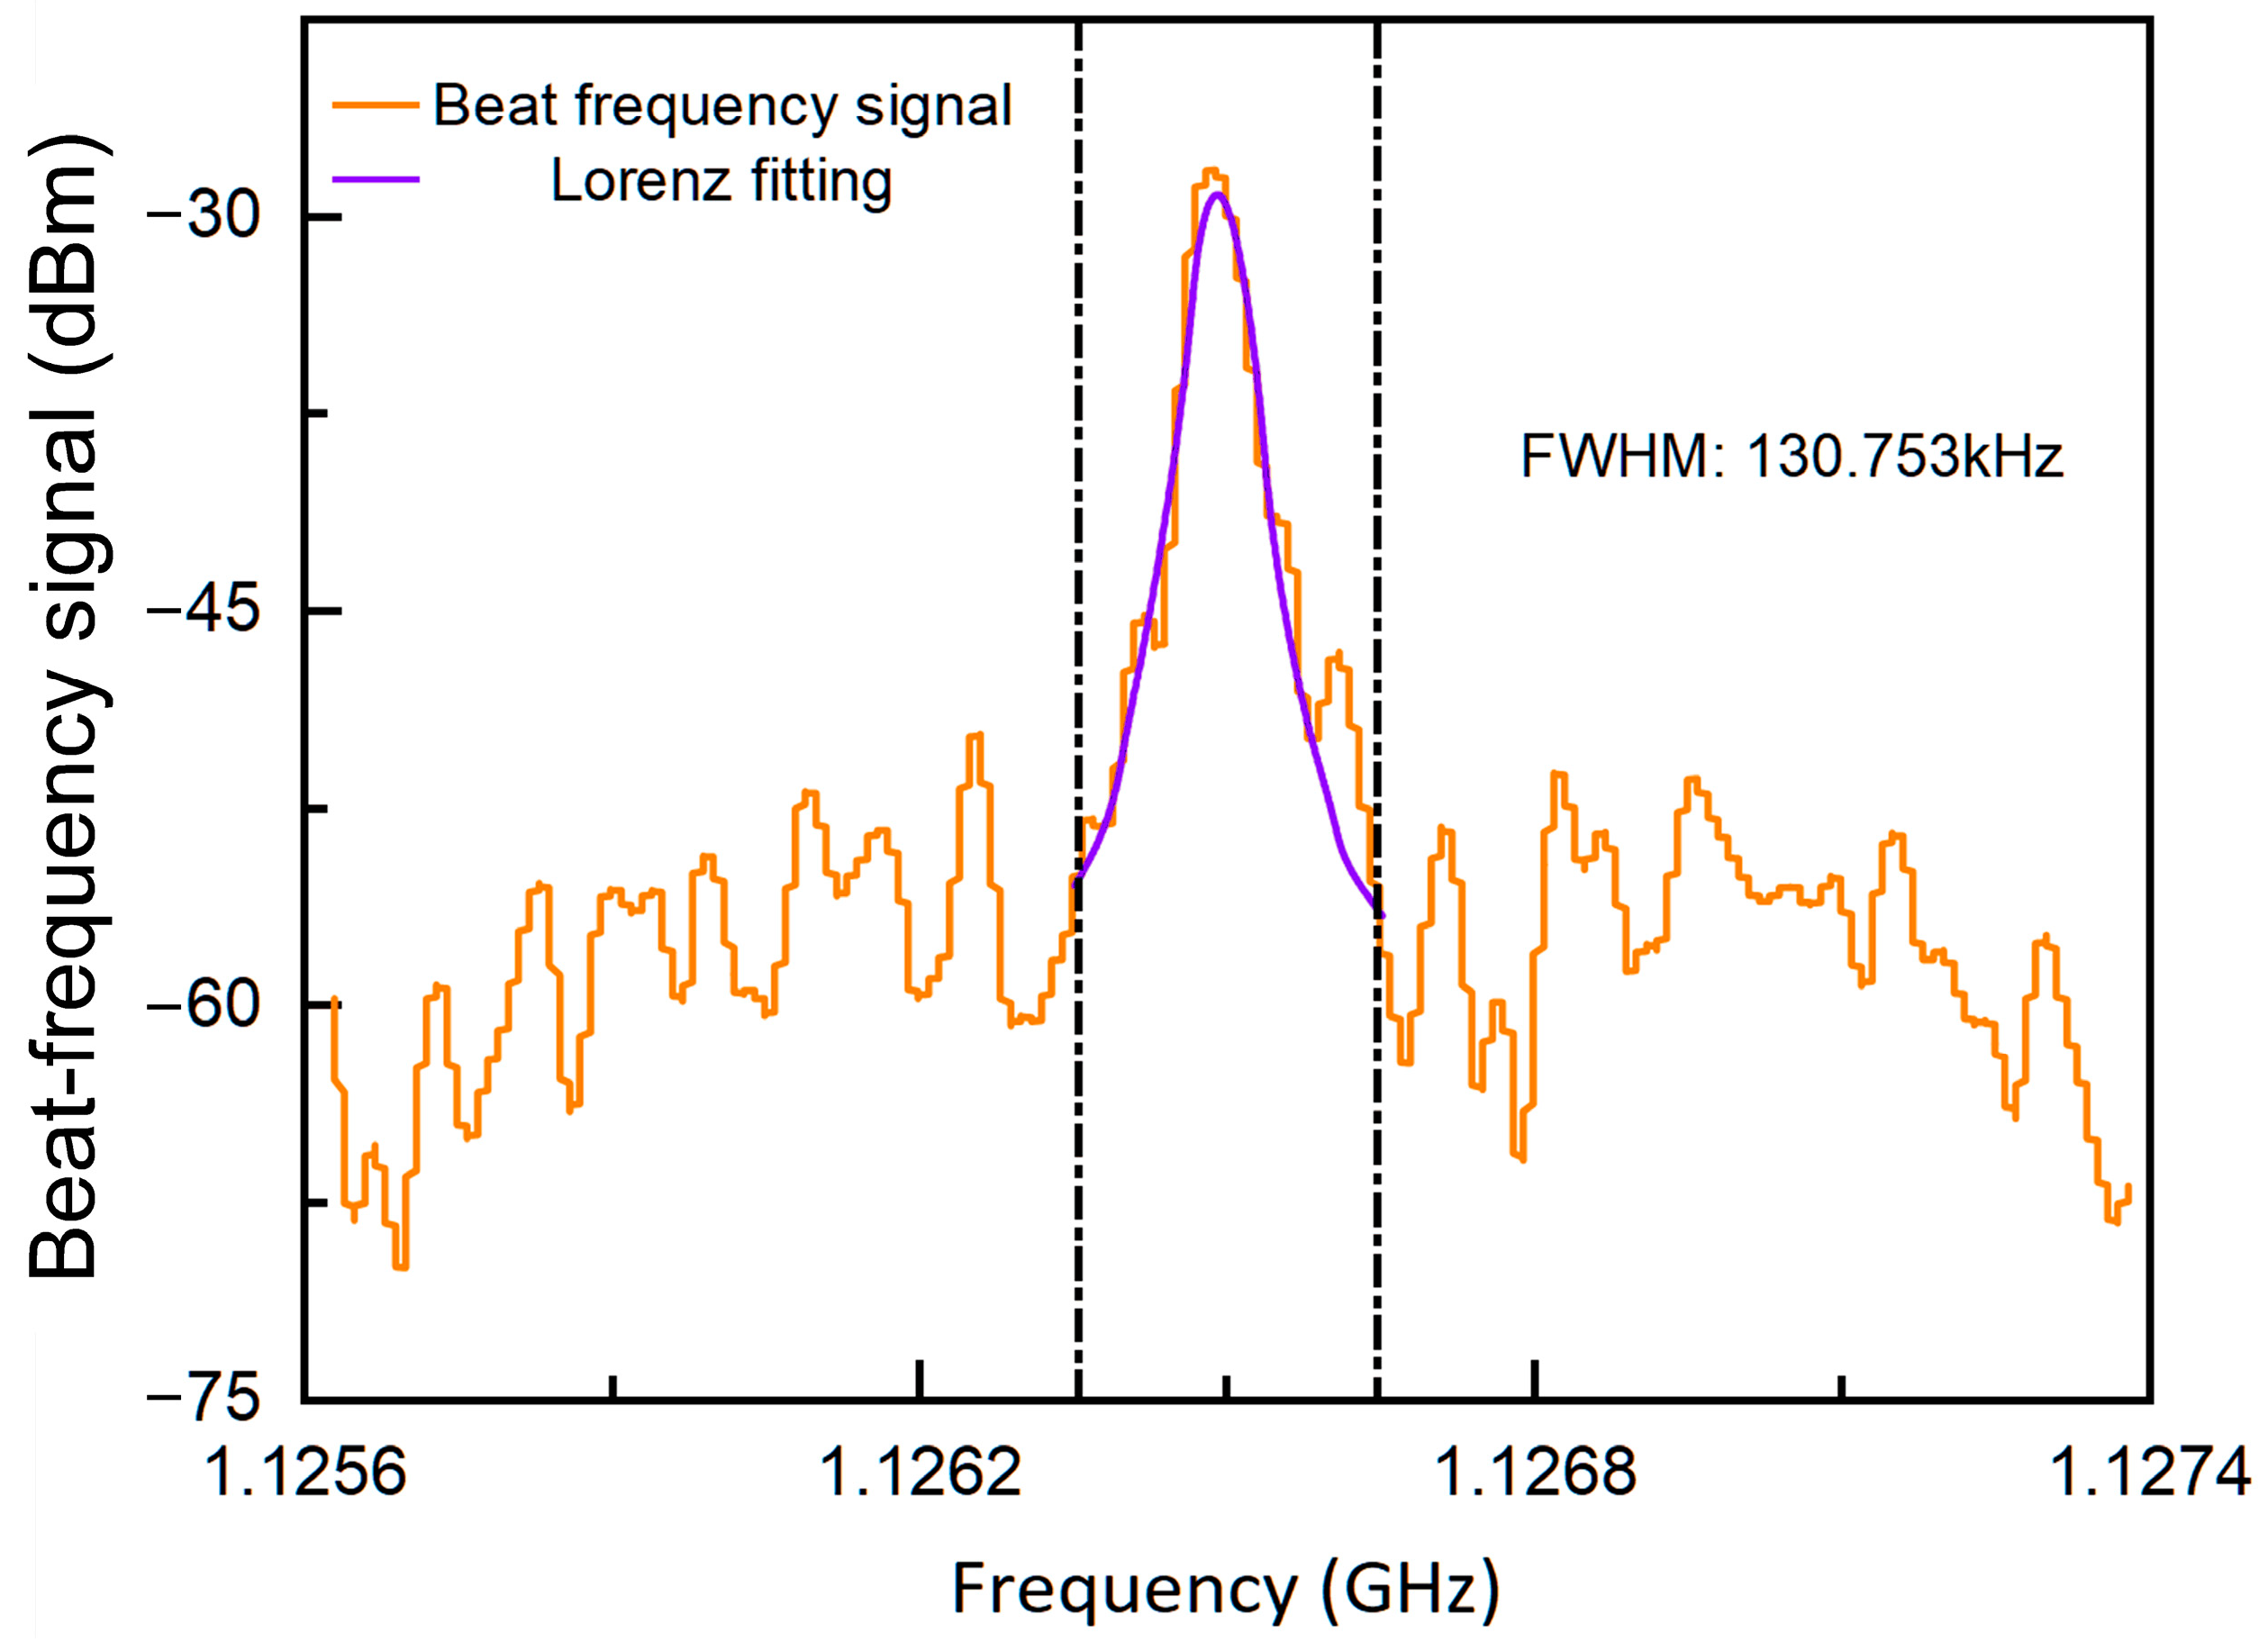
4.1.1. Laser Linewidth Measurement

The linewidth of the beat frequency signal on the spectrometer is shown in Figure 9, with the FWHM linewidth obtained after Lorentz fitting measured at 130.753 kHz. Given the comparable performance of the two lasers, it is estimated that the linewidth of each laser at frequency locking is approximately 65.4 kHz.

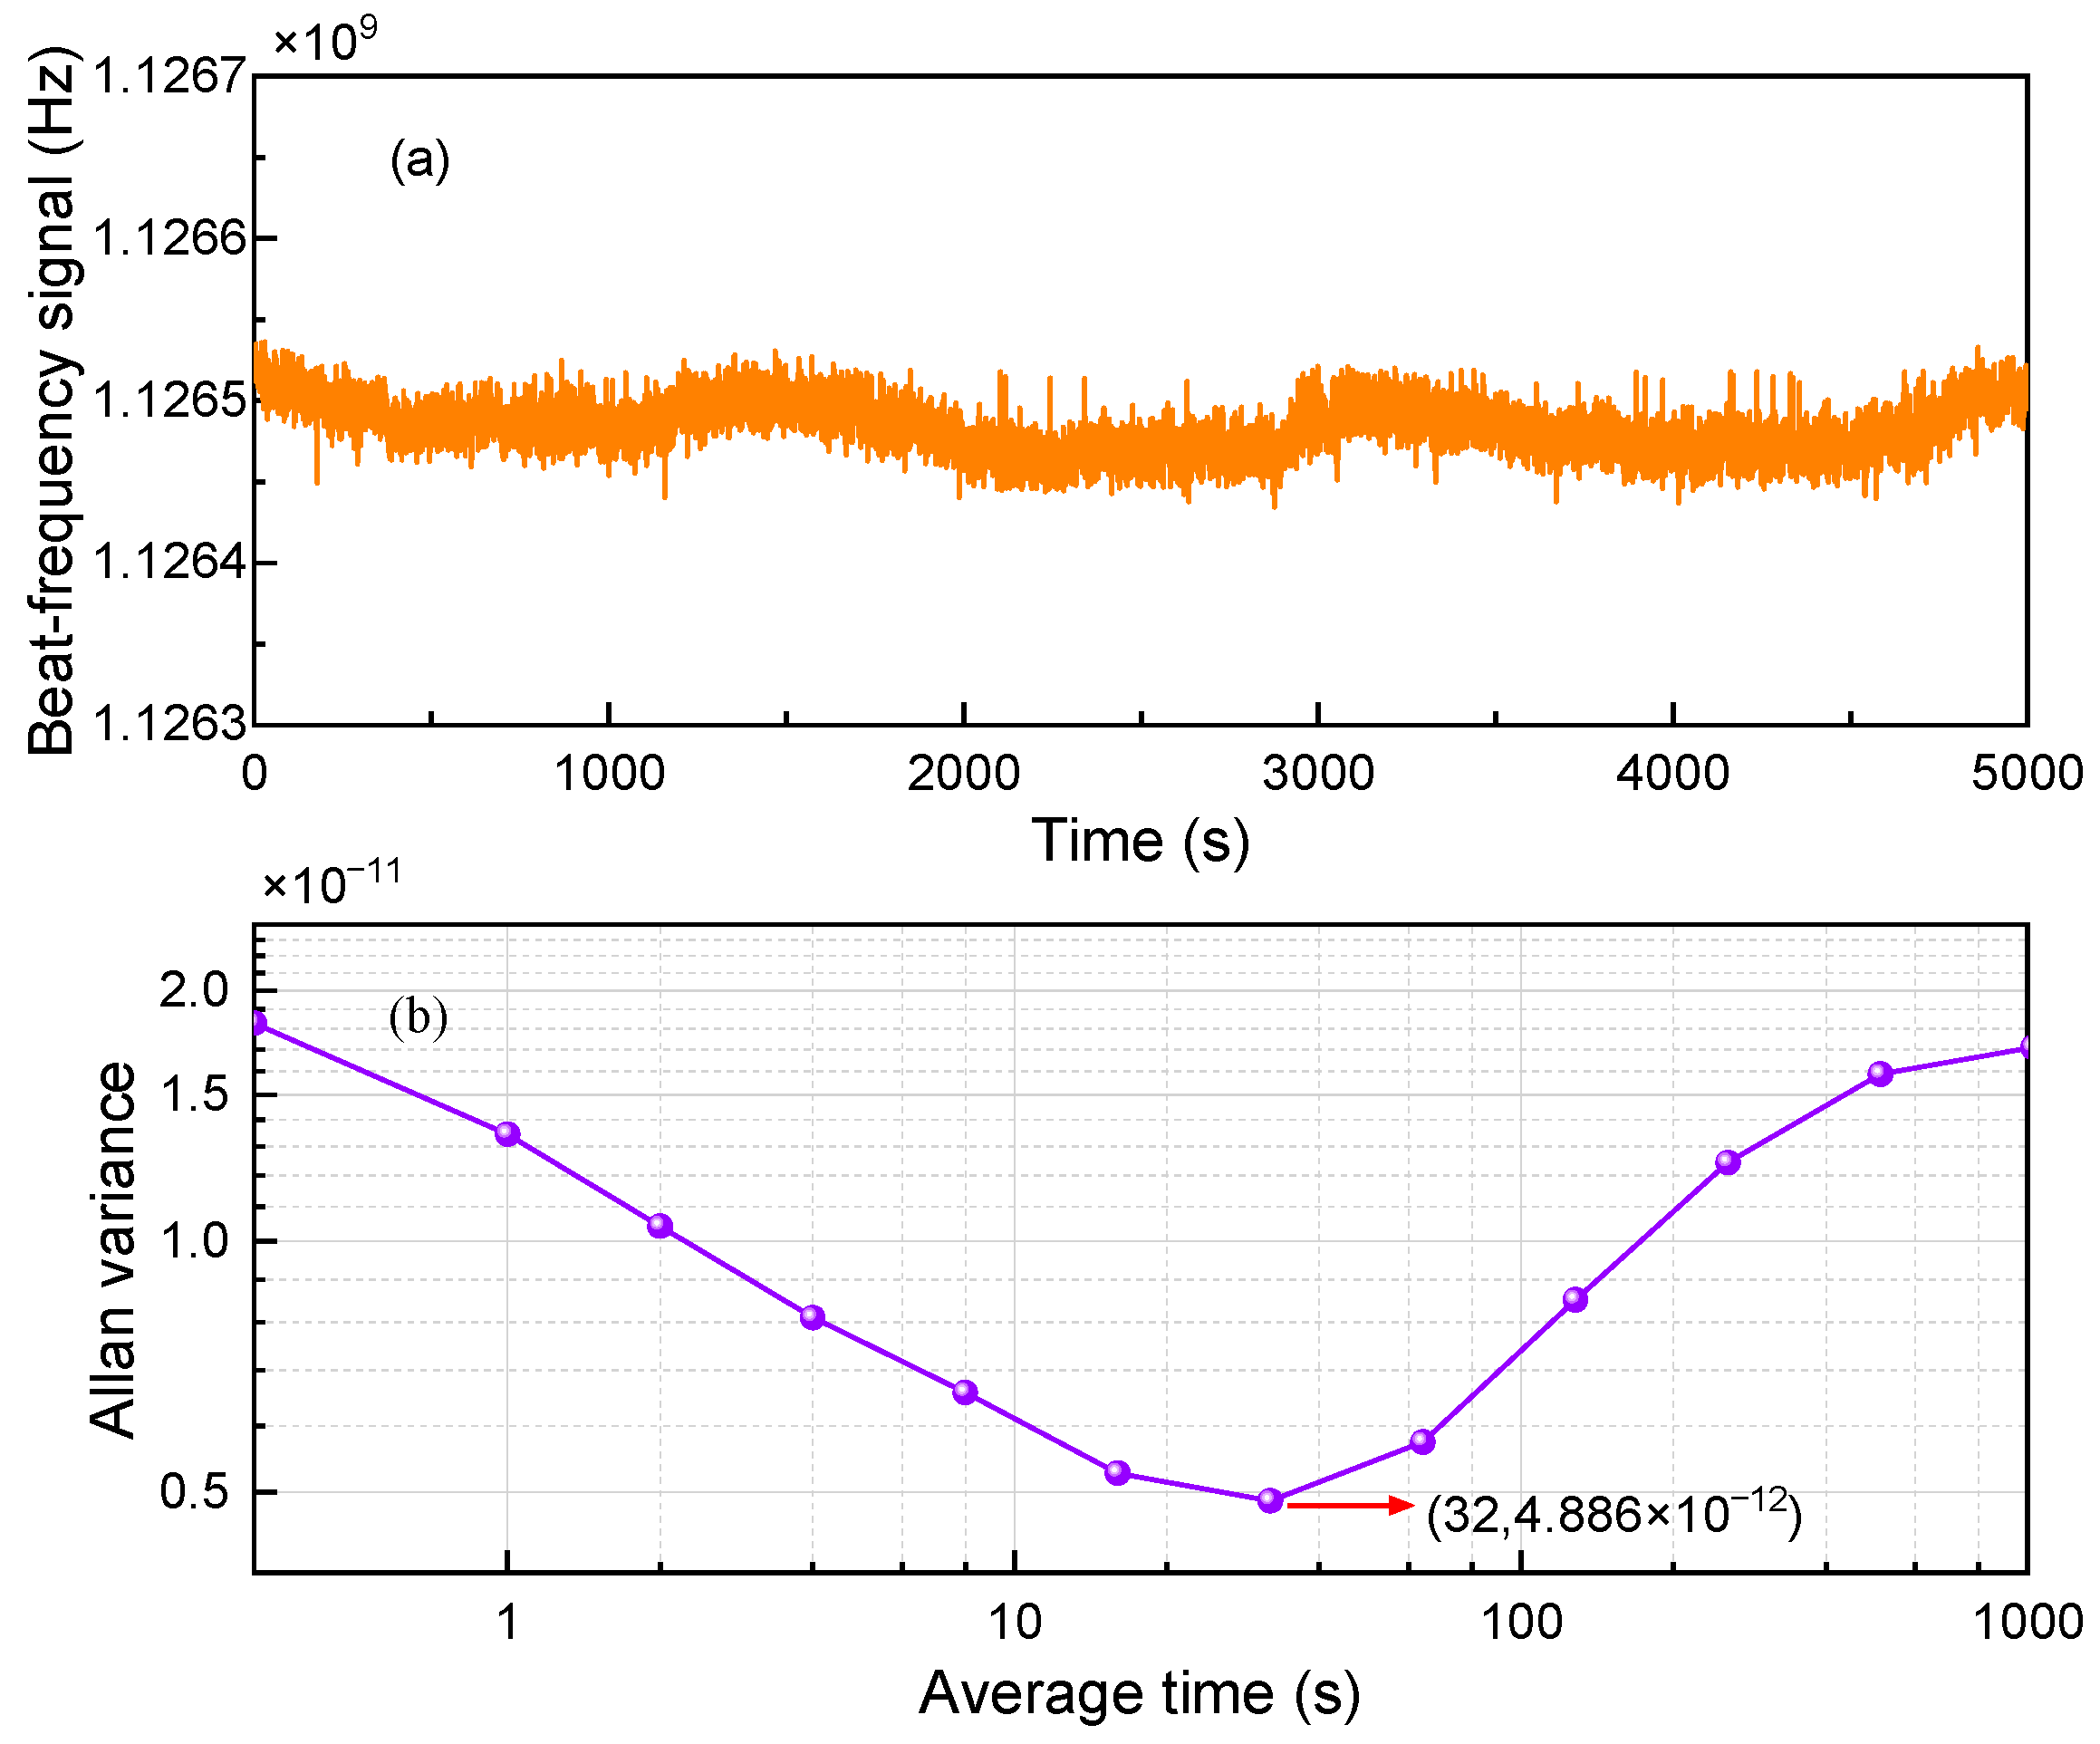
4.1.2. Frequency Stability Measurement

The frequency counter was connected to the computer via a network cable to display and store the data using LabVIEW. The duration of the beat frequency measurement was extended to 5000 s. The beat frequency signal reflects the relative frequency fluctuations between the two lasers, which is estimated to be approximately 100 kHz. The corresponding beat frequency signal is shown in Figure 10a.
The average frequency of the 780 nm laser (approximately 3.8423 × 10¹⁴ Hz) is utilized in Equation (7) to calculate the Allan variance of the beat frequency signal. Because the two lasers involved in the beat frequency are of the same model, the performance can be considered similar, denoted as S 1 ( τ ) = S 2 ( τ ) . Consequently, the stability of each laser can be derived from Equation (8) as S b e a t ( τ ) / 2 . The stability of the ECDL at frequency locking is obtained from the beat frequency signal, as shown in Figure 10b. The stability of the laser frequency is 4.886 × 10⁻¹²@32 s.

4.2. Stabilization Monitoring

The output light from the frequency-stabilized laser was connected to the wavelength meter, BRISTOL 671A (accuracy: ±0.2 pm), through a fiber coupler and a PMF for long-term observation. The 24 h operation status of the frequency stabilization system is monitored when both the wavelength meter and the frequency stabilization system are stabilized. The changes in laser frequency before and after frequency locking are shown in Figure 11a,b.
Figure 11a shows the frequency change of the laser during free running, with the frequency drift exceeding 0.6 pm over a period of 3000 s. In Figure 11b, the frequency change of the laser while in the locked state is shown, with the laser’s center frequency fluctuating less than 0.2 pm over a span of 25 h, indicating the excellent frequency stabilization of this system during long-term operation.

5. Conclusions

A frequency stabilization system for ECDL has been designed using Rb atomic modulation transfer spectroscopy technology. The SAS characteristics at various temperatures were analyzed, and adjustments were made simultaneously to the electro-optical parameters, including the optical power ratio, frequency, and amplitude of modulation and demodulation signals. This provided essential reference points for optimizing the frequency stabilization system (FDS). The results indicate a laser linewidth of approximately 65.4 kHz after frequency locking, with relative frequency fluctuations in the order of 100 kHz, resulting in a frequency stability of 4.886 × 10⁻¹²@32 s. Moreover, the central wavelength change over 25 h was less than 0.2 pm, offering an effective method for frequency locking the ECDL at 780 nm.
Nevertheless, this paper has certain limitations. Due to the precision limitations of the wavelength meter employed in the experiment, the accuracy of long-term stabilized laser measurements is compromised. Future research could employ a higher precision wavelength meter for enhancing frequency monitoring. Additionally, optimizing the polarization states of the pump and probe light, or the dimension of the Rb cell, has the potential to enhance the performance of frequency stabilization.

Author Contributions

Conceptualization, Y.W.; Data curation, R.X. and D.L.; Writing—original draft, Y.W.; Writing—review & editing, Z.D.; Funding acquisition, F.Q. All authors have read and agreed to the published version of the manuscript.

Funding

This research was funded by National Natural Science Foundation of China grant number [42274013, 62205375, 61873275].

Institutional Review Board Statement

Not applicable.

Informed Consent Statement

Not applicable.

Data Availability Statement

Data underlying the results presented in this paper are not publicly available at this time but may be obtained from the authors upon reasonable request. The data are not publicly available due to privacy.

Acknowledgments

This work was supported by the National Natural Science Foundation of China under Grant No. 42274013, No. 62205375, and No. 61873275.

Conflicts of Interest

The authors declare no conflict of interest.

References

  1. Hummon, M.T.; Kang, S.; Bopp, D.G.; Li, Q.; Westly, D.A.; Kim, S.; Fredrick, C.; Diddams, S.A.; Srinivasan, K.; Aksyuk, V.; et al. Photonic chip for laser stabilization to an atomic vapor with 10–11 instability. Optica 2018, 5, 443–449. [Google Scholar] [CrossRef]
  2. Döringshoff, K.; Gutsch, F.B.; Schkolnik, V.; Kürbis, C.; Oswald, M.; Pröbster, B.; Kovalchuk, E.V.; Bawamia, A.; Smol, R.; Schuldt, T.; et al. Iodine Frequency Reference on a Sounding Rocket. Phys. Rev. Appl. 2019, 11, 054068. [Google Scholar] [CrossRef]
  3. Shen, X.; Yan, M.; Hao, Q.; Yang, K.; Zeng, H. Adaptive Dual-Comb Spectroscopy With 1200-h Continuous Operation Stability. IEEE Photonics J. 2018, 10, 1503309. [Google Scholar] [CrossRef]
  4. Coddington, L.; Newbury, N.; Swann, W. Dual-comb spectroscopy. Optica 2016, 3, 414–426. [Google Scholar] [CrossRef] [PubMed]
  5. Meylahn, F.; Knust, N.; Willke, B. Stabilized laser system at 1550 nm wavelength for future gravitational-wave detectors. Phys. Rev. D 2022, 105, 122004. [Google Scholar] [CrossRef]
  6. Sinhal, M.; Johnson, A.; Willitsch, S. Frequency stabilisation and SI tracing of mid-infrared quantum-cascade lasers for precision molecular spectroscopy. Mol. Phys. 2023, 121, e2144519. [Google Scholar] [CrossRef]
  7. Li, Q.X. Research on Intelligent Technology of Laser Frequency Automatic Stabilization for Atomic Interferometer. Master’s Thesis, National University of Defense Technology, Changsha, China, 2018. [Google Scholar]
  8. Lv, M.J. Laser Frequency Stabilization Technology for Transportable Cold Atomic Interference Gravimete. Master’s Thesis, National University of Defense Technology, Changsha, China, 2020. [Google Scholar]
  9. Zou, P.F. Theoretical Modeling and Error Analysis of Cold Atom Interferometer. Master’s Thesis, National University of Defense Technology, Changsha, China, 2016. [Google Scholar]
  10. Sheng, L.; Ge, C.; Cao, Q.; Huang, L.; Zhao, Z.; Li, L.; Qiao, S.; Zhang, A.; Wei, Y.; Jin, H.; et al. Wide-range external-cavity tunable semiconductor laser with mode-hopping fre. Infrared Laser Eng. 2023, 52, 160–166. [Google Scholar]
  11. Wu, Y.; Qin, F.; Li, Y.; Ding, Z.; Xu, R. Designing an Automatic Frequency Stabilization System for an External Cavity Diode Laser Using a Data Acquisition Card in the LabVIEW Platform. Appl. Sci. 2024, 14, 308. [Google Scholar] [CrossRef]
  12. Luan, G.J.; Mao, H.C.; Shi, X.H. Method for Modulating Transfer Spectrally Stabilized Laser Frequency Based on Rb87. Opt. Optoelectron. Technol. 2020, 18, 83–86. [Google Scholar]
  13. Preston, D.W. Doppler-free saturated absorption: Laser spectroscopy. Am. J. Phys. 1996, 64, 1432–1436. [Google Scholar] [CrossRef]
  14. Shirley, J.H. Modulation transfer processes in optical heterodyne saturation spectroscopy. Opt. Lett. 1982, 7, 537–539. [Google Scholar] [CrossRef] [PubMed]
  15. Bjorklund, G.C. Frequency-modulation spectroscopy: A new method for measuring weak absorptions and dispersions. Opt. Lett. 1980, 5, 15–17. [Google Scholar] [CrossRef] [PubMed]
  16. Corwin, K.L.; Lu, Z.T.; Hand, C.F.; Epstein, R.J.; Wieman, C.E. Frequency-stabilized diode laser with the Zeeman shift in an atomic vapor. Appl. Opt. 1998, 37, 3295–3298. [Google Scholar] [CrossRef] [PubMed]
  17. Wieman, C.; Hänsch, T.W. Doppler-Free Laser Polarization Spectroscopy. Phys. Rev. Lett. 1976, 36, 1170–1173. [Google Scholar] [CrossRef]
  18. Noh, H.R.; Park, S.E.; Li, L.Z.; Park, J.D.; Cho, C.H. Modulation transfer spectroscopy for 87 Rb atoms: Theory and experiment. Opt. Express 2011, 19, 23444–23452. [Google Scholar] [CrossRef]
  19. Kovachy, T.; Chiow, S.; Kasevich, M.A. Adiabatic-rapid-passage multiphoton Bragg atom optics. Phys. Rev. A 2012, 86, 011606. [Google Scholar] [CrossRef]
  20. Galzerano, G.; Bertinetto, F.; Bava, E. Characterization of the modulation transfer spectroscopy method by means of He-Ne lasers and 127I2 absorption lines at λ = 612 nm. Metrologia 2000, 37, 149. [Google Scholar] [CrossRef]
  21. Galzerano, G.; Bava, E.; Bisi, M.; Bertinetto, F.; Svelto, C. Frequency stabilization of frequency-doubled Nd:YAG lasers at 532 nm. In Proceedings of the 1998 Conference on Precision Electromagnetic Measurements Digest (Cat. No.98CH36254), Washington, DC, USA, 6–10 July 1998; pp. 193–194. [Google Scholar]
  22. Nakagawa, K.; Sato, Y.; Musha, M.; Ueda, K. Modulation-free acetylene-stabilized lasers at 1542 nm using modulation transfer spectroscopy. Appl. Phys. B 2005, 80, 479–482. [Google Scholar] [CrossRef]
  23. Bertinetto, F.; Cordiale, P.; Galzerano, G.; Bava, E. Frequency stabilization of DBR diode laser against Cs absorption lines at 852 nm using the modulation transfer method. IEEE Trans. Instrum. Meas. 2001, 50, 490–492. [Google Scholar] [CrossRef]
  24. Xu, Z.; Peng, X.; Li, L.; Zhou, Y.; Qiu, X.; Zhang, D.; Zhou, M.; Xu, X. Modulation transfer spectroscopy for frequency stabilization of 852 nm DBR diode lasers. Laser Phys. 2020, 30, 025701. [Google Scholar] [CrossRef]
  25. Wang, W.L.; Ye, J.; Jiang, H.L.; Bi, Z.Y.; Ma, L.S.; Xu, X.Y. Frequency stabilization of a 399-nm laser by modulation transfer spectroscopy in an ytterbium hollow cathode lamp. Chin. Phys. B 2011, 20, 013201. [Google Scholar] [CrossRef]
  26. De Melo, Á.M.; Letellier, H.; Apoorva, A.; Glicenstein, A.; Kaiser, R. Laser frequency stabilization by modulation transfer spectroscopy and balanced detection of molecular iodine for laser cooling of 174Yb. Opt. Express 2024, 32, 6204–6214. [Google Scholar] [CrossRef] [PubMed]
  27. Yu, F.; Ruan, J.; Wang, X.; Zhang, H.; Liu, D.; Chen, J.; Shi, J.; Zhang, S. Frequency stabilization of DFB laser via modulation transfer spectroscopy. In Proceedings of the Second International Conference on Photonics and Optical Engineering 2017, Xi’an, China, 28 February 2017; Volume 10256, pp. 160–166. [Google Scholar]
  28. Sharma, L.; Roy, A.; Panja, S.; De, S. Stabilizing Frequency of a Diode Laser to a Reference Transition of Molecular Iodine through Modulation Transfer Spectroscopy. Atoms 2023, 11, 83. [Google Scholar] [CrossRef]
  29. Cheng, B.; Wang, Z.Y.; Wu, B.; Xu, A.P.; Wang, Q.Y.; Xu, Y.F.; Lin, Q. Laser frequency stabilization and shifting by using modulation transfer spectroscopy. Chin. Phys. B 2014, 23, 104222. [Google Scholar] [CrossRef]
  30. Sun, D.; Zhou, C.; Zhou, L.; Wang, J.; Zhan, M. Modulation transfer spectroscopy in a lithium atomic vapor cell. Opt. Express 2016, 24, 10649–10662. [Google Scholar] [CrossRef] [PubMed]
  31. Preuschoff, T.; Schlosser, M.; Birkl, G. Optimization strategies for modulation transfer spectroscopy applied to laser stabilization. Opt. Express 2018, 26, 24010–24019. [Google Scholar] [CrossRef] [PubMed]
  32. Wu, B.; Zhou, Y.; Weng, K.; Zhu, D.; Fu, Z.; Cheng, B.; Wang, X.; Lin, Q. Modulation transfer spectroscopy for D1 transition line of rubidium. J. Opt. Soc. Am. B 2018, 35, 2705–2710. [Google Scholar] [CrossRef]
  33. Yan, J.X.; Yan, Y. Light-intensity distribution in the nonlinear medium for near-degenerate four-wave mixing. Opt. Technol. 1998, 1, 73–75+82. [Google Scholar]
  34. Yu, X.; Lü, M.J.; Zhang, X. Research on Frequency Locking of 1560 nm Fiber Laser Based on Rubidium Atomic Modulation Transfer Spectroscopy Technology. Chin. J. Laser 2022, 49, 15–23. [Google Scholar]
  35. Song, W.; Zhu, X.X.; Wu, B. Research on Frequency Stabilization Characteristics of Multi -parameter Dependent Laser Source Based on Modulated Transfer Spectrum. Acta Photonica Sin. 2021, 50, 71–79. [Google Scholar]
  36. McCarron, D.J.; King, S.A.; Cornish, S.L. Modulation transfer spectroscopy in atomic rubidium. Meas. Sci. Technol. 2008, 19, 105601. [Google Scholar] [CrossRef]
  37. Wu, Y.Y.; Qin, F.J.; Li, D.Y. Design of Multi-point Temperature Measurement System Applied to MTS. Instrum. Tech. Sensos 2023, 1, 73–77. [Google Scholar]
  38. Wang, X.P.; Wang, J.H.; Lin, Z.X. Design of iodine discriminator temperature measurement systems. Transducer Microsyst. Technol. 2015, 34, 63–65. [Google Scholar]
  39. Yan, J.Q.; Zhang, Y.; Hou, F.Y. Temperature dependence of Rb D2 line in saturation spectroscopy. J. At. Mol. Phys. 2008, 25, 1057–1062. [Google Scholar]
  40. Steck, D.A. Rubidium 85 D Line Data; 2001; pp. 1–31. Available online: https://steck.us/alkalidata/rubidium85numbers.pdf (accessed on 1 February 2024).
  41. Steck, D.A. Rubidium 87 D Line Data; 2003; pp. 1–29. Available online: https://steck.us/alkalidata/rubidium87numbers.1.6.pdf (accessed on 1 February 2024).
  42. Jia, Y.D.; Lin, Z.L.; Ou, P.; Zhang, C.X. Optimization of electro-optical parameter of optical frequency standard system based on modulationtransfer spectroscopy technique. Acta Phys. Sin. 2011, 60, 124214. [Google Scholar] [CrossRef]
  43. Ma, Z.; Lu, X.G.; Pei, L.Y. Monitoring the Frequency Locking by Recording the Beat Notes between Two Independent Laser. J. Qufu Norm. Univ. 2013, 39, 63–66. [Google Scholar]
  44. Liu, T.; Ma, X.; Zhang, S.; Ren, G. Measurement of Frequency Stability of Two Independent Lasers with the Same Mode. Chin. J. Lasers 2012, 39, 174–178. [Google Scholar]
Figure 1. The overall scheme of the MTS frequency stabilization system. (a) PC. (b)Control box. (c) The commercial server. (d) The modem. (e) The dual-channel temperature control module. (f) The frequency-stabilized optical path.
Photonics 11 00298 g001
Figure 2. Adjusted SAS, MTS, and scanning signals.
Photonics 11 00298 g002
Figure 3. Normalized SAS signals corresponding to different temperatures. (a) 25 °C. (b) 30 °C. (c) 35 °C. (d) 40 °C. (e) 45 °C. (f) 50 °C.
Photonics 11 00298 g003
Figure 4. The peak-to-peak value of FDS corresponds to a different power of pump light. (a) 0.05 mW. (b) 0.075 mW. (c) 0.1 mW.
Photonics 11 00298 g004
Figure 5. The peak-to-peak value of FDS corresponds to the different frequency-stabilized light power.
Photonics 11 00298 g005
Figure 6. The peak-to-peak value of FDS corresponds to different modulation or demodulation voltage amplitudes. (a) The modulation voltage amplitudes. (b) The demodulation voltage amplitudes.
Photonics 11 00298 g006
Figure 7. The normalized peak-to-peak value and slope of FDS correspond to different modulation and demodulation frequencies. (a) T3. (b) T4.
Photonics 11 00298 g007
Figure 8. The beat frequency test of two lasers of the same model.
Photonics 11 00298 g008
Figure 9. The linewidth of the beat frequency signal.
Photonics 11 00298 g009
Figure 10. Beat frequency signal at 5000 s and laser stability. (a) Beat-frequency signal. (b) Allan variance.
Photonics 11 00298 g010
Figure 11. Laser frequency changes before and after frequency locking. (a) Before frequency locking. (b) After frequency locking.
Photonics 11 00298 g011
Disclaimer/Publisher’s Note: The statements, opinions and data contained in all publications are solely those of the individual author(s) and contributor(s) and not of MDPI and/or the editor(s). MDPI and/or the editor(s) disclaim responsibility for any injury to people or property resulting from any ideas, methods, instructions or products referred to in the content.

