Article

Laser Remote Sensing of Seismic Wave with Sub-Millimeter Scale Amplitude Based on Doppler Characteristics Extracted from Wavefront Sensor

1
Key Laboratory of Vibration Signal Capture and Intelligent Processing, School of Electronic Engineering, Yili Normal University, 448 Jiefang Road, Yining 835000, China
2
National Laboratory of Solid State Microstructures, Key Laboratory of Intelligent Optical Sensing and Manipulation (Nanjing University), College of Engineering & Applied Sciences, Ministry of Education, Nanjing University, 22 Hankou Road, Nanjing 210093, China
*
Author to whom correspondence should be addressed.
Photonics 2024, 11(3), 204; https://doi.org/10.3390/photonics11030204
Submission received: 21 December 2023 / Revised: 20 February 2024 / Accepted: 22 February 2024 / Published: 24 February 2024
(This article belongs to the Special Issue Optical Communication, Sensing and Network)

Abstract

:
Laser remote sensing of earthquake waves has the potential to be used in many applications. This article shows a Doppler model for laser remote sensing of seismic waves based on a wavefront sensor. The longitudinal vibration wave is analyzed using remote sensing, guided by theoretical principles. To determine the magnitude of ground vibration, we employ the method of wavefront phase change analysis, utilizing a continuous laser emitting light with a wavelength of 635 nm to illuminate the ground target. The ground vibration amplitude within the range of 0.12–1.18 mm was examined, confirming the reasonableness of the Doppler model. Simultaneously, the experimental findings indicate that the system exhibits a certain enhancement in detection accuracy compared to the conventional laser remote sensing detection technique. This approach can detect vibration signals at a sub-millimeter scale level, with an accuracy of 1% to 2%. The approach can fulfill the requirements for detecting seismic waves with low frequencies.

1. Introduction

Seismic waves interact with different types of geological bodies when they propagate underground, providing information about underground geological structures and rock properties. Different types of ores and surrounding rocks have different physical properties, such as density, elastic modulus, and wave velocity. When seismic waves propagate underground, reflection, refraction, and scattering will occur in these different types of geology, which will affect the propagation path and velocity of seismic waves [1,2,3]. Laser remote sensing of seismic wave detection is a laser-based technology that allows for the precise and sensitive detection of ground vibration waveforms without physical touch. The magnitude of ground vibration in seismic investigation is around 1 millimeter. When seismic waves propagate through the subsurface, geological feature variations cause wave velocity alterations [4]. Hence, there is a requirement for an optical remote sensing technique that can effectively identify ground micro-vibration and provide a comprehensive understanding of the associated waveform properties. Recently, researchers have employed high-resolution optical remote sensing data to examine ground vibration waveforms [5] and achieved distant identification of seismic waves and subterranean formations. Optical remote sensing technology can identify minute vibrations, such as those caused by landmines [6] and tiny seismic waves [7].
To address the issue of remote laser echo signal attenuation and vibration waveform analysis, researchers employed the He-Ne laser interferometer [8] and Michelson interferometer [9]. Nevertheless, these methods are constrained by limitations such as the need to establish a reference and measurement arm and the presence of a complex optical system. Hence, Silvio Bianchi [10] introduced a technique that does not require an interferometer to detect vibration signals over distances of several hundred meters. This method utilizes the scattering speckle pattern created when a laser irradiates a rough surface to detect the surface’s vibration. Optical technology is crucial for monitoring surface deformation and catastrophe prevention [11]. Several scholars have implemented laser telemetry devices on uncrewed aerial vehicles (UAVs) to monitor ground vibration signals remotely, including lidar [12,13] and synthetic aperture radar [14]. By utilizing optical detection, ranging remote sensing technology, and ground displacement monitoring technology [15], we can examine the vibration signals produced by occurrences like earthquakes [16] and landslides [17] and determine parameters such as Doppler frequency change [18], energy, and magnitude [19]. Furthermore, ground vibration signals can be detected using high-altitude global navigation satellite systems [20] and high-altitude balloons [21,22]. However, the process of recycling the detectors takes much work.
Wavefront sensors offer numerous advantages over traditional seismic wave laser remote sensing for detecting ground vibration signals. No additional reference arm is required, and the volume is compact and straightforward to deploy. The precise measurement of mechanical vibration information can be accomplished by detecting the alteration in the wavefront phase, enabling the detection of arrays. Wavefront sensors have been extensively employed for detecting vibration signals at the micron level [23,24,25,26,27,28]. Nevertheless, more quantitative analysis of vibration signals at the millimeter level still needs to be performed. In this study, we build a sub-millimeter and millimeter-scale seismic wave Doppler model using the wavefront sensor laser remote sensing of seismic waves detection system. Theoretical analysis is conducted to examine the correlation between target vibration and detector output, and experimental results confirm the rationality of the model.

2. Seismic Wave Laser Remote Sensing Detection System and Working Mechanism

The generation of longitudinal waves occurs on the surface when the seismic source is excited. The Doppler effect is seen when a laser is incident in the direction of ground vibration, resulting in the backscattering light of the laser carrying characteristic information related to seismic waves. This study employs laser Doppler technology to provide dependable data assistance for earthquake disaster monitoring, subsurface structural analysis, and seismic source parameter inversion based on research conducted on laser remote sensing of seismic waves. The present study introduces a Doppler model for laser remote sensing of seismic waves that effectively acquires ground vibration data via a change in the Doppler frequency of laser signals and the phase of the wavefront sensor.
The present study utilizes a laser remote sensing system for seismic wave detection founded on the Shack-Hartmann wavefront sensor. As seen in Figure 1, the system comprises a steady laser source, a collimating lens, an optical corrector, a filter, a telescope system, and a wavefront sensor. The use of laser Doppler technology in detecting seismic waves is a result of the study conducted on laser remote sensing detection of seismic waves. The laser source creates a beam that maintains a consistent output, while the collimating lens is responsible for aligning and concentrating the laser beam. An optical corrector positioned at the source regulates the laser’s direction. Subsequently, the laser undergoes reflection and scattering upon interaction with the seismic source. A filter is precisely placed along the reflection path of the laser in order to effectively separate and isolate the interference caused by ambient stray light. The telescope system is designed to gather the faint light echo signal and concentrate it onto the wavefront sensor, forming a spot surface after passing through the collimating lens. Upon receiving the reflected laser signal, the wavefront sensor will calculate and record the real-time phase change in the beam at each microlens using the data acquisition system.

3. Theoretical Analysis of Seismic Wave Laser Remote Sensing Detection System

3.1. Wavefront Sensor Phase

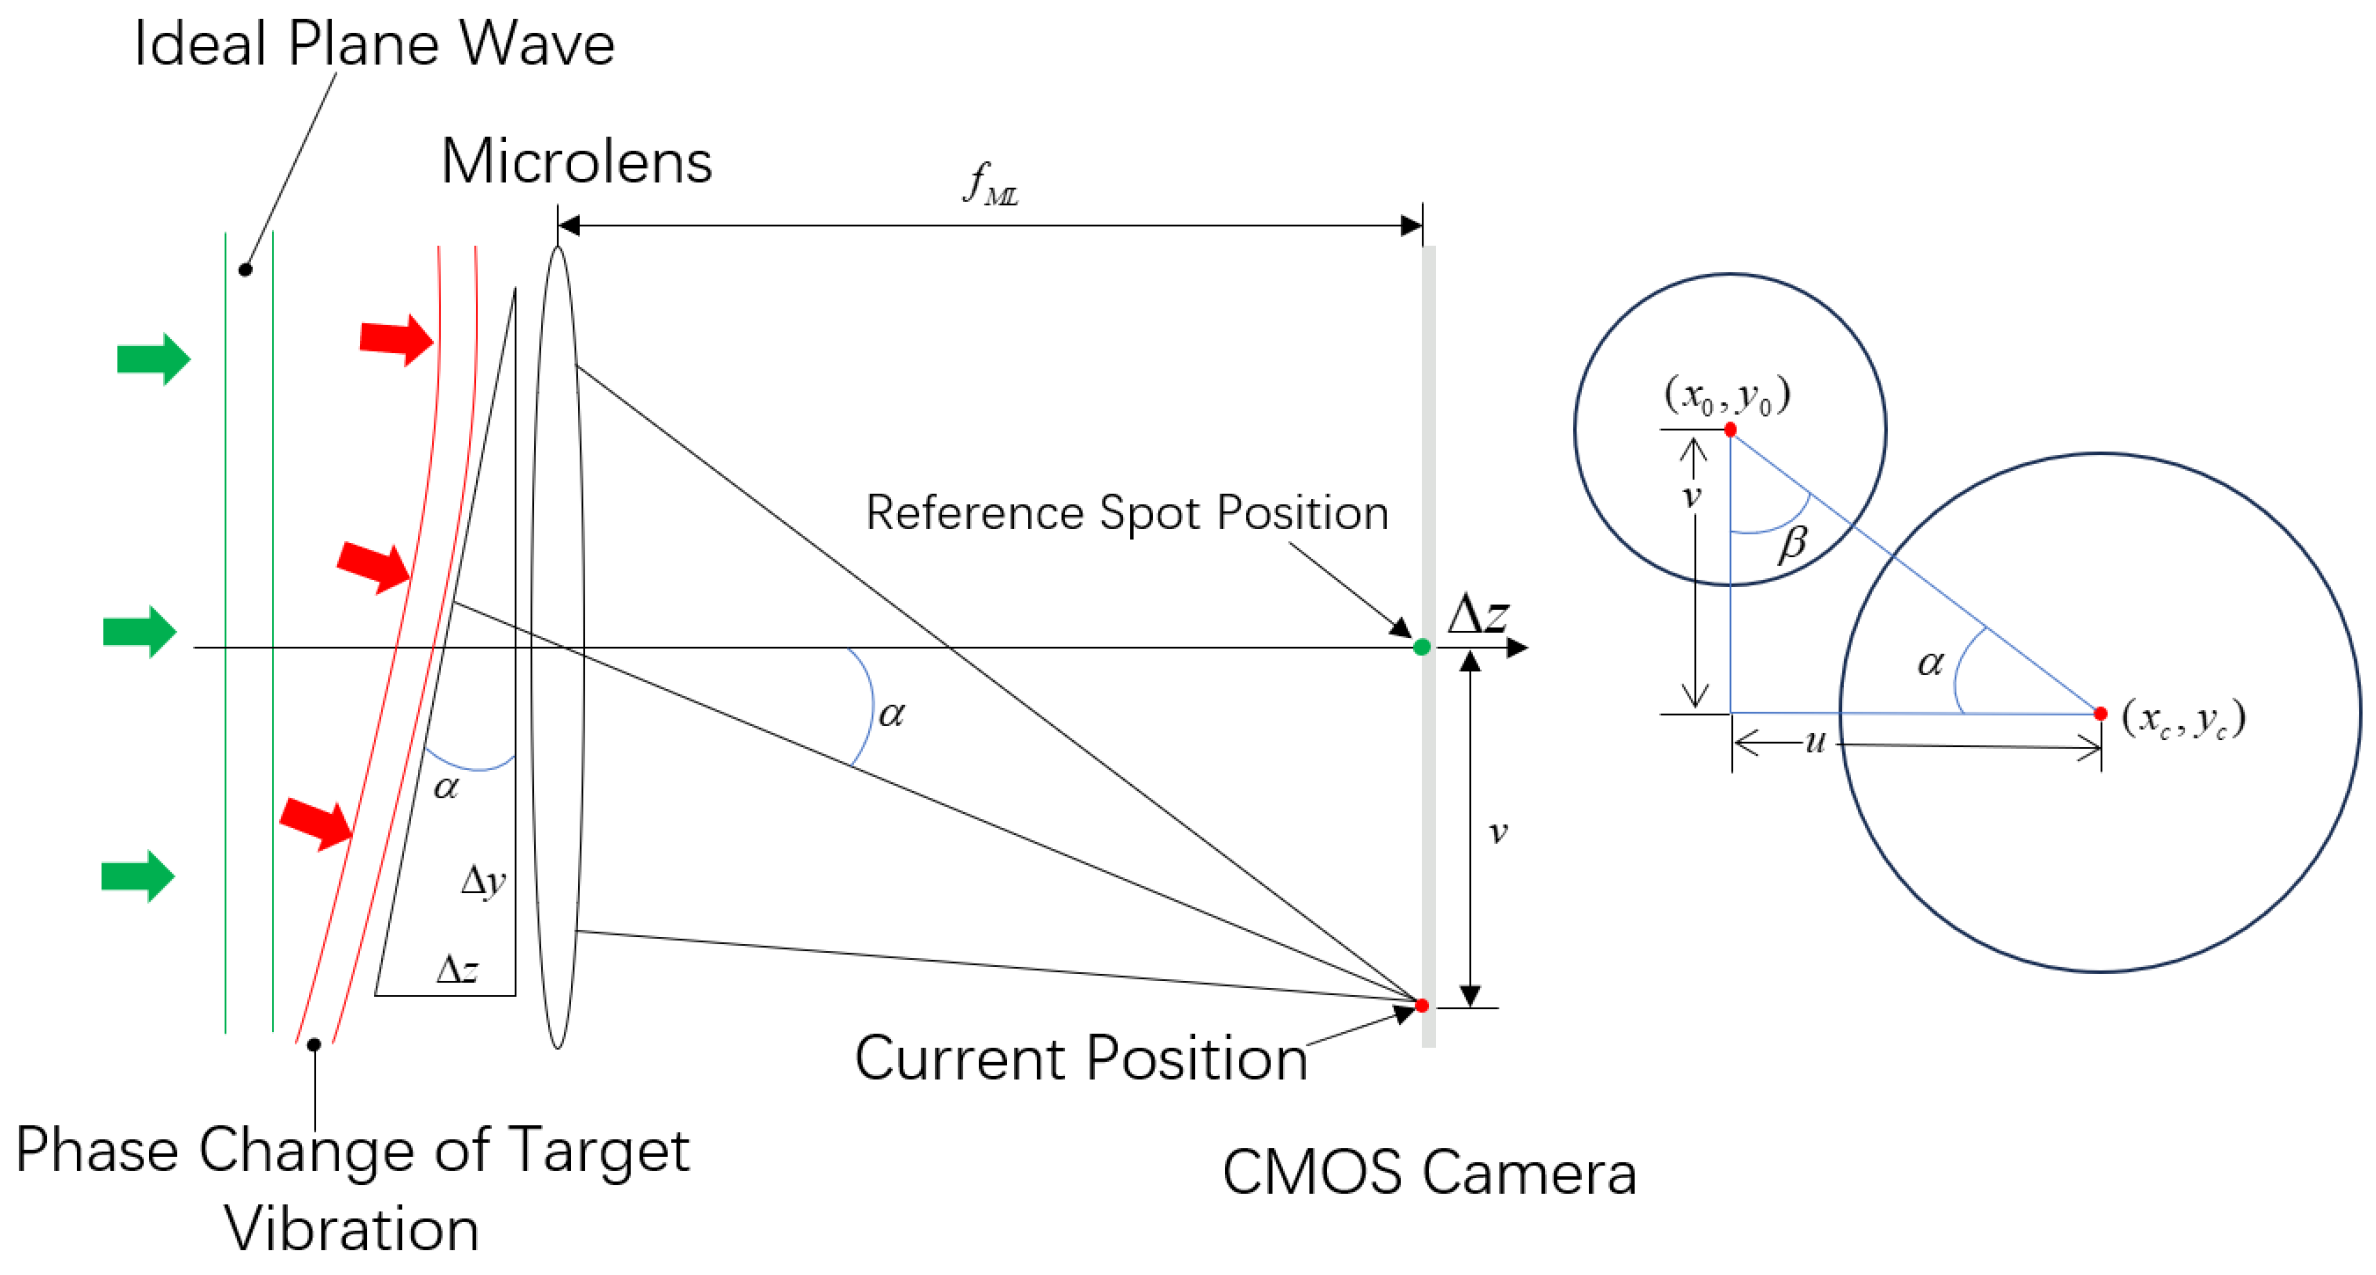
The Shack-Hartmann wavefront sensor comprises a complementary metal-oxide-semiconductor (CMOS) camera and an array of microlenses. Determining the offset of spot displacement involves the calculation of the center coordinates of all observable spots, followed by subtracting the associated reference coordinates. When the incident wavefront experiences distortion, the resulting array image of the microlens will likewise exhibit distortion, causing it to deviate from the focal point of the ideal wavefront, as depicted in Figure 2. The wavefront reconstruction technique can rebuild the wavefront’s phase distribution based on this slope [28,29,30,31,32].
The wavefront slope is the partial derivative of the wavefront phase to the offset, divided into horizontal ( ϕ / u ) and vertical ( ϕ / v ) directions. x c and y c represent the sub-aperture centroid coordinates of the distorted wavefront in the horizontal and vertical directions [33], respectively, as shown in Figure 2. The image slope of each sub-aperture of the wavefront sensor is calculated using the gray average approach [34]. W ( x , y ) is the weighting factor applied to the gray value of a pixel during the calculation of centroid coordinates. σ denotes the root mean square error. x 0 and y 0 denotes the reference centroid coordinates. S w is the aggregate of the weighted total of the points on the receiver of the Shack-Hartmann wavefront sensor. The weighting factor W ( x , y ) is utilized to assign a weight to the spot intensity to consider the pixels’ contribution. The comprehensive intensity of the spot on the entire wavefront sensor can be derived by calculating the weighted sum of each pixel point. Considering the weight factor and spot intensity, the centroid’s position information in the x direction can be produced by multiplying the horizontal centroid coordinate x with the weight factor W ( x , y ) and the spot intensity I ( x , y ) and then summing them. Considering the weight factor and spot intensity, the position information of the centroid in the y direction can be calculated by multiplying the vertical centroid coordinate y with the weight factor W ( x , y ) and the spot intensity I ( x , y ) and then summing them. The horizontal and vertical coordinates of the centroid position are based on the product of the coordinate value of the point and the spot intensity, and the sum of the product of the centroid coordinates of the point is divided by the cumulative sum of the spot intensity. Hence, the sub-aperture mass abundance centric coordinates in the horizontal direction may be denoted as x c = S x / S w , while the sub-aperture mass abundance centric coordinates in the vertical direction can be denoted as y c = S y / S w . To determine the phase of the distorted wavefront, we employ the mode approach outlined in [33,35,36,37,38,39,40].
W ( x , y ) = 1 2 π 3 e 1 2 σ 2 ( x x 0 ) 2 1 2 π 3 e 1 2 σ 2 ( y y 0 ) 2
S w = x , y I ( x , y ) W ( x , y )
S x = x , y x I ( x , y ) W ( x , y )
S y = x , y y I ( x , y ) W ( x , y )

3.2. Laser Echo Signal Doppler Effect

When the source is excited, the laser echo signal will produce a Doppler frequency shift with time so that its phase will also change, and the wavefront sensor can detect the change. Despite the laser comprising many frequency components, it will undergo integral modulation due to seismic waves when the ground vibrates. Simultaneously, the laser phase will undergo a collective alteration. The wavefront sensor can detect the overall change in the time domain, which differs from the common detection in the frequency domain. Hence, the Doppler frequency shift can be derived by analyzing the phase of the laser echo signal, enabling the detection and identification of ground vibration features.
Equation (5) can mathematically represent the laser emission signal when the emission frequency, denoted as f 0 , originates from a stationary and steady laser source.
P ( t ) = A 0 e j ( 2 π f 0 t )
The laser echo signal can be represented mathematically as Equation (6).
S ( t ) = A r e j [ 2 π f 0 ( t T ) ]
The amplitudes of the laser emission and echo signals are indicated as A 0 and A r , respectively.
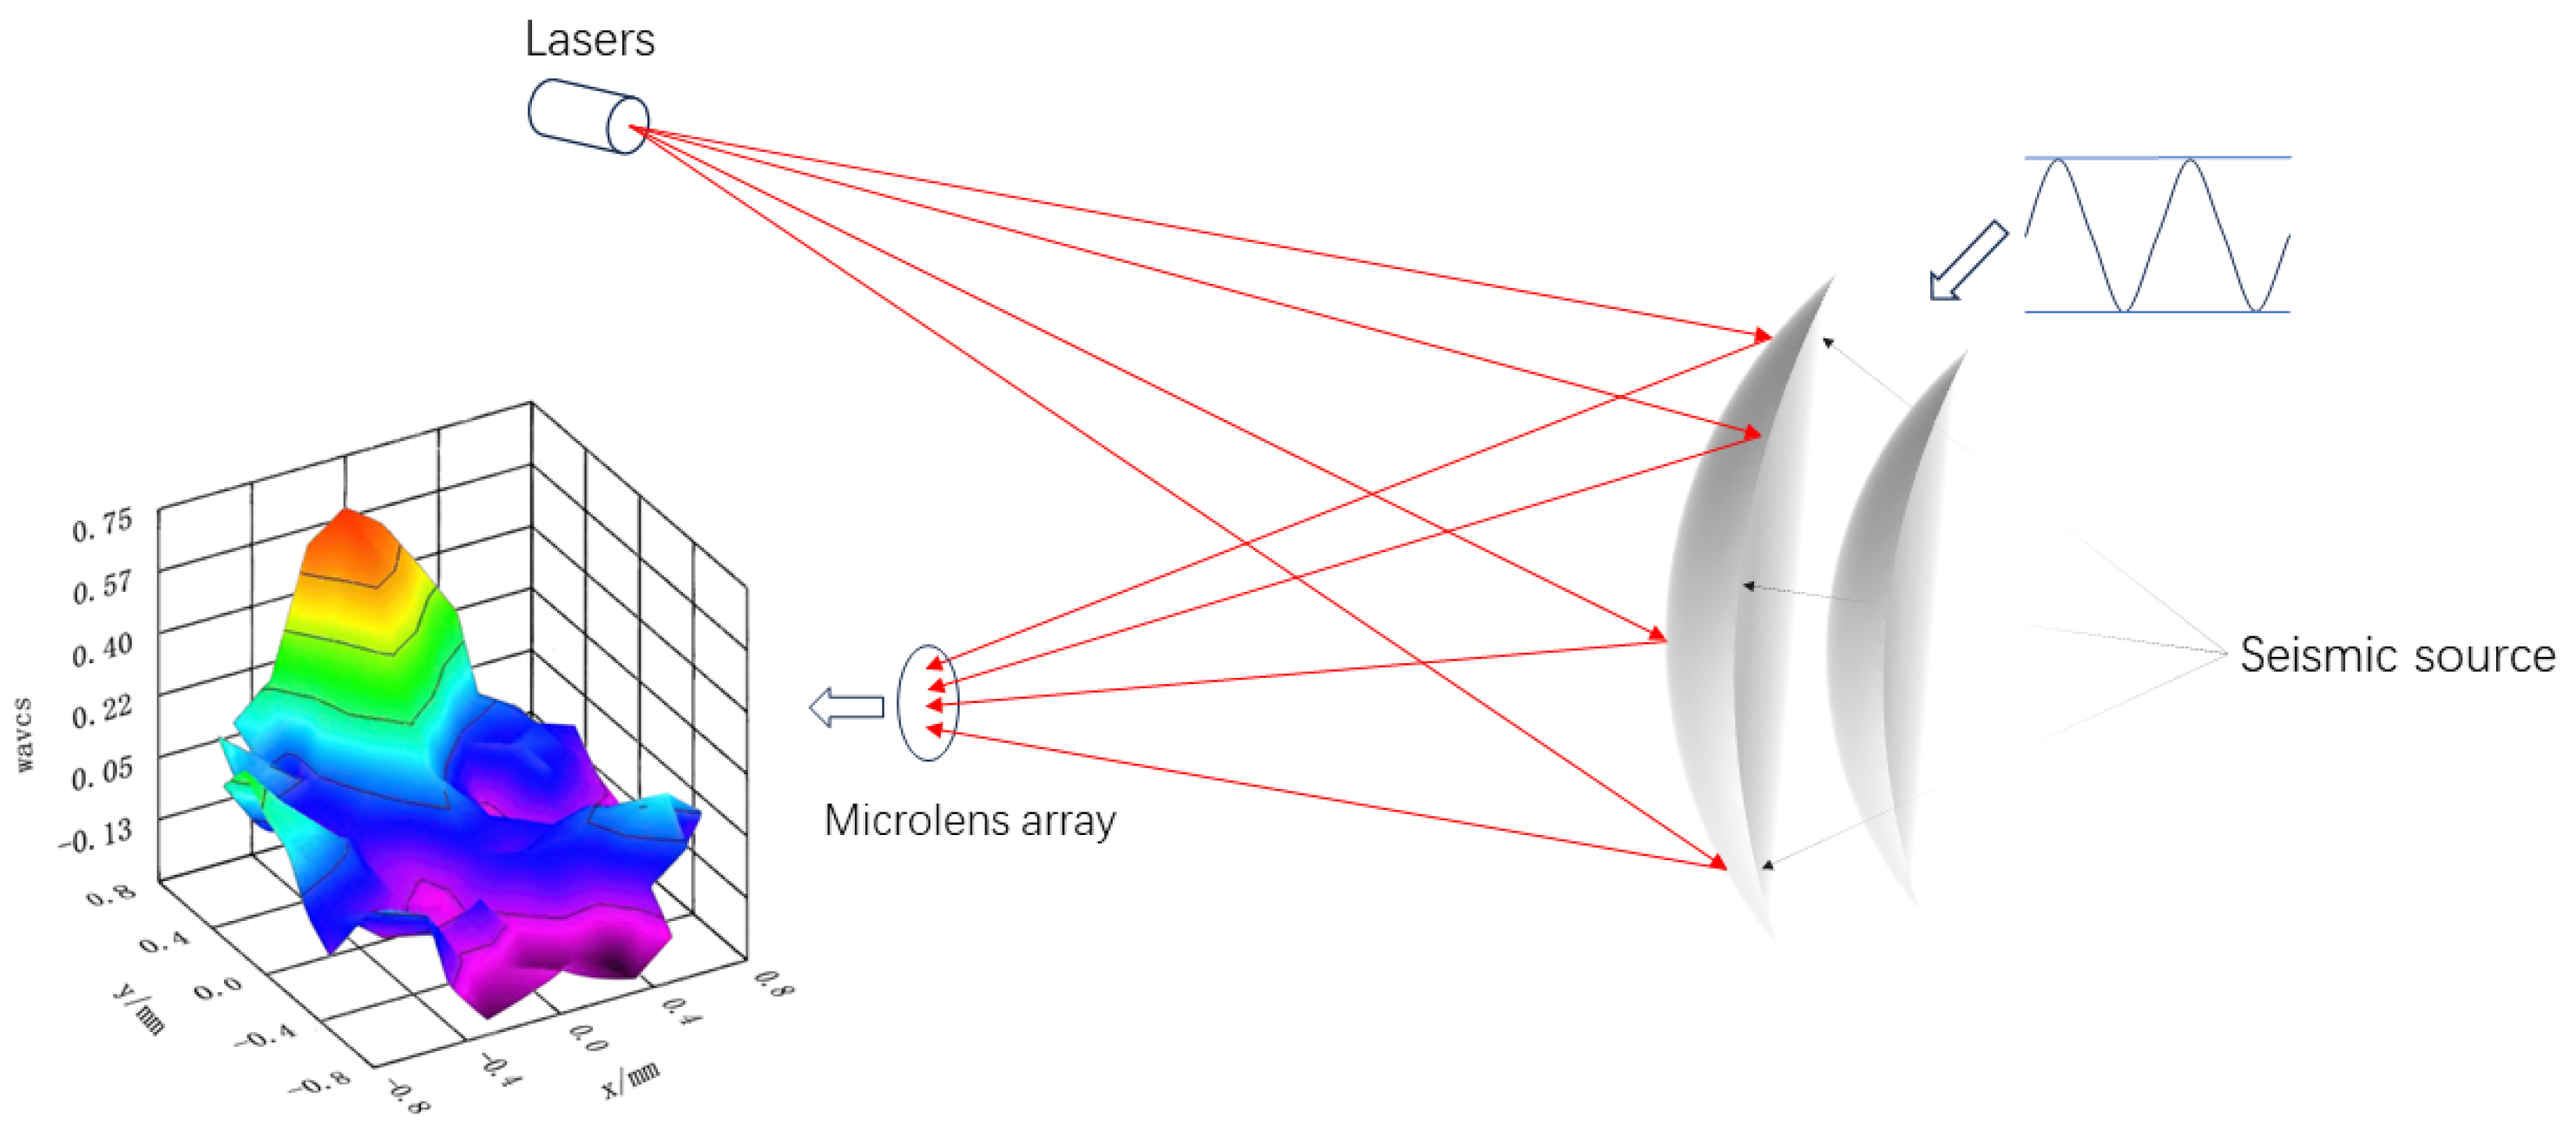
Given the initial distance between the seismic source and the wavefront sensor, denoted as r 0 . The velocity of the seismic source is represented by v, and the distance between the wavefront sensor and the source at any given time can be denoted as R ( t ) = r 0 + v ( t ) d t . Additionally, the round-trip time is denoted as T = 2 R ( t ) c , as depicted in Figure 3. The laser echo signal can be expressed as follows:
S ( t ) = A r e j ϕ ( t ) = A r e j [ 2 π f 0 ( t 2 R ( t ) c ) ]
The frequency change value of the laser echo signal, denoted as Δ f = 1 2 π ϕ ( t ) t f 0 = 2 v f 0 c , may be observed from Equation (7). This value corresponds to the Doppler frequency shift, referred to as f d . The laser echo signal exhibits a maximum phase change.
Δ φ = 2 π f d d t = 4 π λ v ( t ) d t = 4 π λ d
Among the variables, variable t denotes the duration from the lowest point to the highest point in the seismic source. In contrast, variable d signifies the utmost amplitude of the seismic source.

3.3. Laser Echo Signal Aliasing Noise

In practical cases, it is expected to encounter additional noise signals alongside the target signal in an echo. These noise signals pose challenges in accurately measuring or isolating the Doppler frequency shift of the seismic source within the laser echo signal. Unlike the known signal, noise is a stochastic signal that lacks a deterministic time function—the random nature of noise results in varying properties at different time instances. Consequently, the laser echo signal becomes susceptible to multiple burrs and spikes, as depicted in Figure 4, due to the superposition of diverse noise sources.

4. Experiment and Result Analysis of Seismic Wave Laser Remote Sensing Detection System

We experimented with a 67 mW laser at a distance of twenty meters. Due to the implemented automatic shutter control of the wavefront sensor cameras, they can handle optical input power values over a wide dynamic range. The sensitivity is strongly wavelength-dependent. The WFS-20-5C Shack-Hartmann wavefront sensor produced by Thorlabs in Newtown, New Jersey, USA, has the characteristics of high frame rate sampling and wavefront accuracy of λ /30RMS @633 nm. Therefore, this experiment uses this sensor to analyze the Doppler characteristics of seismic longitudinal waves. The ground seismic wave detection experiment employs a controlled shaking table as a seismic source to create the needed seismic waves. The shaking table can simulate the properties of longitudinal waves seen in natural phenomena by modifying various frequencies and amplitudes. A laser irradiates the seismic source, and a wavefront sensor captures the reflected laser echo signal. Through an analysis of the Doppler frequency shift exhibited by the laser echo signal across varying amplitudes and the phase alteration observed in the wavefront sensor, in-depth analysis may be conducted on the pertinent attributes of the longitudinal wave within the seismic wave. By employing the experimental seismic wave laser remote sensing detection method, essential parameters of seismic waves, including amplitude and frequency, may be acquired without physical touch.
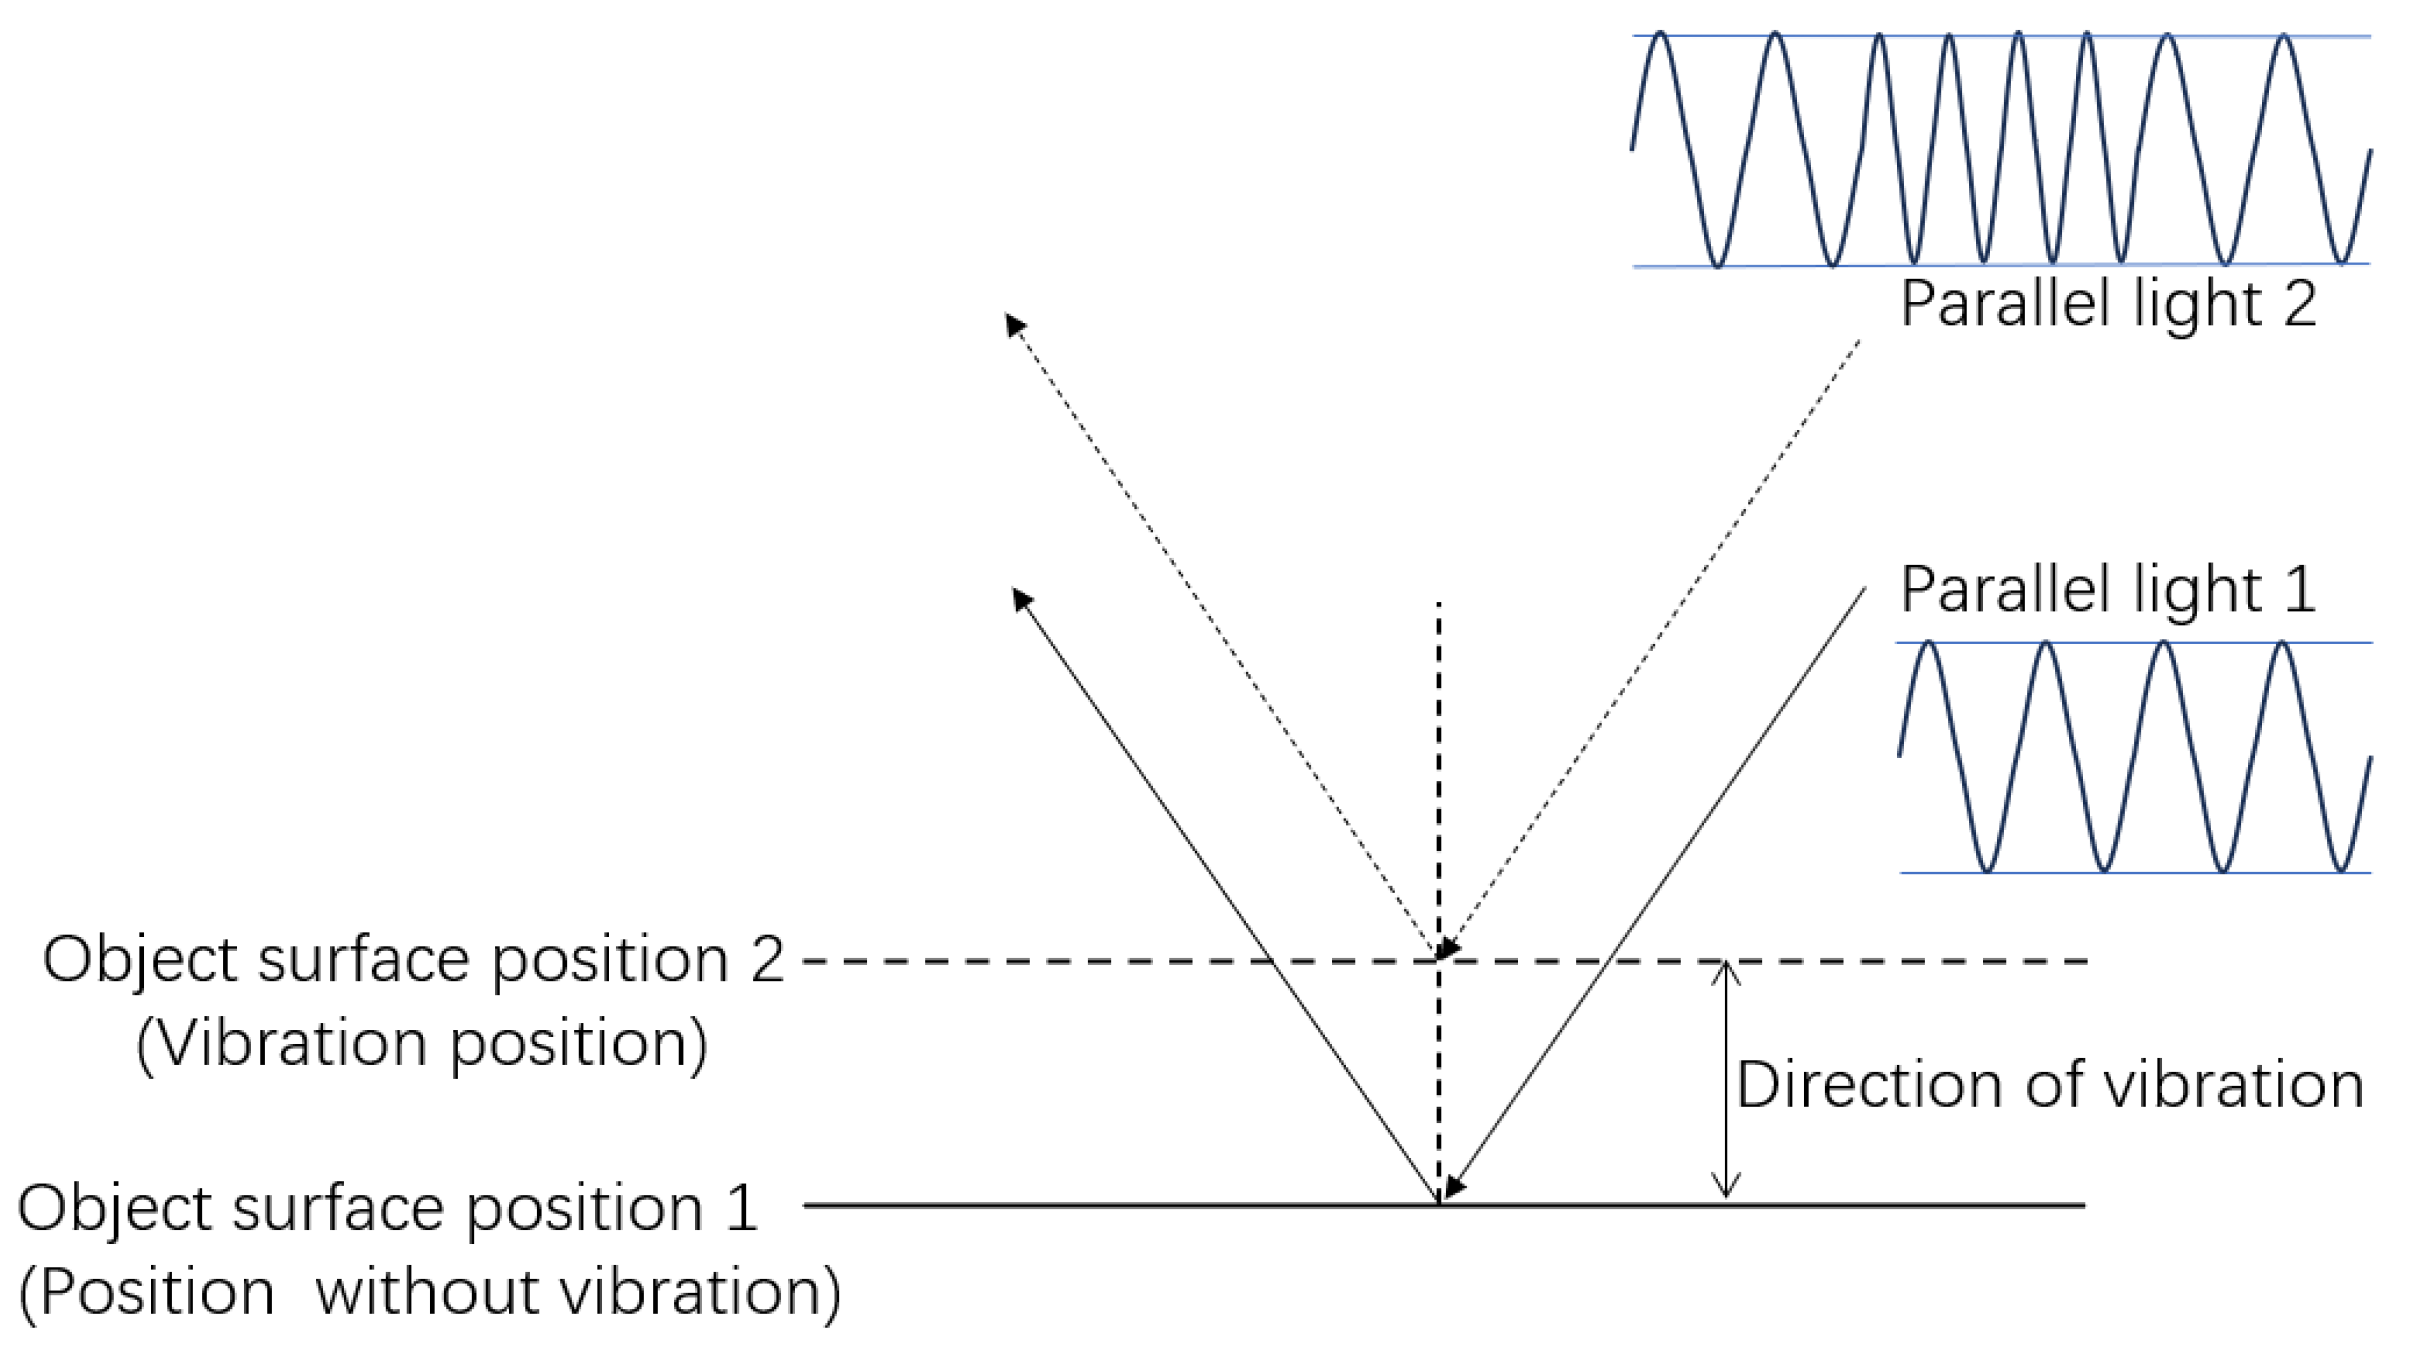
As shown in Figure 5, when the seismic source generates a seismic wave, the longitudinal motion of the wave causes changes in the frequency and phase of the laser echo signal. Because the vibration distance of the source will change in real time, the Doppler effect caused by the vibration of the source is to modulate the frequency of the laser echo signal, which leads to the phase change in the laser echo signal. The phase modulation of the laser echo signal affects the measured value of the wavefront sensor. In order to observe the change in the incident wavefront of the wavefront sensor in real-time, we use the Wavefront Sensor software (version number 18183-D03) to record the wavefront change after the microlens. At the same time, we also calculate and display the change in one of the microlenses on the software platform, which can further analyze the change in the wavefront sensor when the seismic source is excited. The calculation process flow is shown in Figure A1 (see Appendix A for details). By utilizing the system configuration and recording approaches above, it is possible to effectively observe and analyze subtle variations in the laser remote sensing detection of seismic wave systems generated by vibrations caused by the seismic source. This enables the calculation of the Doppler frequency shift of the laser echo signal and the phase of the wavefront sensor, thereby enabling the acquisition of pertinent characteristics associated with the seismic wave.
Figure 6 shows how the seismic source vibrations caused the wavefront sensor’s spot centroid to move. This displacement exhibits changes in both the horizontal and vertical directions.
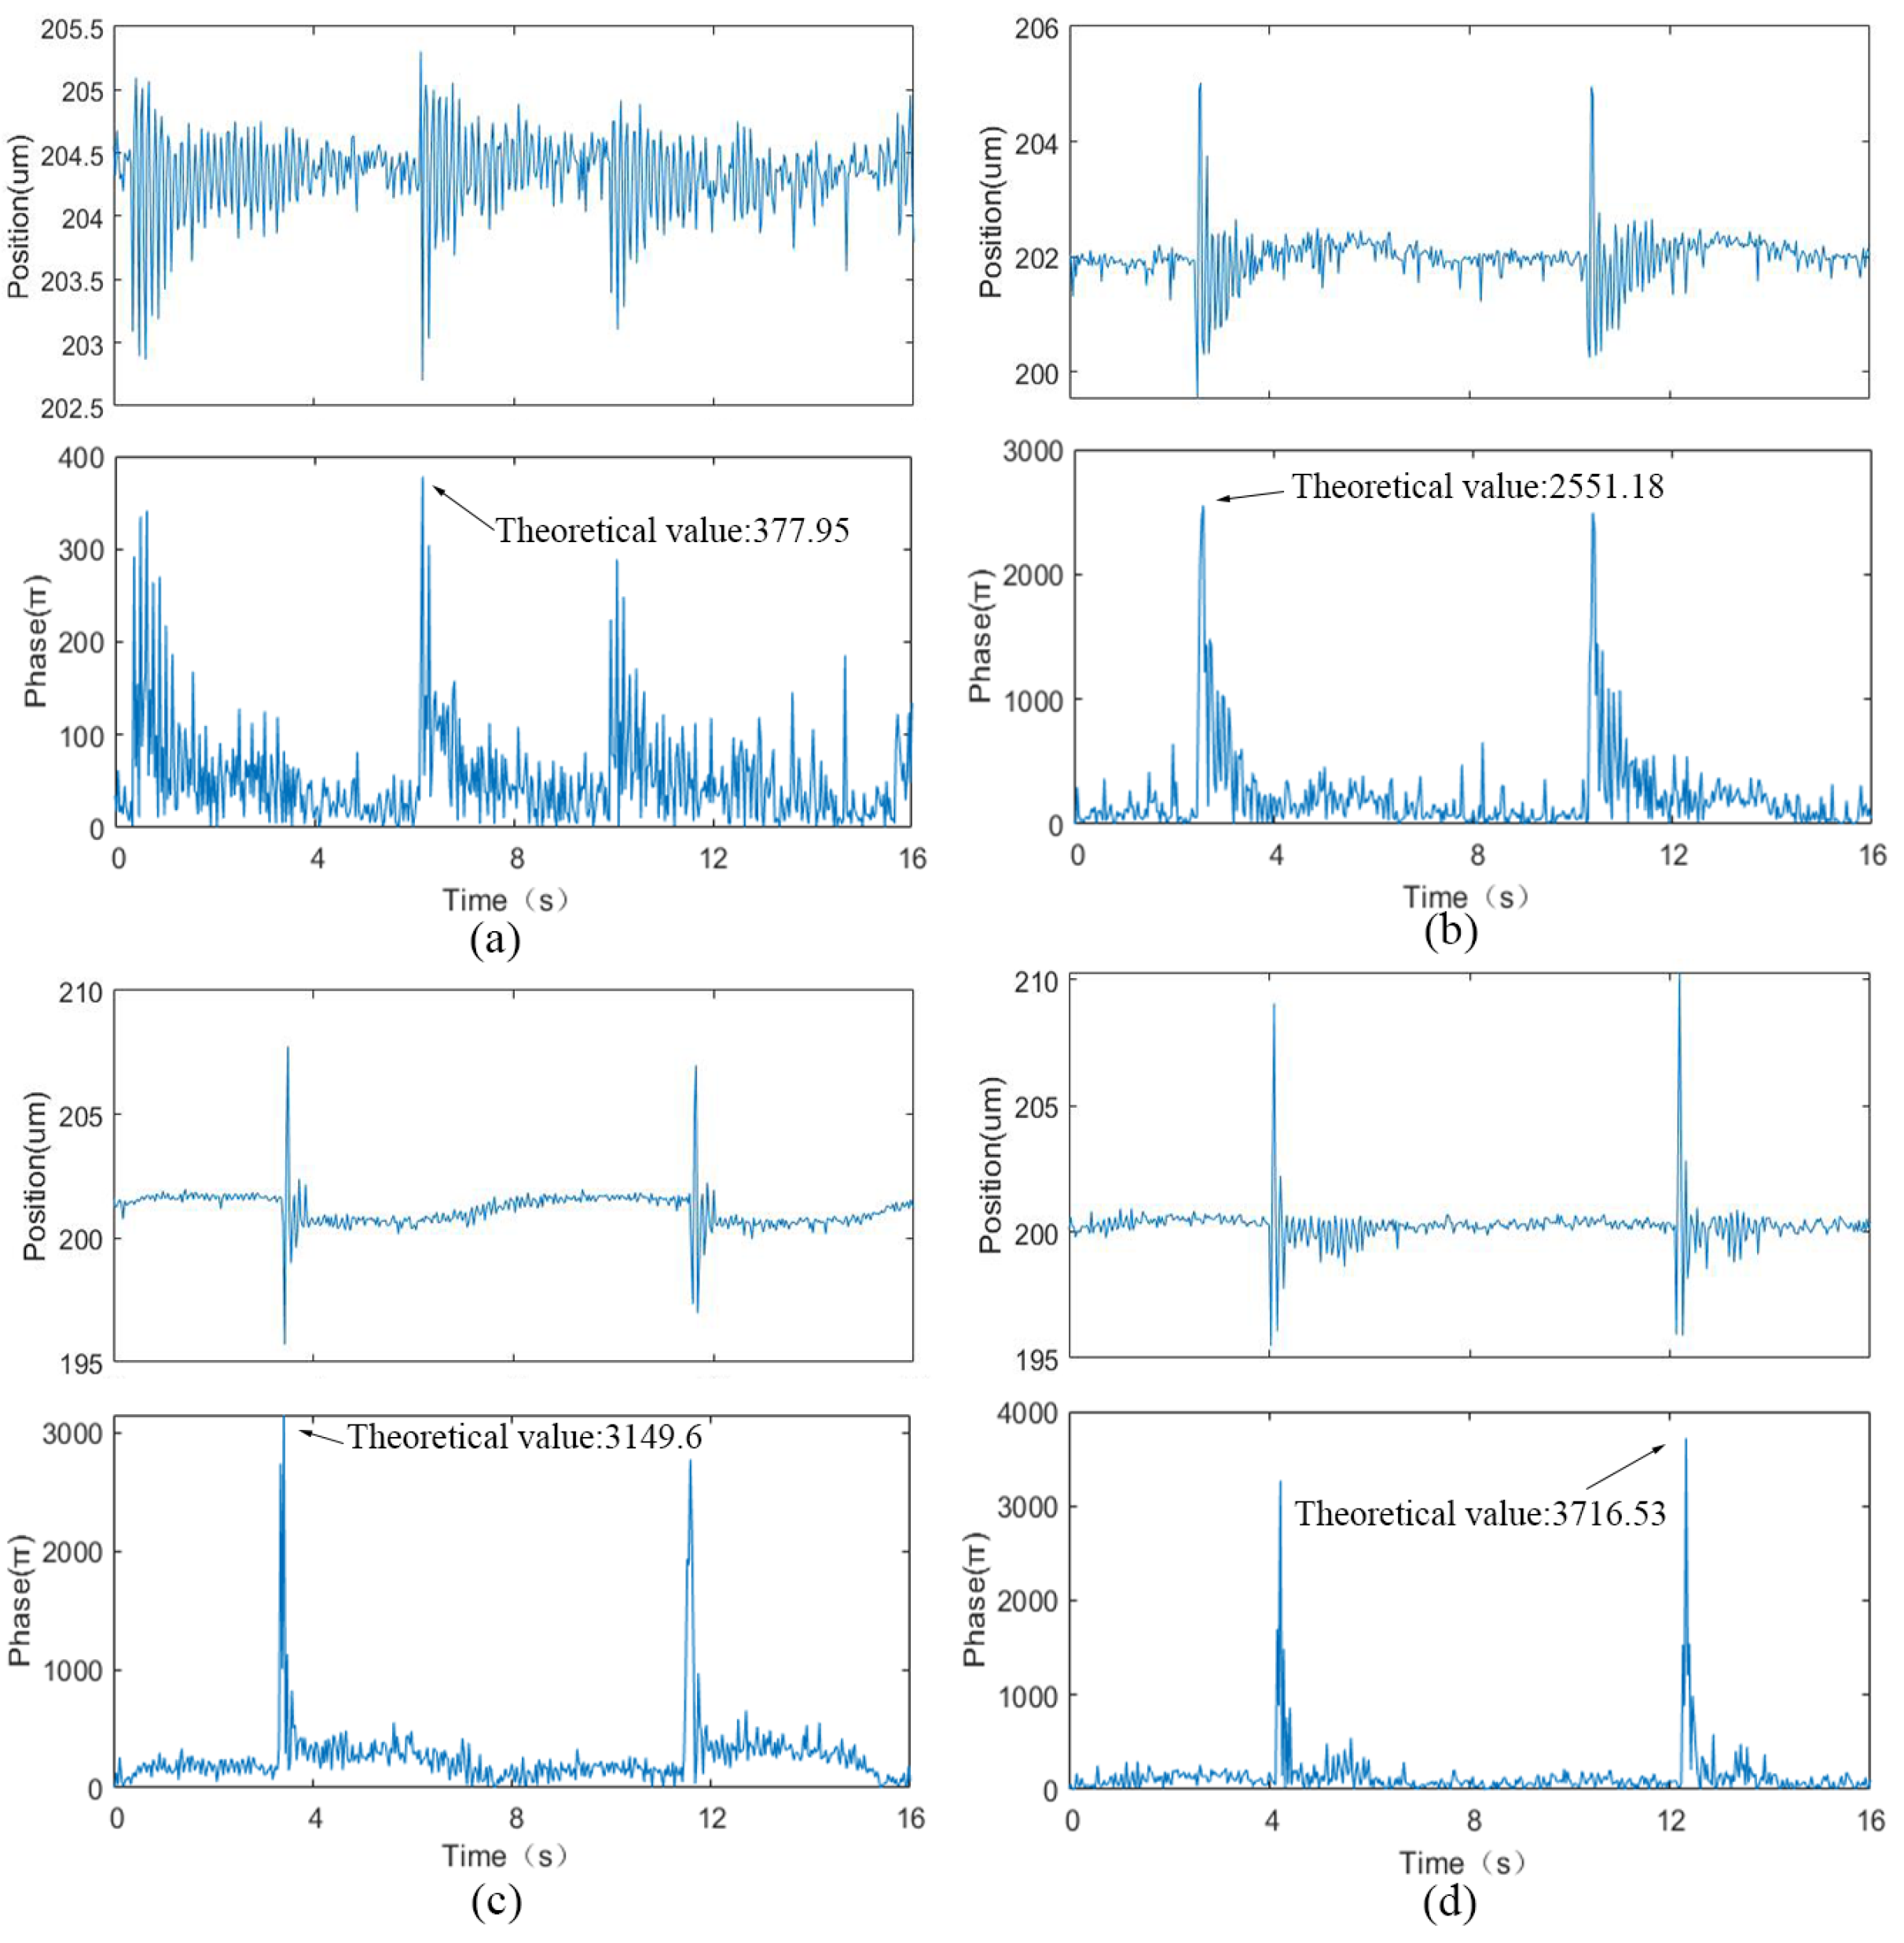
Figure 7 illustrates the spot centroid offset of a microlens in the wavefront sensor at various amplitudes, as observed on the software platform. As the amplitude of vibration increases, there is a corresponding increase in the offset of the spot centroid. The reconstruction of the wavefront phase change in microlens in the wavefront sensor is achieved through the utilization of the wavefront slope. The graphic illustrates that the longitudinal motion of the seismic wave leads to a phase change in the wavefront sensor. This phenomenon can be attributed to the Doppler frequency shift induced by the laser light. By thoroughly examining the data presented in the figure, it becomes possible to gain a quantitative understanding of the extent of phase shift exhibited by the wavefront sensor across varying amplitudes. Subsequently, this analysis enables the investigation of the impact of longitudinal waves on the wavefront sensor within the context of a laser remote sensing system for seismic waves. The findings above provide a significant experimental basis for improving our understanding of the subtle variations in the phase of the wavefront sensor and the Doppler effect caused by longitudinal waves.
The mode approach is used in this study to find the phase change in the wavefront sensor for various amplitudes of seismic sources. The mode method can be classified as a wavefront reconstruction technique. This approach’s fundamental premise involves decomposing the wavefront phase throughout the entire aperture into a series of orthogonal modes. By utilizing the observed data, the coefficients of each mode can be determined, resulting in an entire expression for the wavefront. Figure 8 shows the relationship between the wavefront sensor’s phase and the vibration’s amplitude. It shows that as the amplitude grows, so does the phase of the sensor. The equation below can be utilized to characterize the seismic source amplitude and phase alterations through data fitting.
d = k Δ φ , k = 0.00032 ( mm / rad )
The provided formula exhibits conformity with Equation (8) in terms of its form, and it is employed to compute the vibration amplitude of the source. The relative error of the vibration amplitude of the source ranges from 1% to 2% when compared to the actual value.
Additionally, the robustness of this approach was assessed. The collected data in the experiment is subject to interference from multiple sources, including internal noise inside the wavefront sensor and external influences such as ambient light, temperature disturbances, and environmental vibrations. The introduction of extra-phase variations in the detection system will lead to aliasing noise in the signal outputted by the laser. These noisy disturbances will result in variability in the linear correlation between amplitude and phase. The experiments were conducted in two settings, one with external environmental light interference and the other without. The outcomes of these trials are visually depicted in Figure 8. The resemblance between the amplitude and phase data is evident in the absence of any external disturbance. In the presence of external interference, it is observed that the deviation increases. However, it is noteworthy that the linear relationship remains intact. Furthermore, the relative error increases from 1.63% to 10.69%. This experiment enhances our comprehension of the signal disruption and noise properties induced by external elements, thereby offering a significant point of reference for investigating and implementing seismic wave laser remote sensing detection.
Furthermore, according to the study’s findings on laser remote sensing detection of seismic waves, laser Doppler technology can detect seismic waves of low frequencies. This observation is depicted in Figure 9. The wavefront sensor possesses exceptional precision and resolution, enabling it to effectively detect seismic waves over a range of frequencies. Various frequencies of seismic waves are applied to the vibration table. As the frequency of vibration gradually increases, the density of the image also increases.

5. Conclusions

This work presents a Doppler model used for laser remote sensing of seismic waves, utilizing a Shack-Hartmann wavefront sensor, as supported by existing research. The model employs laser Doppler technology for the detection of seismic waves. The detection methodology employs a laser as the medium for information acquisition, leveraging the attributes of a wavefront sensor with high precision and resolution. Additionally, it capitalizes on the benefits of a short laser wavelength, high detection sensitivity, high measurement resolution, and a substantial Doppler frequency shift. These features enable the acquisition of data about the Doppler characteristics and vibration properties of ground targets. This study aims to explore the high-precision and high-resolution laser remote sensing detection of seismic wave technologies. The present study introduces a laser-acquisition technique for detecting high-resolution ground vibration signals from seismic waves. This technique involves inducing a Doppler frequency shift utilizing the longitudinal motion of the seismic wave, resulting in a corresponding change in the phase of the laser echo signal. The modulation of the phase in the laser echo signal results in a corresponding alteration of the phase in the wavefront sensor. The ground vibration information analysis is conducted by analyzing the phase change exhibited by the wavefront sensor. The ground vibration amplitude has been verified to be within the range of 0.12–1.18 mm. The experimental findings indicate a positive correlation between the wavefront sensor’s phase and the vibration’s magnitude. This linear relationship provides evidence supporting the validity of the Doppler model. In contrast to the conventional seismic wave laser remote sensing detection method, the system exhibits a certain enhancement in detection accuracy. The system can detect vibration signals at the millimeter level, with a relative accuracy of 1% to 2%. Furthermore, the proposed methodology can continuously monitor and accurately measure minute ground vibrations, enabling the acquisition of ground vibration data with a sub-millimeter resolution. This facilitates the sensitive identification of low-frequency seismic waves. A preliminary study was also undertaken to assess the noise robustness of the approach. The findings indicate that the method can detect seismic waves despite several sources of interference, including internal noise from the wavefront sensor, external environmental vibrations, thermal disturbances, and ambient light. Suppose a filter is incorporated into the entire process to optimize wavefront sensor data processing and increase the wavefront sensor’s sampling rate. This approach will yield more precise seismic wave remote sensing detection in that case. The proposed method exhibits potential applications in seismic exploration, resource exploration, and seismic remote sensing.

Author Contributions

Conceptualization, Q.L. and H.L.; methodology, Q.L. and J.S.; software, H.L.; validation, Q.L., G.W. and X.J.; formal analysis, Q.L., G.W. and J.S.; investigation, J.S.; resources, W.J.; data curation, Q.L., G.W. and J.S.; writing—original draft preparation, Q.L.; writing—review and editing, J.S. and W.J.; visualization, Q.L., G.W. and X.J.; supervision, J.S. and W.J.; project administration, J.S.; funding acquisition, J.S. All authors have read and agreed to the published version of the manuscript.

Funding

The national natural science foundation of China (Grant No. 62165015).

Institutional Review Board Statement

The study did not require ethical approval.

Informed Consent Statement

The study did not require ethical approval.

Data Availability Statement

The data that support the findings of this study are available from the corresponding author upon reasonable request.

Conflicts of Interest

The authors declare no conflict of interest.

Appendix A

Figure A1. Calculation process.
Photonics 11 00204 g0a1

References

  1. Papadopoulou, M.; Da Col, F.; Mi, B.; Bäckström, E.; Marsden, P.; Brodic, B.; Malehmir, A.; Socco, L.V. Surface-wave analysis for static corrections in mineral exploration: A case study from central Sweden. Geophys. Prospect. 2020, 68, 214–231. [Google Scholar] [CrossRef]
  2. Scott, W.R.; Martin, J.S.; Larison, G.D. Experimental model for a seismic landmine detection system. IEEE Trans. Geosci. Remote Sens. 2001, 39, 1155–1164. [Google Scholar] [CrossRef]
  3. Polychronopoulou, K.; Lois, A.; Draganov, D. Body-wave passive seismic interferometry revisited: Mining exploration using the body waves of local microearthquakes. Geophys. Prospect. 2020, 68, 232–253. [Google Scholar] [CrossRef]
  4. Czarny, R.; Pilecki, Z.; Nakata, N.; Pilecka, E.; Krawiec, K.; Harba, P.; Barnaś, M. 3D S-wave velocity imaging of a subsurface disturbed by mining using ambient seismic noise. Eng. Geol. 2019, 251, 115–127. [Google Scholar] [CrossRef]
  5. Wu, C.; Li, X.; Chen, W.; Li, X. A review of geological applications of high-spatial-resolution remote sensing data. J. Circuits Syst. Comput. 2020, 29, 2030006. [Google Scholar] [CrossRef]
  6. Wu, Z.; Duan, N.; Wang, C.; Li, J.; Zhu, J. Experimental study on acoustic-to-seismic landmine detection based on laser self-mixing interferometer. In Proceedings of the Sixth International Conference on Optical and Photonic Engineering (icOPEN 2018), Shanghai, China, 24 July 2018; Volume 10827, pp. 424–429. [Google Scholar] [CrossRef]
  7. Shroll, R.M.; Peter, B.S.; Richtsmeier, S.; Tannian, B.; Jensen, E.; Kielkopf, J.; Pereira, W.E. Remote optical detection of ground vibrations. In Proceedings of the Infrared Remote Sensing and Instrumentation XXIII, San Diego, CA, USA, 1 September 2015; Volume 9608, pp. 168–183. [Google Scholar] [CrossRef]
  8. Bruce, R.A.; Fitzpatrick, G.L. Remote vibration measurement of rough surfaces by laser interferometry. Appl. Opt. 1975, 14, 1621–1626. [Google Scholar] [CrossRef]
  9. Yan, B.; Shi, H.; Wang, P.; Tong, Q.; Su, J. Optoelectric characteristics of laser remote sensing for measurement of ground vibration. J. Appl. Remote Sens. 2021, 15, 014505. [Google Scholar] [CrossRef]
  10. Bianchi, S. Vibration detection by observation of speckle patterns. Appl. Opt. 2014, 53, 931–936. [Google Scholar] [CrossRef]
  11. Zinke, R.; Hollingsworth, J.; Dolan, J.F.; Van Dissen, R. Three-dimensional surface deformation in the 2016 MW 7.8 Kaikōura, New Zealand, earthquake from optical image correlation: Implications for strain localization and long-term evolution of the Pacific-Australian plate boundary. Geochem. Geophys. Geosyst. 2019, 20, 1609–1628. [Google Scholar] [CrossRef]
  12. He, P.; Wen, Y.; Xu, C.; Chen, Y. Complete three-dimensional near-field surface displacements from imaging geodesy techniques applied to the 2016 Kumamoto earthquake. Remote Sens. Environ. 2019, 232, 111321. [Google Scholar] [CrossRef]
  13. She, J.; Mabi, A.; Liu, Z.; Sheng, M.; Dong, X.; Liu, F.; Wang, S. Analysis Using High-Precision Airborne LiDAR Data to Survey Potential Collapse Geological Hazards. Adv. Civ. Eng. 2021, 2021, 6475942. [Google Scholar] [CrossRef]
  14. Scott, C.; Bunds, M.; Shirzaei, M.; Toke, N. Creep along the Central San Andreas Fault from surface fractures, topographic differencing, and InSAR. J. Geophys. Res. Solid Earth 2020, 125, e2020JB019762. [Google Scholar] [CrossRef]
  15. Pastor, J.L.; Tomás, R.; Lettieri, L.; Riquelme, A.; Cano, M.; Infante, D.; Ramondini, M.; Di Martire, D. Multi-Source data integration to investigate a deep-seated landslide affecting a bridge. Remote Sens. 2019, 11, 1878. [Google Scholar] [CrossRef]
  16. Yu, H.; Mohammed, M.A.; Mohammadi, M.E.; Moaveni, B.; Barbosa, A.R.; Stavridis, A.; Wood, R.L. Structural identification of an 18-story RC building in Nepal using post-earthquake ambient vibration and lidar data. Front. Built Environ. 2017, 3, 11. [Google Scholar] [CrossRef]
  17. Wang, B.C. A landslide monitoring technique based on dual-receiver and phase difference measurements. IEEE Geosci. Remote Sens. Lett. 2013, 10, 1209–1213. [Google Scholar] [CrossRef]
  18. Hill, C.A.; Harris, M.; Ridley, K.D. Fiber-based 1.5 μm lidar vibrometer in pulsed and continuous modes. Appl. Opt. 2007, 46, 4376–4385. [Google Scholar] [CrossRef]
  19. Guinau, M.; Tapia, M.; Pérez-Guillén, C.; Suriñach, E.; Roig, P.; Khazaradze, G.; Torné, M.; Royán, M.J.; Echeverria, A. Remote sensing and seismic data integration for the characterization of a rock slide and an artificially triggered rock fall. Eng. Geol. 2019, 257, 105113. [Google Scholar] [CrossRef]
  20. Paziewski, J.; Kurpinski, G.; Wielgosz, P.; Stolecki, L.; Sieradzki, R.; Seta, M.; Oszczak, S.; Castillo, M.; Martin-Porqueras, F. Towards Galileo+ GPS seismology: Validation of high-rate GNSS-based system for seismic events characterisation. Measurement 2020, 166, 108236. [Google Scholar] [CrossRef]
  21. Brissaud, Q.; Krishnamoorthy, S.; Jackson, J.M.; Bowman, D.C.; Komjathy, A.; Cutts, J.A.; Zhan, Z.; Pauken, M.T.; Izraelevitz, J.S.; Walsh, G.J. The first detection of an earthquake from a balloon using its acoustic signature. Geophys. Res. Lett. 2021, 48, e2021GL093013. [Google Scholar] [CrossRef]
  22. Garcia, R.F.; Klotz, A.; Hertzog, A.; Martin, R.; Gérier, S.; Kassarian, E.; Bordereau, J.; Venel, S.; Mimoun, D. Infrasound from large earthquakes recorded on a network of balloons in the stratosphere. Geophys. Res. Lett. 2022, 49, e2022GL098844. [Google Scholar] [CrossRef]
  23. Primot, J. Theoretical description of Shack–Hartmann wave-front sensor. Opt. Commun. 2003, 222, 81–92. [Google Scholar] [CrossRef]
  24. Li, X.; Zhao, L.; Fang, Z.; Asundi, A.; Yin, X. Surface measurement with Shack-Hartmann wavefront sensing technology. In Proceedings of the Ninth International Symposium on Laser Metrology, Singapore, 3 October 2008; Volume 7155, pp. 387–395. [Google Scholar] [CrossRef]
  25. Yi, S.; Xiang, J.; Zhou, M.; Wu, Z.; Yang, L.; Yu, Z. Angle-based wavefront sensing enabled by the near fields of flat optics. Nat. Commun. 2021, 12, 6002. [Google Scholar] [CrossRef]
  26. Riley, Z.B.; Hagen, B.; Ehrhardt, D.A. Aero-optical measurements of the response of a thin panel at mach 6. AIAA J. 2022, 60, 1522–1536. [Google Scholar] [CrossRef]
  27. Ares, J.; Mancebo, T.; Bara, S. Position and displacement sensing with Shack–Hartmann wave-front sensors. Appl. Opt. 2000, 39, 1511–1520. [Google Scholar] [CrossRef]
  28. Shi, H.; Wang, P.; Su, J. A Remote Sensing Study of Wavefront-Sensor-Based Measurements of Seismic Wave. Appl. Laser 2023, 43, 111–117. [Google Scholar]
  29. Roddier, F.J. Variations on a Hartmann theme. Opt. Eng. 1990, 29, 1239–1242. [Google Scholar] [CrossRef]
  30. van Dam, M.A.; Lane, R.G. Wave-front sensing from defocused images by use of wave-front slopes. Appl. Opt. 2002, 41, 5497–5502. [Google Scholar] [CrossRef]
  31. Claus, D.; Pedrini, G.; Osten, W. Iterative phase retrieval based on variable wavefront curvature. Appl. Opt. 2017, 56, F134–F137. [Google Scholar] [CrossRef] [PubMed]
  32. Kong, F.; Lambert, A.; Joubert, D.; Cohen, G. Shack-Hartmann wavefront sensing using spatial-temporal data from an event-based image sensor. Opt. Express 2020, 28, 36159–36175. [Google Scholar] [CrossRef] [PubMed]
  33. Noll, R.J. Zernike polynomials and atmospheric turbulence. JOSA 1976, 66, 207–211. [Google Scholar] [CrossRef]
  34. Nirmaier, T.; Pudasaini, G.; Bille, J. Very fast wave-front measurements at the human eye with a custom CMOS-based Hartmann-Shack sensor. Opt. Express 2003, 11, 2704–2716. [Google Scholar] [CrossRef]
  35. Roddier, N.A. Atmospheric wavefront simulation using Zernike polynomials. Opt. Eng. 1990, 29, 1174–1180. [Google Scholar] [CrossRef]
  36. Rodríguez-Ramos, J.M.; Marichal-Hernández, J.G.; Rosa, F. Modal Fourier wavefront reconstruction using graphics processing units. In Proceedings of the Advances in Adaptive Optics II, Orlando, FL, USA, 27 June 2006; Volume 6272, pp. 368–378. [Google Scholar] [CrossRef]
  37. Mochi, I.; Goldberg, K.A. Modal wavefront reconstruction from its gradient. Appl. Opt. 2015, 54, 3780–3785. [Google Scholar] [CrossRef]
  38. Schulze, C.; Naidoo, D.; Flamm, D.; Schmidt, O.A.; Forbes, A.; Duparré, M. Wavefront reconstruction by modal decomposition. Opt. Express 2012, 20, 19714–19725. [Google Scholar] [CrossRef]
  39. Li, M.; Li, D.; Zhang, C.; Kewei, E.; Wang, Q.; Chen, H. Modal wavefront reconstruction from slope measurements for rectangular apertures. JOSA A 2015, 32, 1916–1921. [Google Scholar] [CrossRef]
  40. Neal, D.R.; Alford, W.J.; Gruetzner, J.K.; Warren, M.E. Amplitude and phase beam characterization using a two-dimensional wavefront sensor. In Proceedings of the Third International Workshop on Laser Beam and Optics Characterization, Quebec City, QC, Canada, 20 November 1996; Volume 2870, pp. 72–82. [Google Scholar] [CrossRef]
Figure 1. Seismic wave laser remote sensing detection system; 1: collimating lens; 2: optical corrector; 3: ground target; 4: filter; 5: telescope system; 6: Shack-Hartmann wavefront sensor.
Photonics 11 00204 g001
Figure 2. A schematic diagram of the phase change corresponding to the target vibration.
Photonics 11 00204 g002
Figure 3. Variations in the wavefront gradient in detecting seismic waves.
Photonics 11 00204 g003
Figure 4. Noise response to laser echo signals.
Photonics 11 00204 g004
Figure 5. Longitudinal motion of seismic wave.
Photonics 11 00204 g005
Figure 6. The response to seismic source vibration on the wavefront sensor. (a) The velocity of the seismic source vibration. (b) The centroid displacement in the horizontal direction. (c) Centroid displacement in the vertical direction.
Photonics 11 00204 g006
Figure 7. Wavefront sensor data corresponding to vibration amplitudes of (a) 0.12 mm; (b) 0.81 mm; (c) 1.00 mm; (d) 1.18 mm. In this context, the abscissa corresponds to the time, while the ordinate in each upper sub-plot reflects the change in position of the spot centroid and each lower sub-plot gives the calculated phase.
Photonics 11 00204 g007
Figure 8. Vibration amplitude and sensor’s phase change.
Photonics 11 00204 g008
Figure 9. Response of wavefront sensors to seismic waves of different frequencies. (a) 0.01 Hz; (b) 0.1 Hz; (c) 0.5 Hz; (d) 1 Hz.
Photonics 11 00204 g009
Disclaimer/Publisher’s Note: The statements, opinions and data contained in all publications are solely those of the individual author(s) and contributor(s) and not of MDPI and/or the editor(s). MDPI and/or the editor(s) disclaim responsibility for any injury to people or property resulting from any ideas, methods, instructions or products referred to in the content.