Article

Detection of Water Surface Acoustic Waves Using Sinusoidal Phase Modulation Interferometer and Prenormalized PGC-Arctan Algorithm

School of Information Science and Engineering, Zhejiang Sci-Tech University, Hangzhou 310018, China
*
Author to whom correspondence should be addressed.
Photonics 2024, 11(3), 200; https://doi.org/10.3390/photonics11030200
Submission received: 2 January 2024 / Revised: 5 February 2024 / Accepted: 21 February 2024 / Published: 23 February 2024
(This article belongs to the Section Lasers, Light Sources and Sensors)

Abstract

:
A sinusoidal phase modulation laser interferometer is proposed to detect water surface acoustic waves excited by underwater acoustic radiation, and an improved PGC-Arctan demodulation algorithm that combines prenormalization and Lissajous ellipse fitting is proposed to demodulate detection signals. In this paper, the effects of phase modulation depth, carrier phase delay, and interference signal visibility on the Lissajous figure formed by quadrature interference components are analyzed. The demodulation algorithm first uses the amplitudes of multiple Fourier spectral components of an interference signal to calculate the phase modulation depth C, and calculation of the carrier phase delay Vc is achieved through the introduction of a quadrature carrier signal. Then, certain coefficients regarding C and Vc are constructed for prenormalization of the two quadrature interference signal components to eliminate the local nonuniform widening phenomenon of Lissajous ellipse. Next, the outer and the inner contours are extracted from a uniformly widened Lissajous ellipse resulting from light intensity disturbance, and the axial ratio of the ellipse is obtained, which is used to correct the ratio of the quadrature interference signal to eliminate the effect of filter gain coefficients. At last, through the combination of an Arctan algorithm and a phase-unwrapping algorithm, high-precision demodulation of the interference signal is realized. A sinusoidal phase modulation interferometer was set up to detect water surface acoustic waves, and a series of detection experiments were carried out. The experiment results show that the detection method and demodulation algorithm described in this paper can accurately realize the measurement of weak water surface acoustic waves. The proposed algorithm shows less distortion in demodulation results, and its signal-to-noise distortion ratio is less than 20 dB at 500 Hz, which is significantly better than traditional algorithms. The experimental results demonstrate the effectiveness and accuracy of water surface acoustic wave detection using sinusoidal phase modulation interferometer.

1. Introduction

After an underwater acoustic wave reaches the water–air interface, a surface wave with the same frequency is formed due to the large difference in acoustic impedance between water and air, and is called a water surface acoustic wave [1,2]. A water surface acoustic wave excited by underwater acoustic radiation contains information of the underwater radiation source, and its propagation characteristics are intimately linked with the viscosity of water medium and the surface tension of water. Therefore, detection of such water surface acoustic waves is of great significance. The amplitude of a water surface acoustic wave is generally on nanometer level, and laser is the best carrier to detect such weak nanometer-scale displacement as it has a working wavelength in the submicron to micron range.
Currently, the optical detection methods of such weak water surface waves are mainly divided into optical intensity modulation method [3], light scattering method [4], laser Doppler interference method [5,6,7,8], and optical diffraction method [9,10,11]. Some of these detection methods have been applied to the detection of physical properties of media, such as in the study of surface tension, viscosity of medium, and molecular motion; some have been used in the detection of underwater acoustic information. The laser Doppler interference method, due to its advantages of high speed and high resolution, has gained increasing attention from researchers and has become a mainstream technique for water surface acoustic wave detection. For example, Antonelli and Blackmon [12,13,14] first proposed the use of a laser Doppler vibrometer based on the principle of laser interferometry for the detection of water surface acoustic waves, and achieved underwater signal acquisition in a laboratory setting. Farrant et al. [15] used a quadrature homodyne interferometer to detect water surface acoustic waves in a large swimming pool and applied it to water bathymetry. Zhao et al. [16] conducted detection experiments on water surface acoustic waves induced by underwater acoustic radiation using a Michelson interferometer and analyzed the time–frequency characteristics of signals using wavelet transforms and Wigner–Ville distributions. We [17] also proposed a demodulation approach based on turning-point local signal processing using a homodyne laser interferometer for the detection of water surface acoustic waves. At present, use of the laser Doppler interferometer method is limited to the detection of frequency information of underwater acoustic waves in most cases. Because of fluctuations of light echo power, it is a difficult task to realize accurate demodulation of underwater acoustical intensity.
The action of nanoscale surface waves on laser beams is manifested as a weak phase modulation effect. Hence, it is necessary to use laser Doppler interferometer to detect water surface acoustic waves and to achieve high-resolution and stable phase demodulation of interference signals. Combining a sinusoidal phase modulation laser interferometer with a PGC demodulation algorithm to realize phase demodulation of interference signals has proven to be a very effective method to measure weak displacements in recent years. PGC demodulation methods are mainly divided into two types: arctan phase demodulation [18] and differential cross-multiplication (DCM) demodulation [19]. In all these PGC-based demodulation algorithms, a carrier signal and its second harmonic signal are mixed with the original interference signal. Then, through low-pass filtering, two quadrature interference signal components are generated. Subsequently, restoration of the measurement information is realized by applying different phase demodulation techniques to the two components. These two types of demodulation algorithms both have their own advantages: the PGC-Arctan algorithm is not affected by the visibility of interference fringes, but its demodulation results have relatively high harmonic distortion; the PGC-DCM algorithm, as the earliest phase demodulation algorithm, has lower harmonic distortion in demodulation results, but is relatively sensitive to factors such as light intensity disturbances. PGC demodulation often causes nonlinear errors because of variation of laser interference signal parameters, such as visibility of interference fringes, light intensity disturbance, instability of phase modulation depth, and carrier phase delay. To address these problems, more and more PGC demodulation algorithms have been developed by scholars. For example, a PGC-RCM algorithm based on DCM phase demodulation that can eliminate the effect of light intensity disturbance was proposed by Zhang et al. [20], and to eliminate the effect of phase modulation depth on phase demodulation, they proposed another algorithm called PGC-AD-RCM [21]. He et al. [22] proposed a PGC-DSM-DCM algorithm with low harmonic distortion and high stability. Yu et al. [23] proposed a PGC-SDD algorithm to address the demodulation distortion problem caused by light intensity disturbance and deviation of phase modulation depth.
In this paper, a sinusoidal phase modulation laser interferometer is applied to the detection of water surface acoustic waves excited by underwater acoustic waves. Due to the existence of various fluctuations of different mechanisms, scales, and wavelengths on natural water surface, the echo power of the detection light of a laser interferometer is always characterized by significant fluctuations, which in turn cause variations of interference signal visibility. In addition to variations of signal visibility, the variations of phase modulation depth and other factors will result in large phase demodulation errors in conventional PGC demodulation, which is unfavorable to the demodulation of underwater acoustic wave intensity information. In this paper, we propose a quadrature interference signal pair prenormalization method based on the extraction of axial length ratio of a Lissajous ellipse. The use of normalized quadrature interference signal pairs enables accurate phase demodulation of interference signals, so as to realize the detection of acoustic waves on water surface.

2. Principle of Water Surface Acoustic Wave Detection Using a Laser Interferometer

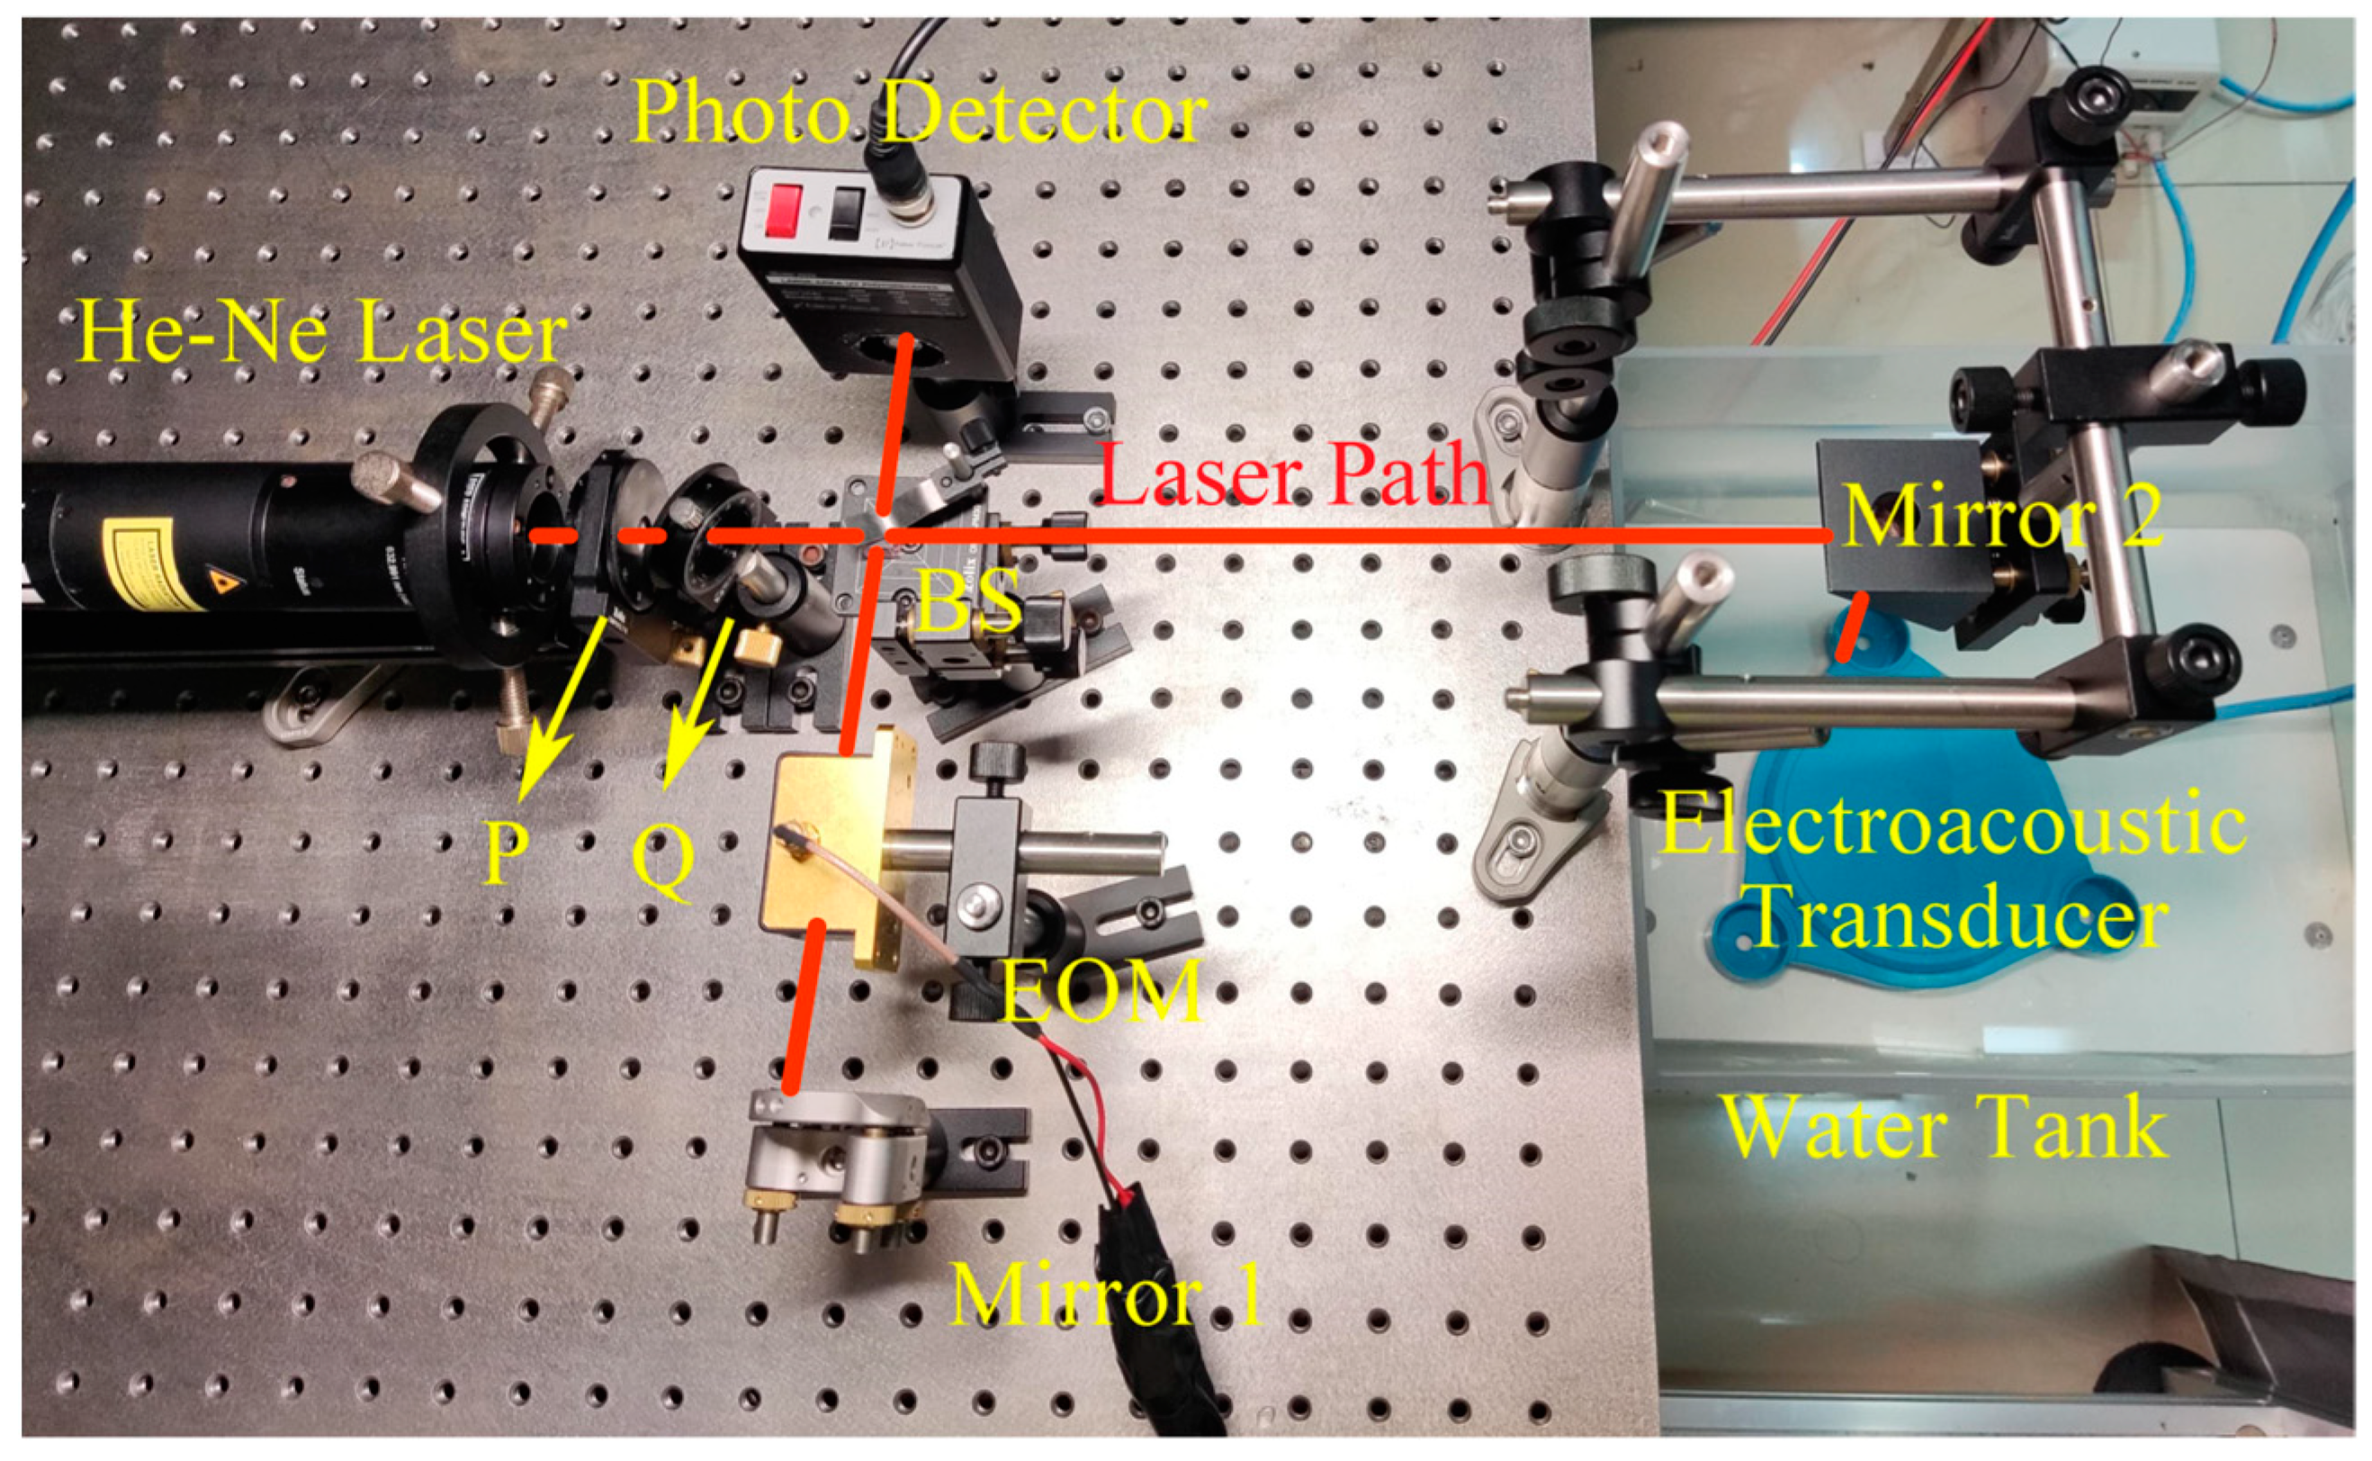
In this paper, a sinusoidal phase modulation interferometer (SPMI) based on the Michelson interferometer structure is used to detect weak water surface acoustic waves, as shown in Figure 1. A frequency-stabilized laser beam generated by a He–Ne laser passes through a polarizer (P) and a quarter-wave plate (Q) before it is divided into two beams, called measurement light and reference light, in a beam splitter (BS). Then, the reference light passes through an electro-optic phase modulator (EOM) and is reflected to the beam splitter by a reflector, and the measurement light reaches the water surface and is reflected by it to the beam splitter. The two laser beams meeting in the beam splitter generate an optical mixing signal. A photodetector converts the optical mixing signal into an electrical signal, which is then demodulated using the phase-generated carrier (PGC) demodulation algorithm to obtain a water surface acoustic wave signal. An electro-optic phase modulator is used to modulate the reference light to generate a high-frequency carrier, which is helpful for the demodulation of the detection signal.
Assuming the water surface acoustic wave is S(t) and has sinusoidal waveform:
S t = A s sin Ω s t + φ s
where As is the amplitude of the water surface acoustic wave, Ωs is the vibration frequency of the water surface acoustic wave, and φs is the initial phase of the vibration of the water surface acoustic wave.
It is assumed that the carrier wave is sinusoidal, the phase modulation depth is C, the carrier frequency is Ωc, and the carrier initial phase is negligible. Then, the interferometric signal SI(t) output of the SPMI has the following form:
S I t = A 0 + B 0 cos C cos Ω c t + φ t
where A0 is the DC component related to light intensity, which can be eliminated by mean filtering. B0 is the amplitude of the AC component of the interference signal. Usually, B0/A0 is called the visibility of the interference signal, and to facilitate description, this paper directly refers to B0 as the visibility-related coefficient. φ(t) is the phase difference of two laser beams which indicates the water surface acoustic wave and has the following form:
φ t = 2 k S t + 2 k A e sin Ω e t + φ e + L 0 .
where k is the wave number of the laser beam; Ae, Ωe, and φe are the amplitude, frequency, and initial phase of low-frequency environmental disturbance, respectively; and L0 is the phase difference generated by the initial optical path difference between the reference arm and the measurement arm. Using the Bessel-function-related formulas and trigonometric functions, Equation (2) can be decomposed as follows:
S I t = A 0 + B 0 cos φ t J 0 C + 2 m = 1 1 m J 2 m C cos 2 m Ω c t + sin φ t 2 m = 1 1 m J 2 m 1 C cos 2 m 1 Ω c t
where the symbol J represents Bessel function of the first kind and m is the order of the Bessel function Jm. By mixing the interference signal with the carrier signal cos(Ωct) and the second harmonic carrier signal cos(2Ωct) followed by low-pass filtering, a pair of in-phase and quadrature interference signal components can be obtained. They have the following forms:
Q t = E 1 B 0 J 1 C cos V c sin φ t I t = E 2 B 0 J 2 C cos 2 V c cos φ t
where Vc is the carrier phase delay, representing the phase difference between the sampled carrier excitation signal and the actual carrier signal generated by the phase modulator. E1 and E2 are the filter gain coefficients. For the unknown parameters E1, E2, B0, C, and Vc, it is not necessary to solve them completely, and eliminating their effects will be enough. Generally speaking, the carrier phase delay Vc remains unchanged, but may also change slowly due to factors such as power fluctuations of the modulator and performance variations of electronic devices. The filter gain coefficients also vary among different filter settings. However, neglecting these factors often results in large nonlinear demodulation errors. For example, the phase modulation depth C of the interferometric signal should keep to 2.63 rad precisely to make J2(C) equal to J1(C) for the PGC-Arctan algorithm. But the influence on phase demodulation caused by nonideal signal parameters such as difference of filter gain, carrier phase delay, and the like were not taken into account in the conventional PGC-Arctan algorithm, so the quadrature interference signal components cannot have the same amplitude, which results in an obvious nonlinear demodulation error.

3. PGC-Arctan Demodulation Based on Prenormalization and Lissajous Ellipse Fitting

To eliminate nonlinear errors caused by variations in parameters such as carrier phase delay, filter gain coefficients, and phase modulation depth during phase demodulation, the Lissajous ellipse normalization method is commonly used [23]. However, this method requires the use of a pair of quadrature interference signal components with stable amplitude. When the in-phase and quadrature signal components used generate a stable Lissajous ellipse, it is easy to extract the major and minor axes’ lengths of the Lissajous figure by ellipse fitting, and then realize amplitude normalization of the quadrature interference signal components. In this paper, a sinusoidal phase modulation interferometer (SPMI) is used to detect water surface acoustic waves. Since the laser interferometer system used in this paper is made up of discrete components that employ a free-space laser beam to detect a measured surface, the measurement light is reflected from a water surface, which may cause fluctuations in optical power. Therefore, the intensity of the measurement light will inevitably fluctuate so that there are fluctuations in the interference signal visibility, that is, the visibility-related coefficient B0 of the interference signal changes greatly, making it impossible to form a normal Lissajous ellipse with the pair of quadrature components generated by such interference signal. The PGC-Arctan algorithm can eliminate the visibility-related coefficient B0 caused by optical power instability in principle because of the division operation of quadrature interference signal components. In other words, the demodulation algorithm based on PGC-Arctan can naturally eliminate the influence of optical power instability. Therefore, an improved PGC-Arctan algorithm called the prenormalized PGC-Arctan algorithm is proposed to eliminate the nonlinear error in phase demodulation caused by the carrier phase delay, variation of phase modulation depth, and filter gain coefficients. Furthermore, it can adapt to drastic changes in the visibility-related coefficient B0 of an interference signal.

3.1. The Estimation Algorithm for Phase Modulation Depth

It is very helpful to identify the value of phase modulation depth C of an interference signal to eliminate the nonlinear error of phase demodulation. The phase modulation depth is mainly determined by factors such as the half-wave voltage of the phase modulator, the intensity of the driving signal, and the amplification gain of the amplifier. In a practical system, the phase modulation depth changes slowly due to the instability of the above factors. If changes of the phase modulation depth are neglected, large phase errors may occur during PGC demodulation. By taking the quadrature interference signal component I(t) as the horizontal coordinate axis and the in-phase interference signal component Q(t) as the vertical coordinate axis, a Lissajous figure can be constructed. It is assumed that the signal-visibility-related coefficient B0 and carrier phase delay Vc are constant in Equation (5), and other parameters are determined by referring to the characteristics of measured signals. The waveforms of functions J1(C) and J2(C) in the range of independent variable C from 0 to 4 rad are shown in Figure 2a, and the effects of different phase modulation depths on the Lissajous figure are shown in Figure 2b–d.
From Figure 2b–d, it can be observed that the Lissajous ellipse shows obvious nonuniform local widening. If such widening is neglected, the PGC demodulation results will produce nonlinear errors. This local widening phenomenon is related to the properties of the Bessel function. From Figure 2a, when C is less than 2.63 rad, the value of J1(C) is greater than that of J2(C) and the major axis of the ellipse is in the Q(t) direction. When C is less than 4 rad and greater than 2.63 rad, the value of J2(C) is greater than that of J1(C) and the major axis of the ellipse is in the I(t) direction. When C is near 1.84 rad, J1(C) changes slowly. Therefore, as shown in Figure 2b, there is a broadening phenomenon in the I(t) direction. Similarly, when C is near 3.06 rad, J2(C) changes slowly. Thus, as shown in Figure 2d, there is a broadening phenomenon in the Q(t) direction. When C is around 2.63 rad, the J1(C) change is approximately the J2(C) change. Thus, as shown in Figure 2c, the I(t) direction and the Q(t) direction are broadened at the same time. If the phase modulation depth can be calculated in real time or quasi real time (since the value of C changes slowly), the amplitudes of the quadrature signal components can be easily corrected (or normalized); meanwhile, demodulation errors due to changes in phase modulation depth can be eliminated.
To eliminate the effect of the fluctuations of phase modulation depth on the demodulation results and to monitor the value of the phase modulation depth, it is necessary to develop the algorithm to accurately identify it in quasi real time. To further observe and analyze the characteristics of SPMI signal spectrum distribution, Equation (4) can be further decomposed. Let A(Ω) represent the amplitude of the frequency component Ω, and the amplitudes of components of e, e + Ωc, e + 2Ωc, and e + 3Ωc are denoted as follows:
A N Ω e = 2 cos L 0 + N 2 π B 0 J 0 C J 0 C s J N C e A N Ω e + Ω c = 2 sin L 0 + N 2 π B 0 J 1 C J 0 C s J N C e A N Ω e + 2 Ω c = 2 cos L 0 + N 2 π B 0 J 2 C J 0 C s J N C e A N Ω e + 3 Ω c = 2 sin L 0 + N 2 π B 0 J 3 C J 0 C s J N C e
where Ce represents the phase modulation depth of low-frequency environmental disturbance in the interference signal, Cs represents the phase modulation depth of water surface acoustic waves in the interference signal, and Cs = 2kAs.
When Ce is a large number, the number of effective components in the interference signal with frequencies of e, e + Ωc, e + 2Ωc, and e + 3Ωc is relatively large. Therefore, the number of extractable components whose amplitudes can be clearly distinguished from noise is also relatively large. Assuming the number of effective frequency components is Ne, the following set of equations can be obtained:
N = 1 N e A N Ω e = 2 | cos ( L 0 + N 2 π ) B 0 J 0 C J 0 C s | N = 1 N e | J N ( C e ) | N = 1 N e A N Ω e + Ω c = 2 | sin ( L 0 + N 2 π ) B 0 J 1 C J 0 C s | N = 1 N e | J N ( C e ) | N = 1 N e A N Ω e + 2 Ω c = 2 | cos ( L 0 + N 2 π ) B 0 J 2 C J 0 C s | N = 1 N e | J N ( C e ) | N = 1 N e A N Ω e + 3 Ω c = 2 | sin ( L 0 + N 2 π ) B 0 J 3 C J 0 C s | N = 1 N e | J N ( C e ) |
To calculate phase modulation depth C, two parameters called attenuation ratios are defined as follows:
R 1 = N = 1 N e A N Ω e + 2 Ω c N = 1 N e A N Ω e = | J 2 C | | J 0 C | R 2 = N = 1 N e A N Ω e + 3 Ω c N = 1 N e A N Ω e + Ω c = | J 3 C | | J 1 C | .
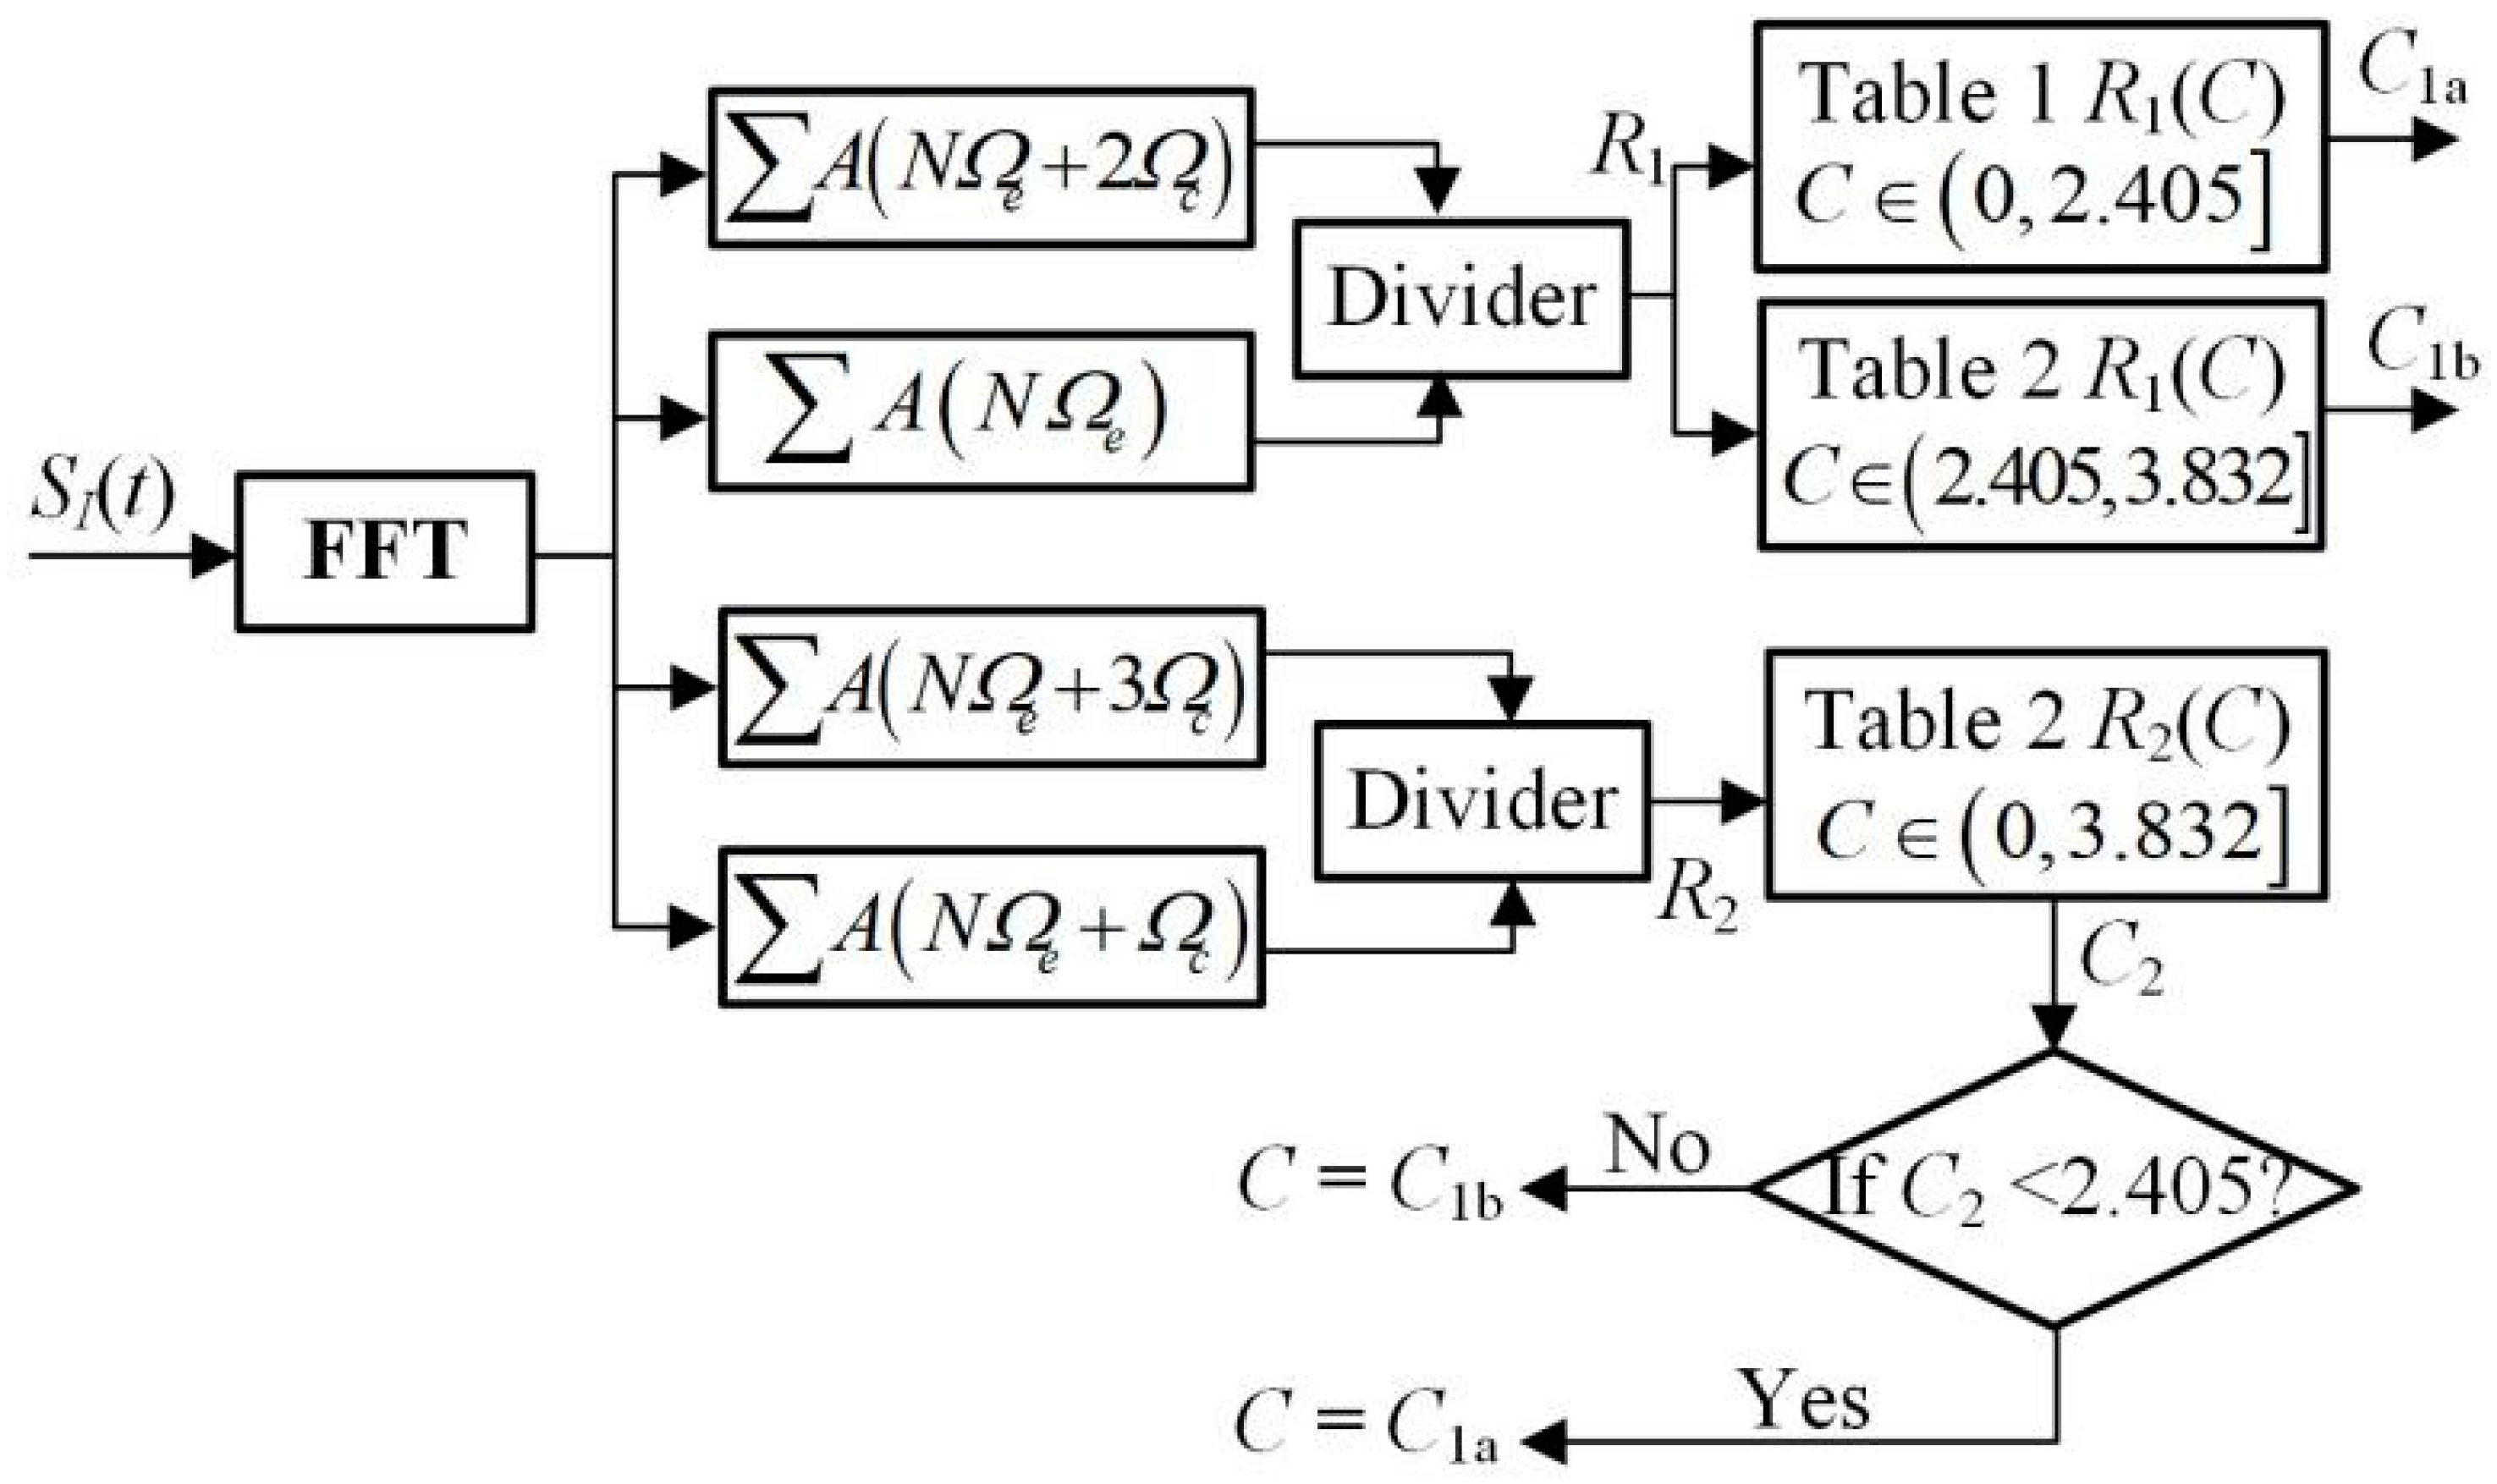
From Equation (8), the attenuation ratios R1 and R2 are both the function of the phase modulation depth C. If the values of the attenuation ratios can be obtained, then the phase modulation depth can be easily determined from the function relationship. According to the properties of Bessel function of the first kind, the function R1(C) is monotonically increasing in the interval [0, 2.405] and monotonically decreasing in the interval [2.405, 3.832]. Therefore, a singularity occurs in the inverse computation of the values of C by R1(C) when it is close to 2.405. On the other hand, the function R2(C) is a monotonically increasing function in the interval [0, 3.832]. However, given that the amplitude of the e + 3Ωc frequency component is very small, using the function R2(C) for inverse calculation of C values may lead to significant errors. Therefore, to obtain C values more accurately, a rough estimate of the C value is first determined using R2(C). If C < 2.405, then the inverse calculation of C values is performed using R1(C) in the interval [0, 2.405]. Conversely, if C > 2.405, then the inverse calculation of C values is carried out using R1(C) in the interval [2.405, 3.832].
The phase modulation depth estimation algorithm is shown in Figure 3. The amplitude of each frequency component of the interference signal is obtained using the fast Fourier transform (FFT). The effective low-frequency components of the interference signal, including e, e + Ωc, e + 2Ωc, and e + 3Ωc, are extracted according to the spectrum threshold. The sums of their amplitudes, i.e., A(e), A(e + Ωc), A(e + 2Ωc) and A(e + 3Ωc), are calculated, so as to derive the attenuation ratios R1 and R2. Subsequently, R2(C) is used to roughly estimate the magnitude of C. Then, R1(C) is employed for precise determination of C. Finally, the variation in phase modulation depth is obtained through an iterative method.

3.2. The Estimation Algorithm for Carrier Phase Delay

In general, the carrier phase delay changes slowly and can be approximated as a constant. If the carrier phase delay is not taken into account, it will also produce errors in the demodulation results. In some cases, the carrier phase delay can change vary obviously, for example, if the carrier signal in the optical path and the sampled carrier signal are not generated by the same clock. From Equation (5), carrier phase delay Vc has a significant effect on the amplitudes of quadrature interference signal components, so it is also very important to identify its value. After obtaining the value of carrier phase delay, the carrier phase delay can be eliminated by adjusting the phase of the sampled carrier signal. It is simpler to construct cos(Vc) and cos(2Vc) directly from the obtained value of carrier phase delay, and then normalize the amplitudes of the quadrature interference signal components.
The carrier phase delay can be identified directly by the algorithm. The carrier signal cos(Ωct) is shifted by 90° to obtain the quadrature carrier signal sin(Ωct), which is then mixed with the interference signal SI(t) and receives low-pass filtering. The processed signal is thus obtained as follows:
Q 2 t = E 1 B 0 J 1 C sin V c sin φ t .
Combining Equations (5) and (9), the following can be obtained:
V c = Arc tan Q 2 t Q t .
After dividing Q2(t) by Q(t), signal sequence Vc(t) can be derived through arctangent calculation, and median filtering can be used to eliminate outliers. In order to prevent occurrence of new filter gain coefficients, the mixed signals that generate signals Q2(t) and Q(t) must pass through the same filter.
The carrier phase delay estimation algorithm is shown in Figure 4. First, the carrier signal cos(Ωct) is phase-shifted by 90° to generate the quadrature carrier signal sin(Ωct). Then these signals are mixed with the interference signal, respectively, pass through the same low-pass filter, and are used to generate signals Q2(t) and Q(t). Finally, the carrier phase delay can be determined by arctangent calculation of the ratio of the two signals followed by median filtering.

3.3. The PGC-Arctan Demodulation Algorithm Based on Prenormalization and Lissajous Ellipse Fitting

The phase modulation depth C and the carrier phase delay Vc can be determined by using the algorithms described above, and then the quadrature interference signal components Q(t) and I(t) can be prenormalized. Let the quadrature signal component Q(t) be divided by J1(C) × cos(Vc) and the in-phase signal component I(t) be divided by J2(C) × cos(2Vc), and a pair of processed quadrature signals can be obtained as follows:
q t = E 1 B 0 sin φ t i t = E 2 B 0 cos φ t .
The sum of the self-multiplications of the quadrature signal components q(t) and i(t) can be expressed as
E 1 B 0 sin φ t 2 + E 2 B 0 cos φ t 2 = v 2 .
where v is a variable related to the size of the Lissajous ellipse. For laser interferometric detection of noncooperative targets, the optical power of measurement light always has large fluctuations, which in turn lead to significant fluctuations of the signal-visibility-related coefficient B0. As a result, the parameter v changes constantly under the joint influence of time t and the signal-visibility-related coefficient B0.
To facilitate presentation, Equation (12) is rewritten as
( E 1 B 0 v ) 2 sin φ t 2 + ( E 2 B 0 v ) 2 cos φ t 2 = 1
Based on the standard elliptic equation form given in Equation (14), the lengths of the major and minor axes of the Lissajous ellipse formed by the quadrature components q(t) and i(t) can be defined with Equation (15).
1 L a 2 x 2 + 1 L b 2 y 2 = 1 ,
L a = v E 1 B 0 L b = v E 2 B 0 .
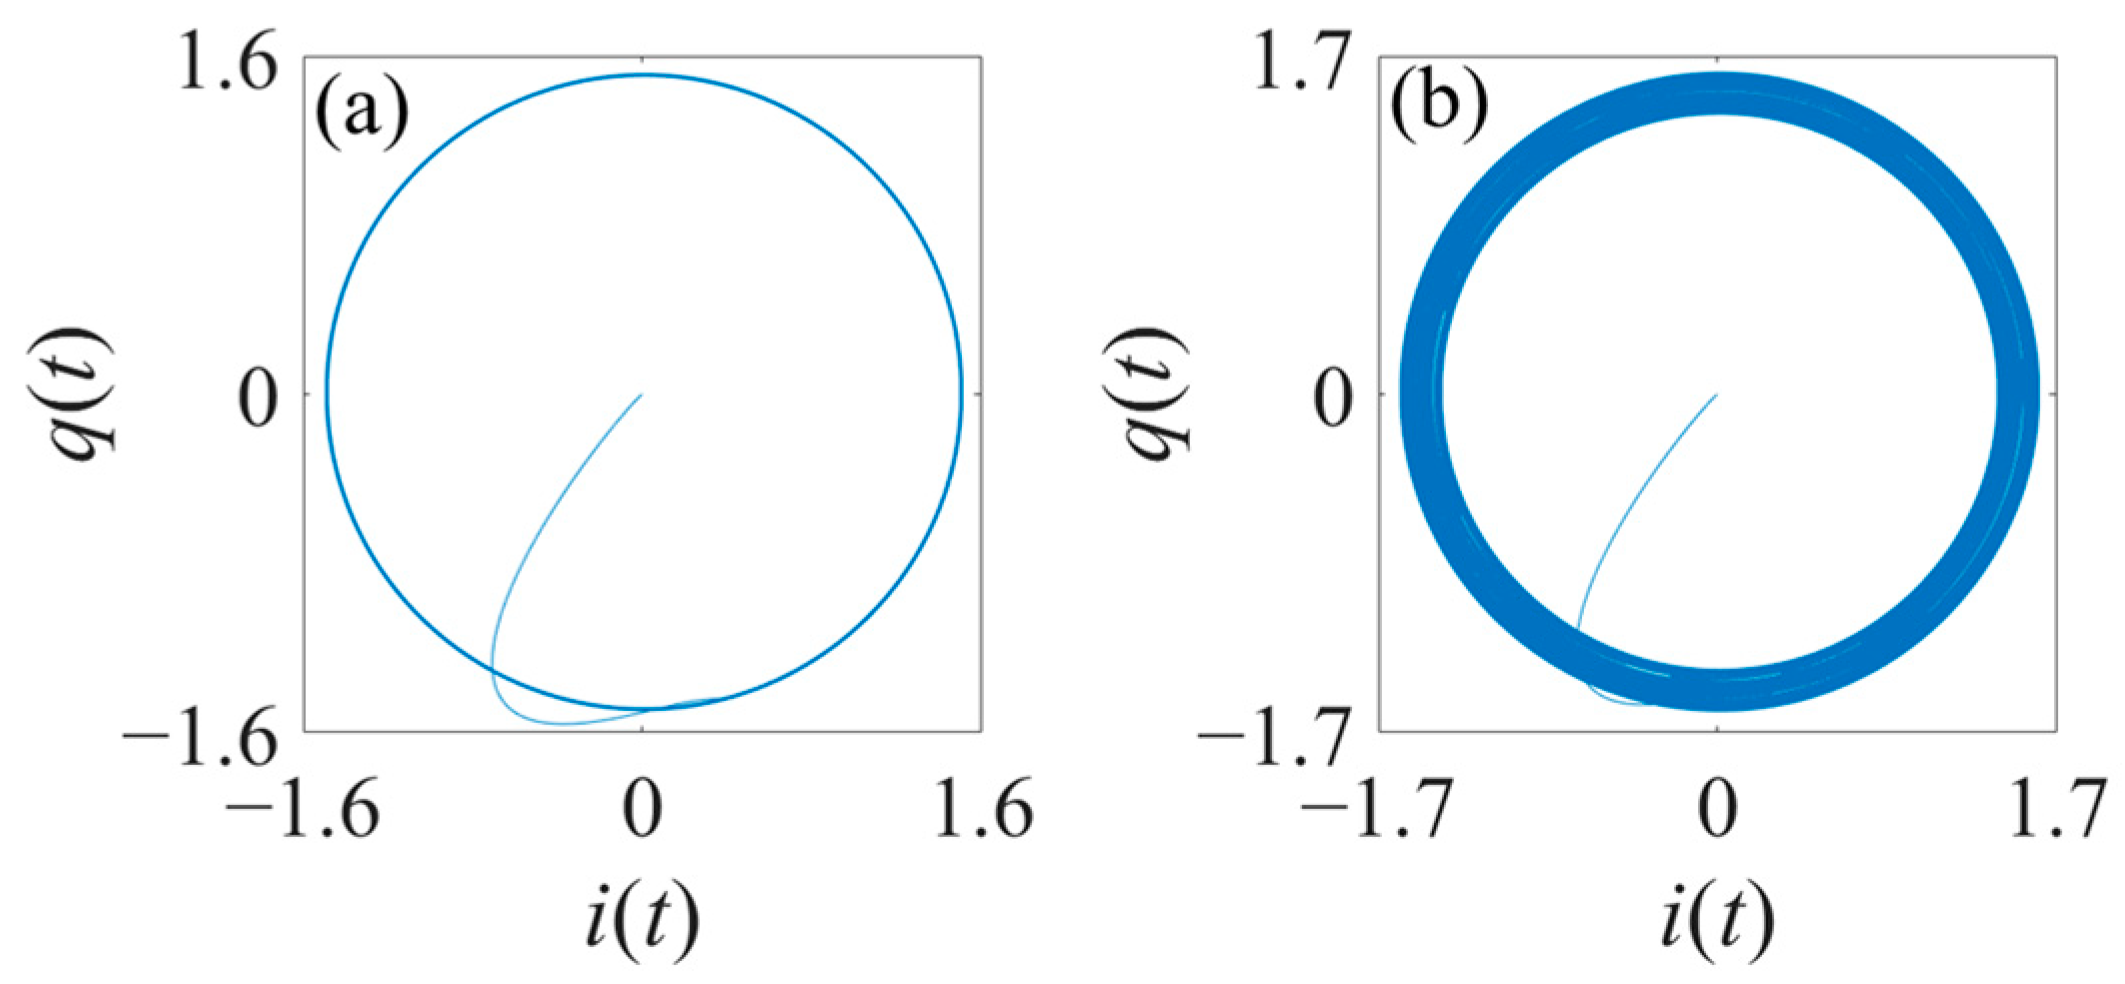
In theory, when the signal-visibility-related coefficient B0 is constant and the quadrature components are prenormalized to eliminate the effect of nonideal carrier phase delay and phase modulation depth, the Lissajous ellipse formed by the quadrature components can be a standard ellipse. However, in practice, the signal-visibility-related coefficient B0 fluctuates in a certain range, which causes the Lissajous figure to be an elliptic ring with a certain width, and the ring width is affected by the signal-visibility-related coefficient, as shown in Figure 5.
For PGC-Arctan-based algorithms, it is very important to know the ratio of the filter gain coefficients, denoted as E2/E1. By observing Equation (15), it can be concluded that the ratio E2/E1 is equal to the ratio La/Lb, as shown in Equation (19). That means that if the axial ratio of the Lissajous ellipse can be calculated, the ratio E2/E1 can also be determined. According to Figure 5b, the major and the minor axes’ lengths of the inner contour ellipse are proportional to those of the outer contour ellipse. The outer contour ellipse of the Lissajous figure corresponds to the maximum value of the signal-visibility-related coefficient B0, while the inner contour ellipse corresponds to the minimum value of B0. During observation, the signal-visibility-related coefficient B0 always varies in a certain range, and the signal-visibility-related coefficients corresponding to the outer contour ellipse and the inner contour ellipse remain basically unchanged. To determine the ratio La/Lb more accurately, both the outer contour ellipse and the inner contour ellipse are fitted. The general equation for an ellipse has five parameters: the ellipse’s center coordinates (i0,q0), major axis length La (horizontal coordinates by default), minor axis length Lb (vertical coordinates by default), and the angle of rotation Φ of the coordinate axes.
In this paper, the least-squares method [24] is used to achieve fitting of the inner and the outer contour ellipses of the Lissajous figure. First, the inner and the outer contour points are extracted from the Lissajous figure generated by the quadrature signal components, and then the least-squares method is applied to the inner and the outer contour points to achieve ellipse fitting. To improve the fitting accuracy, the distances from the contour points to the fitted ellipses can be used to determine abnormal points. The standard deviation σ of the distance values from the contour points to the ellipses is calculated, and a 3σ criterion is used to identify noise points. After the noise points are removed, the inner and outer contour ellipses are refitted.
The ellipse-fitting method used in this paper is briefly described below. In a two-dimensional coordinate system, assuming the horizontal coordinate is i and the vertical coordinate is q, a normalized parametric equation of an ellipse can be written as
i 2 + a i q + b q 2 + c i + d q + e = 0 .
where, a, b, c, d, and e are the coefficients of elliptic equation. For each point (ik, qk) in the Lissajous figure, a linear equation with respect to the vector [a b c d e]T can be obtained. For n points, the equations can be written in the following matrix form:
i 1 q 1 q 1 2 i 1 q 1 1 i 2 q 2 q 2 2 i 2 q 2 1 i n q n q n 2 i n q n 1 a b c d e = i 1 2 i 2 2 i n 2 .
As can be seen, Equation (17) is a typical matrix equation. The solution vector [a b c d e]T can be easily obtained by the singular value decomposition method. Then, the ellipse’s center coordinates (i0,q0), the horizontal axis length La, the vertical axis length Lb, and the angle of rotation Φ of the coordinate axes can be calculated as
i 0 = a d 2 b c 4 b a 2 q 0 = a c 2 d 4 b a 2 L a = 2 ( i 0 2 + b q 0 2 + a i 0 q 0 e ) 1 + b + a 2 + b 2 2 b + 1 L b = 2 ( i 0 2 + b q 0 2 + a i 0 q 0 e ) 1 + b a 2 + b 2 2 b + 1 ϕ = 1 2 arctan ( a 1 b ) .
After the inner and the outer contour ellipses are fitted, the axial length ratios of the inner and the outer contour ellipses can be obtained, taking their mean value as the best estimation of ratio La/Lb used in normalization of components I(t) and Q(t). Then, the phase modulated by the water surface acoustic waves in detection signal can be expressed as
φ t = Arctan L a q t L b i t .
The improved PGC-Arctan demodulation algorithm based on prenormalization and Lissajous ellipse fitting is shown in Figure 6. In the first step, the phase modulation depth is obtained using PMDEA and the carrier phase delay is obtained using CPDEA. Then, the quadrature interference signal components Q(t) and I(t) are prenormalized to obtain the processed quadrature interference signal components q(t) and i(t) to form Lissajous figures. In the second step, the 3σ criterion is used to eliminate the noise points of the inner contour ellipse and the outer contour ellipse, and the two ellipses are fitted with the least-squares method to obtain their major and minor axis lengths, respectively. The average values of the axis lengths are taken to calculate the ratio E2/E1. Before arctangent phase demodulation, a division operation is performed on the processed quadrature interference signal components q(t) and i(t) to obtain q(t)/i(t), and a multiplication operation is then performed on the ratios E2/E1 and q(t)/i(t). Finally, the phase difference modulated by the water surface acoustic waves can be obtained with arctangent and phase-unwrapping algorithms.

4. Simulation Analysis

A series of numerical simulation analyses was carried out to verify the feasibility of the proposed algorithm and detection method. The phase modulation depth C changes relatively slowly due to reasons such as performance variations of electronic devices. The carrier phase delay Vc is a fixed value. It is assumed that the signal-visibility-related coefficient B0 changes drastically because of environmental factors. The other parameters are determined according to the characteristics of measured signals, and the main simulation parameters are designed as shown in Table 1.
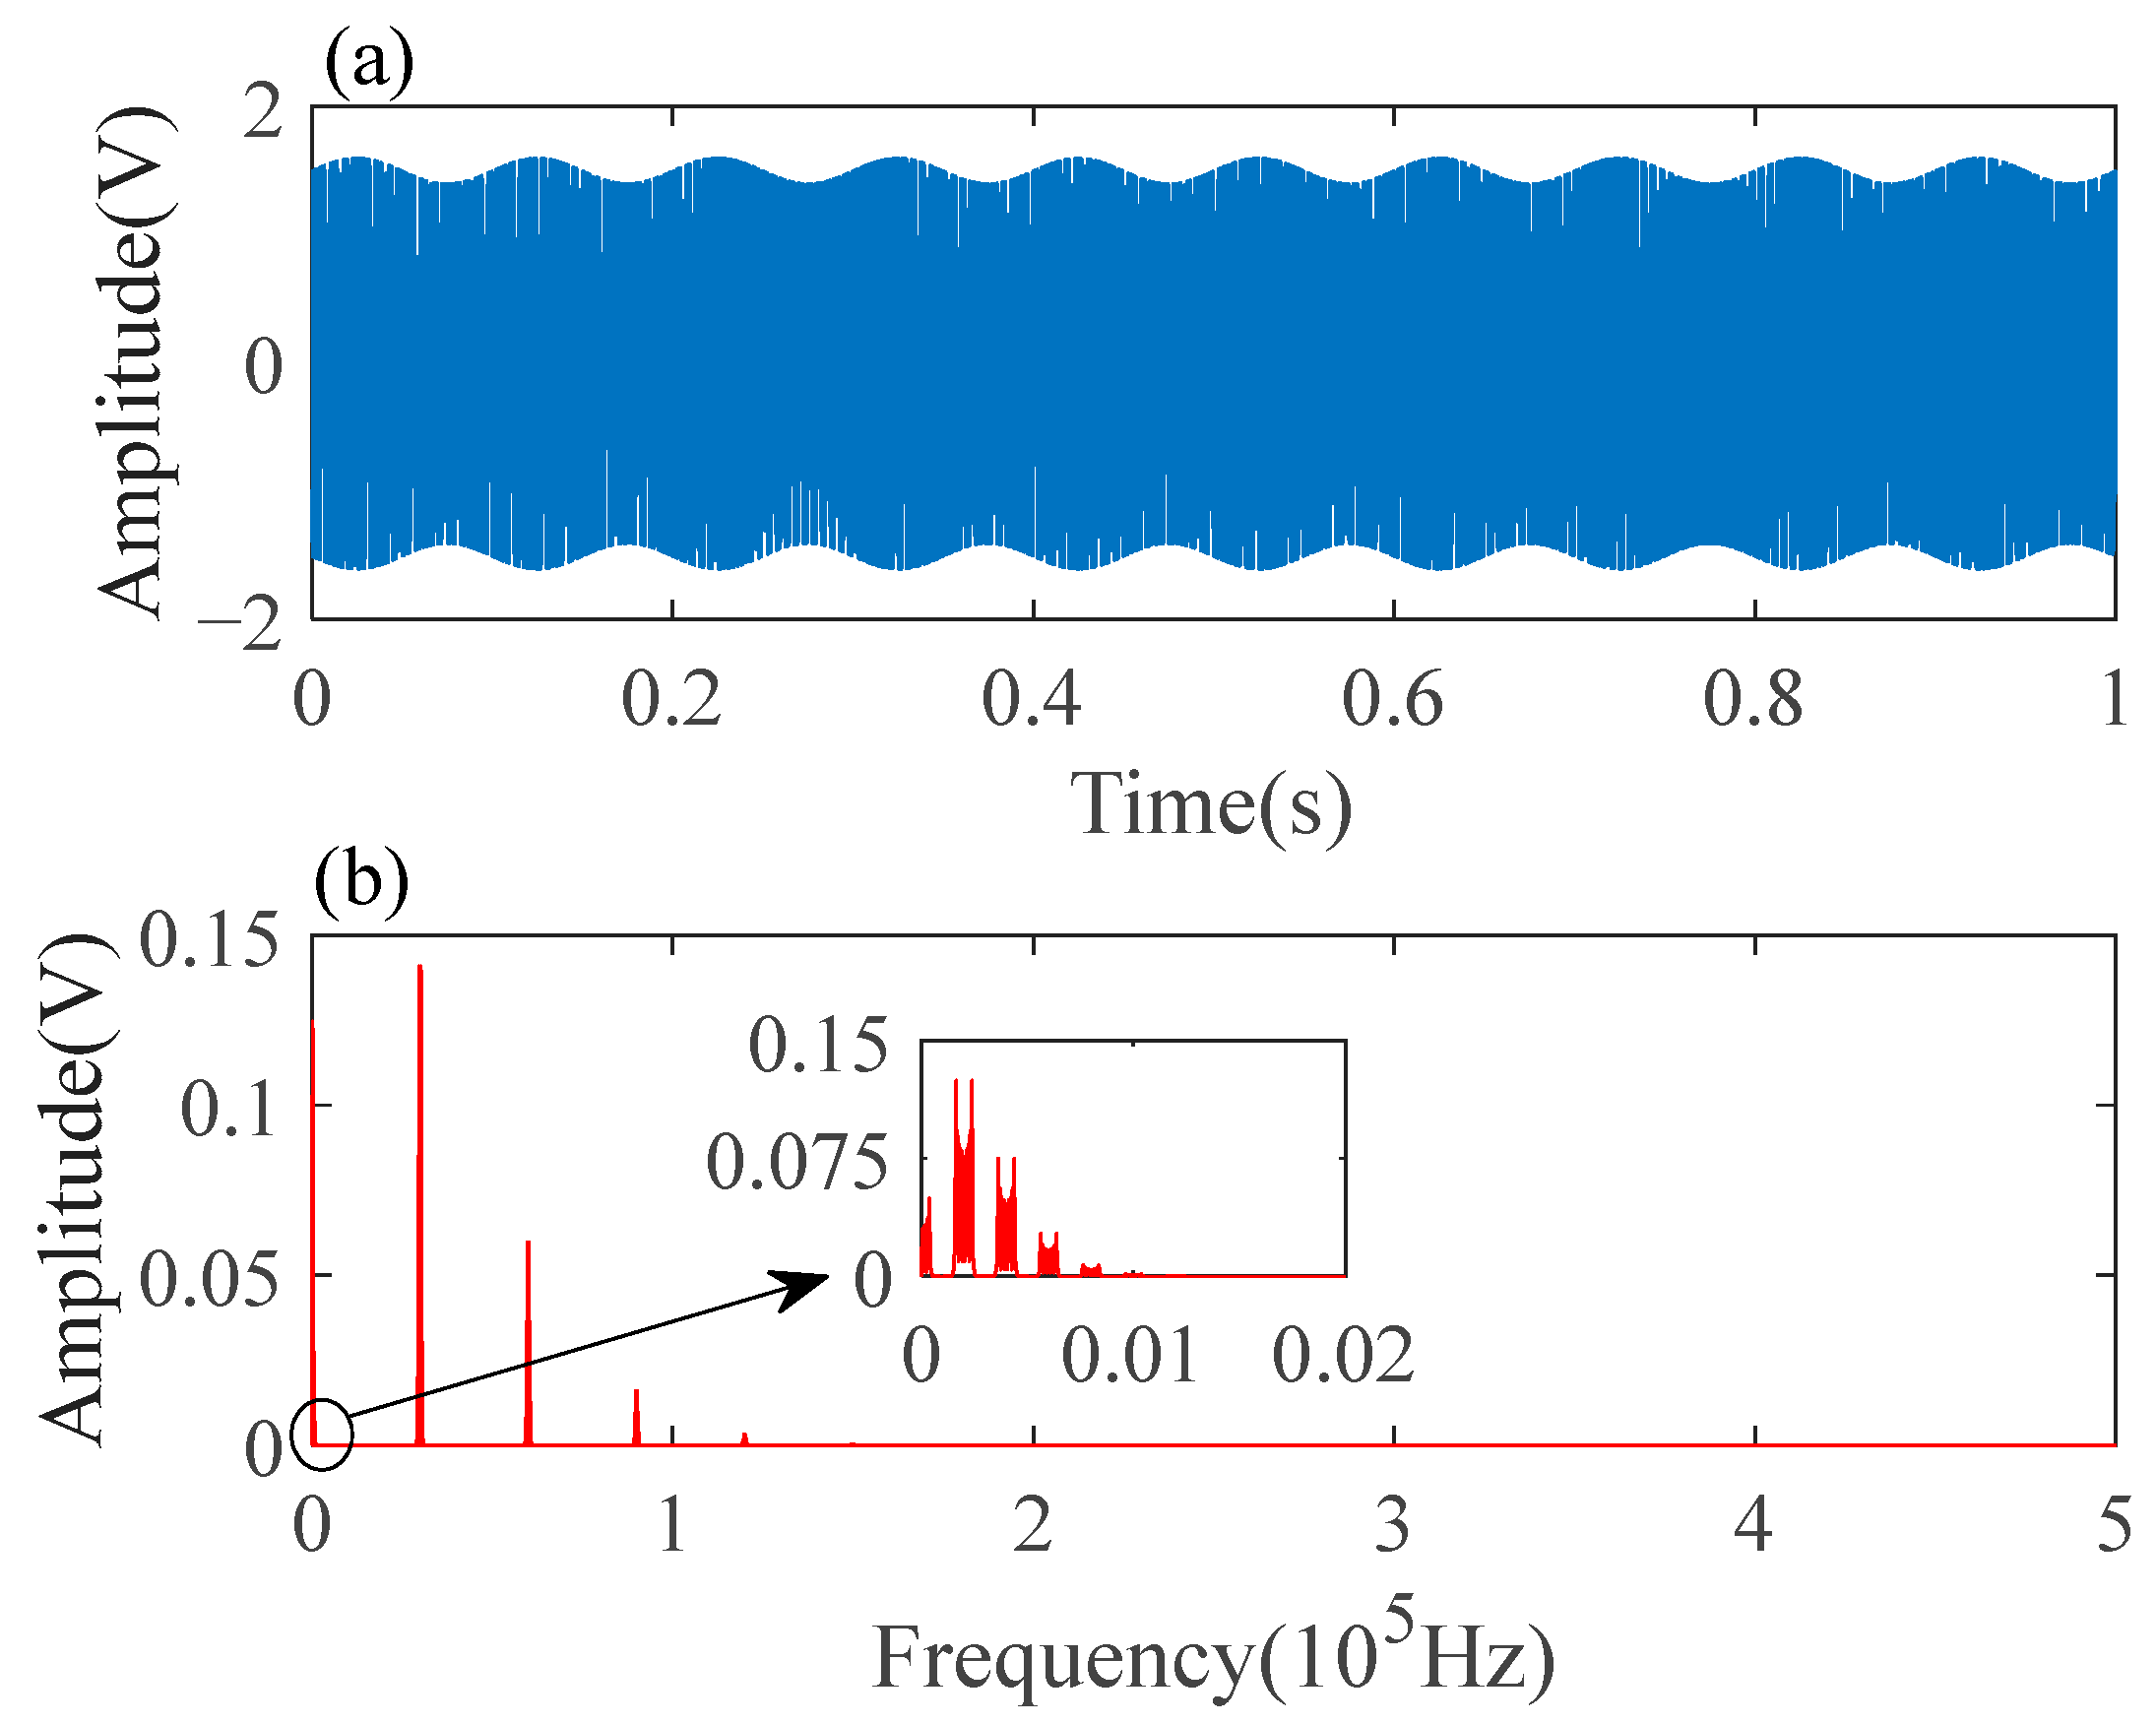
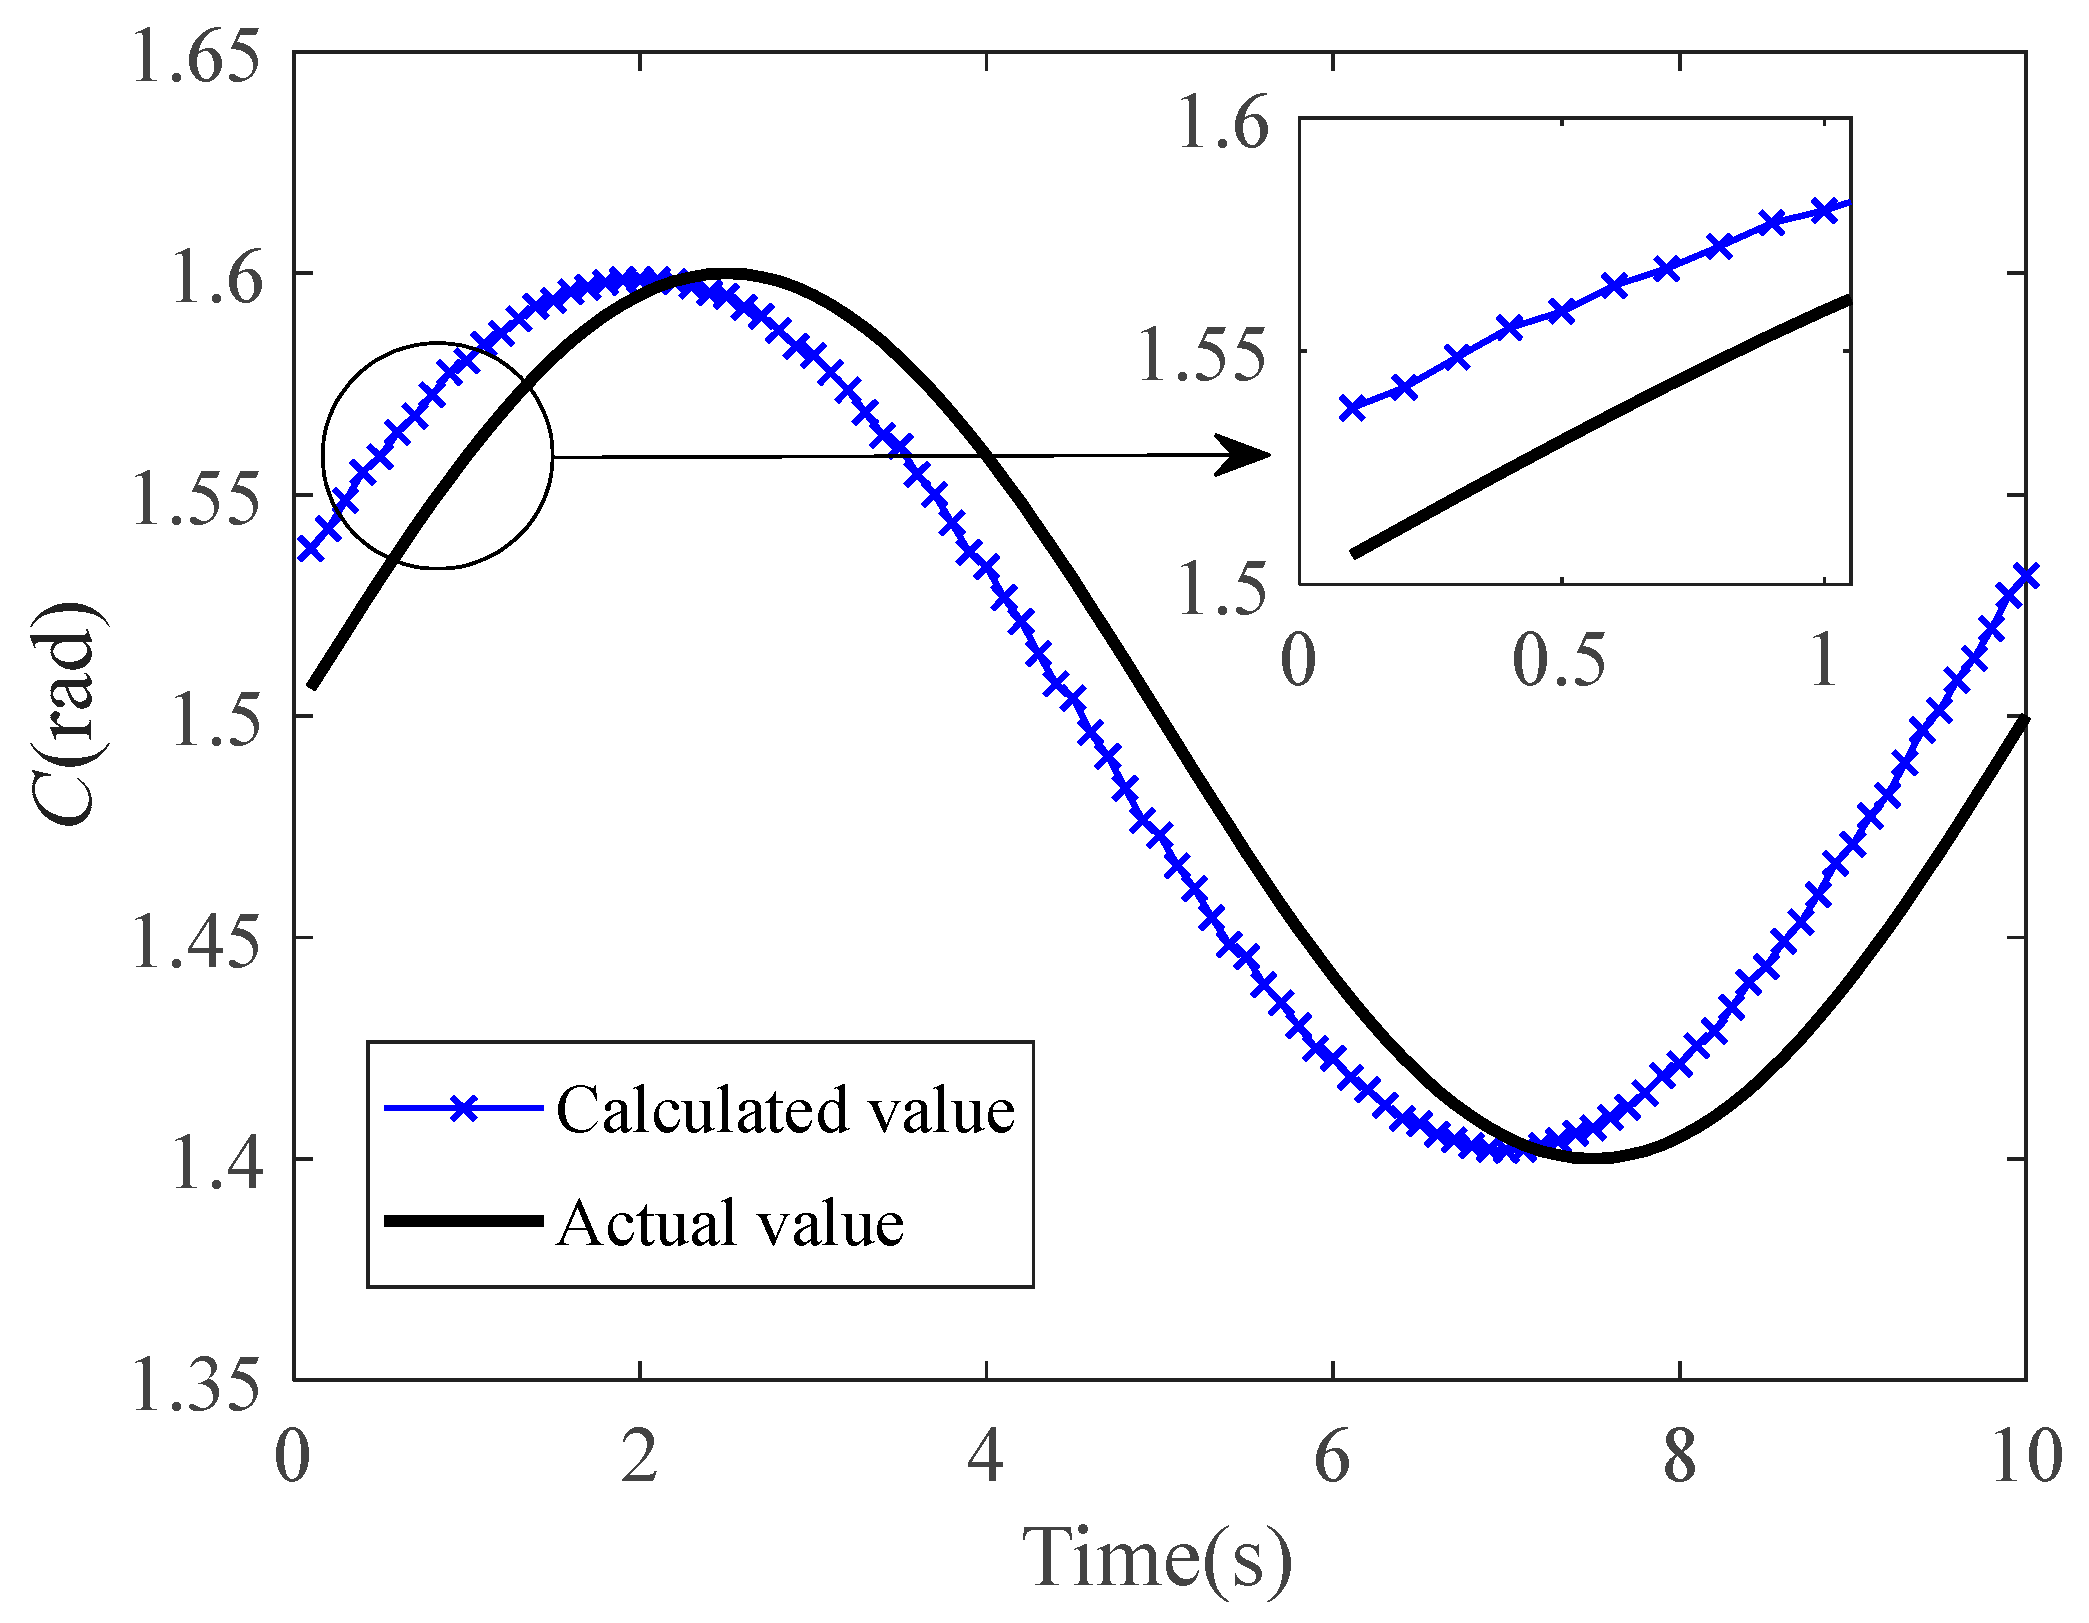
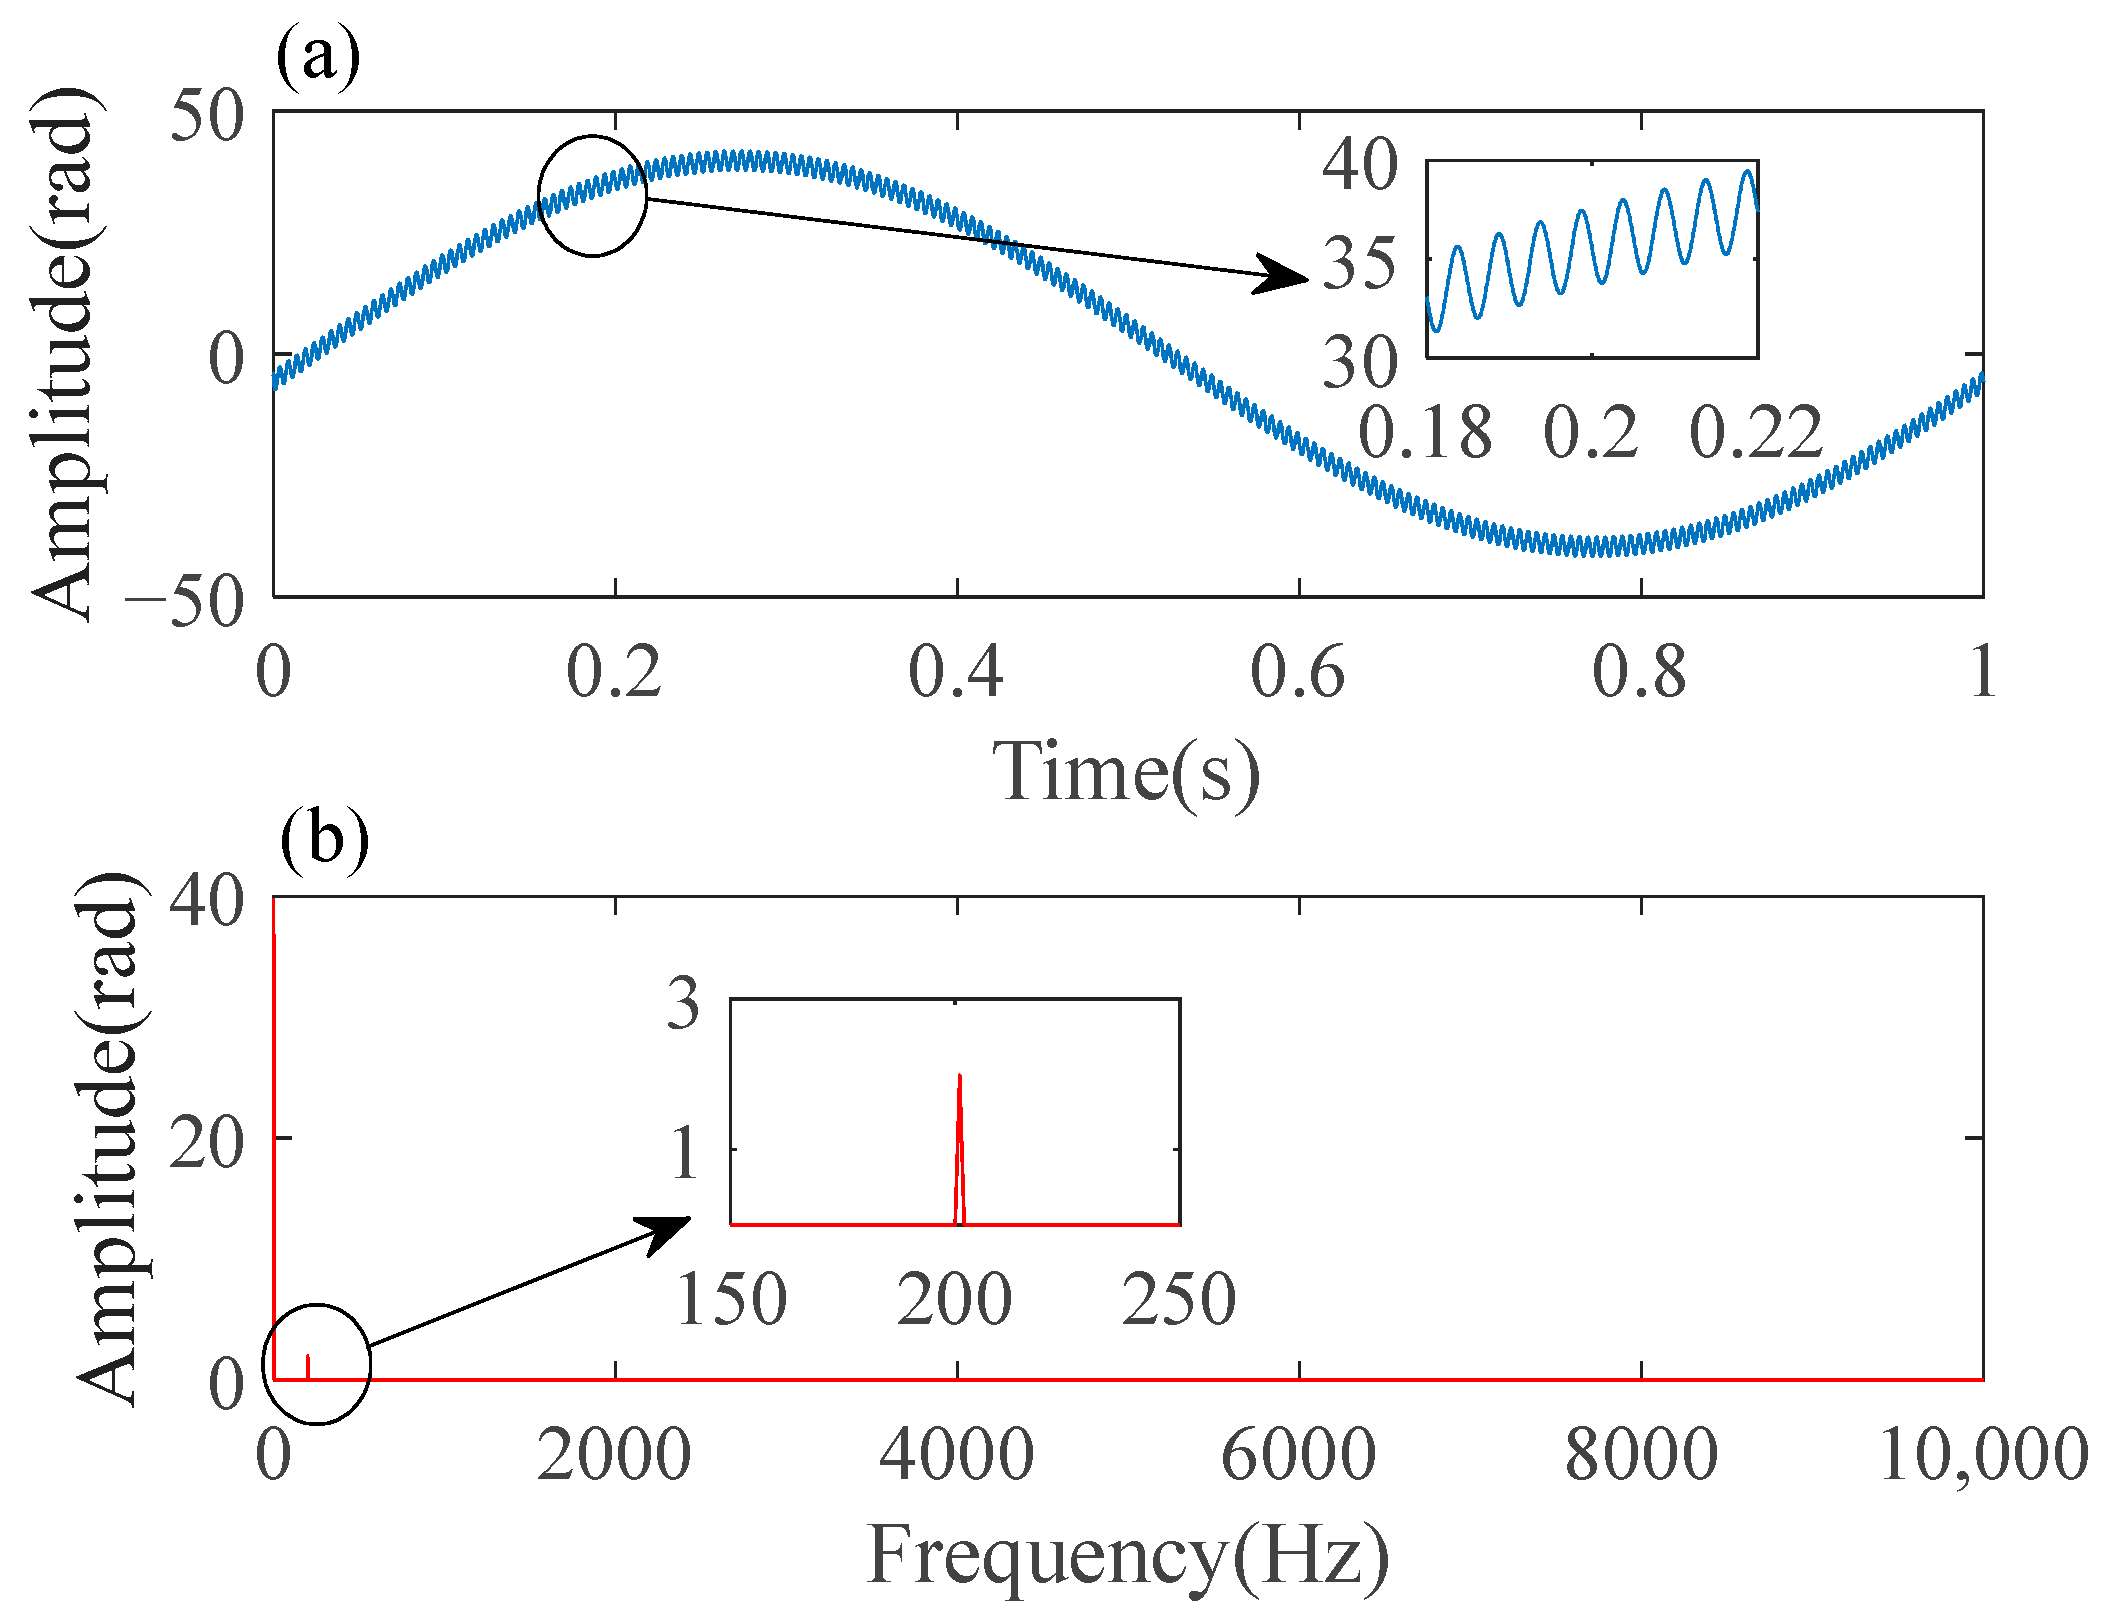
The simulated interference signal is shown in Figure 7. To facilitate calculation, the sampling time is set to 1 s; hence, the frequency resolution of Fourier spectrum is 1 Hz. From Figure 7b, it can be clearly observed that the low-frequency bandwidth is about 1 kHz, and the value of parameter N is set to 1000 for calculation of the phase modulation depth, which is calculated using the PMDEA algorithm. The carrier phase delay is calculated using the CPDEA algorithm. The phase modulation depth C is calculated as shown in Figure 8. The carrier phase delay Vc is 1.2564 rad, which is equal to the simulation setting.
From Figure 8, it can be observed that the variations in phase modulation depth calculated by the PMDEA algorithm are consistent with the parameter settings, and the phase modulation depth calculated by iteration method has a certain delay. This delay has a certain effect on the demodulation of the signal, but this effect can be ignored under some specific conditions. When the phase modulation depth changes in a predictable way or at a very low frequency change, the influence of phase modulation depth calculation delay can be ignored. And in an actual interferometer system, the phase modulation depth usually changes very slowly. Although the influence of this calculation delay is ignored in the proposed algorithm, the nonlinear error in demodulation results can be still greatly reduced compared with other demodulation algorithms, which, even directly, take no account of the phase modulation depth fluctuation.
On the horizontal axis, there is a phase difference of about 0.03 rad between actual and calculated values of phase modulation depth, because the algorithm uses the calculated value in the time interval from ti. to ti+1 as an approximation of that at time node ti. In practice, the phase modulation depth C usually changes very slowly; hence, calculation results of the algorithm can be taken as close approximations to actual values.
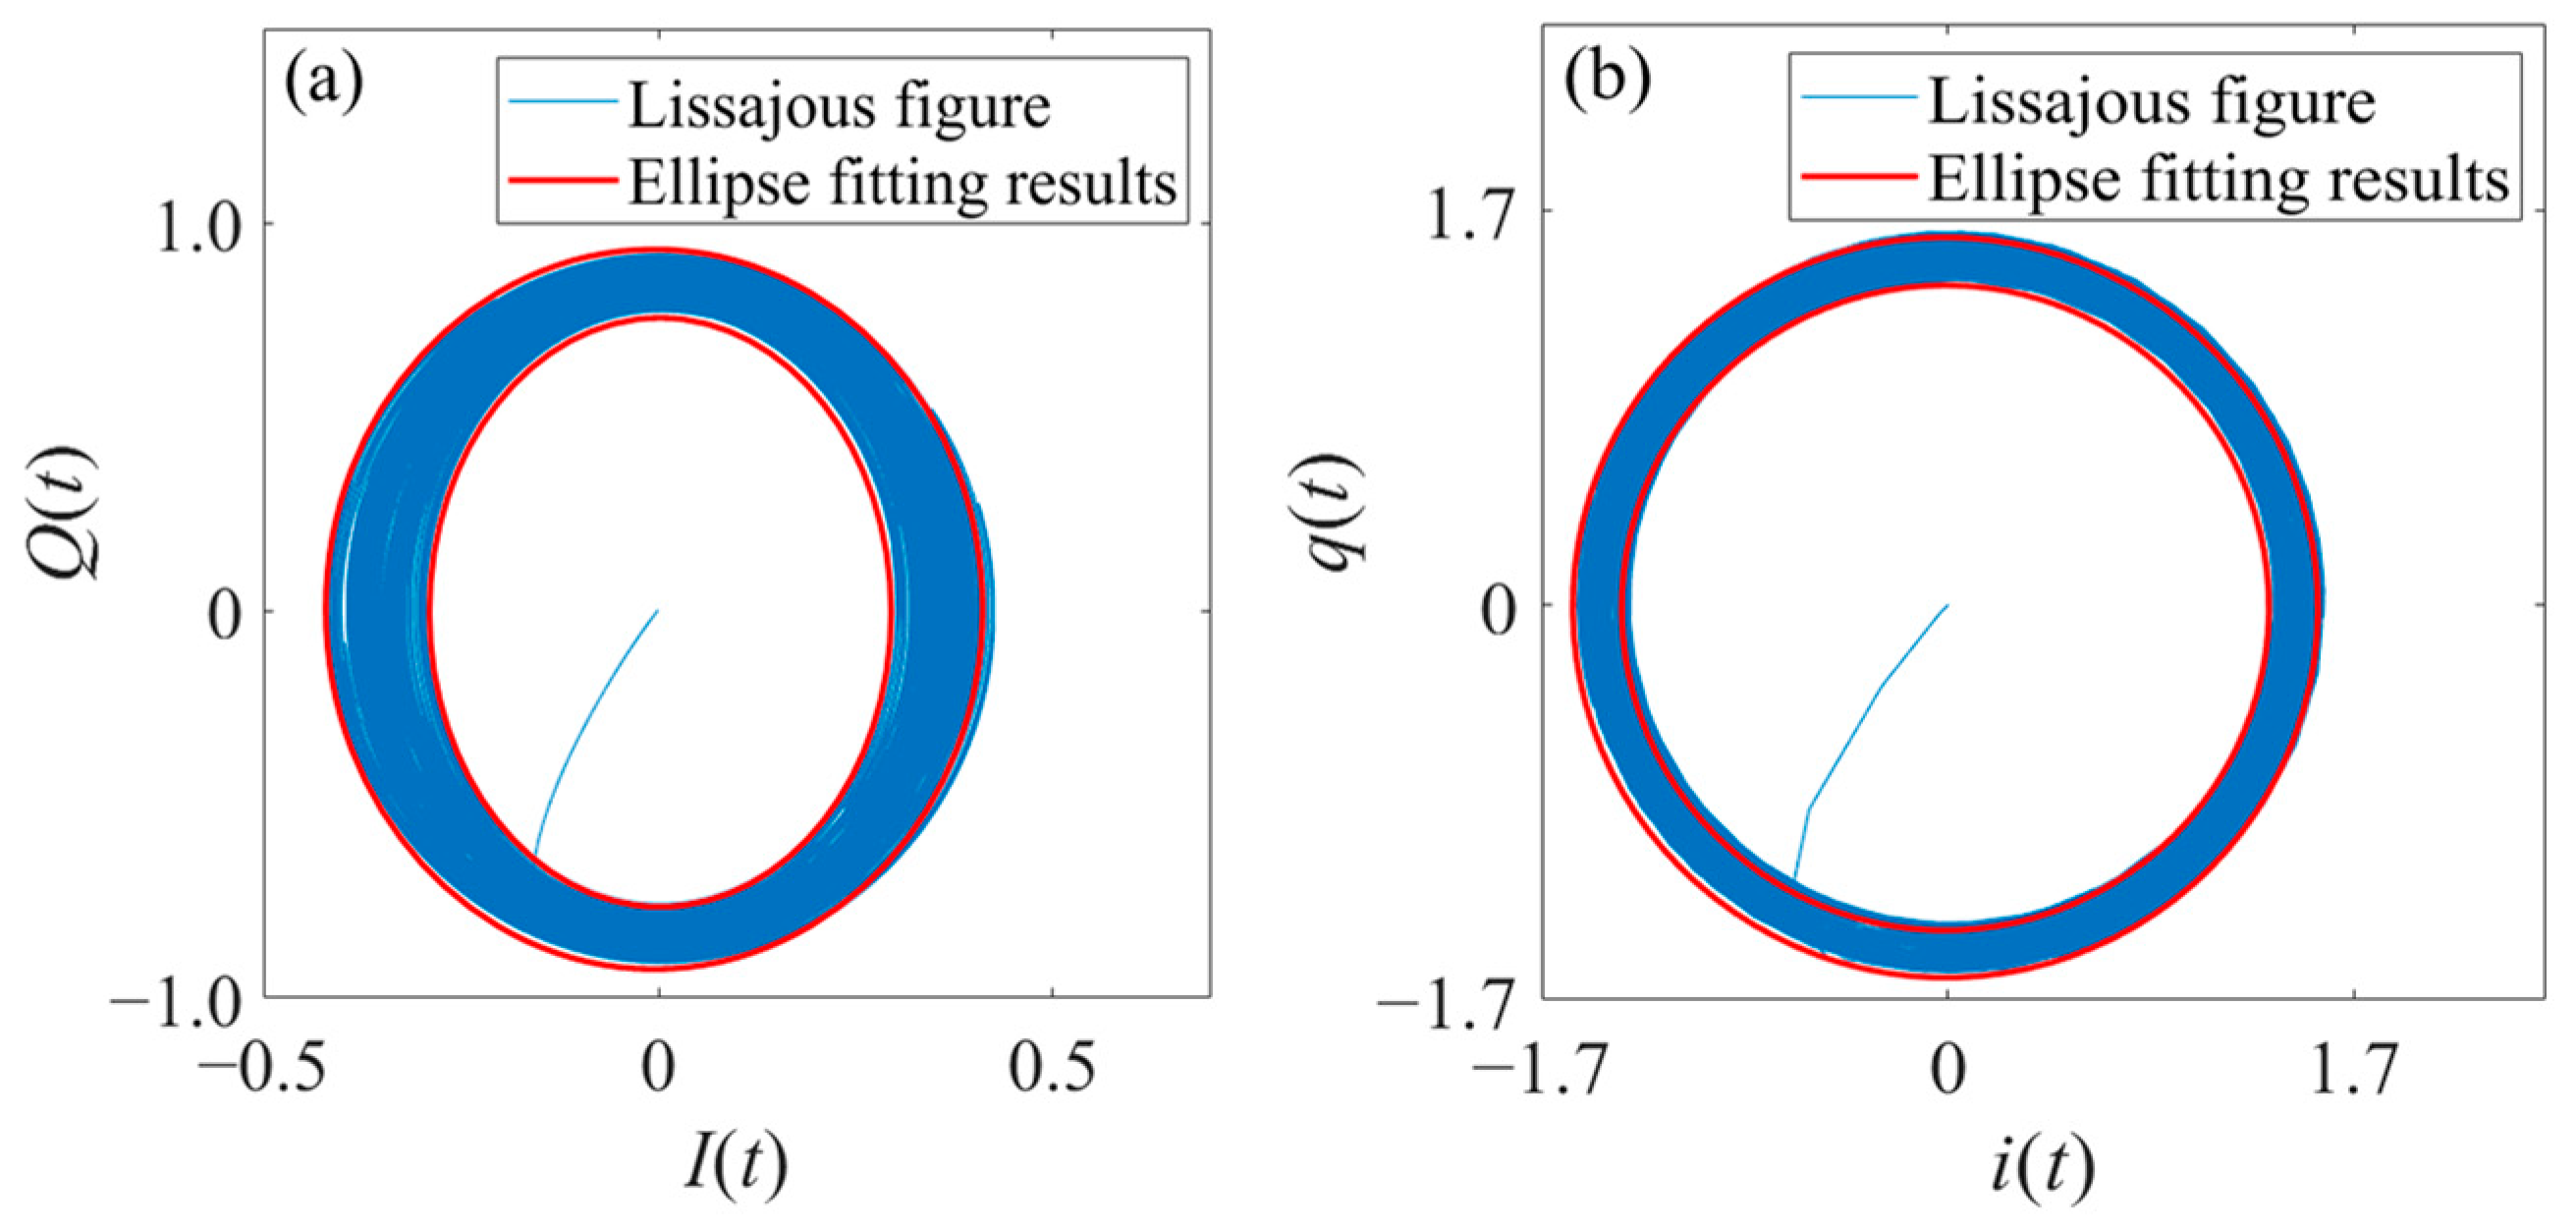
The calculated phase modulation depth and carrier phase delay are used to prenormalize the quadrature signal components Q(t) and I(t) to produce a new pair of quadrature components q(t) and i(t). As shown in Figure 9, the two quadrature signal components form a uniformly wide elliptical ring after prenormalization. Figure 9 clearly illustrates the effectiveness of the prenormalization process, indicating that it effectively eliminates the local nonuniform widening phenomenon of the Lissajous ellipse caused by the variations in phase modulation depth. This further substantiates the accuracy of the PMDEA algorithms and demonstrates the necessity of prenormalizing the quadrature interference signal components using the phase modulation depth evaluation algorithms.
The extraction of ellipse parameters from the Lissajous elliptical rings yields the following results: For the outer contour ellipse, the center coordinates are (−0.012, −0.018), the major axis length is 1.604, and the minor axis length is 1.603. For the inner contour ellipse, the center coordinates are (−0.012, −0.012), the major axis length is 1.397, and the minor axis length is 1.396. It can be seen that the inner ellipse and the outer ellipse have the very close axial ratio of 1.0006, which equals the ratio of the filter gain coefficients E2 and E1.
The improved PGC-Arctan algorithm based on prenormalization and Lissajous ellipse fitting proposed in this paper is used to demodulate the simulated interference signal. The demodulation result is shown in Figure 10. It can be seen that the demodulated phase difference is composed of low-frequency perturbations and measured vibrations. The vibration frequency of the water surface acoustic wave is 200 Hz, which is consistent with the parameter set in the simulation. Low-frequency disturbances can be effectively eliminated by using a high-pass filter.
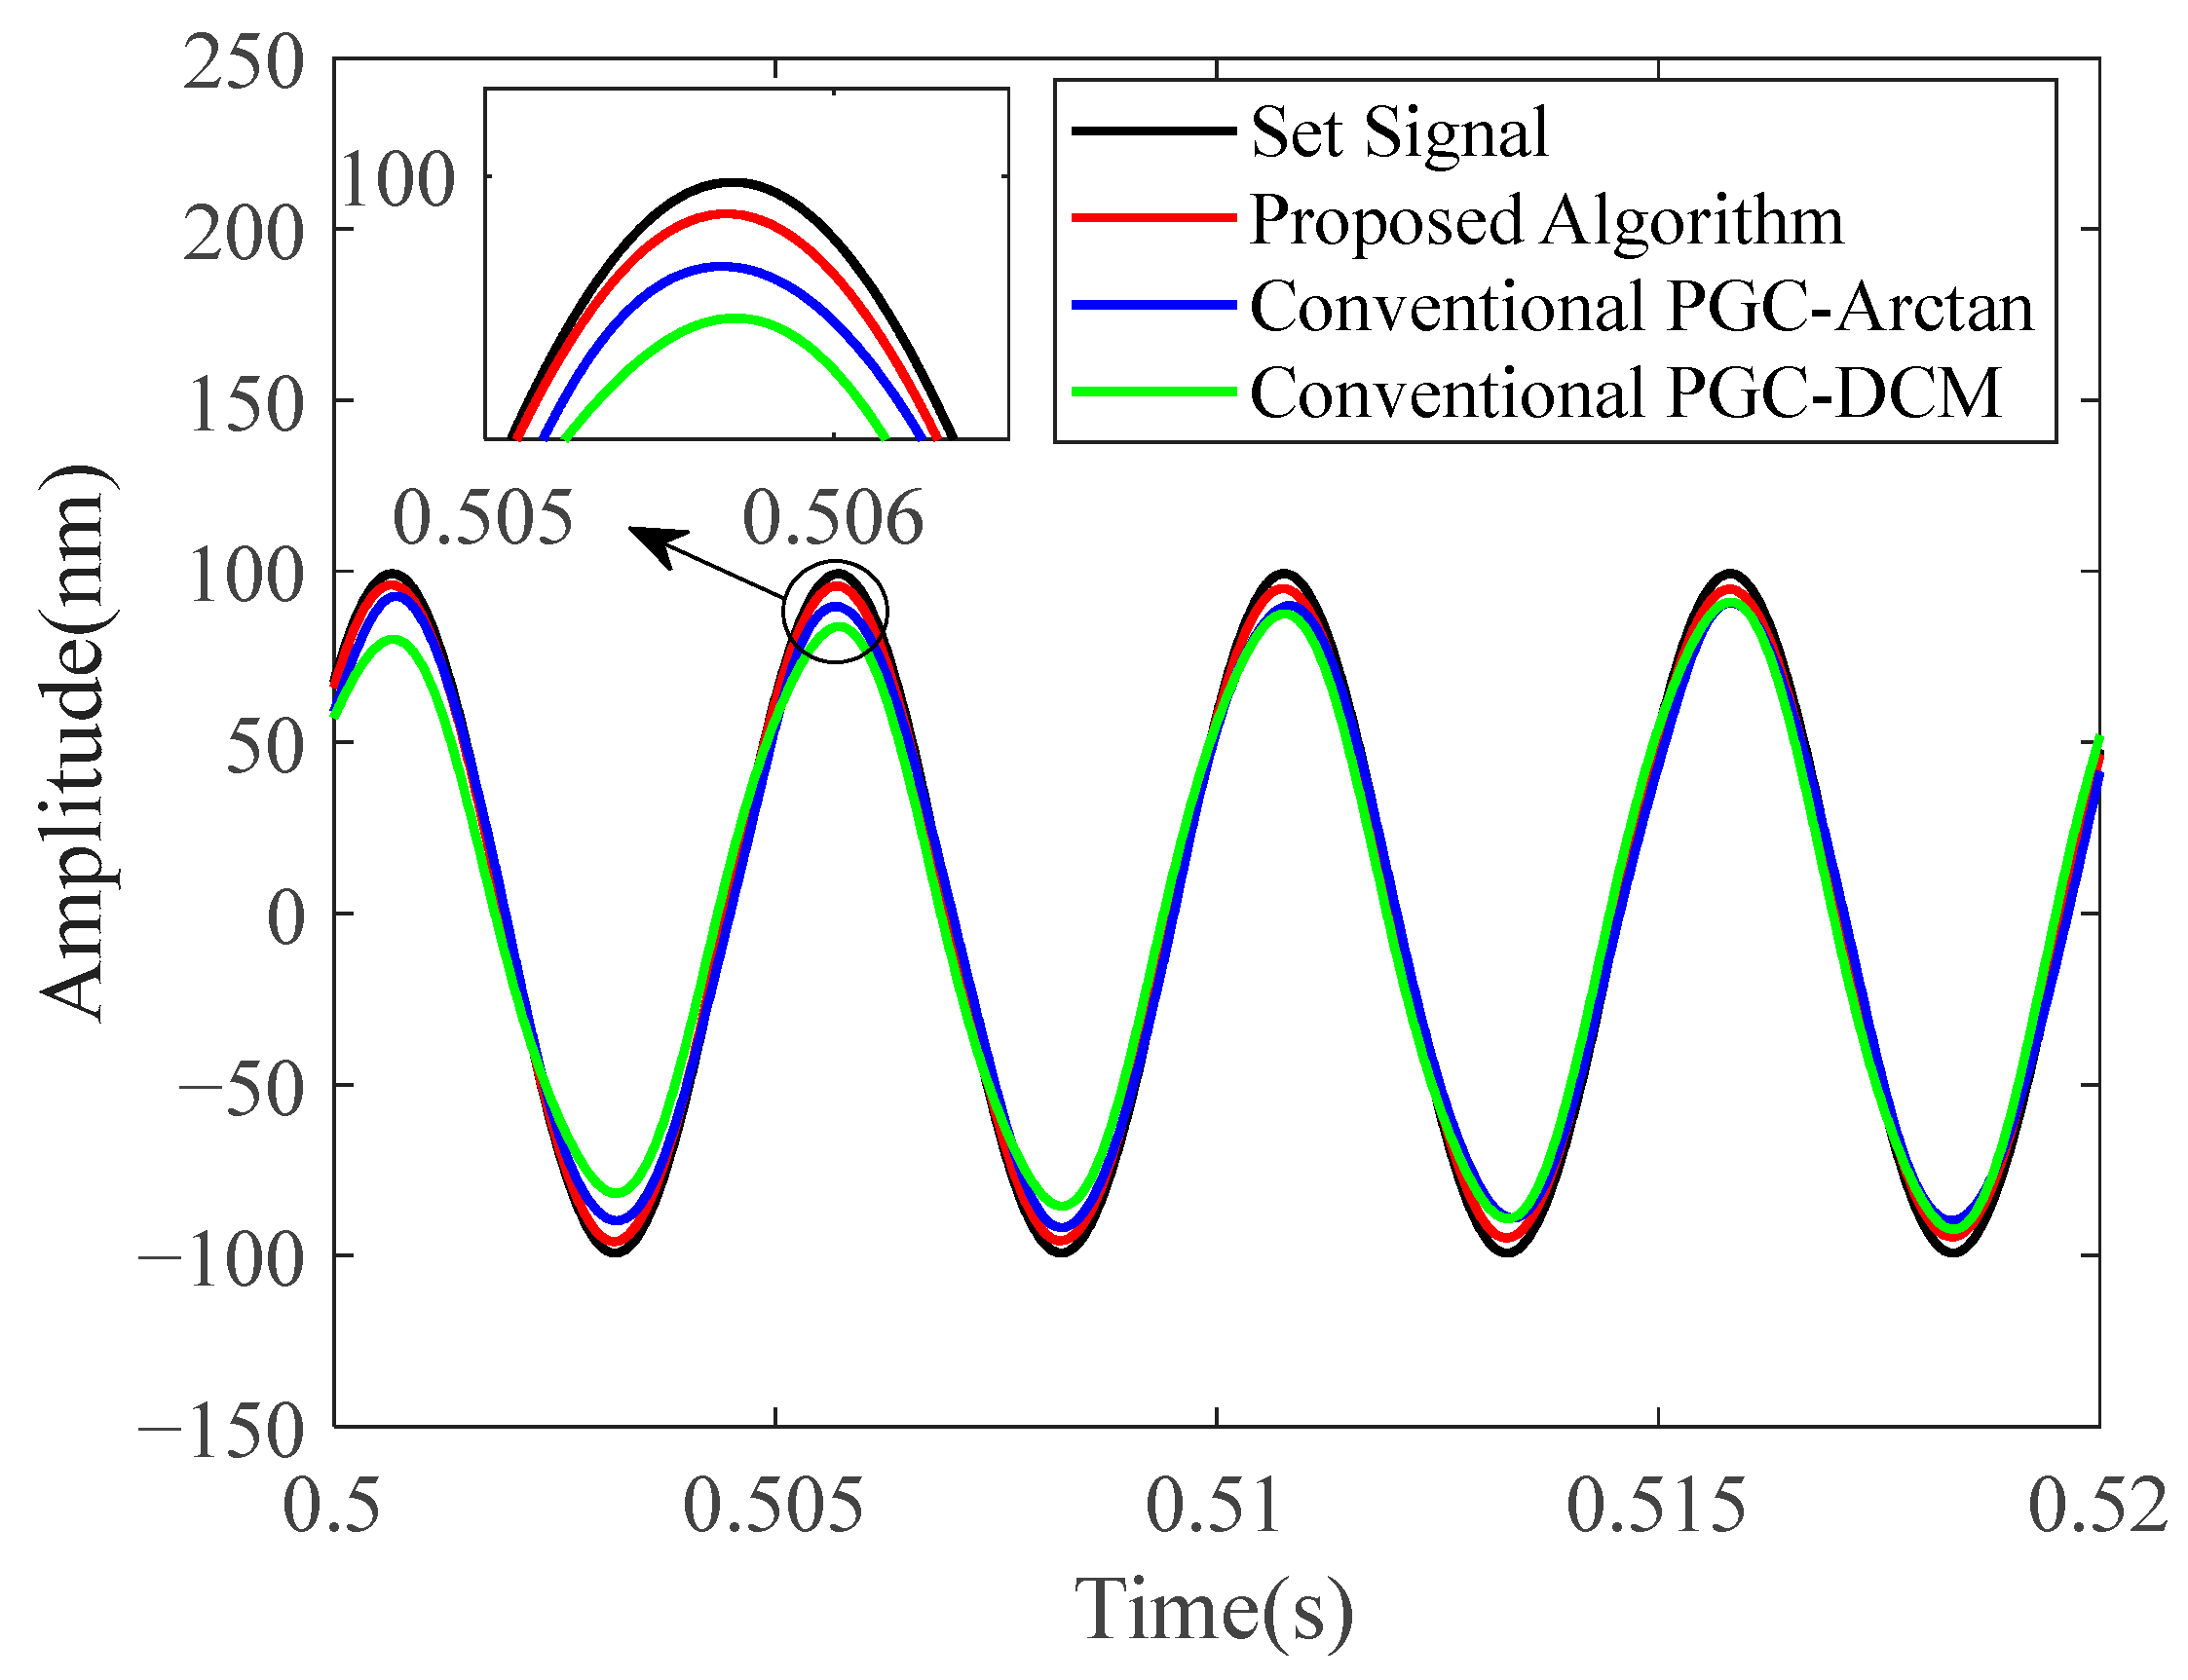
The simulation signals are demodulated by the conventional PGC-Arctan algorithm, PGC-DCM algorithm, and the proposed prenormalized PGC-Arctan algorithm, respectively, and the demodulation results after high-pass filtering (in a partial time interval) are shown in Figure 11. It can be seen that the demodulation result obtained by the proposed algorithm is obviously closer to the simulation set signal than those obtained by the conventional algorithms, which proves that the proposed algorithm can better suppress the nonlinear error compared with the conventional PGC demodulation algorithms.

5. Water Surface Acoustic Wave Detection Experiment

To investigate the accuracy of the improved PGC-Arctan algorithm combining prenormalization and Lissajous ellipse fitting, actual water surface acoustic wave detection experiments were carried out. The schematic diagram of the experimental setup is shown in Figure 12, and the principles of the detection optical path are explained in Chapter 2. In this experimental system, the function signal generator outputs signals with specified waveform to the high-voltage amplifier and the power amplifier separately. The high-voltage amplifier drives the electro-optic carrier modulator to generate a designated high-frequency carrier for the reference light phase. Simultaneously, the power amplifier drives the electroacoustic transducer to induce vibrations on the water surface with the same signal. A data acquisition (DAQ) card collects the interference signals converted by the photodetector and the drive signal generated by the signal generator.
The experimental platform is shown in Figure 13. The laser source is a narrow width frequency stabilized He–Ne laser (HRS015B, Thorlabs) with an operating wavelength of 632.8 nm. The carrier frequency of the electro-optic phase modulator (EO-PM-PR-C1, Thorlabs) is 60 kHz. The sampling rate of the data acquisition card (USB-61210, JYTEK) is 1 MHz.

5.1. Stable-Frequency and Stable-Amplitude Water Surface Acoustic Wave Detection Experiment

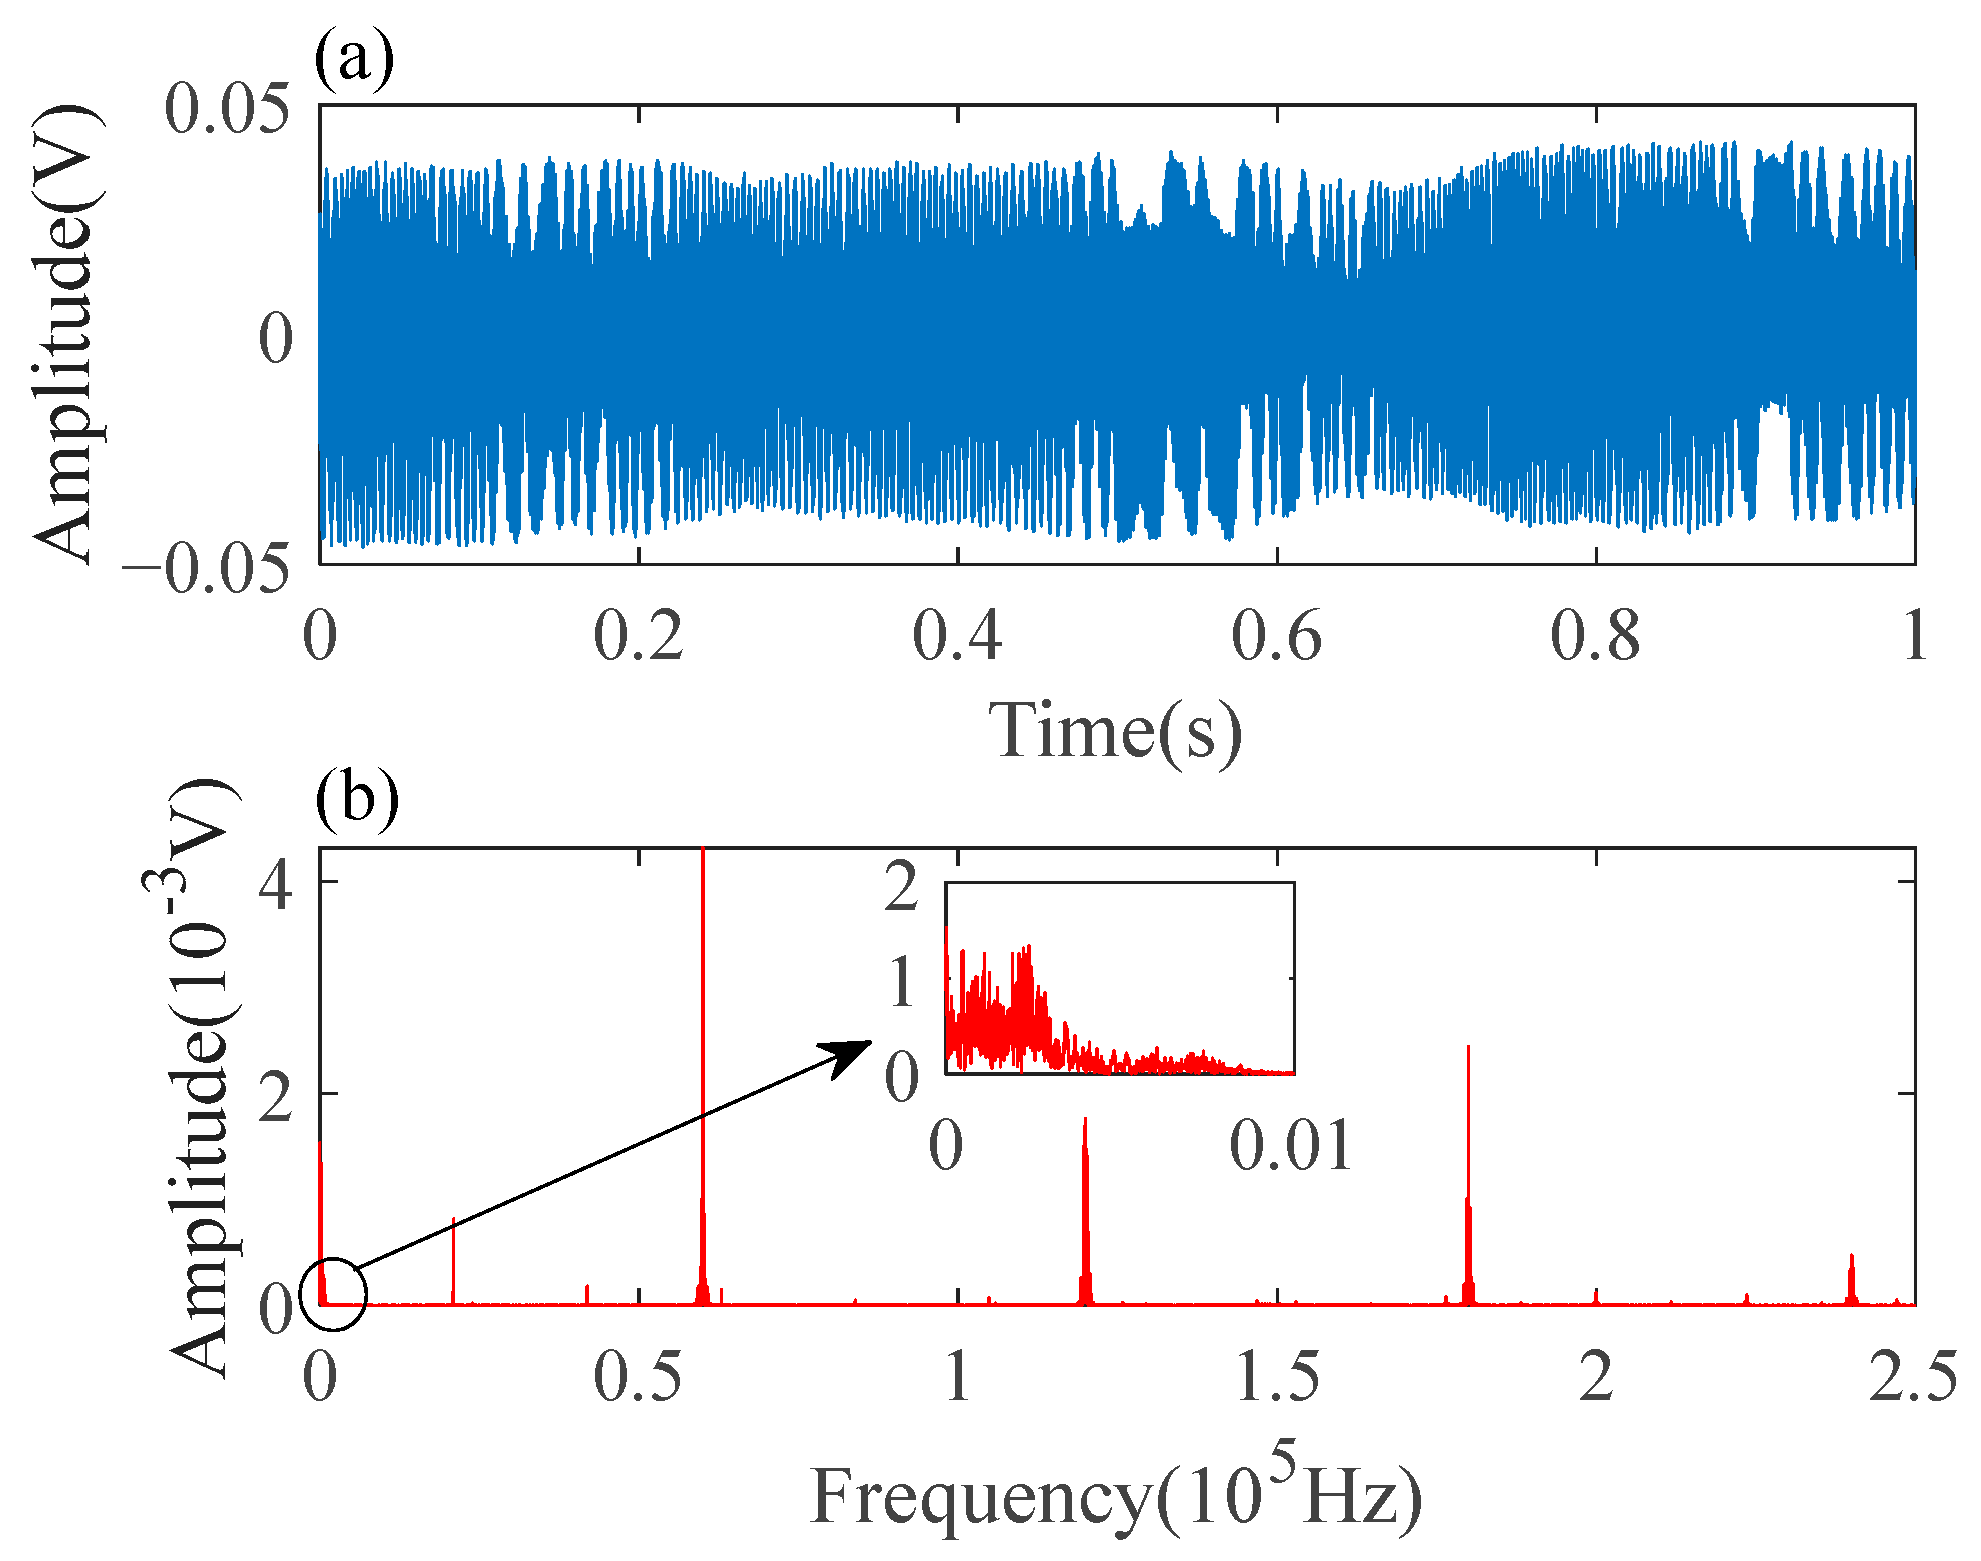
To prove the accuracy of the prenormalized PGC-Arctan algorithm proposed in this paper and the feasibility of the experimental system, the signal generator generated a sinusoidal wave signal with a specified amplitude at the frequency of 60 kHz for the high-voltage amplifier and a sinusoidal wave signal with a specified amplitude at the frequency of 500 Hz for the power amplifier. The sampling time was set to 1 s. Water surface acoustic wave detection experiments were conducted on the above experimental platform, and the proposed algorithm was used for demodulation. The interference signals of the stable-frequency and stable-amplitude water surface acoustic wave detection experiment are shown in Figure 14. From Figure 14b, it can be observed that there are dense spectral lines in the frequency range below 250 Hz, which are caused by low-frequency environmental disturbances. At 500 Hz, dense spectral lines also appear, but with lower signal intensity, which are attributed to the water surface acoustic waves. Therefore, the bandwidth of the spectral lines in the low-frequency range is approximately 750 Hz. Since the spectral resolution is 1 Hz, the value of N for calculating the phase modulation depth is 750.
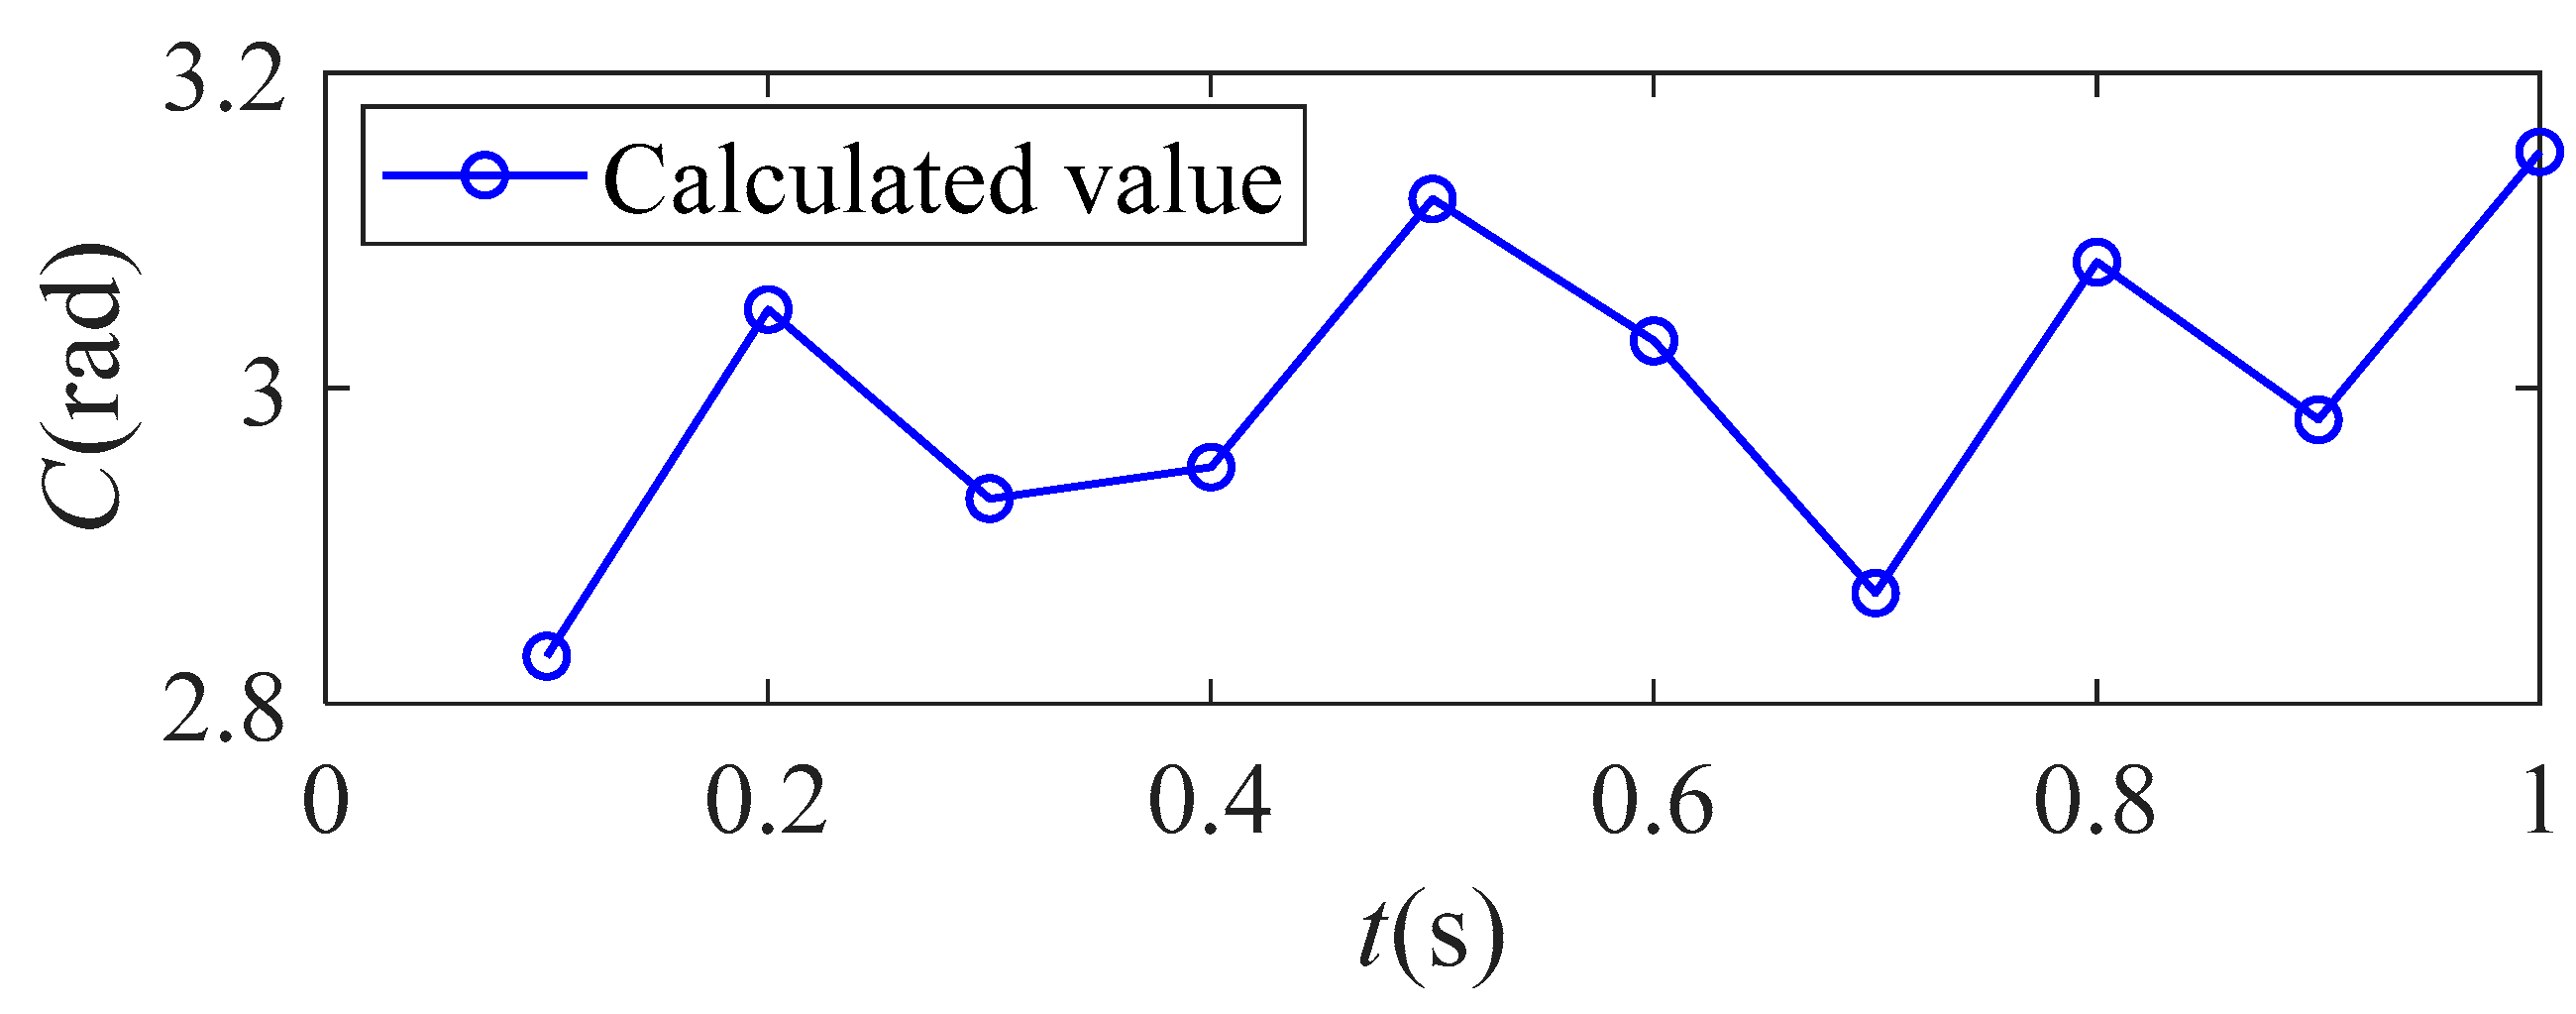
The PMDEA algorithm is used to calculate the phase modulation depth and the CPDEA algorithm is used to calculate the carrier phase delay; the calculation results of phase modulation depth are shown in Figure 15, and the carrier phase delay Vc is 0.3638 rad. It can be observed that the phase modulation depth exhibits small fluctuations within a narrow range. Therefore, the calculated values of phase modulation depth can be considered as close approximations to the actual values.
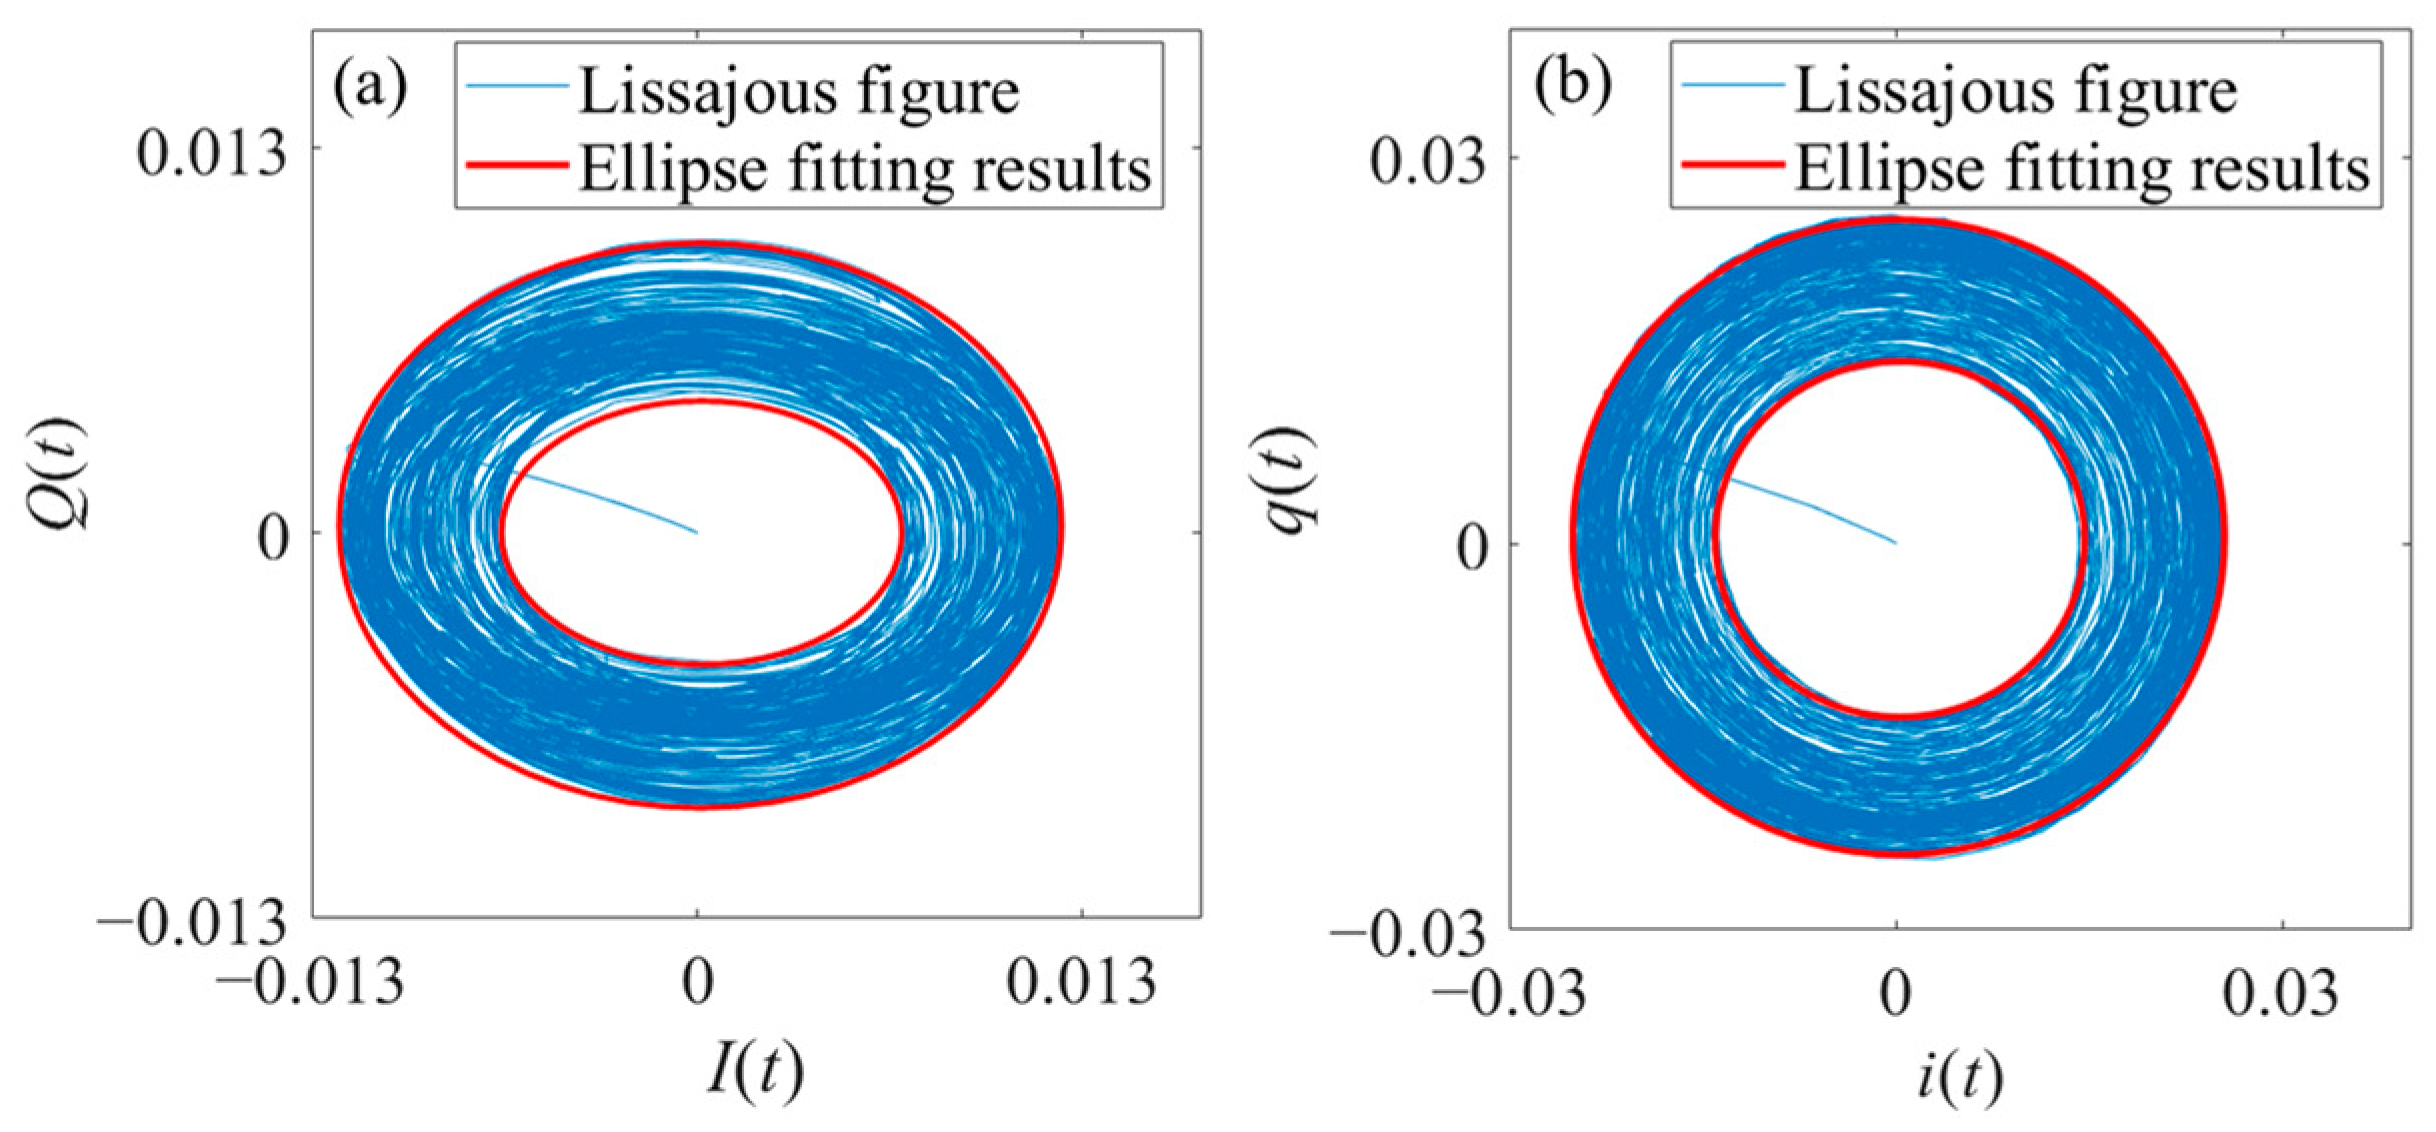
Using the above calculated results, prenormalization was performed on the orthogonal interference signals Q(t) and I(t). Then, an ellipse pattern known as Lissajous figure was constructed with q(t) as the x-axis and i(t) as the y-axis. Subsequently, ellipse fitting was performed, and the results before and after prenormalization are shown in Figure 16. In the Lissajous figure before prenormalization, it is obviously can be observed that the width of the Lissajous ellipse performs an uneven and abnormal broadening phenomena. In this paper, the outliers of the inner and outer contour ellipses were removed using the 3σ criterion. Then, the parameters of the two ellipses were obtained through the least-squares approach. The ellipse center coordinates of the outer contour are (0.0001, 0.0004), the length of the major axis is 0.0253, the length of the minor axis is 0.0246, and the rotation angle of the coordinate axes is 0.032°. The ellipse center coordinates of the inner contour are (0.0003, 0.0003), the length of the major axis is 0.0143, the length of the minor axis is 0.0138, and the rotation angle of the coordinate axes is 0.017°. Based on the axial ratio, the ratio of the filter gain coefficient E2 to E1 is derived, which is equal to 1.02. The inner contour ellipse is proportional to the outer contour ellipse, which further proves the correctness of the theory described in this paper.
Using traditional PGC-Arctan and PGC-DCM algorithms and the prenormalized PGC-Arctan algorithm proposed in this paper, the interferometric detection signals from the stable-frequency and stable-amplitude water surface acoustic wave detection experiment were demodulated. The demodulation results are shown in Figure 17. From Figure 17c,d, it can be observed that the demodulation results of the traditional PGC-Arctan algorithm contain very noticeable noise due to the influence of interference signal visibility variations, phase modulation depth fluctuation, and other nonideal factors. In Figure 17e,f, it can be seen that the demodulation results of the traditional PGC-DCM algorithm have lost the intensity information of the water surface acoustic waves due to drastic changes in interference signal visibility. Figure 17a,b show that the prenormalized PGC-Arctan algorithm can better restore the water surface acoustic waves. Through calculations, the signal-to-noise distortion ratio is 16.25 dB in the demodulation results of the conventional PGC-Arctan algorithm, 15.44 dB in the demodulation results of the conventional PGC-DCM algorithm, and 28.88 dB in the demodulation results of the prenormalized PGC-Arctan algorithm. Therefore, compared to conventional demodulation algorithms, the proposed algorithm provides better demodulation for stable-frequency and stable-amplitude water surface acoustic waves, and significantly improves the demodulation performance in harmonic distortion and signal-to-noise ratio.
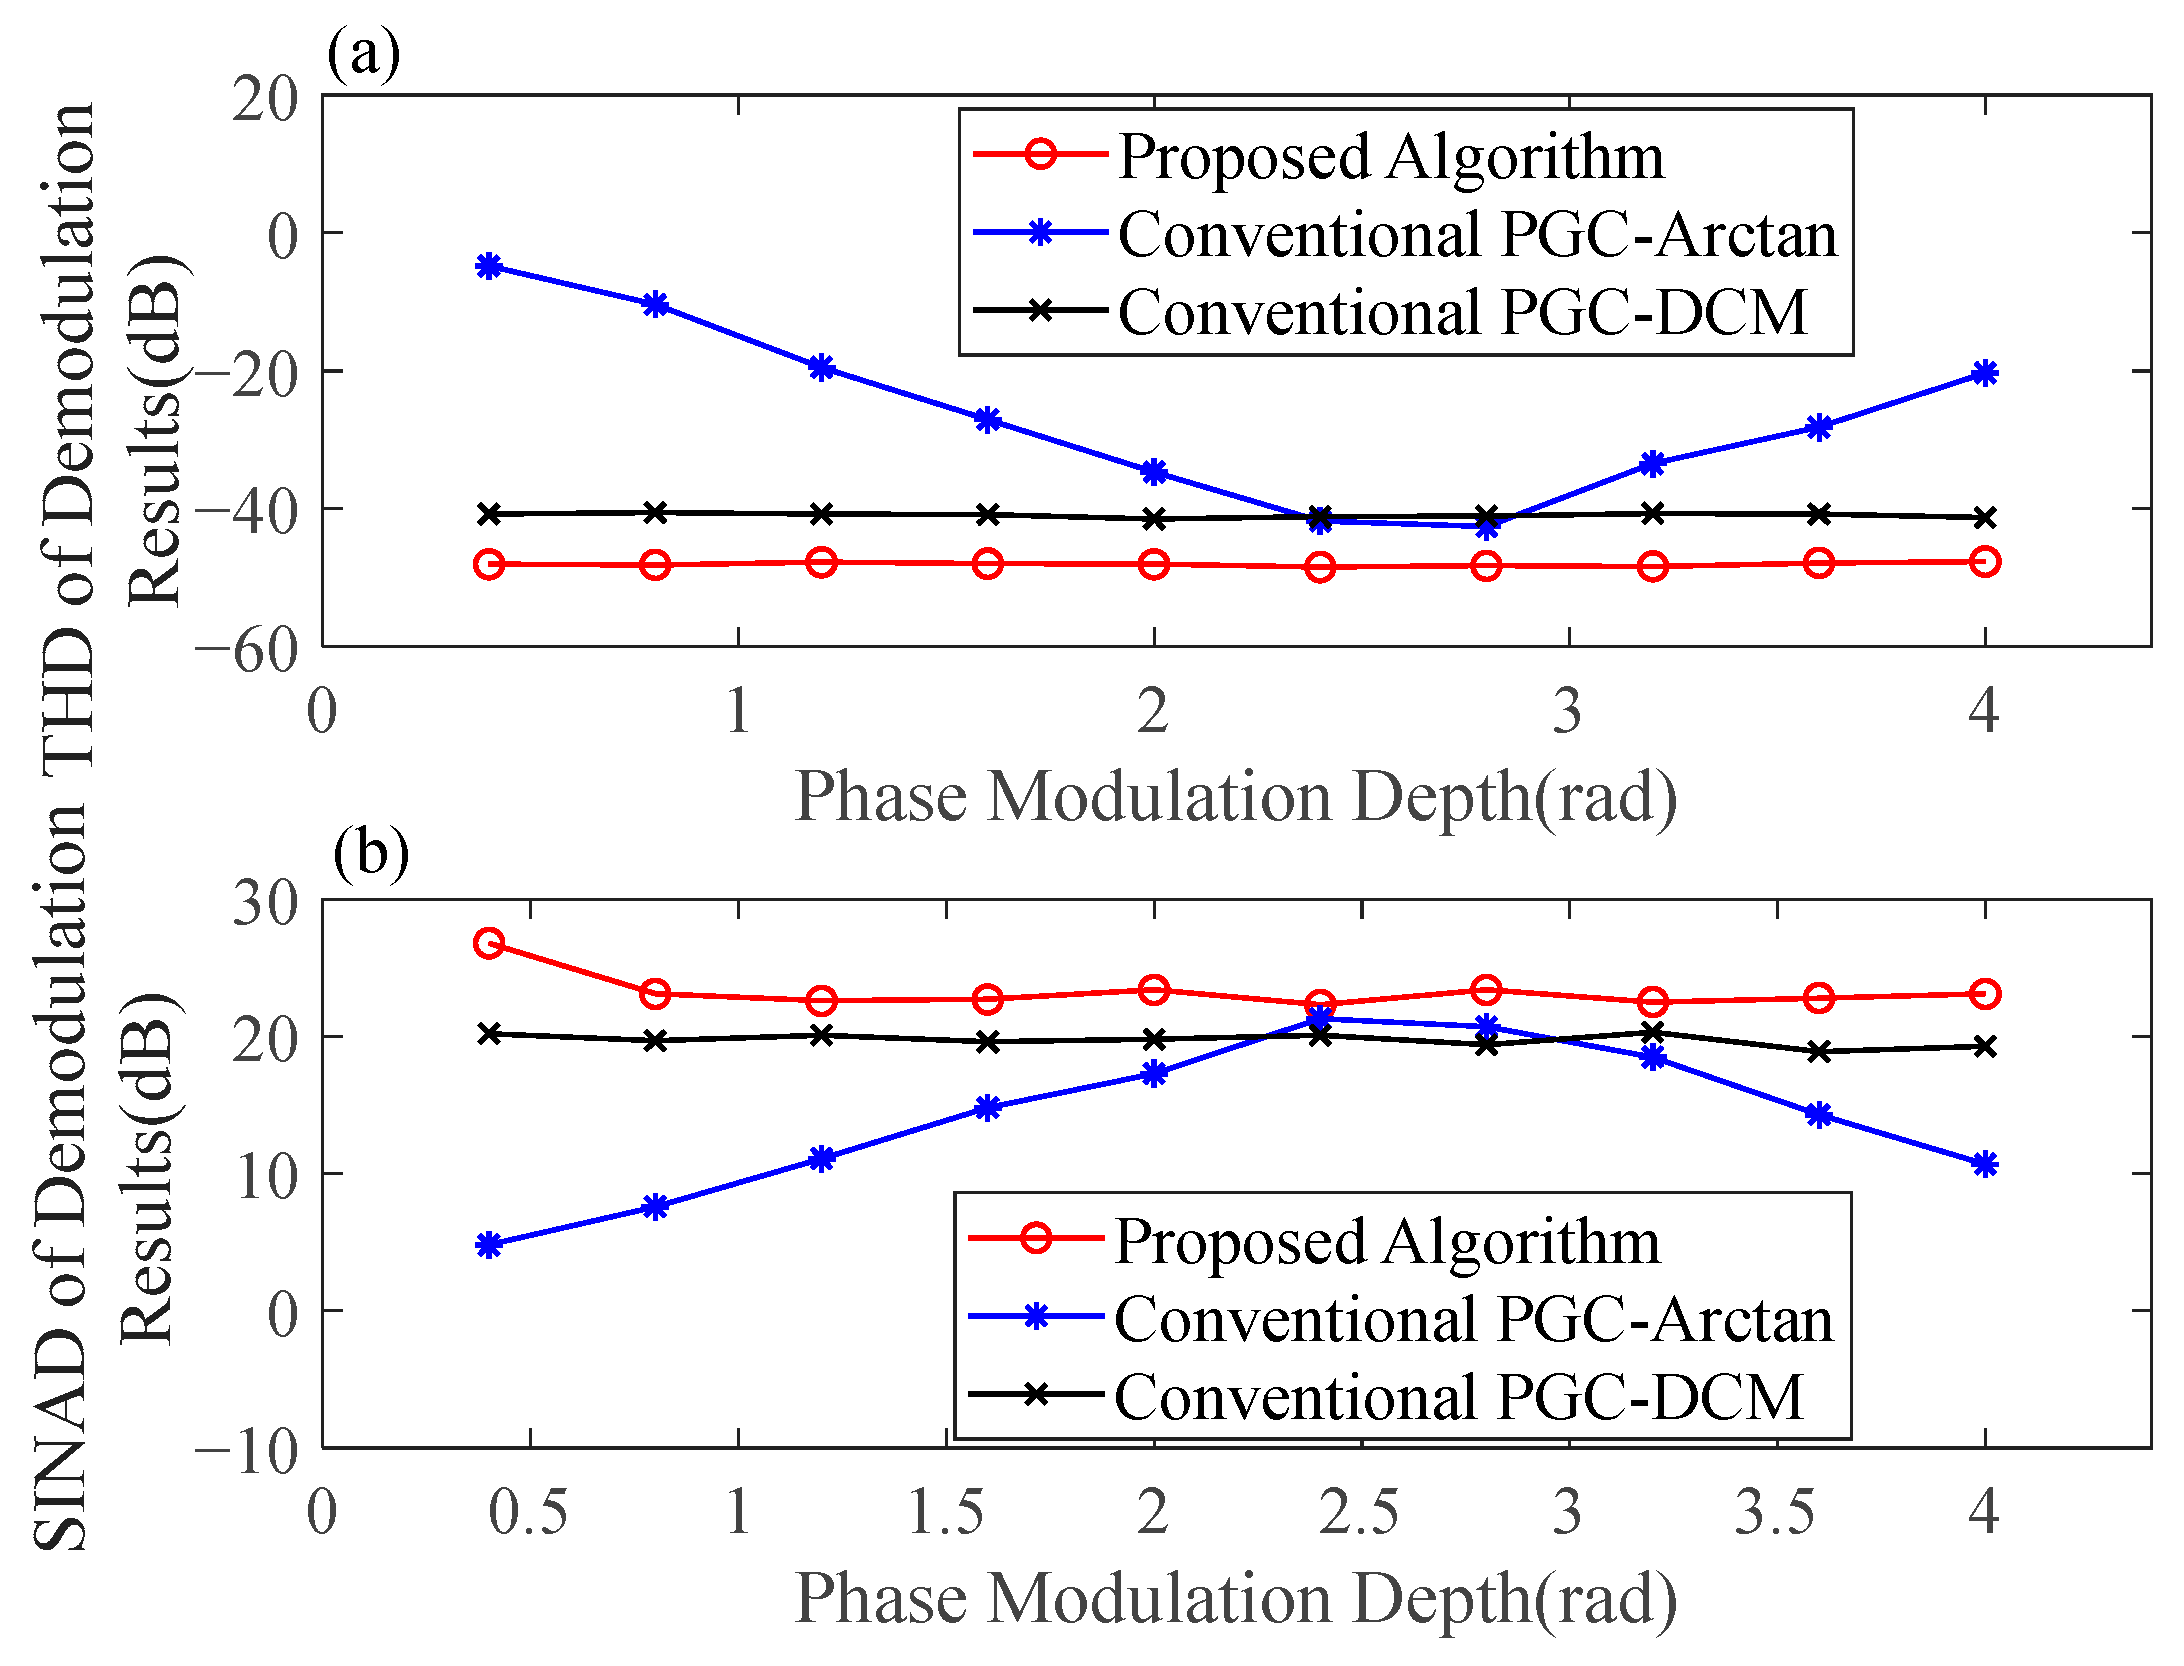
To investigate the demodulation performance of different algorithms in sensitiveness to the phase modulation depth, more detection experiments were carried out using a sinusoidal phase modulation interferometer with different phase modulation depths, and the conventional PGC-Arctan, PGC-DCM, and the improved algorithm proposed in this paper were, respectively, used in signal demodulation. The total harmonic distortion (THD) and the signal to noise and distortion (SINAD) were taken as the evaluation index, and the comparison results of the three demodulation algorithms are shown in Figure 18. Experimental results show that the proposed algorithm has the best demodulation performance that is insensitive to the phase modulation depth.

5.2. Experiment on Amplitude Detection of Water Surface Acoustic Waves

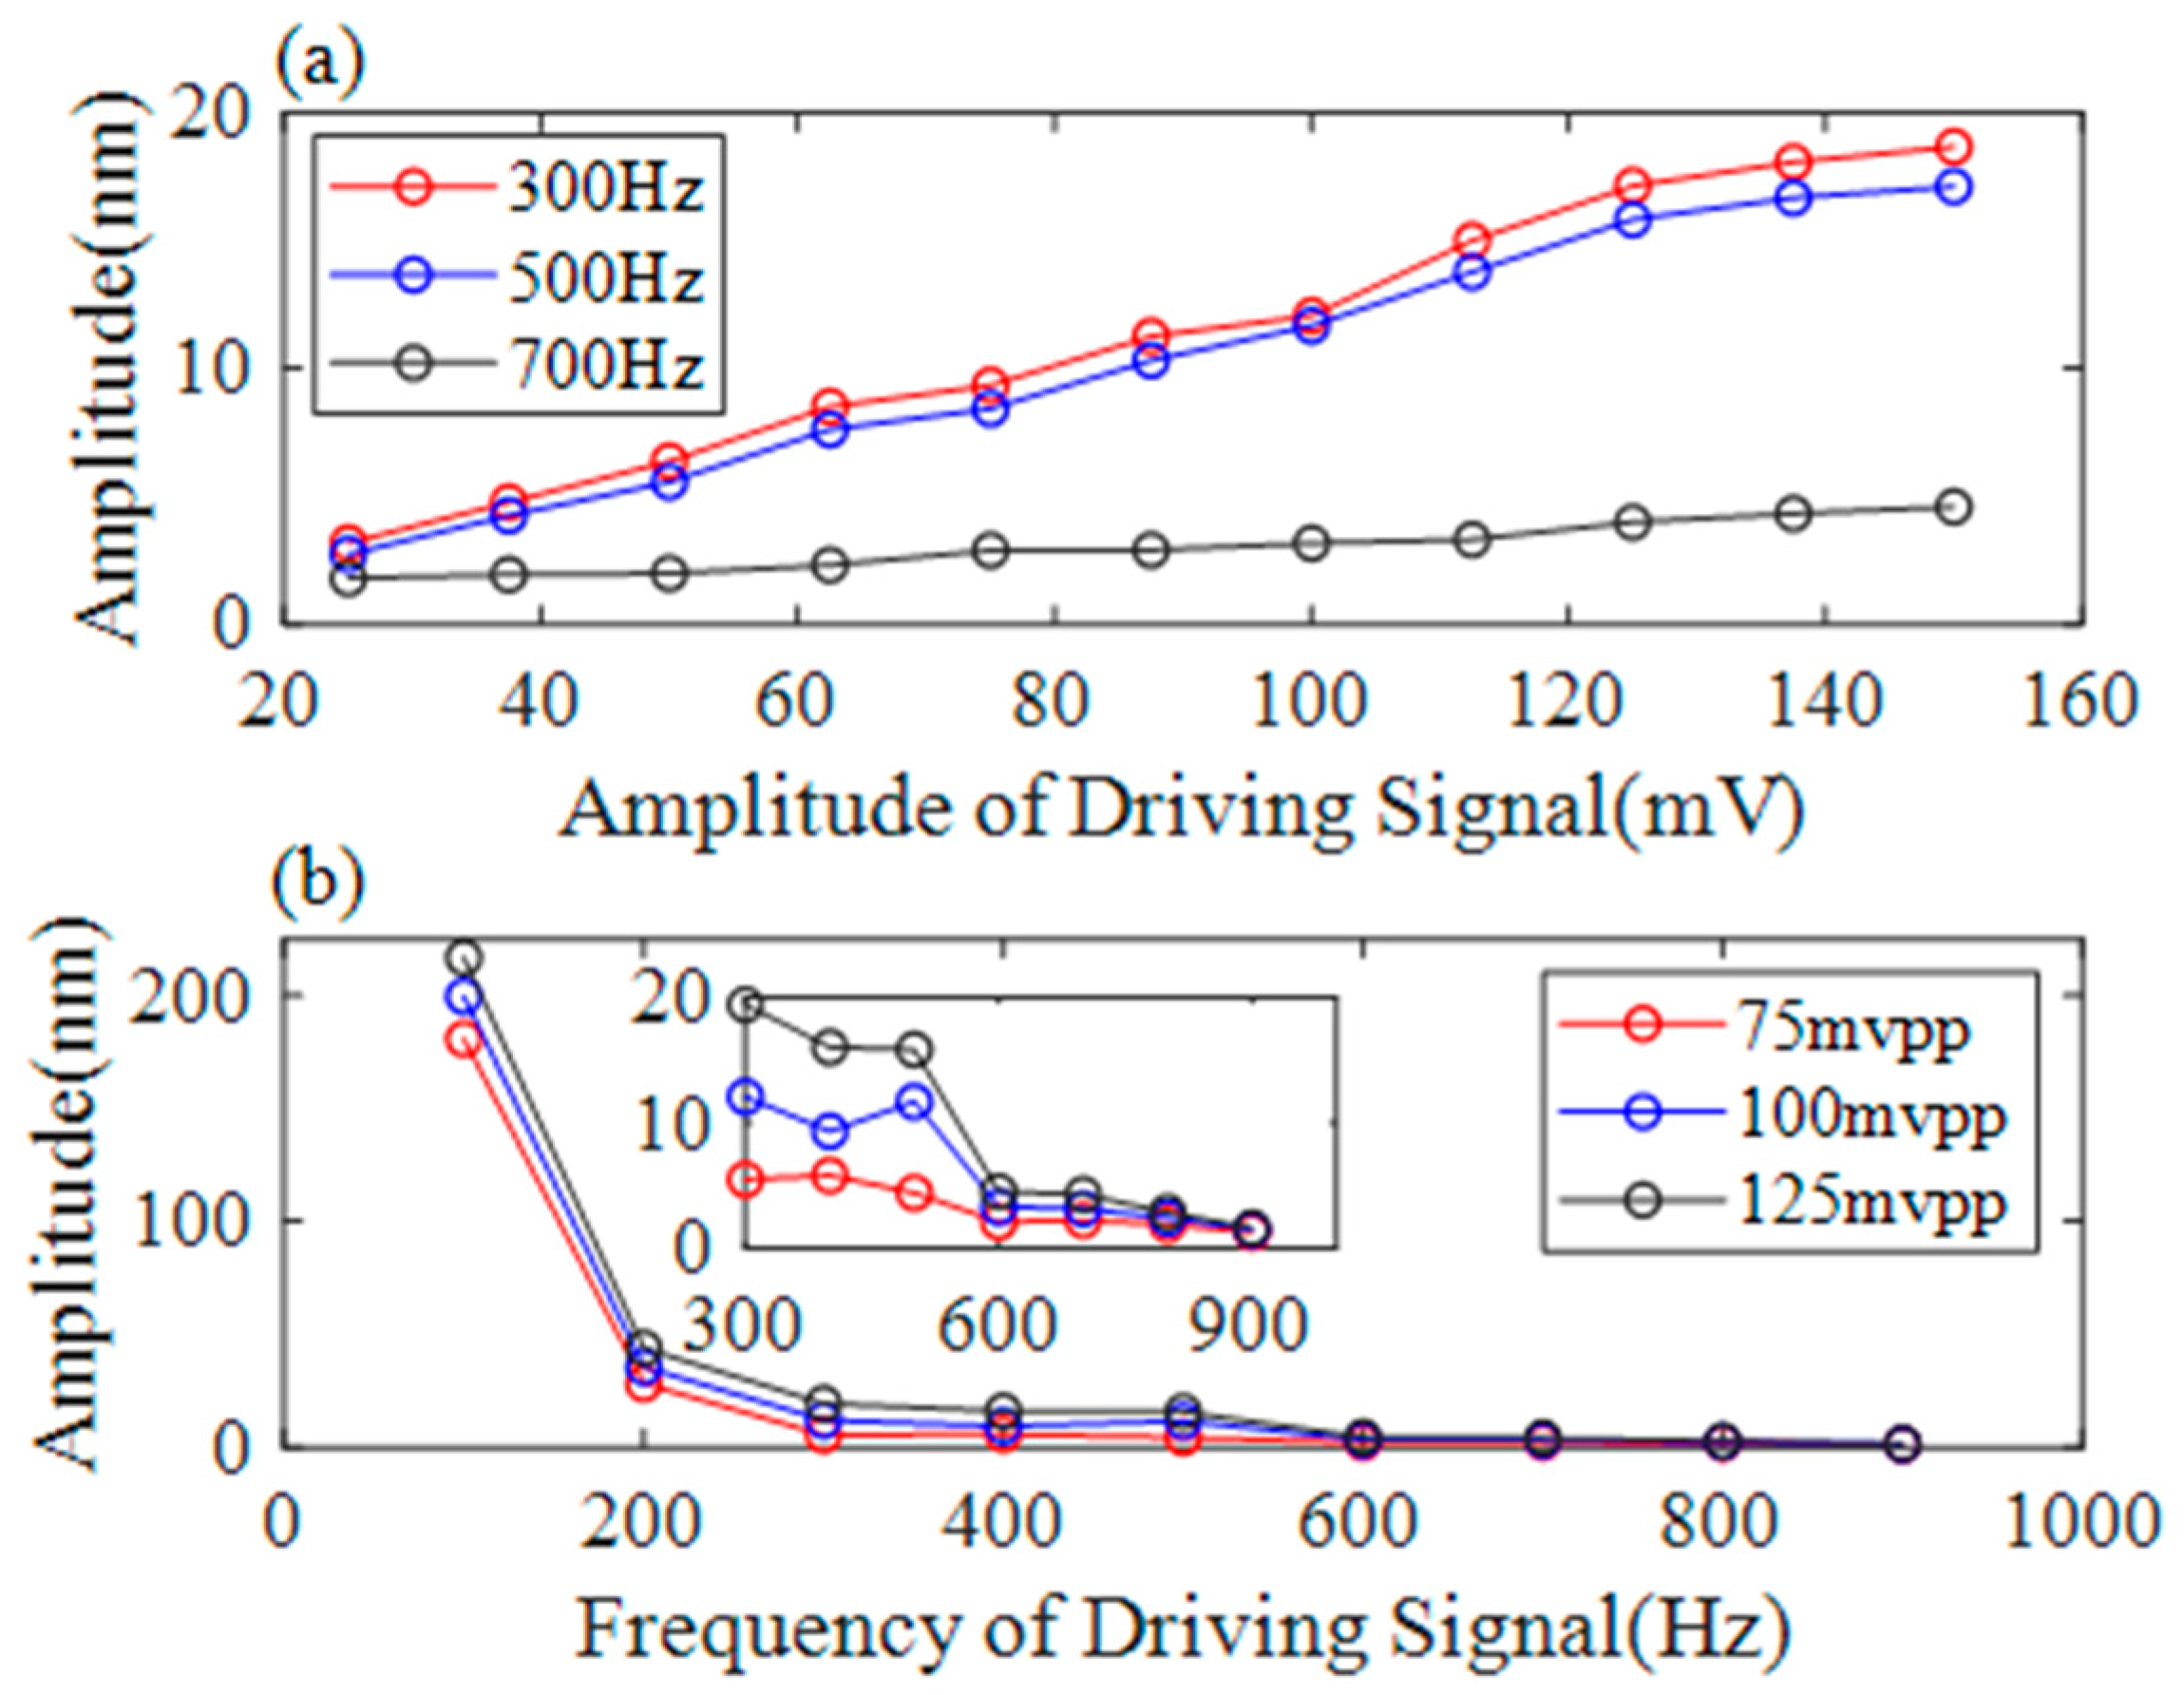
In order to further prove that proposed demodulation algorithm and the experimental system described in this paper can accurately demodulate amplitude information of water surface acoustic waves, more detection experiments for different amplitude surface waves driven by different intensity signals were carried out. The prenormalized PGC-Arctan algorithm was employed to demodulate the water surface acoustic waves. The amplitude of the driving signal and that of the water surface acoustic waves demodulated by the proposed algorithm are shown in Figure 19a. The results indicate that for the same frequency of water surface acoustic wave, the larger the driving signal amplitude (i.e., the more intense the driving signal), the larger the amplitude of the water surface acoustic waves. There is an approximate linear relationship between the amplitude of the water surface acoustic wave and the amplitude of the driving signal. In addition, detection experiments for the water surface acoustic waves were driven by different frequency sinusoidal signals at a fixed driving amplitude of 75 mVpp, 100 mVpp, and 125 mVpp, respectively. The amplitude demodulation results are shown in Figure 19b, and in this figure the amplitude of drive signal is received by the monitor of the power amplifier. It can be observed that the amplitude of the water surface acoustic waves is inversely proportional to the frequency of the driving signals; this is consistent with the theoretical mechanism of water surface acoustic waves.
The actual values of water surface acoustic wave amplitudes is difficult to obtain, but the relationship between water surface acoustic wave amplitudes and driving signal intensity shown in Figure 19a,b is in line with theoretical analysis (an expression of the relationship between the three parameters is provided in Reference [25]). This proves the accuracy and effectiveness of the sinusoidal phase modulation interferometer and the prenormalized PGC-Arctan algorithm in water surface acoustic wave detection.
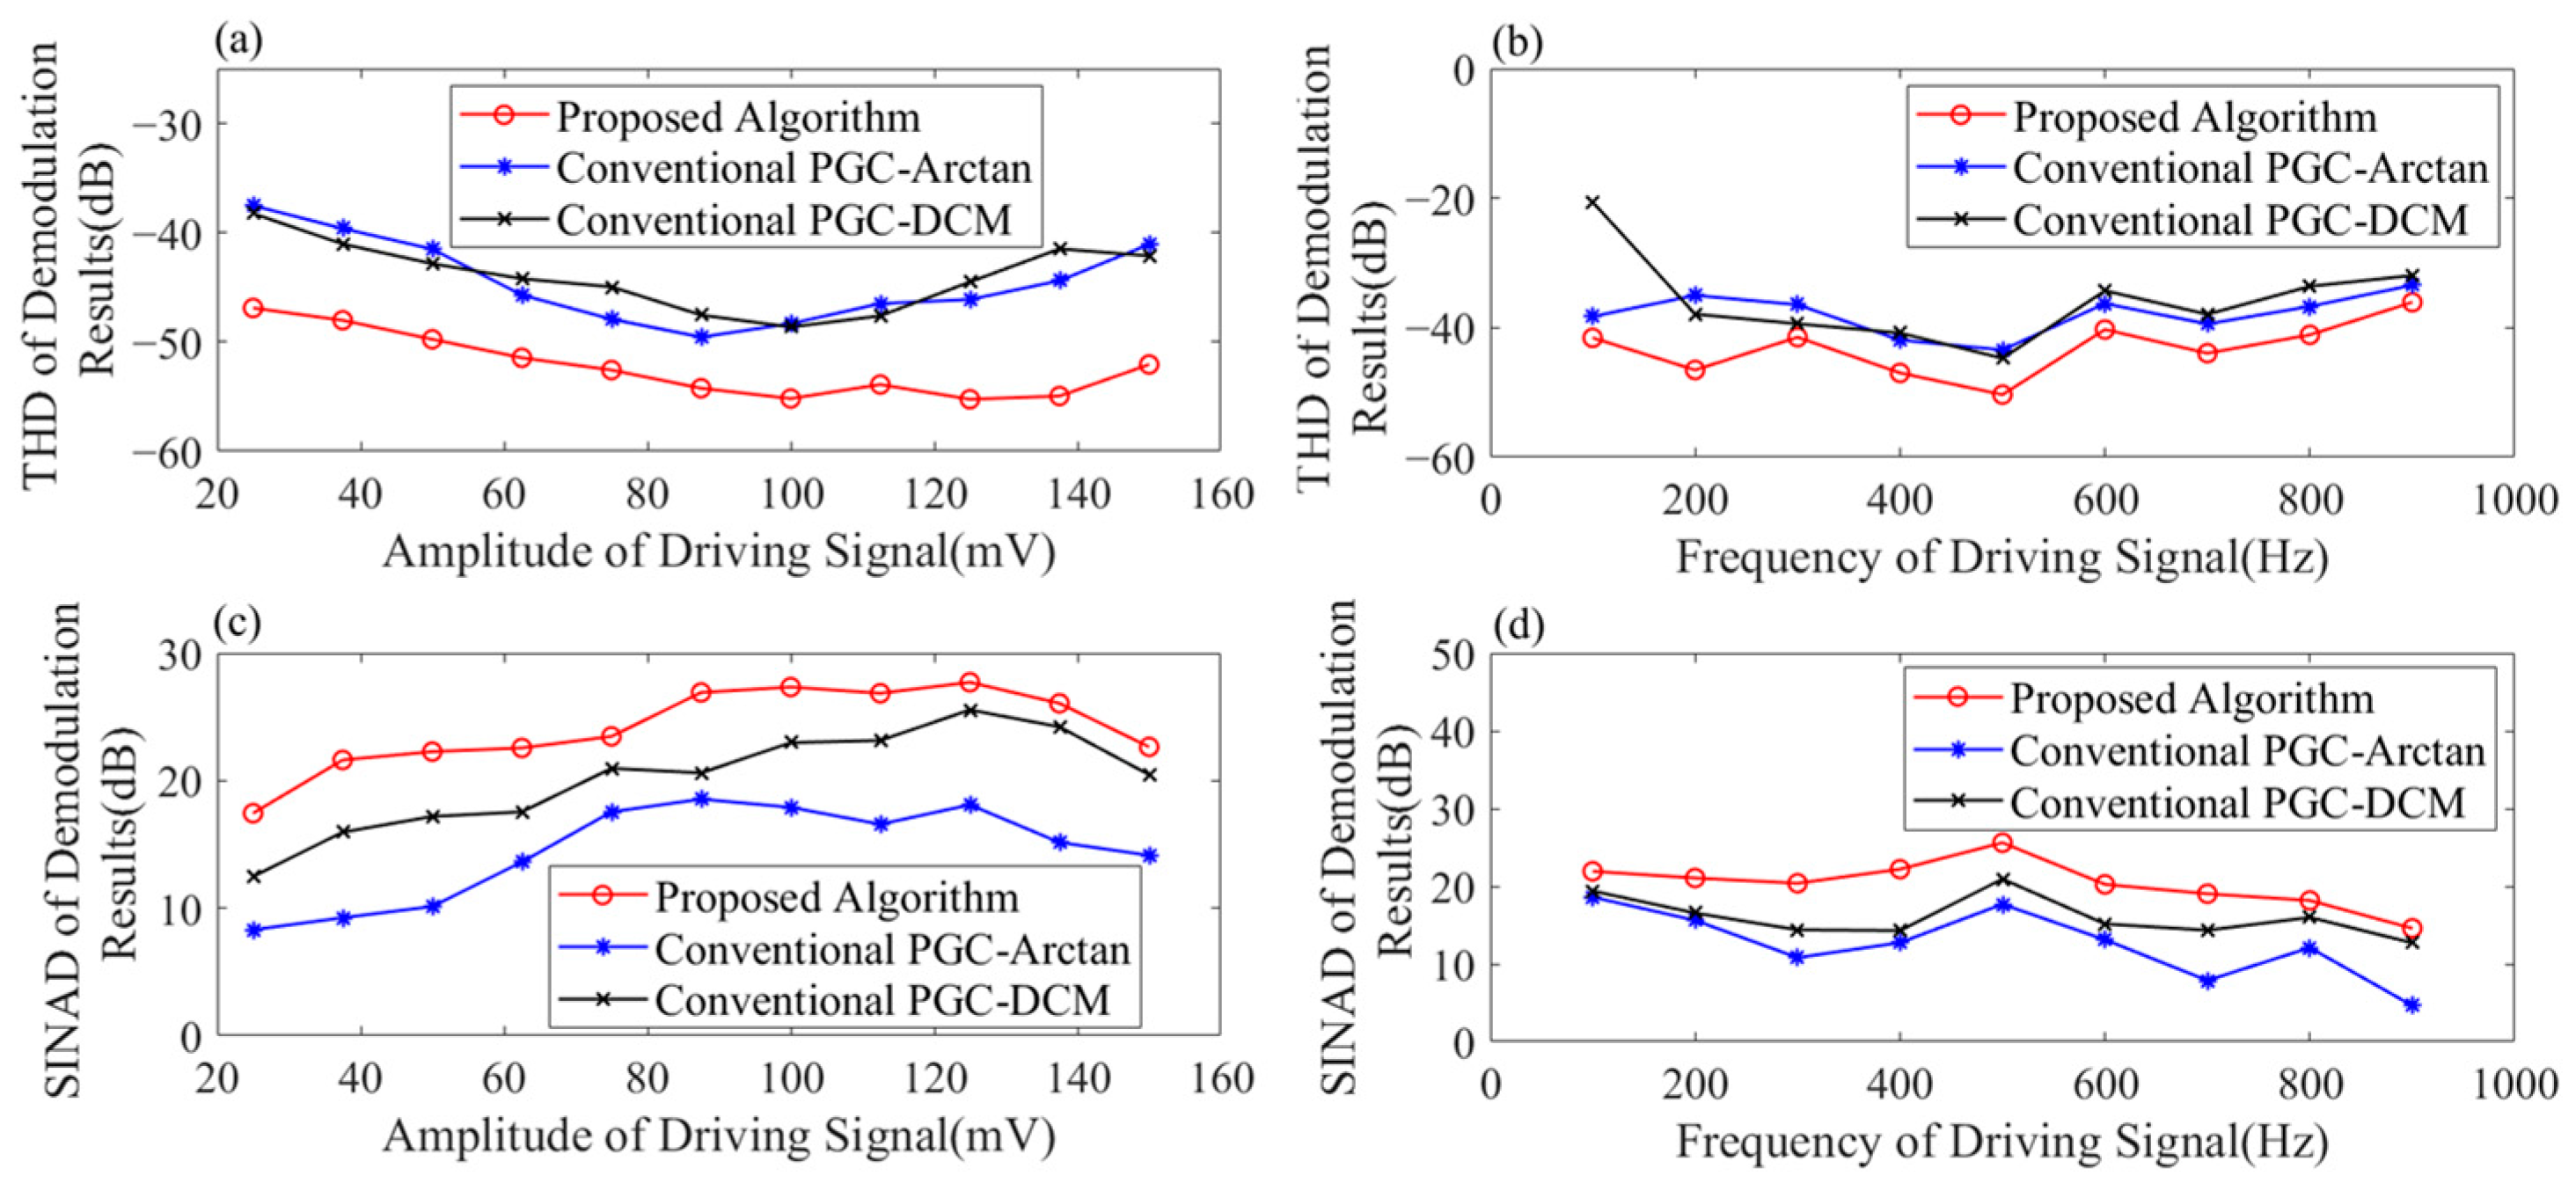
The water surface acoustic waves driven by the same frequency at 500 Hz and different amplitude signals were detected and demodulated using the conventional PGC-Arctan and PGC-DCM algorithms and the prenormalized PGC-Arctan algorithm, respectively, as well as the water surface acoustic waves driven by the same amplitude at 100 mVpp and different frequency signals. The total harmonic distortion and signal-to-noise distortion ratios of demodulation results are shown in Figure 20. In Figure 20, the total harmonic distortion of demodulation result using the prenormalized PGC-Arctan algorithm is lower than using the conventional PGC-Arctan and PGC-DCM algorithms, but the signal-to-noise ratio using the proposed algorithm is higher than using the other two algorithms, which further proves the better demodulation performance of the proposed demodulation algorithm.

5.3. Amplitude Modulated Water Surface Acoustic Wave Detection Experiment

In order to further prove that the prenormalized PGC-Arctan algorithm and the experimental system described in this paper are capable of accurately acquiring vibration information of water surface acoustic waves, an amplitude modulated water surface acoustic wave detection experiment was conducted. In the experiment, an amplitude modulated signal with an 80% modulation depth was used to drive the electroacoustic transducer to produce amplitude modulated acoustic waves. The fundamental frequency of this drive signal is 500 Hz, and the amplitude modulation frequency is 3 Hz. The experiment system shown in Figure 13 was used to detect the water surface acoustic waves, and the interference signal was demodulated, respectively, using the conventional PGC-Arctan and PGC-DCM algorithms and the prenormalized PGC-Arctan algorithm. The demodulation results are shown in Figure 21.
Similarly, from Figure 21c, it can be observed that, due to factors such as interference signal visibility variation and phase modulation depth variation, the traditional PGC-Arctan algorithm exhibits noticeable local noise. Figure 21e reveals that the traditional PGC-DCM algorithm is unable to demodulate the intensity information of water surface acoustic waves due to the drastic changes in the interference signal visibility. By contrast, in Figure 21a, the prenormalized PGC-Arctan algorithm demonstrates the capability to stably demodulate the intensity information of water surface acoustic waves. Furthermore, Figure 21b indicates that the signal’s primary frequency is 500 Hz, with all sideband components exhibiting a frequency shift of 3Hz, which is consistent with the experimental setup. In summary, the proposed prenormalized PGC-Arctan algorithm can accurately demodulate water surface acoustic waves.

6. Conclusions

In this paper, we investigated a method for detecting water surface acoustic waves induced by underwater acoustic radiation. The method utilizes a sinusoidal phase modulation interferometer combined with an improved PGC-Arctan demodulation algorithm to measure weak water surface acoustic waves. The research delved into the principles and characteristics of using a sinusoidal phase modulation laser interferometer to detect water surface acoustic waves. It analyzed the influence of variations in parameters such as signal visibility and phase modulation depth on the demodulation of interference signals from a Lissajous ellipse perspective. On this basis, a new PGC-Arctan demodulation algorithm combining prenormalization and Lissajous ellipse fitting was proposed. Experimental detection of water surface acoustic waves induced by underwater acoustic radiation was conducted under laboratory conditions. In summary, the main conclusions of this study are as follows:
(1)
Due to the nonideality on interferometric signal parameters, such as the gain difference between two low-pass filters and the nonideal phase modulation depth, the Lissajous figure generated by an actual interferometric detection signal of water surface acoustic waves may not be a normal circle or ellipse, but, rather, an ellipse with unequal major and minor axes. The fluctuation of the depth of phase modulation causes local nonuniform widening of the Lissajous ellipse. Changes in interference signal visibility lead to uniform widening of the Lissajous ellipse; consequently, the inner and outer envelope ellipses of the Lissajous figure have the same axial ratio.
(2)
The proposed demodulation algorithm utilizes the intensity information in multiple spectral bands of interference signals to calculate the phase modulation depth C. By introducing quadrature carrier signals, it achieves estimation of the carrier phase delay Vc. Furthermore, the algorithm constructs coefficients J1(C)cos(Vc) and J2(C)cos(2Vc) for prenormalization of quadrature interference signal components. This method effectively eliminates the phenomenon of local nonuniform or abnormal widening of the Lissajous ellipse. By extracting and fitting the outer contour ellipse and inner contour ellipse of a Lissajous figure, the axial ratio is obtained. Numerical simulation results demonstrate that using this ratio for completely normalizing quadrature interference signals effectively eliminates nonlinear errors caused by different filter gain factors in arctan phase demodulation.
(3)
Utilizing a sinusoidal phase modulation laser interferometer and the proposed demodulation algorithm, experiments were conducted to detect multiple sets of water surface acoustic waves induced by underwater acoustic radiation. The typical value of signal-to-noise distortion ratio of the demodulation results can reach 20 dB at 500 Hz. The experimental results demonstrate that the proposed method and system can effectively and accurately measure weak water surface acoustic waves. The prenormalized PGC-Arctan demodulation algorithm proposed in this paper exhibits significant advantages in signal-to-noise distortion ratio compared to traditional demodulation algorithms, and shows the benefit of combined use of prenormalization and Lissajous ellipse fitting for demodulation.

Author Contributions

Methodology, conceptualization, L.Z. and X.L.; software, W.F. and L.Y.; data curation, investigation, W.F. and J.C.; writing—original draft, L.Z. and W.F.; writing—review and editing, X.L. and L.Y. All authors have read and agreed to the published version of the manuscript.

Funding

This research was funded by the National Natural Science Foundation of China, through Grant Nos. 62271449 and the Natural Science Foundation of Zhejiang Province through Grant Nos. LGF21F050004.

Data Availability Statement

The data presented in this study are available in article.

Conflicts of Interest

The authors declare no conflicts of interest.

References

  1. Zhang, L.; Zhang, X.; Tang, W. Amplitude measurement of weak sinusoidal water surface acoustic wave using laser interferometer. Chin. Opt. Lett. 2015, 13, 091202. [Google Scholar] [CrossRef]
  2. Romero, M.R.; Narayanan, R.M.; Lenzing, E.H.; Brown, D.C.; Greenert, K.L. Wireless underwater-to-air communications via water surface modulation and radar detection. Proc. SPIE 2020, 11408, 58–71. [Google Scholar]
  3. Shaydurov, G.Y.; Luk’Yanchikov, V.N.; Romanova, G.N. On the Ultrasonic Parametric Modulation of an Eletromagnetic Wave at the Boundary between Water and Air. Sov. J. Commun. Technol. Electron. 1986, 31, 54–60. [Google Scholar]
  4. Churnside, J.H.; Bravo, H.E.; Naugolnykh, K.A.; Fuks, I.M. Effects of underwater sound and surface ripples on scattered laser light. Acoust. Phys. 2008, 54, 204–209. [Google Scholar] [CrossRef]
  5. Zhang, X.; Mao, H.; Tang, W. Demodulation technique based on laser interference for weak photo-acoustic signals on water surface. Appl. Sci. 2018, 8, 2423. [Google Scholar] [CrossRef]
  6. Land, P.; Roeder, J.; Robinson, D.; Majumdar, A. Application of a laser Doppler vibrometer for air-water to subsurface signature detection. Proc. SPIE 2015, 9461, 478–490. [Google Scholar]
  7. Land, P.; Majumdar, A.K. Demonstration of adaptive optics for mitigating laser propagation through a random air-water interface. Proc. SPIE 2016, 9827, 14–21. [Google Scholar]
  8. Blackmon, F.; Antonelli, L.T. Acousto-optic Comm Links Underwater and In-air Platforms: Developing a Laser-based Technology to Allow a Unique Means of Communication Across Air-water Boundary Lines. Sea Technol. 2004, 45, 58–66. [Google Scholar]
  9. Wang, Y.M.; Miao, R.C. The asymmetric distribution of diffraction field with different frequencies of underwater acoustic signal. Optik 2016, 126, 5886–5889. [Google Scholar] [CrossRef]
  10. Miao, R.; Wang, Y.; Meng, F.; Ma, J. Optical measurement of the liquid surface wave amplitude with different intensities of underwater acoustic signal. Opt. Commun. 2014, 313, 285–289. [Google Scholar] [CrossRef]
  11. Ren, Y.; Miao, R.; Su, X.; Chen, H. Visualizing detecting low-frequency underwater acoustic signals by means of optical diffraction. Appl. Opt. 2016, 55, 2018–2023. [Google Scholar] [CrossRef]
  12. Antonelli, L.; Blackmon, F. Experimental demonstration of remote, passive acousto-optic sensing. J. Acoust. Soc. Am. 2004, 116, 3393–3403. [Google Scholar] [CrossRef]
  13. Blackmon, F.; Antonelli, L.T. Opto-acoustic Downlink Underwater Communication –Remote, Aerial, Trans-layer Communications –A Revolutionary Enabling Capability. Sea Technol. 2007, 48, 31–35. [Google Scholar]
  14. Blackmon, F.; Estes, L.; Fain, G. Linear Optoacoustic Underwater Communication. Appl. Opt. 2005, 44, 3833–3845. [Google Scholar] [CrossRef]
  15. Farrant, D.; Burke, J.; Dickinson, L.; Fairman, P.; Wendoloski, J. Opto-acoustic underwater remote sensing (OAURS)—An optical sonar? In Proceedings of the OCEANS’10 IEEE SYDNEY, Sydney, Australia, 24–27 May 2010; pp. 1–7. [Google Scholar]
  16. Zhao, L.; Zhang, J. Expanding research on laser coherent detection of underwater sound source. Optik 2017, 139, 145–151. [Google Scholar] [CrossRef]
  17. Zhang, L.S.; Zhang, X.L.; Tang, W.Y. Detection of water surface capillary wave by analysis of turning-point local signal data using a laser interferometer. Chin. Opt. Lett. 2017, 15, 071201. [Google Scholar] [CrossRef]
  18. Christian, T.R.; Frank, P.A.; Houston, B.H. Real-time analog and digital demodulator for interferometric fiber optic sensors. Proc. SPIE 1994, 2191, 324–336. [Google Scholar]
  19. Dandridge, A.; Tveten, A.; Giallorenzi, T. Homodyne demodulation Scheme for fiber optic sensors using phase generated carrier. IEEE J. Quantum Electron. 1982, 18, 1647–1653. [Google Scholar] [CrossRef]
  20. Zhang, S.; Zhang, A.L.; Pan, H.G. Eliminating light intensity disturbance with reference compensation in interferometer. IEEE Photonics Technol. Lett. 2015, 27, 1888–1891. [Google Scholar] [CrossRef]
  21. Zhang, A.; Li, D. Interferometric sensor with a PGC-AD-DSM demodulation algorithm insensitive to phase modulation depth and light intensity disturbance. Appl. Opt. 2018, 57, 7950–7955. [Google Scholar] [CrossRef] [PubMed]
  22. He, J.; Wang, L.; Li, F.; Liu, Y. An ameliorated phase generated carrier demodulation algorithm with low harmonic distortion and high stability. J. Light. Technol. 2010, 28, 3258–3265. [Google Scholar]
  23. Yu, Z.; Dai, H.; Zhang, M.; Zhang, J.; Liu, L.; Jin, X.; Luo, Y. High stability and low harmonic distortion PGC demodulation technique for interferometric optical fiber sensors. Opt. Laser Technol. 2019, 109, 8–13. [Google Scholar] [CrossRef]
  24. Qu, Z.; Guo, S.; Hou, C.; Yang, J.; Yuan, L. Real-time self-calibration PGC-Arctan demodulation algorithm in fiber-optic interferometric sensors. Opt. Express 2019, 27, 23593–23609. [Google Scholar] [CrossRef] [PubMed]
  25. Zhang, L.; Kong, W.; Wang, M.; Li, R.; Wang, Y. An interferometric vibrometer using phase carrier generated by liquid surface acoustic waves and an improved phase demodulation scheme. Opt. Commun. 2021, 495, 127114. [Google Scholar] [CrossRef]
Figure 1. Typical SPMI detection optical path scheme.
Photonics 11 00200 g001
Figure 2. (a) The changes in the values of the Bessel functions. (bd) Effect of different phase modulation depths on the Lissajous figure. (b) C = 1.2 + 0.1 sin(0.2t) rad; (c) C = 2.3 + 0.1 sin(0.2t) rad; (d) C = 3.1 + 0.1 sin(0.2t) rad.
Photonics 11 00200 g002
Figure 3. The flowchart of phase modulation depth estimation algorithm (PMDEA).
Photonics 11 00200 g003
Figure 4. The flowchart carrier phase delay estimation algorithm (CPDEA).
Photonics 11 00200 g004
Figure 5. Effect of signal-visibility-related coefficient on the width of elliptic ring. (a) B0 = 0.5; (b) B0 = 0.5 + 0.1 sin(20πt).
Photonics 11 00200 g005
Figure 6. The flowchart of PGC-Arctan demodulation algorithm based on prenormalization and Lissajous ellipse fitting.
Photonics 11 00200 g006
Figure 7. (a) Simulated interference signal in time domain. (b) Simulated interference signal in frequency domain.
Photonics 11 00200 g007
Figure 8. Calculation results of phase modulation depth in simulation.
Photonics 11 00200 g008
Figure 9. (a) Lissajous figure before prenormalization; (b) Lissajous figure after prenormalization and ellipse fitting results.
Photonics 11 00200 g009
Figure 10. (a) Phase difference of the simulated water surface acoustic waves in time domain. (b) Phase difference of the simulated water surface acoustic waves in frequency domain.
Photonics 11 00200 g010
Figure 11. Comparison of demodulation results of three algorithms.
Photonics 11 00200 g011
Figure 12. Schematic diagram of the experimental setup.
Photonics 11 00200 g012
Figure 13. Experimental setup.
Photonics 11 00200 g013
Figure 14. (a) Experimental interference signal of stable-frequency and stable-amplitude water surface acoustic wave detection experiment in time domain. (b) Experimental interference signal of stable-frequency and stable-amplitude water surface acoustic wave detection experiment in frequency domain.
Photonics 11 00200 g014
Figure 15. Variations of phase modulation depth in stable-frequency and stable-amplitude water surface acoustic wave detection experiment.
Photonics 11 00200 g015
Figure 16. (a) Lissajous figure before prenormalization; (b) Lissajous figure after prenormalization and ellipse fitting results.
Photonics 11 00200 g016
Figure 17. Demodulation results of stable-frequency and stable-amplitude water surface acoustic wave detection experiment signals. (a) Time-domain distribution of demodulation results using the prenormalized PGC-Arctan algorithm. (b) Frequency-domain distribution of demodulation results using the prenormalized PGC-Arctan algorithm. (c) Time-domain distribution of demodulation results using the conventional PGC-Arctan algorithm. (d) Frequency-domain distribution of demodulation results using the conventional PGC-Arctan algorithm. (e) Time-domain distribution of demodulation results using the conventional PGC-DCM algorithm. (f) Frequency-domain distribution of demodulation results using the conventional PGC-DCM algorithm.
Photonics 11 00200 g017
Figure 18. Demodulation performance comparison of 3 different algorithms when modulation depth C changes: (a) THD values; (b) SINAD values.
Photonics 11 00200 g018
Figure 19. (a) Amplitude measurement results of water surface acoustic waves with the same frequency but different sound intensities. (b) Amplitude measurement results of water surface acoustic waves with the same sound intensity but different frequencies.
Photonics 11 00200 g019
Figure 20. (a) The total harmonic distortion of demodulation results for water surface acoustic waves at the same frequency but different sound intensities. (b) The total harmonic distortion of demodulation results for water surface acoustic waves at the same sound intensity but different frequencies. (c) The signal-to-noise distortion ratios of demodulation results for water surface acoustic waves at the same frequency but different sound intensities. (d) The signal-to-noise distortion ratios of demodulation results for water surface acoustic waves at the same sound intensity but different frequencies.
Photonics 11 00200 g020
Figure 21. Demodulation results of amplitude modulation water surface acoustic wave detection experiment. (a) Time-domain distribution of demodulation results of the prenormalized PGC-Arctan algorithm. (b) Frequency-domain distribution of demodulation results of the prenormalized PGC-Arctan algorithm. (c) Time-domain distribution of demodulation results of traditional PGC- Arctan algorithm. (d) Frequency-domain distribution of demodulation results of traditional PGC- Arctan algorithm. (e) Time-domain distribution of demodulation results of traditional PGC-DCM algorithm. (f) Frequency-domain distribution of demodulation results of traditional PGC-DCM algorithm.
Photonics 11 00200 g021
Table 1. Main simulation parameters.
No.ParameterValue
1fs1,000,000 Hz
2Ωc60,000π rad
3k0.0099 rad/nm
4C1.5 + 0.1sin(0.2πt) rad
5Vc0.4π rad
6B01.5 + 0.1sin(20πt)
7Cs200k rad
8Ωs400π rad
9φs0.35 rad
10Ce4000k rad
11Ωe2π rad
12L00.25π rad
Disclaimer/Publisher’s Note: The statements, opinions and data contained in all publications are solely those of the individual author(s) and contributor(s) and not of MDPI and/or the editor(s). MDPI and/or the editor(s) disclaim responsibility for any injury to people or property resulting from any ideas, methods, instructions or products referred to in the content.