Article

Speckle Reduction in Digital Holography by Fast Logistic Adaptive Non-Local Means Filtering

1
Key Laboratory of Information and Communication Systems, Ministry of Information Industry, Beijing Information Science and Technology University, Beijing 100101, China
2
Key Laboratory of the Ministry of Education for Optoelectronic Measurement Technology and Instrument, Beijing Information Science and Technology University, Beijing 100101, China
3
School of Information and Communications Engineering, Beijing Information Science and Technology University, Beijing 100101, China
*
Author to whom correspondence should be addressed.
Photonics 2024, 11(2), 147; https://doi.org/10.3390/photonics11020147
Submission received: 10 January 2024 / Revised: 28 January 2024 / Accepted: 29 January 2024 / Published: 4 February 2024

Abstract

:
Digital holography is a promising imaging technology. However, there is speckle noise in the reconstructed image of a digital hologram. Speckle degrades the quality of the reconstructed image. Suppression of speckle noise is a challenging problem in digital holography. A novel method is proposed to reduce speckle by a fast logistic adaptive non-local means (LA-NLM) algorithm. In the proposed method, the logistic function is incorporated into the weight calculation of the NLM algorithm to account for multiplicative speckle noise. Filtering parameters are dynamically adjusted according to the statistical property of speckle in the reconstructed image. To enhance computational efficiency, the proposed algorithm takes advantage of the integral image technique to speed up the calculation of the similarity between image patches. Simulated and experimental digital holograms are obtained to verify the proposed method. The results show that the speckle noise is effectively suppressed in digital holography. The proposed method is efficient and feasible, and can be applied to such fields as three-dimensional display, holographic measurement, and medical diagnosis.

1. Introduction

Digital holography is a three-dimensional (3D) imaging technology [1] that uses a charge-coupled device (CCD) or complementary metal–oxide–semiconductor (CMOS) to record the amplitude and phase of an object, and realizes digital reconstruction by computer simulation. It is widely applied in such fields as microstructure measurement [2], holographic encryption [3], and optical metrology [4]. However, a laser is generally used as the light source in digital holography. Due to the high coherence of the laser and the rough surfaces of the object, the scattered light is superimposed on the holographic plane to form speckle noise [5]. Speckle degrades the contrast and resolution of the reconstructed image [6], affecting the application of digital holography [2,3,4]. In order to suppress the speckle, numerous methods have been proposed over the years.
In optical methods, multi-look digital holography [7,8] has been brought forward to reduce speckle noise. The method realizes speckle reduction by averaging multiple reconstructed images of holograms with different speckle patterns. Holograms with different speckle patterns are obtained by polarization diversification [9], angle diversification [10], wavelength diversification [7], etc. This kind of method needs supplemental optical equipment, and the recording process consumes a lot of time. Hincapie et al. proposed a single-shot speckle reduction method to overcome the shortcoming of the above-mentioned method [11]. The method averaged multiple sub-reconstructed images with uncorrelated speckle patterns to suppress the speckle, and sub-holograms were generated by a dynamic binary mask. Fukuoka et al. proposed to use a spatial mask to obtain a lot of sub-holograms to enhance the effect of speckle reduction in the single-shot method [12]. However, the effect of removing speckle noise by these methods is not ideal due to the limited numerical aperture resulting from the mask size.
It is noteworthy that many digital image processing techniques have been presented to reduce noise [13,14,15,16,17,18,19,20,21,22,23]. The non-local means (NLM) algorithm [16,17,18,19,20,21,22] and block-matching and 3D (BM3D) algorithm [23] stand as the-state-of-the-art denoising methods. These approaches harness a large amount of redundant information in the image to reduce noise, and they were initially designed for suppressing additive noise. However, the speckle of the reconstructed image in digital holography is a typical multiplicative noise [24]. Therefore, these methods are not the optimal choice for speckle noise.
In this paper, a fast logistic adaptive non-local means (LA-NLM) algorithm is proposed to remove speckle noise in digital holography. First, the logistic function [25] is integrated into the weight calculation of the NLM algorithm for multiplicative speckle noise. Then, according to the statistical value of speckle in the reconstructed image, the proposed algorithm dynamically and adaptively adjusts the filtering parameters. In addition, the integral image technique [26,27] is utilized in the process of similarity evaluation between image patches in order to reduce the running time.
The remainder of this paper is organized as follows. In Section 2, the principle of critical techniques is expounded. Simulation experiments are described in Section 3. The parameters of the proposed algorithm are discussed in detail, and the optimal value is suggested. In Section 4, optical experiments are introduced, and experimental results are analyzed and compared with other denoising methods. The feasibility and effectiveness of the proposed algorithm are further verified. Finally, conclusions are made in Section 5.

2. Principle

2.1. Non-Local Means Algorithm

The NLM algorithm is based on the concept that any noisy pixel located in the center of an image patch may be denoised by utilizing other patches with similar structures in the image [17]. To decrease the operating time, a large search window is generally employed to replace the whole image by searching similar patches. Figure 1 illustrates the scheme of the NLM. The central pixel p of the square patch N(p) is to be denoised. The patch N(p) (ds × ds pixels) is referred to as the window of interest. The area enclosed by the bold white line is the search window Ω (Ds × Ds pixels). The denoised value of the pixel p is determined by a weighted average of surrounding patches N(qn) in the search window. The weight is based on the similarity between the similar window N(qn) and N(p). The patch N(qn) is the same size as N(p). The more similar N(qn) is to N(p), the higher the weight that can be obtained.
The denoised value v(p) of pixel point p is calculated as follows:
v ( p ) = q n Ω w ( p , q n ) v ( q n )
where w(p, qn) is the weight of the pixels in the similar window N(qn) centered around qn, and v(qn) is the gray value of pixel qn. The weight is defined as the following:
w ( p , q n ) = 1 Z ( p ) exp [ N ( p ) N ( q n ) 2 , a 2 h 2 ] ,
where Z(p) is the following:
Z ( p ) = q n Ω exp N ( p ) N ( q n ) 2 , a 2 h 2 .
The parameter Z(p) is the normalized coefficient to make sure that the sum of the weights is 1, and h is the smoothing parameter that controls the strength of the noise reduction. The expression N ( p ) N ( q n ) 2 , a 2 represents the gray-level Euclidean distance between the window of interest N(p) and the similar window N(qn), convolved with a Gaussian kernel with the parameter a. And a is the standard deviation of the Gaussian kernel.
The Gaussian kernel is often dropped, and the Euclidean distance between patches becomes in the discrete case the mean square error [27]:
N ( p ) N ( q n ) 2 2 = 1 d s 2 t 1 = d s 2 d s 2 t 2 = d s 2 d s 2 v ( i 1 + t 1 , j 1 + t 2 ) v ( i 1 + t 1 , j 1 + t 2 ) 2 2 ,
where p is located at (i1, j1) and qn is located at (i1, j1).

2.2. Integral Image

The integral image can compute the sum of the pixel’s value in a rectangular subset of an image so efficiently that it greatly reduces the computational amount of the algorithm and accelerates the running speed in image processing. The integral image I at location (i, j) contains the sum of the pixels above and to the left of i, j [26]:
I ( i , j ) = 0 i n i , 0 j n j v ( i n , j n )
where v(in, jn) is the pixel value at location (in, jn) in the original image, and in, jn are the Cartesian coordinates of the pixel in the image.
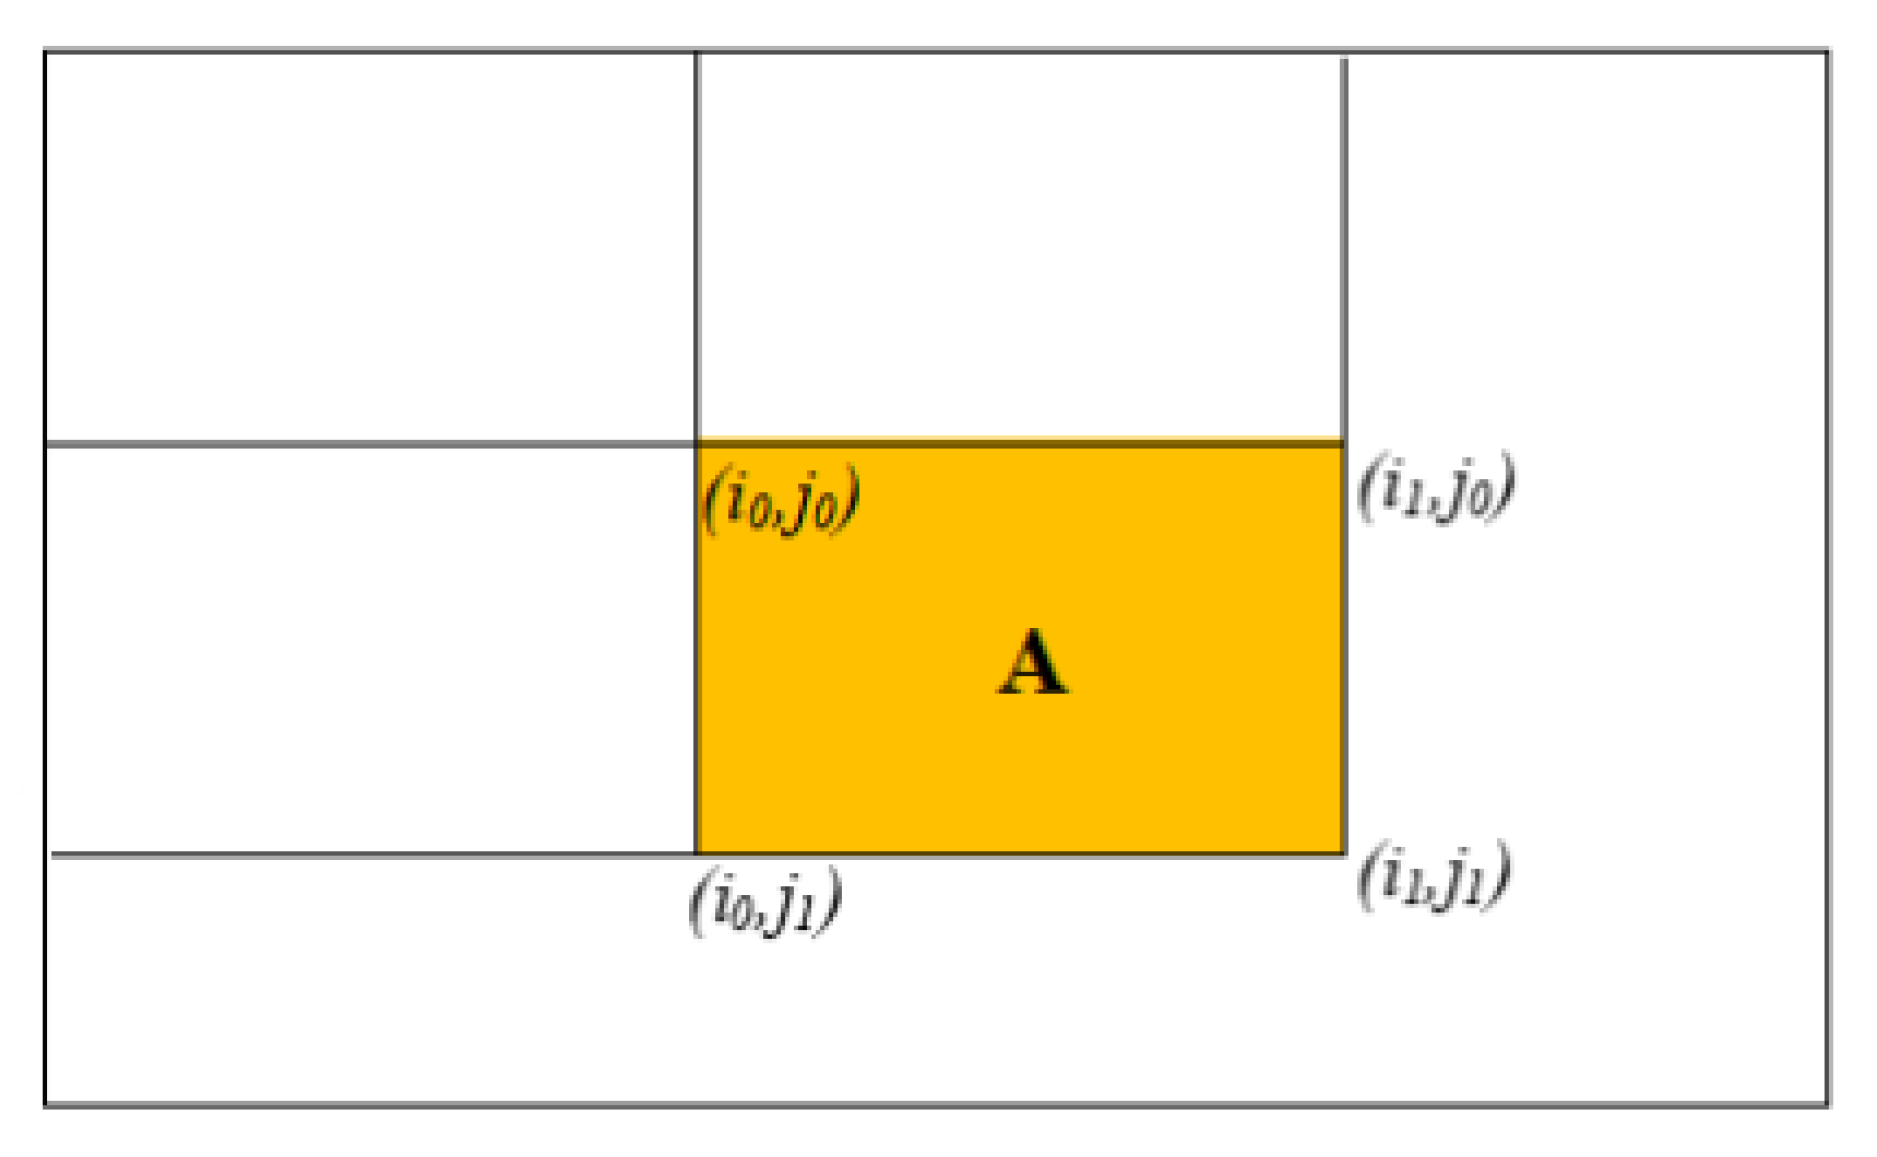
Using the integral image, the sum of any rectangular area can be computed in four array references. As shown in Figure 2, the sum of the pixels within rectangle A can be computed with four array references [I (i1, j1), I (i1, j0), I (i0, j1), and I (i0, j0)], and then the following calculations can be performed:
S ( A ) = I ( i 1 , j 1 ) + I ( i 0 , j 0 ) I ( i 1 , j 0 ) I ( i 0 , j 1 ) .
The integral image is introduced into the proposed algorithm in this paper. The integral image about pixel difference is constructed:
S t ( i , j ) = i n i , j n j v ( i n , j n ) v ( i n + t 1 , j n + t 2 ) 2 2 ,
where ‖v(in, jn) − v(in + t′1, jn + t2)‖2 represents the Euclidean distance between two pixels. The integral image St at location (i, j) contains the sum of the distances above and to the left of i, j; t1 and t2 range from −Ds/2 to Ds/2.
Thus, the Euclidean distance d (p, qn) between patches N(p) and N(qn) is calculated as follows:
d ( p , q n ) = N ( p ) N ( q n ) 2 2 = 1 d s 2 [ S t ( i + d s 2 , j + d s 2 ) + S t ( i d s 2 1 , j d s 2 1 ) S t ( i + d s 2 , j d s 2 1 ) S t ( i d s 2 1 , j + d s 2 ) ] .
That is to say, in Equation (2), N ( p ) N ( q n ) 2 , a 2 can be represented by d (p, qn).
In the NLM algorithm, it is assumed that the denoised image has a total of Na pixels. Then the time complexity of calculating the distance between two rectangular patches is O(ds2), and the overall time complexity of the NLM algorithm is O(NaDs2ds2). By applying the above integral image, the overall time complexity of the proposed algorithm is reduced to O(NaDs2).

2.3. Adaptive Filtering

In the NLM algorithm, the parameter h acts as a degree of filtering and controls the decay of the exponential function. Additionally, h is closely related to the noise variance. In a digital hologram, the intensity of the speckle is dependent on the local signal, and it is of random variation. The variance of the noise cannot be obtained in advance. So, the parameter h is tuned to the variance of local speckle noise.
The standard deviation of local speckle noise is estimated by the median of the absolute deviations (MAD) as in [28]:
σ n p = 1 0.6745 median [ N ( p ) ] .
In this paper, the parameter h is set to be the following:
h = 10 σ n p .
Because different noise regions in the image correspond to different standard deviations, the parameter h varies, and the smoothing degree of the filter adjusts adaptively. The setting of h will be discussed in the subsequent section.

2.4. Logistic Adaptive Non-Local Means (LA-NLM) Algorithm

The logistic curve in Figure 3 is traced by the logistic function [25]:
L ( T ) = exp ( T ) 1 + exp ( T ) ,
where L represents the distribution function of an S-shaped curve. As T increases, L rises monotonically from 0 to 1. T = α + βX, with X as a stimulus or exposure variable; α determines the location of the curve on the X-axis, and β is the gradient.
The logistic function possesses desirable properties, such as the following:
  • Smooth and continuous: the logistic function is a smooth S-shaped curve, ensuring continuity, which enables it to be effectively handled.
  • Nonlinear output: the output of the logistic function is nonlinear, allowing it to capture the nonlinear relationships within the input data.
  • Saturation: the saturation of the logistic function means that, as the input becomes significantly large or small, the output tends to a finite value. This characteristic makes it insensitive to extreme noise values (excessive or insufficient interference); as in the saturation region, excessive disturbances do not lead to substantial changes in the output.
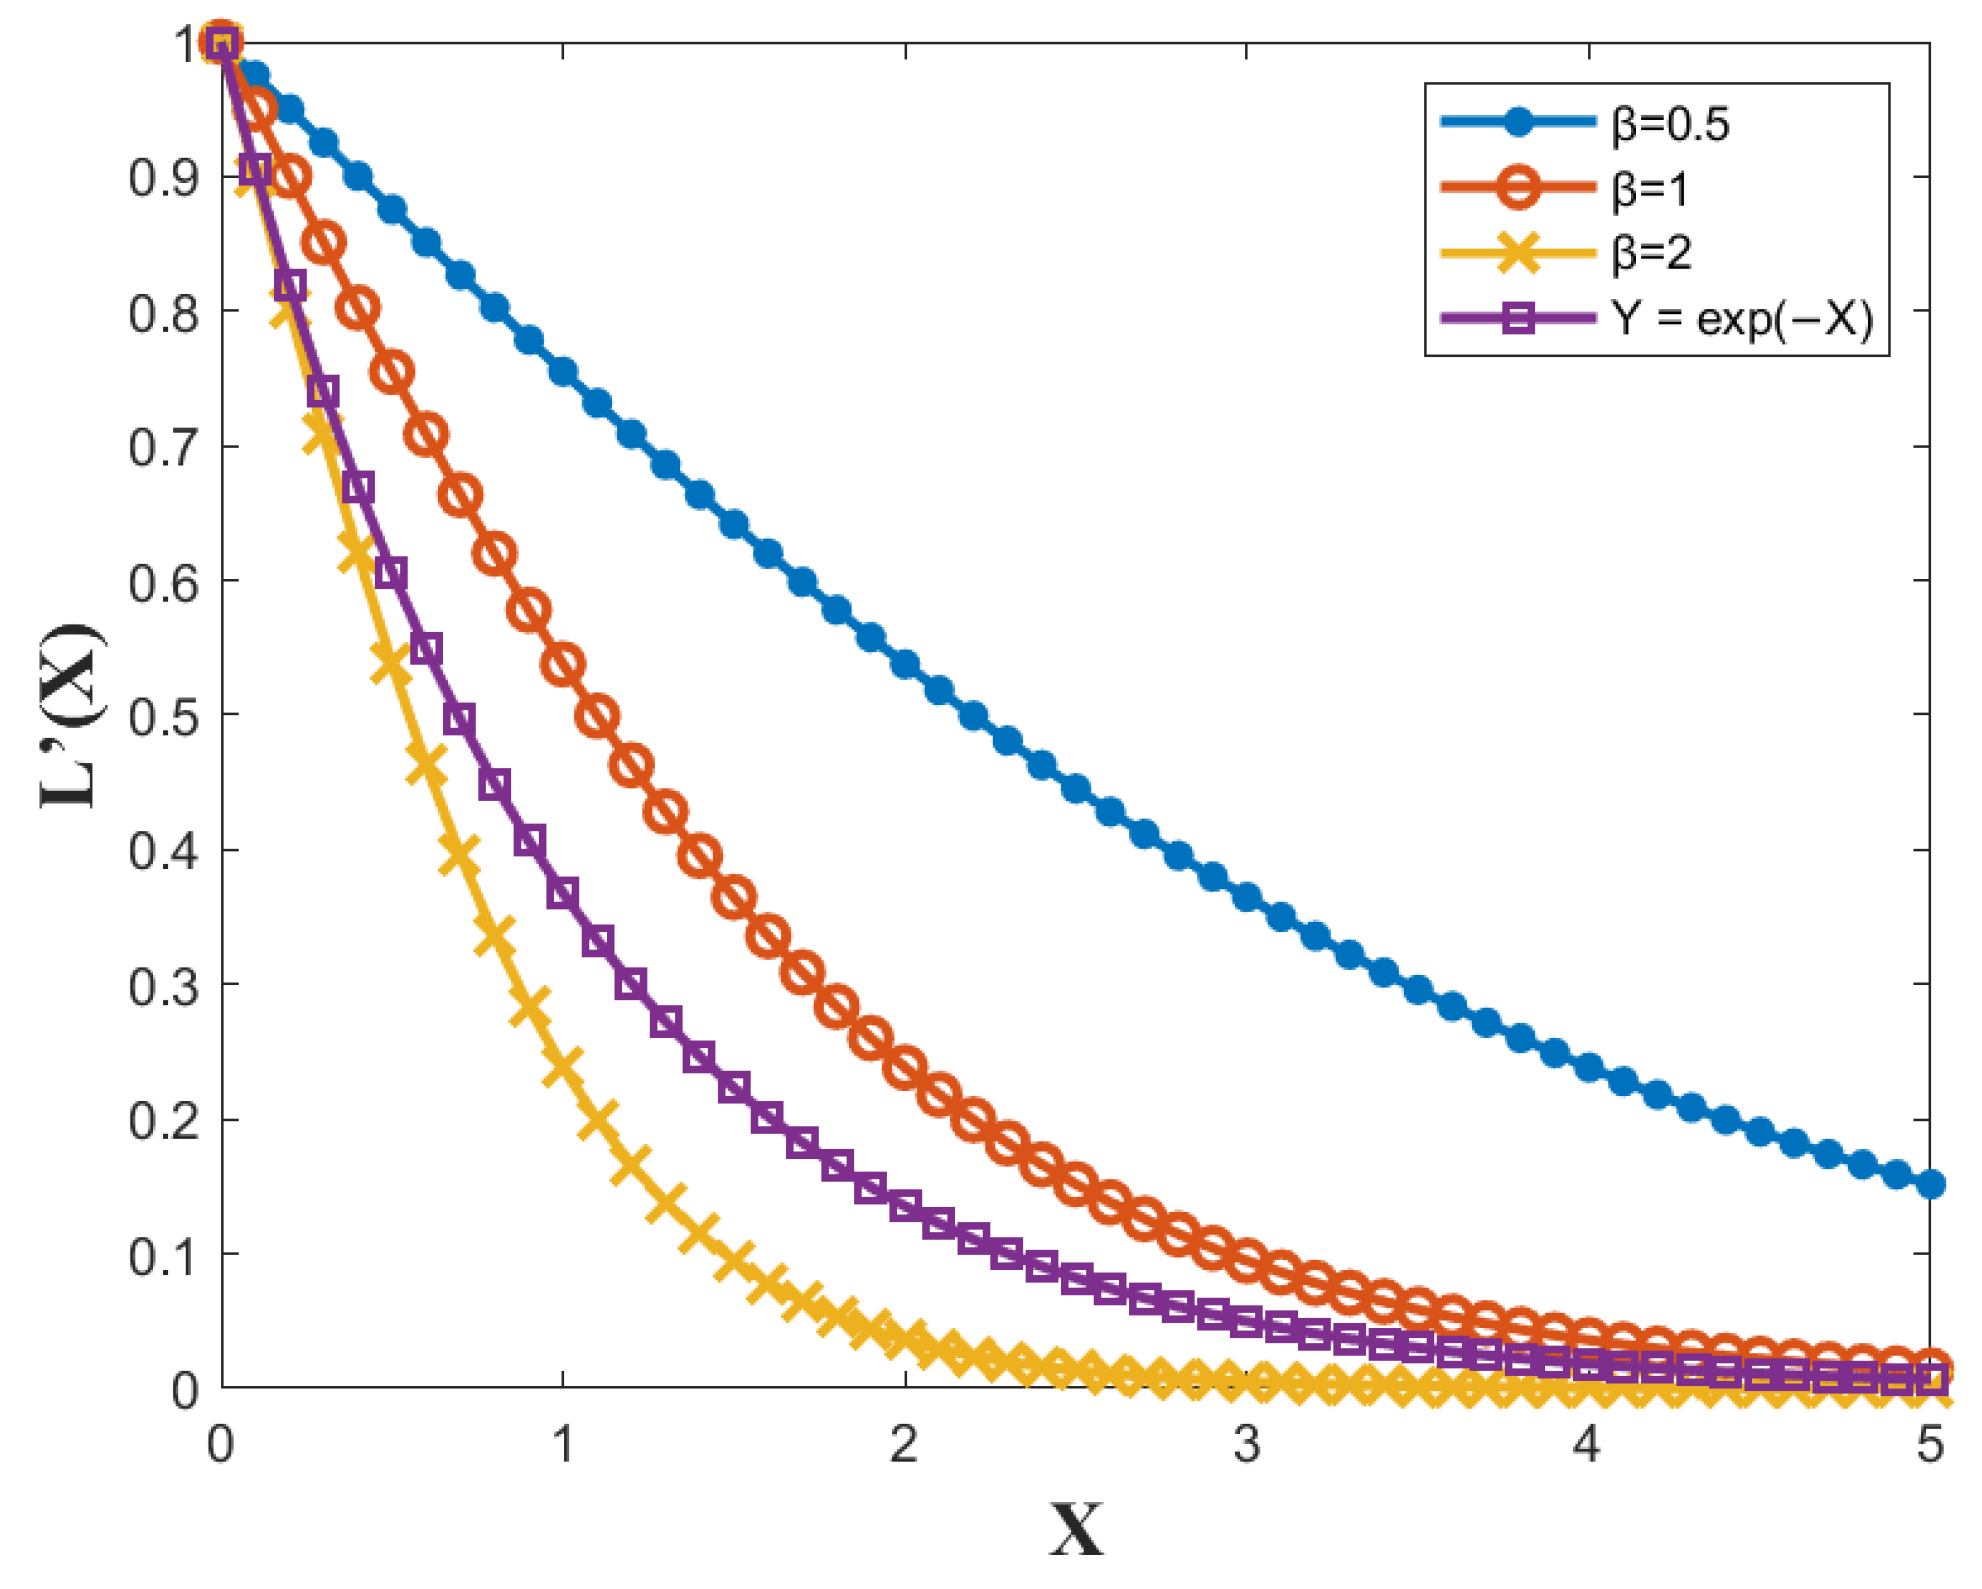
According to the requirement of the weight function in the NLM algorithm, the weight function ranges between 0 and 1, monotonically decreasing with the increase in the Euclidean distance between patches. Equation (11) is multiplied by 2, and α is set to 0 and β to −β to obtain an improved weight function factor L′(X):
L ( X ) = 2 1 + exp ( β X ) .
The modified function decreases monotonically as X increases without changing other properties of the function. Formula (12) is introduced into the NLM algorithm. The speckle noise in digital holography is suppressed effectively by employing the smoothness, nonlinear, and saturation properties of the logistic function in the proposed method.
In the NLM algorithm, the weight function can be simplified as the following:
Y = exp ( X ) .
The curves of the function L′(X) at different β values are compared with the curve of Equation (13), as shown in Figure 4. From Figure 4, it can be seen that the descent rate of the yellow curve (β = 2) is the fastest. As the value of β decreases, the curve descent slows down.
The function L′(X) is introduced into the weight function of the NLM algorithm. The weight function is reformulated as the following:
w ( p , q n ) = 1 Z ( p ) 2 1 + exp [ β d ( p , q n ) ( 10 σ n p ) 2 ] ,
where Z(p) is the following:
Z ( p ) = q n Ω 2 1 + exp [ β d ( p , q n ) ( 10 σ n p ) 2 ] ,
The choice of β will be discussed in Section 3.4.
The specific steps of the LA-NLM algorithm are as follows:
  • Input the speckle noise image;
  • Determine the value of each parameter: ds, Ds, and β;
  • Calculate the integral image about the pixel difference St according to Equation (7);
  • Calculate the distance d(p, qn) between patches N(p) and N(qn) according to Equation (8);
  • Estimate the standard deviation σnp of the local speckle noise according to Equation (9), and determine the parameter h according to Equation (10);
  • Obtain the value of w(p,qn) according to Equation (14);
  • Obtain the denoised image according to Equation (1).

3. Results and Discussion

3.1. Simulation Results

Two images, ‘Tai-ji’ and ‘D’, are selected as the test objects, as shown in Figure 5a,k, respectively. Their sizes are all 512 × 512 pixels, and the pixel pitch is 10 × 10 μm2. The wavelength of the coherent light source is 632.8 nm, and the distance from the object to the holographic recording surface is 500 mm. Fresnel transformation [29] is used to calculate the diffraction integral. The recording process of the off-axis hologram is simulated. Figure 5b,l are directly reconstructed images from digital holograms for ‘Tai-ji’ and ‘D’, respectively. In the simulation experiments, a diffuser is added into the illuminating light to simulate the surface roughness of the object in reality. The simulating experiments are done on a PC with AMD Ryzen 7 5800H processor with a clock rate of 3.2 GHz and a memory size of 32 GB. It is noted that the reconstruction images presented here do not show the entire area, but only a region of interest that contains the real image.
The NLM algorithm [17], the improved NLM algorithm [19], and the proposed algorithm are employed to suppress the speckle noise in the reconstructed images. The size of the similarity window and the search window in these three methods are set to 3 × 3 pixels and 17 × 17 pixels, respectively. In the NLM algorithm, the parameter h is 12σn [17]. In both the improved NLM algorithm and the proposed algorithm, h is 10σn [19]. The value of parameter β is 0.3 in the proposed algorithm. The same parameter of the algorithm is used in subsequent experiments. In Section 3.3, selecting the values of β is discussed. The denoised images are shown in Figure 5c–e for ‘Tai-ji’ and Figure 5m–o for ‘D’, respectively. The area in the red box of each image in Figure 5a–e,k–o is enlarged and placed in the upper right corner of the corresponding image. And, the corresponding three-dimensional (3D) shape topographies of the above images are shown in Figure 5f–j,p–t, respectively. Among them, the colorbar represents the pixel value of 255 in yellow and 0 in blue.
For the object ‘Tai-ji’, the directly reconstructed image in Figure 5b exhibits noticeable speckle noise, leading to a significant amplitude fluctuation within the red box area, which detrimentally impacts image quality. While the speckle in the image denoised by the NLM method in Figure 5c is reduced to a certain degree, the quality of the denoised image still falls short of expectations. The speckle in the image processed by the improved NLM method in Figure 5d is effectively mitigated, but it is still visible. Our proposed method achieves the best result represented in Figure 5e; namely, the denoised image is clear and almost the same as the original image. For the 3D shape topographies shown in Figure 5g–j, it can be seen that there are many spikes in Figure 5g,h, and the distortion is very severe compared with Figure 5f. Figure 5j exhibits almost no spikes and is similar to the 3D shape topography of the original object.
For the ‘D’ image in Figure 5k, it is evident that the image denoised by our proposed method in Figure 5o most closely resembles the object image in comparison to other images (Figure 5l–n). The speckle noise is effectively suppressed, and the brightness of the denoised image approximates the brightness of the object image. Furthermore, the amplitude distribution of the 3D topography for the image denoised by our proposed method in Figure 5t most closely aligns with the amplitude distribution of the object image, compared to those denoised by the other two methods (Figure 5r,s). The 3D topography of the image denoised by our algorithm is superior to the others.
In order to quantitatively analyze the quality of the denoised images, peak signal-to-noise ratio (PSNR), speckle index (SI), and structural similarity index (SSIM) are used. PSNR is expressed as the following:
PSNR = 10 log 10 ( 2 λ 1 ) 2 MSE ,
MSE = 1 M 2 N 2 i = 1 M 2 j = 1 N 2 [ H ( i , j ) K ( i , j ) ] 2 ,
where M2 and N2 are the number of pixels in the horizontal and vertical direction of the image, respectively; λ is the number of bits per sampled value (here λ = 8); and H(i, j) and K(i, j) are the pixel of the original image and the pixel of the processed image, respectively. Generally speaking, the higher the value of PSNR is, the better the quality of the image is.
SI is expressed as the following:
SI = 1 M 3 N 3 i = 1 M 3 j = 1 N 3 σ ( i , j ) μ ( i , j ) ,
where M3 and N3 are the horizontal and vertical size of the interest area in the image, and σ(i, j) and μ(i, j) represent the standard deviation and average value of the processed pixel of the interest area. The lower the SI is, the lower the speckle level is.
SSIM is expressed as the following:
SSIM ( H , K ) = ( 2 μ H μ K + c 1 ) ( 2 σ H K + c 2 ) ( μ H 2 + μ K 2 + c 1 ) ( σ H 2 + σ K 2 + c 2 ) ,
where H and K are the original image and the processed image, respectively; μH and μK are the average values of H and K, respectively; σ H 2 and σ K 2 are the variance of H and K, respectively; and σHK is the covariance of H and K. The constants used to maintain stability are c1 = (k1Q)2, c1 = (k1Q)2. Q is the dynamic range of pixel values, k1 = 0.01, and k2 = 0.03. Generally speaking, the higher the value of SSIM is, the better the quality of the image is.
The parameters PSNR, SI, and SSIM of the images resulted from direct reconstruction, and the above three methods are computed and shown in Table 1. From Table 1, it can be discovered that the image resulting from our algorithm possesses the best performance indicators, whether for object ‘D’ or for ‘Tai-ji’. For example, for object ‘D’, the PSNR of the image resulting from the proposed method is 22.733 dB, which is an enhancement of 7.475 dB and 2.778 dB compared to the images denoised by the NLM and improved NLM, respectively. The SI of the image resulting from the proposed method is 0.275, which is a decrease of 52% and 8.1% compared to the SI of the images denoised by the other two methods, respectively. Meanwhile, the SSIM of the image resulting from the proposed method is 0.714, which is 1.904 times higher than the image resulting from the NLM and 1.186 times higher than the one resulting from the improved NLM. The proposed method effectively suppresses the speckle noise in the reconstructed image of the digital hologram while also preserving the details and texture information. The running time of various algorithms is also shown in Table 1. Because of the adoption of the integral image, the running speed of the proposed algorithm has been greatly improved, and the time cost has been enormously reduced. The LA-NLM algorithm only spends less than 2% of the time that the NLM algorithm and the improved NLM algorithm spend denoising for the same image.

3.2. Choice of h

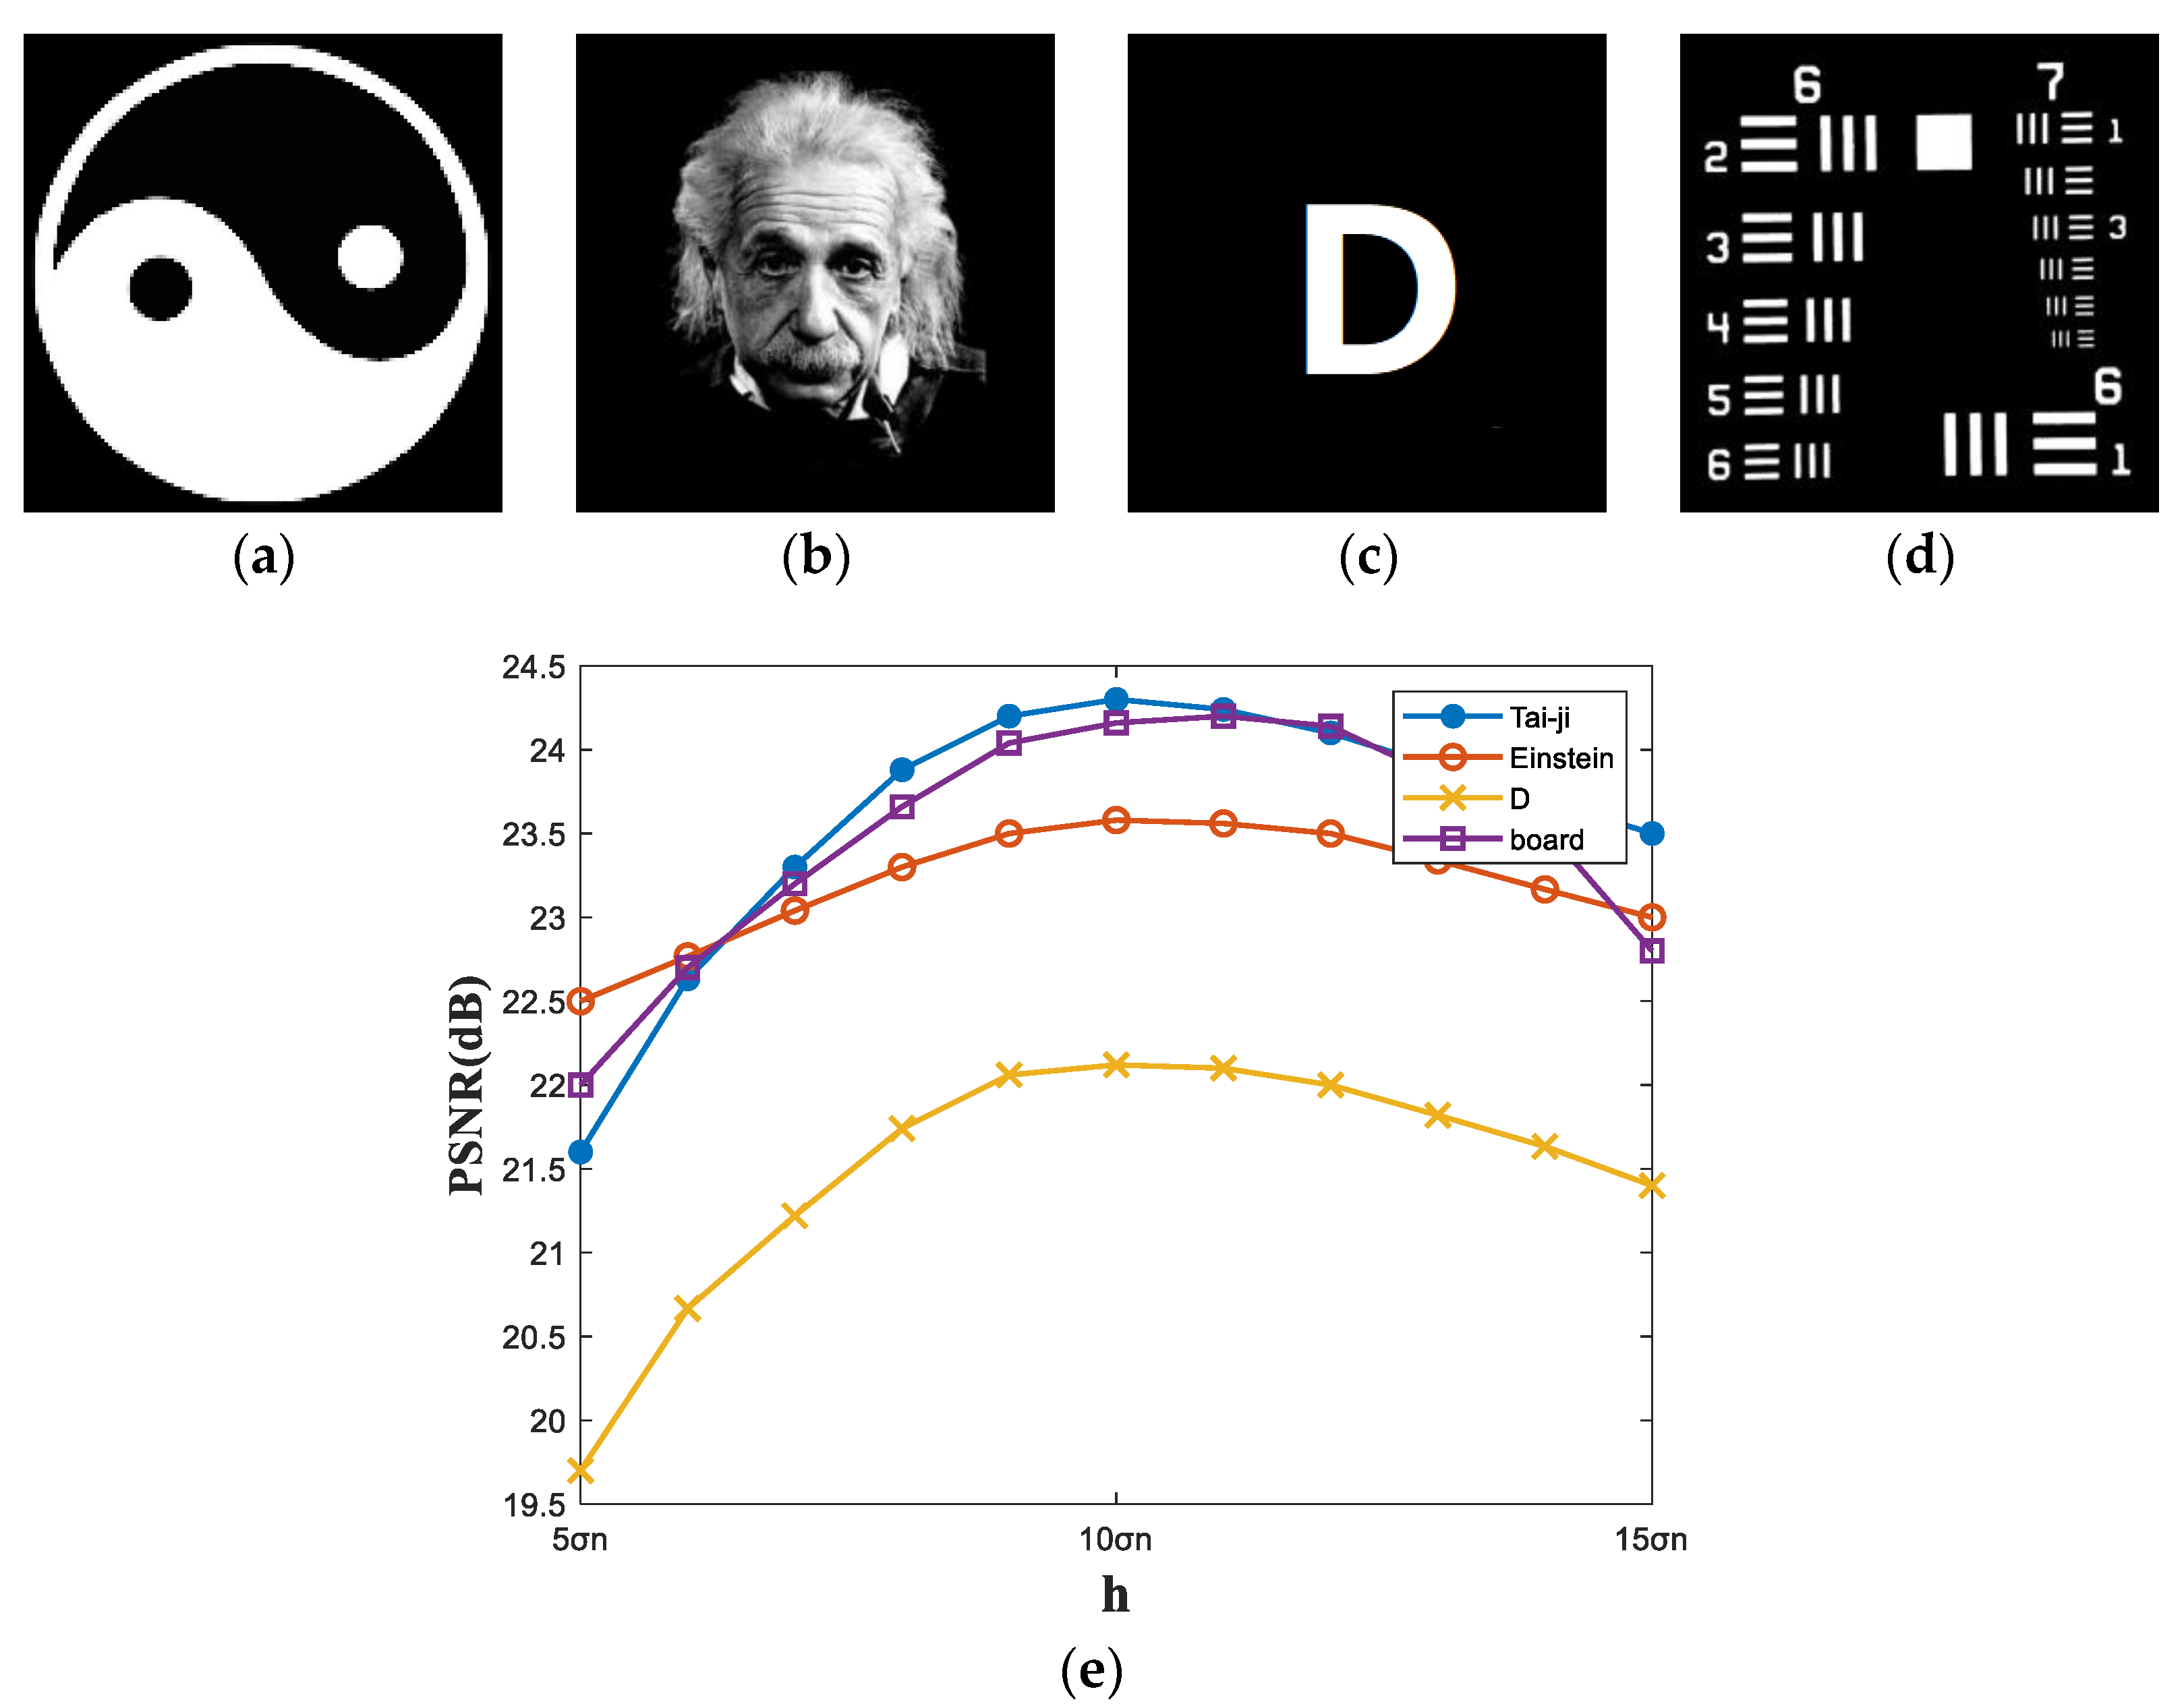
The images ‘Tai-ji’, ‘Einstein’, ‘D’, and ‘board’ are chosen as the objects and shown in Figure 6a–d, respectively. The whole process of the digital hologram is simulated, and the proposed method is adopted to reduce the speckle noise in the reconstructed image of the digital hologram. The size of the similarity window and the size of the search window are set to 3 × 3 pixels and 17 × 17 pixels, respectively. The value of parameter β is 0.3. The performance parameter PSNR of the image denoised with different h is calculated and plotted in Figure 6e. From Figure 6e, it can be obtained that as h increases, the PSNR rapidly enhances until it reaches its peak for every object image. When h is equal to 10σn, the PSNR reaches the maximum for most objects. For instance, the PSNR of the denoised image is 24.4 dB for ‘Tai-ji’. After that, the PSNR slowly decreases with the increase in h. Namely, h is set to 10σn and a good denoising performance can be attained. In the subsequent experiments, h is 10σn.

3.3. Choice of Windows

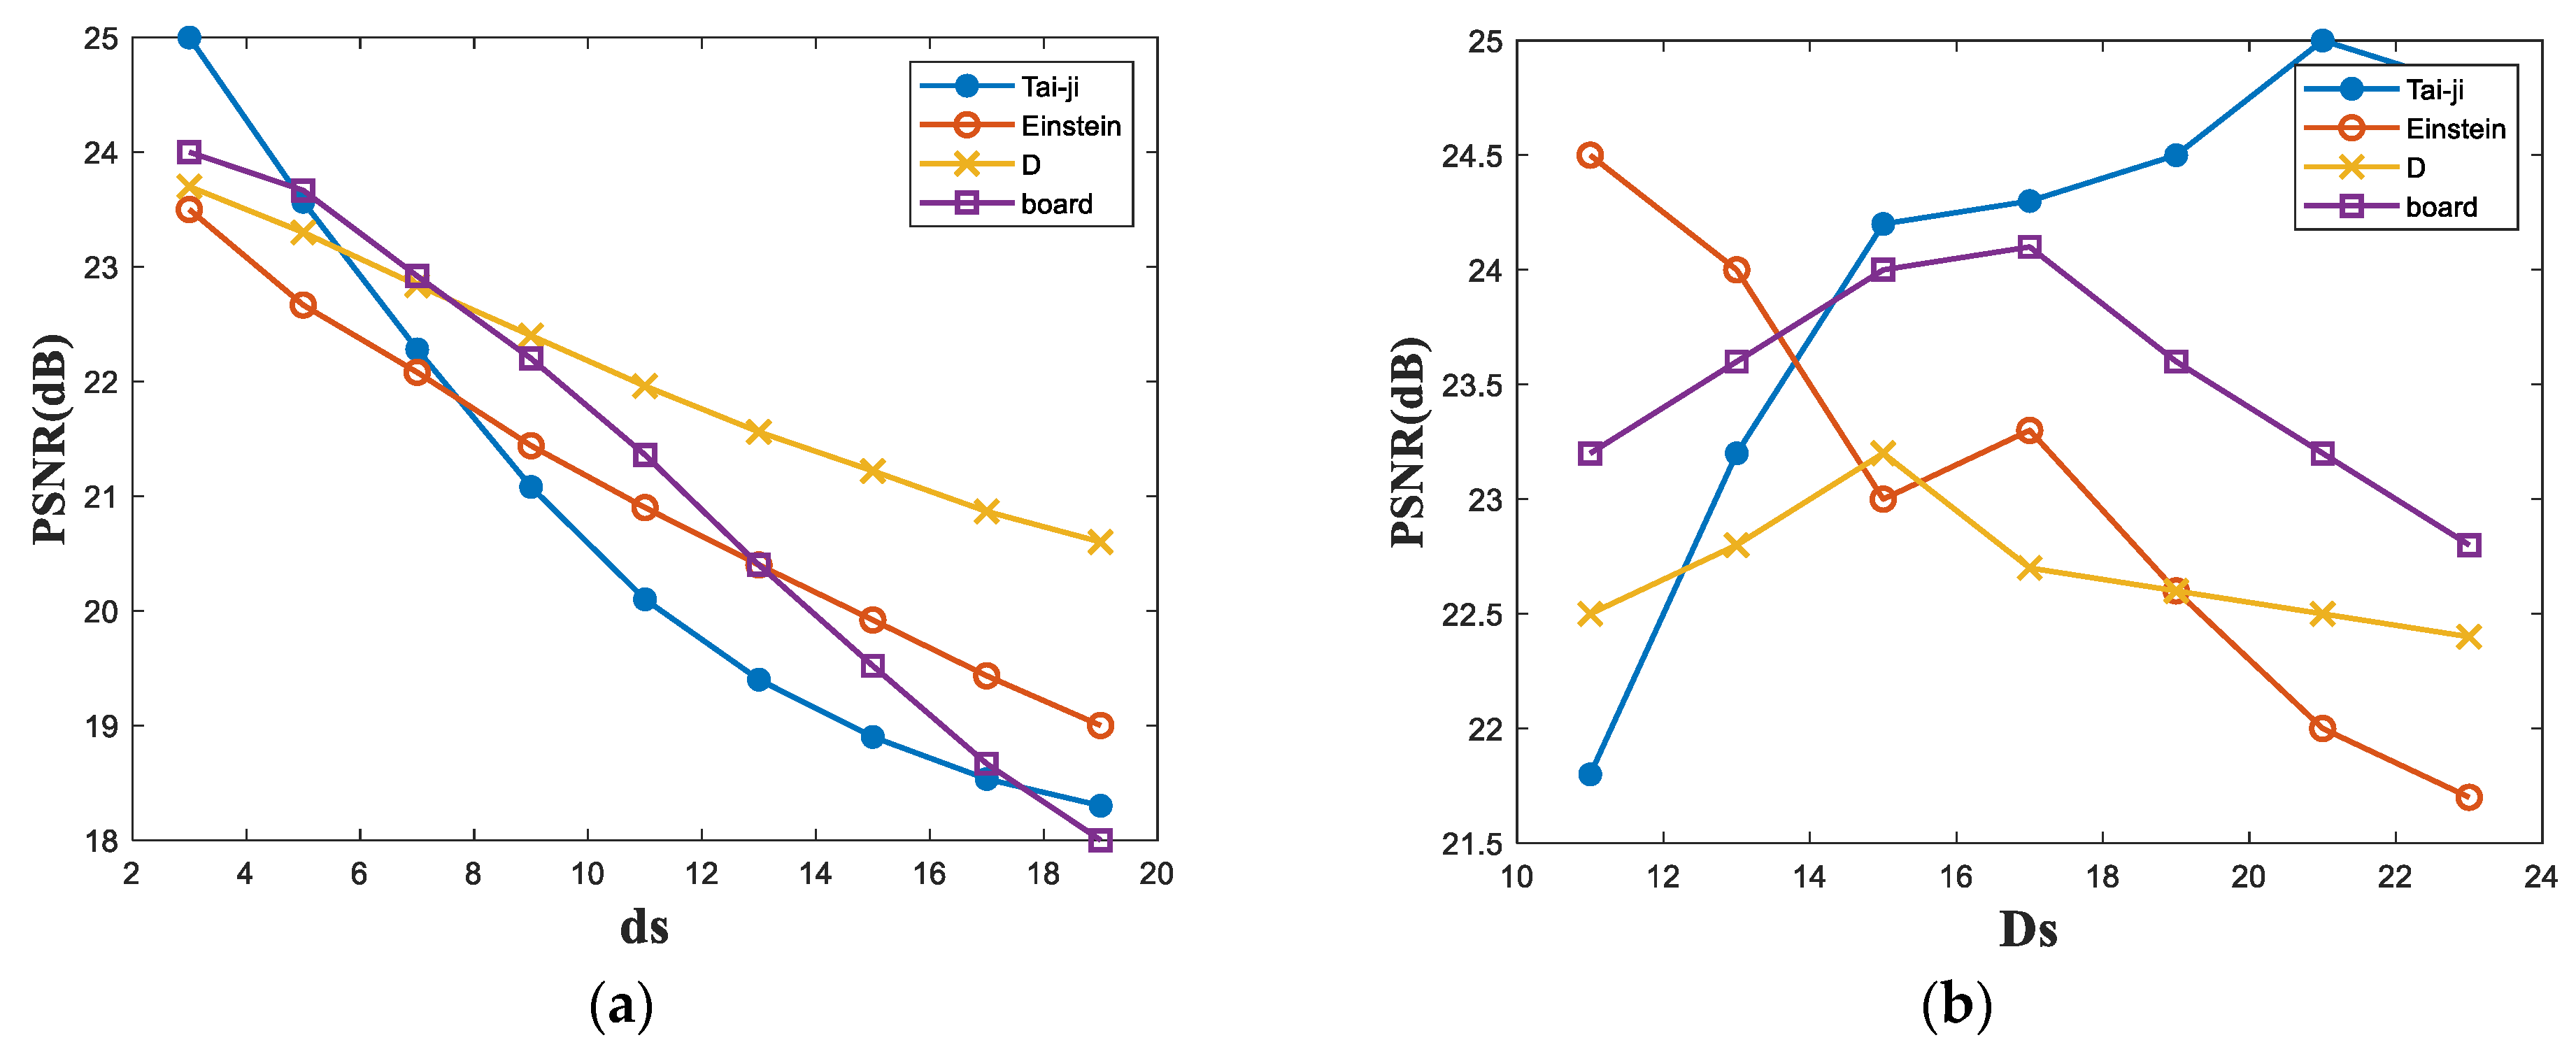
The objects are the same as Section 3.2, and the value of β is 0.3, too. In the denoising process of the proposed algorithm, the different sizes of the similar window and the search window are employed, respectively. The PSNR of the denoised image is calculated for every size of window and shown in Figure 7. The size of the search window is set to 21 × 21 pixels in Figure 7a. When ds = 3 pixels, the PSNR of every denoised image reaches its peak. As ds increases, the PSNR decreases for every object. Therefore, the optimal value of ds is set to three pixels to achieve the maximum PSNR. In Figure 7b, the size of the similarity window is set to 3 × 3 pixels. As Ds scales up, the variation pattern of the PSNR varies for different objects. For example, the PSNR curve of ‘Tai-ji’ shows an upward trend with increasing Ds, while the PSNR curve of ‘Einstein’ shows a downward trend overall, but rises first and then decreases at the point (Ds = 17 pixels). That is, Ds has different effects on the denoising performance for different images. To compromise, we chose Ds to be 17 pixels. Therefore, the size of the similarity window is set to 3 × 3 pixels, and the size of the search window is 17 × 17 pixels in the subsequent experiments.

3.4. Choice of β

The objects are the same as Section 3.2. The value of β ranges from 0 to 2 with an interval of 0.1. The max PSNR of the denoised image is taken as the selection criterion of the optimized β value. The simulation results are shown in Figure 8a–d. The parameters (optimized β, max PSNR) are located above each image. For example, (0.4, 23.50) in Figure 8b means that the max PSNR (23.50 dB) of the denoised image is obtained when β = 0.4 for the ‘Einstein’ image. It can be seen that, although the optimal value of β varies for different images, β ranges mainly from 0.2 to 0.4 to obtain the max PSNR.
Β is set to 0.3, and the simulation results of the objects are shown in Figure 8e–h. The bottom of the image is the PSNR of the corresponding denoised image. It can be seen that, under the parameter (β = 0.3), the denoised image possesses a clear outline and the brightness is similar to the original object. The PSNRs of these images are very close to the max PSNRs shown in Figure 8a–d. Take the ‘Einstein’ image as an example; the difference in PSNR between Figure 8b,f is 0.1 dB. According to the above performance indices and the denoised images, the value of β is recommended to be between 0.2 and 0.4. In the following experiment, β is set to 0.3.

3.5. Comparison of Methods

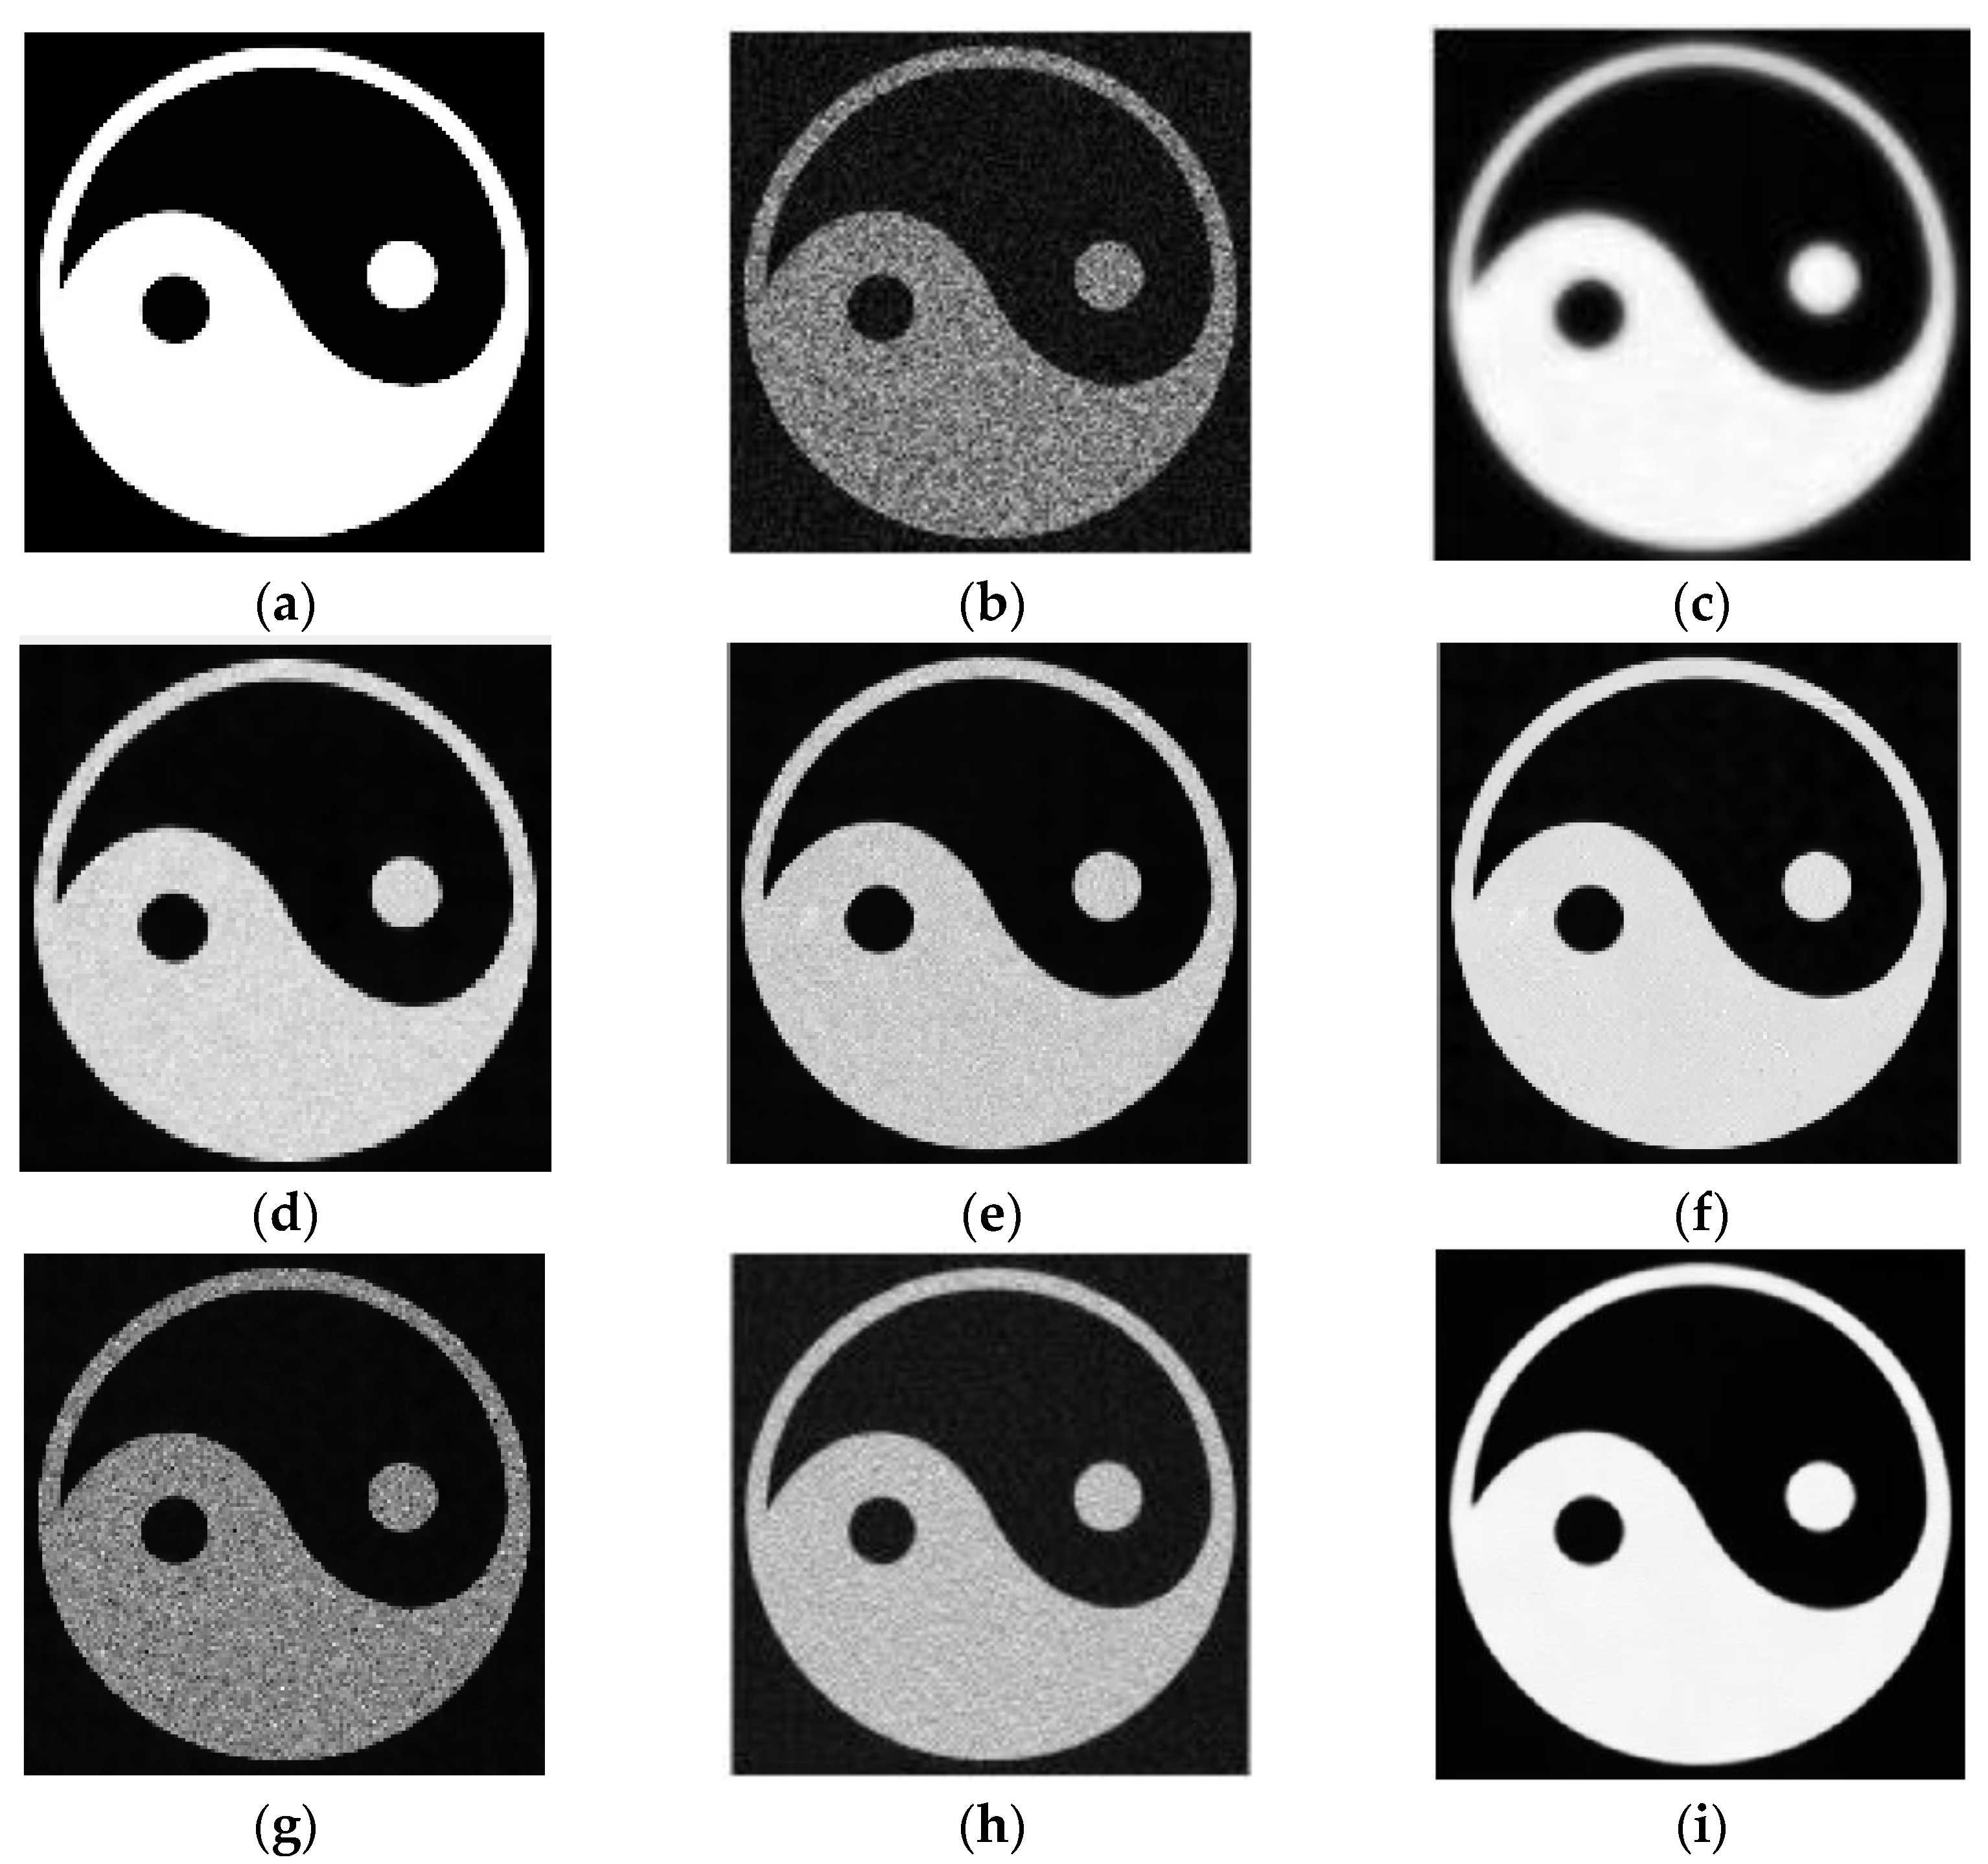
In addition to the above NLM and improved NLM algorithms, the squeeze boxes (SBF) filter [30], optimal Bayesian NLM (OBNLM) filter [20], speckle-reducing anisotropic diffusion (SRAD) filter [31], and BM3D filter [20] are employed to reduce speckle noise in the reconstructed image of the digital hologram. For the SBF filter, the patch size is 3 × 3 pixels, and the number of iterations applied is nine. For the OBNLM filter, the search area size is 17 × 17 pixels, the patch size is 3 × 3 pixels, and the smoothing parameter is 10σn. For the SRAD filter, the time step size is set to 0.3, and the number of iterations applied is six. The parameters of the three algorithms mentioned above are all obtained from the reference [32]. For the BM3D filter, the size of the similarity window and the size of the search window are set to 3 × 3 pixels and 17 × 17 pixels, respectively. For the convenience of comparison, the original ‘Tai-ji’ image and the directly reconstructed image are shown in Figure 9a,b, respectively. The images in Figure 9c–i are results from the SBF filter, OBNLM filter, SRAD filter, BM3D filter, NLM filter, improved NLM filter, and the proposed method, respectively. It can be seen that all of the methods can suppress the speckle, but there still remains a large amount of noise in the denoised images resulting from the NLM filter in Figure 9g. The quality of the denoised image is not good. The clarity of the denoised image resulting from the OBNLM filter, SRAD filter, and the improved NLM filter in Figure 9d,e,h is promoted, and the quality of the image has been improved. The SBF filter’s excessive smoothing of noise leads to the blurring of the edges in Figure 9c. The BM3D filter and the proposed method achieve a good noise reduction effect in Figure 9f,i. The image denoised by the proposed method is as bright as the original object, and more texture details are provided.
Table 2 presents the performance metrics of the denoised images by various methods. In terms of the PSNR, the proposed method achieves the maximum (24.359 dB), and the NLM filter does the minimum (10.235 dB). The BM3D filter achieves a good denoising effect and its corresponding PSNR is 22.187 dB. The PSNRs of the other methods do not exceed 21 dB. This proves the superiority of our method. For the SI, both the improved NLM and LA-NLM filter presents a good result (SI is about 0.17) when dealing with direct reconstruction (SI = 0.677), and the performance of speckle removal is improved by nearly three times compared to the NLM filter. For the SSIM, the proposed method and BM3D filter are around 0.7, effectively preserving the edge texture, while the SBF filter gets the lowest value (0.201). It is worth mentioning that the SSIM of the proposed method is 0.369 and 0.184 higher than the SSIM of the NLM and the SSIM of the improved NLM filter, respectively. In terms of running time, the LA-NLM algorithm greatly enhances computational efficiency compared with the NLM algorithm and the improved NLM algorithm, and the running time reduces from about 136.68 s to 2.56 s. The running speed of the LA-NLM algorithm is nearly 25.6 times faster than the running speed of the BM3D filter. In summary, our proposed approach has superior performance to the other methods.

4. Experiment

The experiment is conducted to further verify the proposed method. The digital holography set-up is based on the Mach-Zehnder interferometer, as shown in Figure 10. Figure 10a is for a reflective object, and Figure 10b is for a transmissive object. Figure 10c,d are photographs of the experimental setup for a reflective object and a transmissive object, respectively. A He–Ne laser with a 632.8 nm wavelength (DH-HN250) is used as a light source. The output light beams of the laser are spatially filtered by a pinhole filter whose diameter is 25 μm. A lens with a focus of 250 mm is adopted to transform the filtered light beams into plane light beams. The plane beams are split into the illuminating beam and the reference beam by a beam splitter (BS) whose ratio of splitting beams is 50:50. The object ‘Coin’ in Figure 11a is a reflective one, which has a diameter of 19.3 mm and a thickness of 1.75 mm. The light is reflected by the object to form the object light in Figure 10a. Objects ‘A’ and ‘小’ in Figure 11b,c are transparent characters engraved on a thin black slice with a thickness of 1.55 mm. The size of ‘A’ is 3.03 × 2.24 mm2 and ‘小’ is 2.2 × 2.2 mm2. Another BS (with a ratio of splitting beams of 50:50) is used to mix the object beam with the reference beam. The mirror in the reference light path can be adjusted to achieve an off-axis hologram. The interference pattern is recorded by a CCD camera (DH-HV3151UC). The pixel array of the camera is 2048 × 1536 and the pixel pitch is 3.2 × 3.2 μm2. The distances from the objects ‘Coin’, ‘A’, and ‘小’ to CCD are 400 mm, 460 mm, and 460 mm, respectively. The recorded holograms are shown in Figure 11.
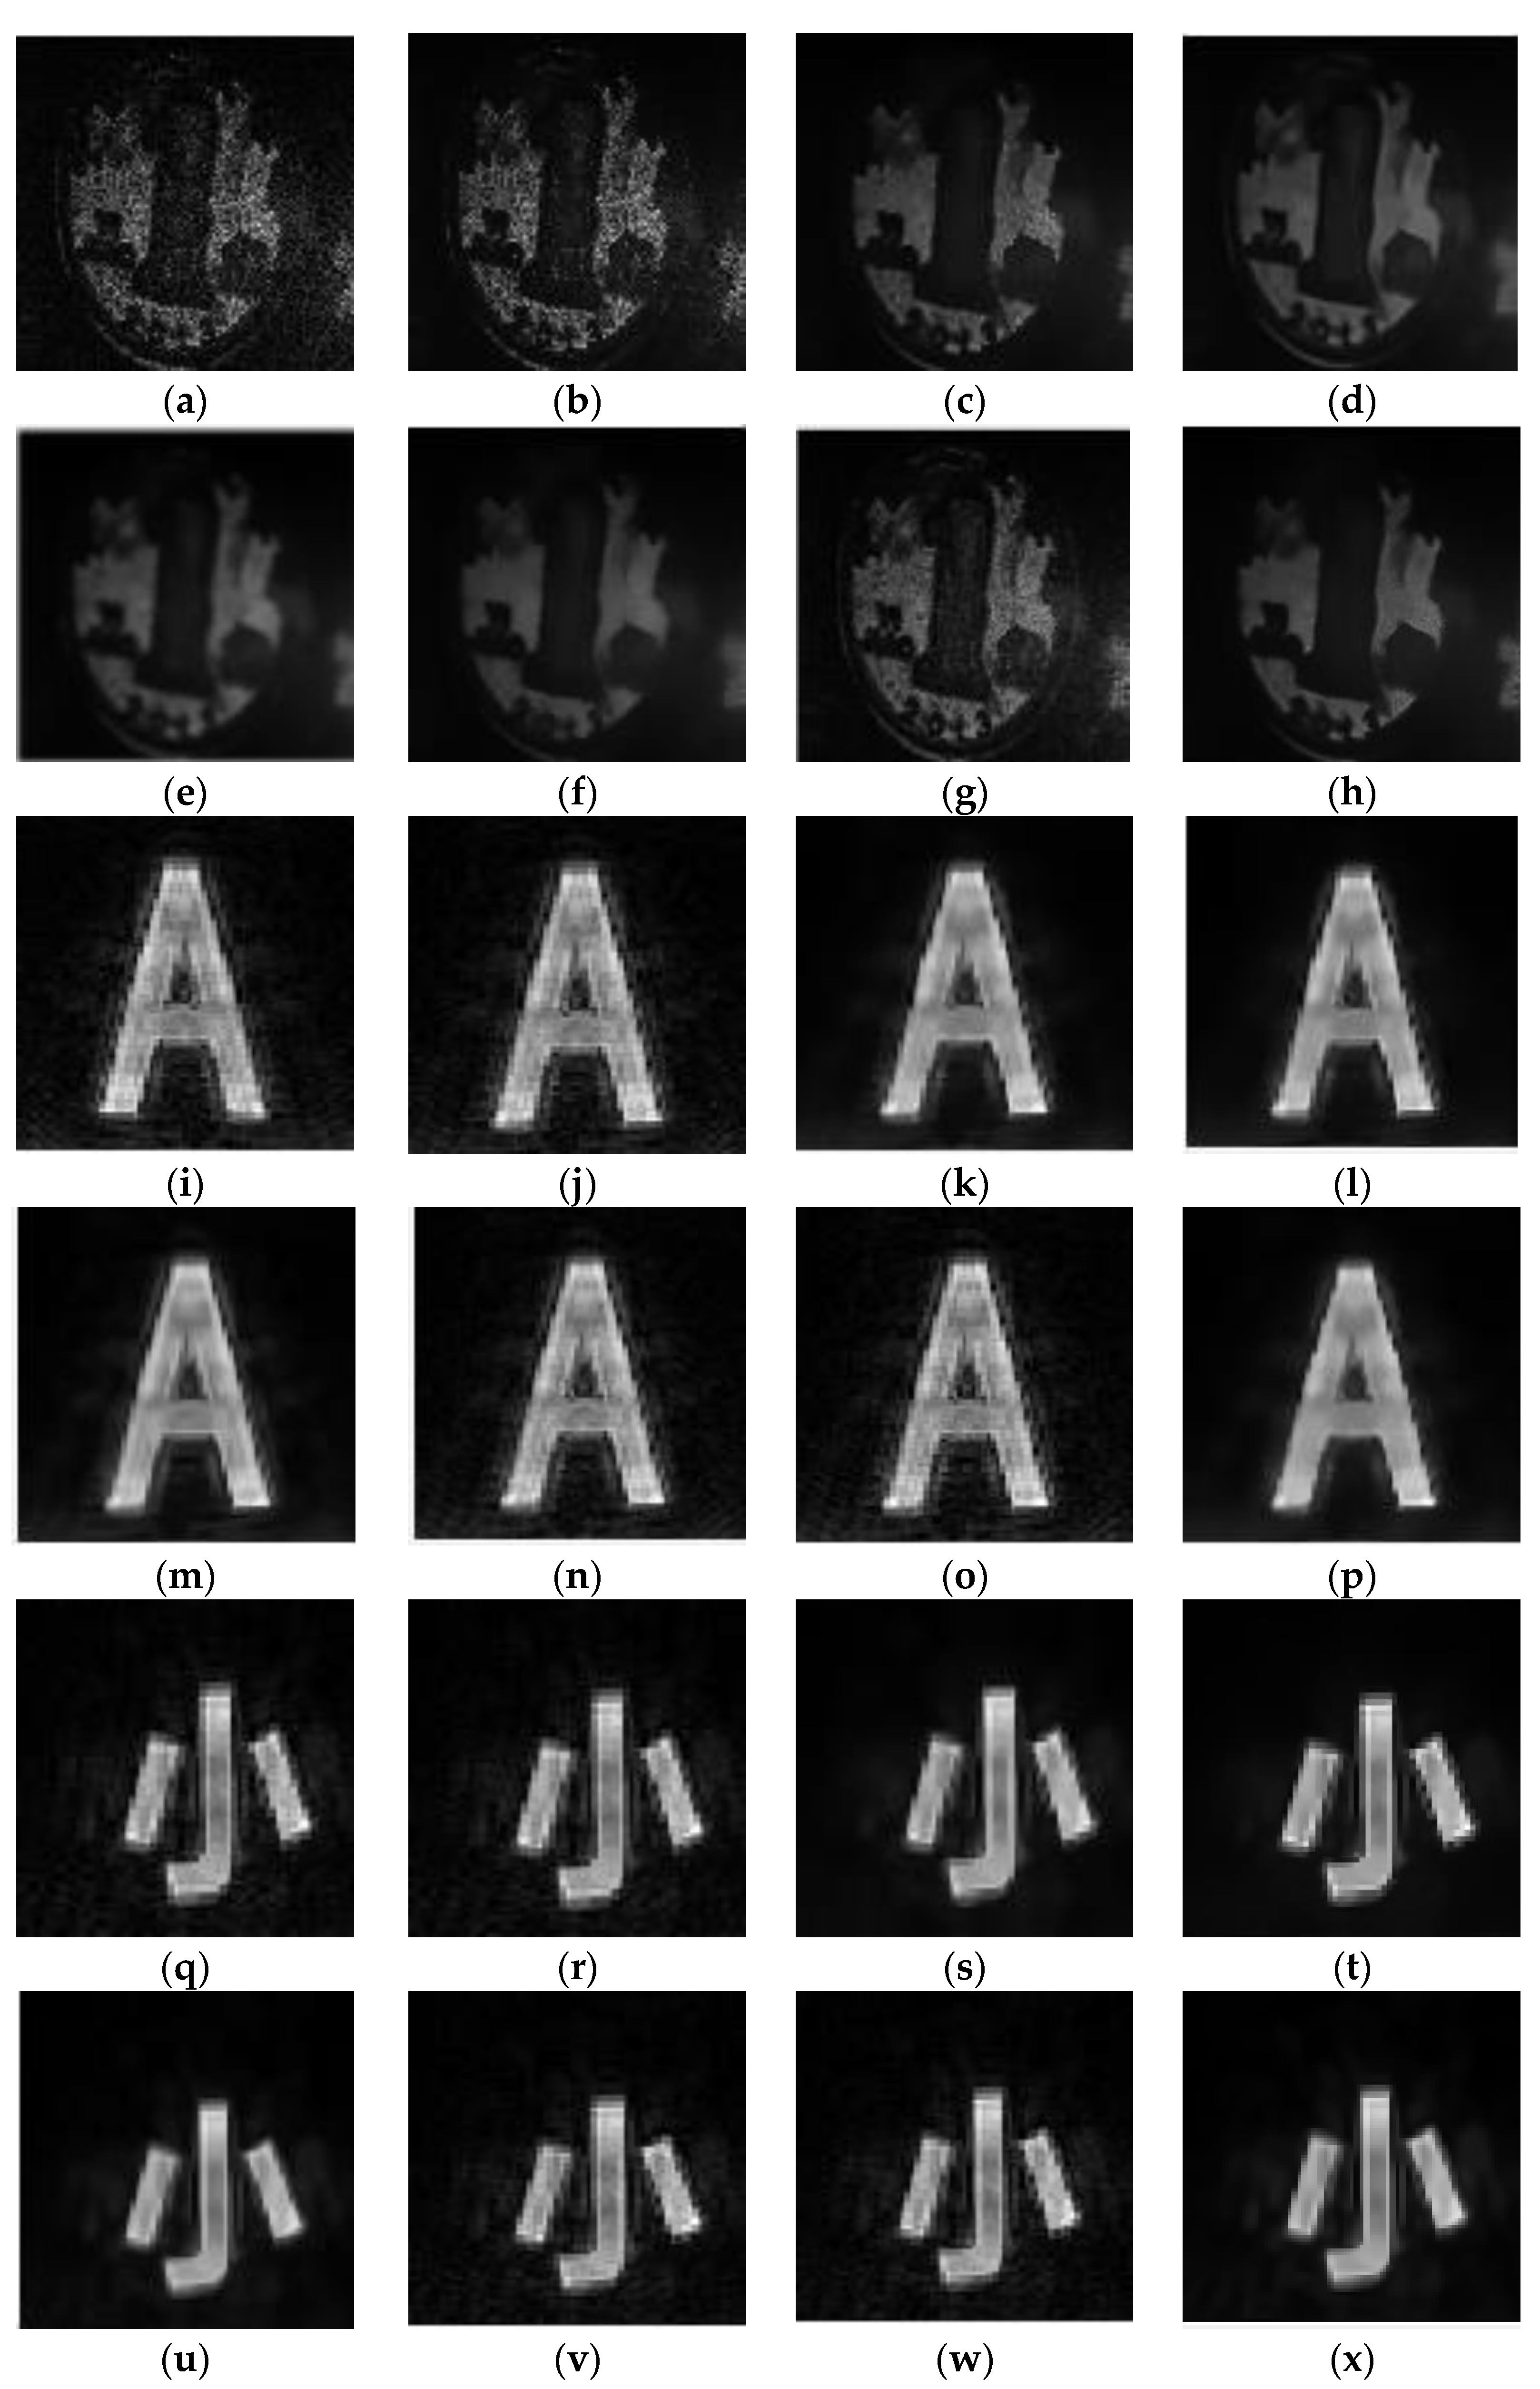
The directly reconstructed images are shown in Figure 12a,i,q, respectively. There is a large amount of speckle noise in these images, and the details are blurry. All the methods listed in Table 2 are adopted to suppress speckle in the reconstructed image. Figure 12b,j,r shows the denoised results by the NLM method, and it can be found that the speckle is reduced to a certain degree. Figure 12c,k,s shows the denoised results by the improved NLM method. The speckle noise is obviously suppressed, and the clarity of the images is improved compared to the ones processed by the NLM method. However, there is still some noise at the edges. Figure 12d,l,t shows the denoised results by the BM3D method. It can be seen that the image obtained by using BM3D can achieve a good effect. Figure 12e,m,u shows the denoised results by the SBF method. The edge details of the image obtained by using the SBF method are blurred. Figure 12f,n,v shows the denoised results by the OBNLM method. The image obtained by using the OBNLM method appears overall dull. Figure 12g,o,w shows the denoised results by the SARD method. The image obtained by the SARD method still has some noise. Figure 12h,p,x shows the denoised results by the LA-NLM method. The speckle noise is further suppressed, and more details are achieved. Compared to other methods, the proposed method reduces speckle noise effectively and improves the clarity of the reconstructed image.
The SI and time are calculated in Table 3. For ‘coin’, the SI of the image (Figure 12h) denoised by the proposed algorithm is 0.146, which is a decrease of 77.4% compared to the SI of the image reconstructed directly from the digital hologram in Figure 12a, and a decrease of 57.6% and 26.3% compared to the SI of the images (Figure 12b,c) obtained by the NLM and improved NLM method, respectively. It is worth mentioning that the SI obtained by the SBF filter is also good, but it is obvious that the image is overly smooth and cannot achieve a high level of quality. Additionally, the running time was reduced from about 147.62 s to 3.45 s. The running speed of the LA-NLM algorithm is nearly 25.9 times faster than the running speed of the BM3D filter. According to the experimental result, it can be concluded that the proposed method effectively suppresses the speckle noise, and the quality of the reconstructed image is greatly improved.

5. Conclusions

An adaptive accelerated NLM algorithm is proposed based on the logistic function model. Firstly, the integral image is introduced to compute the similarity between patches in the image, and the running speed of the algorithm is greatly improved. Then, by calculating the local noise variance, the filtering parameter adaptively adjusts in the proposed algorithm. Finally, based on the logistic function model, the weight function is reformulated to solve the problem of the NLM algorithm being unable to effectively suppress speckle noise in digital holography. The simulation and optical experiment are performed. The parameters of the proposed algorithm are discussed, and the optimal value is suggested. The simulation and experimental results indicate that the proposed method outperforms other filtering methods, and it can efficiently suppress speckle noise in digital holography. The denoised image is clear and of high quality. However, in this study, only PSNR is utilized as the reference criterion for optimal value selection. While PSNR is a common measurement metric of image quality, it may not be sufficient to comprehensively evaluate algorithm performance. Therefore, in future research, additional performance parameters should be introduced into the assessment of image quality. Furthermore, adaptive processing often necessitates the consideration of multiple factors, such as image content, noise levels, and resolution. Hence, future research efforts may be focused on investigating how to leverage deep learning models or reinforcement learning methods to automatically adjust algorithm parameters for better adaptability to various contexts.

Author Contributions

Conceptualization, Y.F. and J.L.; methodology, Y.F.; software, Y.F.; validation, Y.F., J.L. and Z.X.; formal analysis, Y.F.; investigation, Y.F.; resources, Y.F.; data curation, Y.F.; writing—original draft preparation, Y.F.; writing—review and editing, Y.F.; visualization, Y.F.; supervision, J.L.; project administration, J.L.; funding acquisition, J.L. All authors have read and agreed to the published version of the manuscript.

Funding

National Natural Science Foundation of China (NSFC) (62105036, 62105038).

Data Availability Statement

Data underlying the results presented in this paper are not publicly available at this time but may be obtained from the authors upon reasonable request.

Conflicts of Interest

The authors declare that there are no conflicts of interest related to this article.

References

  1. Lee, H.; Kim, J.; Kim, J.; Jeon, P.; Lee, S.A.; Kim, D. Noniterative sub-pixel shifting super-resolution lensless digital holography. Opt. Express 2021, 29, 29996–30006. [Google Scholar] [CrossRef]
  2. Li, J.; Tian, A.; Wang, H.; Zhu, X.; Wang, C.; Liu, B.; Asundi, A. Microstructure measurement of digital holography. In Proceedings of the International Conference on Photonics and Optical Engineering (icPOE 2014), Xi’an, China, 13–15 October 2014; International Society for Optics and Photonics: Bellingham, DC, USA, 2014; Volume 9449, p. 94493O. [Google Scholar]
  3. Lin, C.; Han, Y.; Lou, S.; Li, Z. High spectral and spatial resolved encryption and decryption of 3D color object based on holographic imaging spectroscopy. Opt. Lasers Eng. 2021, 145, 106669. [Google Scholar] [CrossRef]
  4. Kumar, M.; Matoba, O.; Quan, X.; Rajput, S.K.; Awatsuji, Y.; Tamada, Y. Single-shot common-path off-axis digital holography: Applications in bioimaging and optical metrology [Invited]. Appl. Opt. 2021, 60, A195–A204. [Google Scholar] [CrossRef]
  5. Dong, J.; Jia, S.; Yu, H. Hybrid method for speckle noise reduction in digital holography. J. Opt. Soc. Am. A 2019, 36, D14–D22. [Google Scholar] [CrossRef] [PubMed]
  6. Monroy, F.; Rincon, O.; Torres, Y.M.; Garcia-Sucerquia, J. Quantitative assessment of lateral resolution improvement in digital holography. Opt. Commun. 2008, 281, 3454–3460. [Google Scholar] [CrossRef]
  7. Nomura, T.; Okamura, M.; Nitanai, E.; Numata, T. Image quality improvement of digital holography by superposition of reconstructed images obtained by multiple wavelengths. Appl. Opt. 2008, 47, D38–D43. [Google Scholar] [CrossRef]
  8. Su, T.-W.; Isikman, S.O.; Bishara, W.; Tseng, D.; Erlinger, A.; Ozcan, A. Multi-angle lensless digital holography for depth resolved imaging on a chip. Opt. Express 2010, 18, 9690–9711. [Google Scholar] [CrossRef] [PubMed]
  9. Lo, C.-K.; Pan, J.-W. Speckle reduction with fast electrically tunable lens and holographic diffusers in a laser projector. Opt. Commun. 2019, 454, 124301. [Google Scholar] [CrossRef]
  10. Wang, Y.; Meng, P.; Wang, D.; Rong, L.; Panezai, S. Speckle noise suppression in digital holography by angular diversity with phase-only spatial light modulator. Opt. Express 2013, 21, 19568–19578. [Google Scholar] [CrossRef] [PubMed]
  11. Hincapie, D.; Herrera-Ramírez, J.; Garcia-Sucerquia, J. Single-shot speckle reduction in numerical reconstruction of digitally recorded holograms. Opt. Lett. 2015, 40, 1623–1626. [Google Scholar] [CrossRef]
  12. Fukuoka, T.; Mori, Y.; Nomura, T. Speckle reduction by spatial-domain mask in digital holography. J. Disp. Technol. 2015, 12, 315–322. [Google Scholar] [CrossRef]
  13. Yassine, T.; Ahmed, S.; Abdelkrim, N. Speckle noise reduction in digital speckle pattern interferometry using riesz wavelets transform. In Proceedings of the 2017 International Conference on Advanced Technologies for Signal and Image Processing (ATSIP), Fez, Morocco, 22–24 May 2017; pp. 1–4. [Google Scholar]
  14. Ibrahim, D.G.A. Improving the intensity-contrast image of a noisy digital hologram by convolution of Chebyshev type 2 and elliptic filters. Appl. Opt. 2021, 60, 3823–3829. [Google Scholar] [CrossRef] [PubMed]
  15. Leng, J.M.; Li, F.B.; Li, H.L. Speckle reduction by optical pre-processing and digital filtering in digital holography. Lasers Eng. (Old City Publ.) 2019, 44, 227–238. [Google Scholar]
  16. Buades, A.; Coll, B.; Morel, J.M. Non-local means denoising. Image Process. Line 1 2011, 1, 208–212. [Google Scholar] [CrossRef]
  17. Buades, A.; Coll, B.; Morel, J.M. A Review of Image Denoising Algorithms, with a New One. Multiscale Model. Simul. 2005, 4, 490–530. [Google Scholar] [CrossRef]
  18. Tounsi, Y.; Kumar, M.; Nassim, A.; Mendoza-Santoyo, F. Speckle noise reduction in digital speckle pattern interferometric fringes by nonlocal means and its related adaptive kernel-based methods. Appl. Opt. 2018, 57, 7681–7690. [Google Scholar] [CrossRef]
  19. Leng, J.L.J.; Sang, X.S.X.; Yan, B.Y.B. Speckle noise reduction in digital holography with spatial light modulator and nonlocal means algorithm. Chin. Opt. Lett. 2014, 12, 8–12. [Google Scholar] [CrossRef]
  20. Coupe, P.; Hellier, P.; Kervrann, C.; Barillot, C. Nonlocal Means-Based Speckle Filtering for Ultrasound Images. IEEE Trans. Image Process. 2009, 18, 2221–2229. [Google Scholar] [CrossRef] [PubMed]
  21. Dabov, K.; Foi, A.; Katkovnik, V.; Egiazarian, K. Image denoising by sparse 3-D transform-domain collaborative filtering. IEEE Trans. Image Process. 2007, 16, 2080–2095. [Google Scholar] [CrossRef] [PubMed]
  22. Manjon, J.V.; Carbonellcaballero, J.; Lull, J.J.; Garciamarti, G.; Martibonmati, L.; Robles, M. MRI denoising using non-local means. Med. Image Anal. 2013, 17, 287–301. [Google Scholar] [CrossRef] [PubMed]
  23. Dabov, K.; Foi, A.; Katkovnik, V.; Egiazarian, K. Image denoising with block-matching and 3d filtering. In Proceedings of the Image Processing: Algorithms and Systems, Neural Networks, and Machine Learning, San Jose, CA, USA, 16–18 January 2006; International Society for Optics and Photonics: Bellingham, DC, USA, 2006; Volume 6064, pp. 354–365. [Google Scholar]
  24. Goodman, J.W. Some fundamental properties of speckle. J. Opt. Soc. Am. 1976, 66, 1145–1150. [Google Scholar] [CrossRef]
  25. Cramer, J.S. The Origins of Logistic Regression. Econom. Ejournal 2002, 2002-119/4(2-119/4). [Google Scholar] [CrossRef]
  26. Viola, P.; Jones, M. Rapid object detection using a boosted cascade of simple features. In Proceedings of the 2001 IEEE Computer Society Conference on Computer Vision and Pattern Recognition, Kauai, HI, USA, 8–14 December 2001. [Google Scholar]
  27. Froment, J. Parameter-Free Fast Pixel wise Non-Local Means Denoising. Image Process. Line 2014, 4, 300–326. [Google Scholar] [CrossRef]
  28. Rousseeuw, P.J.; Croux, C. Alternatives to the Median Absolute Deviation. J. Am. Stat. Assoc. 1993, 88, 1273–1283. [Google Scholar] [CrossRef]
  29. Goodman, J.W. Introduction to Fourier Optics; Roberts & Company Publishers: Greenwood Village, CO, USA, 2005. [Google Scholar]
  30. Tay, P.C.; Garson, C.D.; Acton, S.T.; Hossack, J.A. Ultrasound Despeckling for Contrast Enhancement. IEEE Trans. Image Process. 2010, 19, 1847–1860. [Google Scholar] [CrossRef] [PubMed]
  31. Yu, Y.; Acton, S.T. Speckle reducing anisotropic diffusion. IEEE Trans. Image Process. 2002, 11, 1260–1270. [Google Scholar] [PubMed]
  32. Wang, L.; Pu, Y.-F.; Liu, P.; Hao, Y. Multiscale hybrid method for speckle reduction of medical ultrasound images. Multimedia Tools Appl. 2023, 66, 102396. [Google Scholar] [CrossRef]
Figure 1. Scheme of NLM.
Photonics 11 00147 g001
Figure 2. Integral image diagram.
Photonics 11 00147 g002
Figure 3. Logistic curve L(T).
Photonics 11 00147 g003
Figure 4. Curves of logistic function at different βs.
Photonics 11 00147 g004
Figure 5. Object and resulted images: (a) ‘Tai-ji’ image, (k) ‘D’ image; (b,l) directly reconstructed images; (c,m) denoised images by the NLM method; (d,n) denoised images by the improved NLM method; (e,o) denoised images by the proposed method; (fj) the corresponding 3D shape topographies of (ae); (pt) the corresponding 3D shape topographies of (ko).
Photonics 11 00147 g005
Figure 6. Objects and performance: (ad) object images ‘Tai-ji’, ‘Einstein’, ‘D’, and ‘board’, respectively; and (e) the relationship between PSNR and h.
Photonics 11 00147 g006
Figure 7. Impact of the window size on PSNR: (a) the impact of ds, and (b) the impact of Ds.
Photonics 11 00147 g007
Figure 8. (ad) The relationship of PSNR and β for ‘Tai-ji’, ‘Einstein’, ‘D’, and ‘board’ image, respectively; (eh) results of the proposed method when β is 0.3.
Photonics 11 00147 g008
Figure 9. Object and results: (a) original image, (b) direct reconstruction, (c) denoised by SBF filter, (d) denoised by OBNLM filter, (e) denoised by SARD filter, (f) denoised by BM3D filter, (g) denoised by NLM filter, (h) denoised by improved NLM filter, and (i) denoised by LA-NLM filter.
Photonics 11 00147 g009
Figure 10. Off-axis holographic recording system: (a) for a reflective object, (b) for a transmissive object, (c) photograph of experimental setup for a reflective object, and (d) photograph of experimental setup for a transmissive object.
Photonics 11 00147 g010
Figure 11. Objects and digital holograms: (a) ‘coin’, a dime issued by the People’s Bank of China, (b) ‘A’, (c) ‘小’, the meaning is very small, and (df) holograms.
Photonics 11 00147 g011
Figure 12. Results of different methods: (a,i,q) the direct reconstruction of the digital hologram; (b,j,r) the result denoised by NLM method; (c,k,s) the result denoised by improved NLM method; (d,l,t) the result denoised by BM3D method; (e,m,u) the result denoised by SBF filter; (f,n,v) the result denoised by OBNLM filter; (g,o,w) the result denoised by SARD filter; and (h,p,x) the result denoised by LA-NLM filter.
Photonics 11 00147 g012
Table 1. Performance comparison in ‘Tai-ji’ and ‘D’.
Tai-jiD
PSNR (dB)SISSIMTime (s)PSNR (dB)SISSIMTime (s)
Direct Reconstruction9.0160.6770.105/15.0180.6960.108/
NLM10.2350.5230.334136.6815.2580.5730.375125.33
Improved NLM18.0110.1730.519136.6919.9550.2990.602125.32
LA-NLM24.3590.1710.7032.5622.7330.2750.7142.12
Table 2. Performance comparison of various methods.
MethodsPSNR (dB)SISSIMTime (s)
Direct Reconstruction9.0160.6770.105/
SBF18.3230.1750.201155.33
OBNLM20.4790.2100.598139.64
SRAD19.6520.1990.616124.52
BM3D22.1870.1930.69764.17
NLM10.2350.5230.334136.68
Improved NLM18.0110.1730.519136.69
LA-NLM24.3590.1710.7032.56
Table 3. Performance comparison of various methods.
ObjectsCoinA
IndicesSITime (s)SITime (s)SITime (s)
Methods
Direct Reconstruction0.624/0.448/0.512/
SBF0.147170.320.149161.540.166164.88
OBNLM0.189156.360.201134.750.199140.74
SRAD0.260134.850.309129.270.297128.14
BM3D0.15589.650.15774.370.16081.75
NLM0.331147.620.431139.510.507142.63
Improved NLM0.195145.960.185138.740.193141.55
LA-NLM0.1463.450.1413.080.1643.22
Disclaimer/Publisher’s Note: The statements, opinions and data contained in all publications are solely those of the individual author(s) and contributor(s) and not of MDPI and/or the editor(s). MDPI and/or the editor(s) disclaim responsibility for any injury to people or property resulting from any ideas, methods, instructions or products referred to in the content.