Abstract
Alignment precision is a crucial factor that directly impacts overlay accuracy, which is one of three fundamental indicators of lithography. The alignment method based on the Moiré fringe has the advantages of a simple measurement optical path and high measurement accuracy. However, it requires strict control of the distance between the mask and wafer to ensure imaging quality. This limitation restricts its application scenarios. A depth–DOF (depth of focus) Moiré fringe alignment by broad–spectrum modulation is presented to enhance the range of the alignment signals. This method establishes a broad–spectrum Moiré fringe model based on the Talbot effect principle, and it effectively covers the width of dark field (WDF) between different wavelength imaging ranges, thereby extending the DOF range of the alignment process, and employs a hybrid of genetic algorithms and the particle-swarm optimization (GA–PSO) algorithm to combine various spectral components in a white spectrum. By calculating the optimal ratio of each wavelength and using white light incoherent illumination in combination with this ratio, it achieves the optimal DOF range of a broad–spectrum Moiré fringe imaging model. The simulation results demonstrate that the available DOF range of the alignment system has been expanded from 400 μm to 800 μm. Additionally, the alignment precision of the system was analyzed, under the same conditions, and the accuracy analysis of the noise resistance, translation amount, and tilt amount was conducted for the Moiré fringe and broad–spectrum Moiré fringe. Compared to a single wavelength, the alignment precision of the broad–spectrum Moiré fringe decreased by an average of 0.0495 nm, equivalent to a 1.5% reduction in the original alignment precision, when using a 4 μm mask and a 4.4 μm wafer. However, the alignment precision can still reach 3.795 nm, effectively enhancing the available depth of focus range and reducing the loss of alignment precision.
1. Introduction
The lithography machine is a crucial piece of equipment in the ultra–large integrated circuit industry and significantly influences its development [1]. Overlay accuracy is one of the key factors that impacts the performance of the lithography machine. Together with the feature size and productivity, these three factors are referred to as core technical indicators of the lithography machine [2]. The alignment system is responsible for measuring the relative position of the lithography mask and wafer. It is a crucial subsystem that ensures overlay accuracy. The overlay accuracy is typically 1/5 to 1/10 of the feature size, and the alignment precision is approximately 1/3 of the overlay accuracy [3]. As the feature size continues to shrink, the complexity of industrial integration increases, leading to higher demands for alignment systems. Consequently, there is growing research interest in developing alignment methods for lithography alignment systems. The goal is to achieve nanoscale accuracy while simultaneously reducing the complexity of the alignment process.
The current mainstream lithography alignment technologies can be categorized into four types: geometric imaging alignment [4], zone–plate intensity alignment [5], diffraction grating interference alignment [6], and diffraction grating Moiré fringe intensity alignment [7]. The method proposed by geometric imaging alignment [4] involves observing geometric marks on the mask and wafer through a microscope and adjusting the coordinate positions of two to achieve alignment. However, this method has a limitation in terms of the alignment precision due to the CCD pixel size, making it unsuitable for sub-micron process nodes. B. Fay et al. [5] proposed an alignment method for X–ray lithography systems based on zone-plate intensity. The measurement structure is straightforward, but the alignment signal is highly responsive to variations in the mask and wafer gap. The working gap needs to be positioned within a narrow depth of focus (DOF) range of the zone–plate, which may not be ideal for existing alignment systems. Noboru et al. [6] proposed the interference alignment method based on grating diffraction, which achieves alignment precision of tens of nanoscale. However, this method is susceptible to the effects of gaps and tilts in the mask and wafer, and therefore, it is crucial to address the issue of parallelism. K. Matt et al. [7] proposed lithography alignment technology based on diffraction grating Moiré fringe intensity alignment. This alignment method offers a straightforward measurement path and effectively avoids signal fluctuations caused by the wafer process layer. Consequently, it has found widespread use in new applications, particularly in first-generation lithography systems. Numerous scholars have since focused on enhancing different aspects of this alignment method.
T. M. [8] and other researchers utilized a linear Moiré fringe to achieve coarse alignment in the interference intensity alignment method. This approach resulted in the generation of a cross Moiré fringe, which demonstrated alignment precision of approximately 200 nm. In the context of optical path adjustment, Moel et al. [9] introduced a coaxial interference alignment method known as on-axis interferometric alignment (OAI). This method utilizes the Moiré fringe to measure the alignment degree in multiple directions, unaffected by any gaps in the mask and wafer. Building upon this, Moel et al. [10] proposed an optimized interference spatial phase imaging alignment method. They employed a two–dimensional checkerboard grating as a mark on the wafer to enhance the contrast of the Moiré fringe image and achieve optical path alignment. However, due to the complexity of the light path, it is not currently suitable for the alignment process. In the field of nanoimprint and soft lithography, similar methods have been employed by Stephen Chou et al. [11] and Mühlberger et al. [12,13]. The alignment precision is approximately 100 nm; however, the precision can be easily influenced by the mark process. In the context of the fringe phase analysis algorithm, the team from the Institute of Optics and Electronics of the Chinese Academy of Science [14,15,16,17] utilized four-quadrant combination grating markers to demodulate the phase information of the Moiré fringe. They also conducted on-mode gap changes, wafer tilt, and other related factors. The alignment precision achieved was approximately 30 nm. To address the issue of the low measurement accuracy resulting from the limitations of the circular Moiré fringe analysis methods, Wang et al. [18] proposed a misalignment measurement strategy based on deep learning. This approach offers alignment precision in the range of several nanoscale accuracy. However, it requires large amounts of data for learning, leading to a long training cycle and slower measurement speed. Although these alignment methods have high alignment precision during the alignment process, their alignment signals are easily affected by the gap between the mask and wafer and the wafer process.
To address this issue, this paper proposes an alignment method that utilizes the Moiré fringe. This method involves the use of different spectral components of white light to overlap and interfere with each other at regular intervals through the diffraction of light fields of different orders. By combining different diffraction light fields, the method covers the dark field of a different single wavelength, resulting in a continuous intensity distribution. Moreover, the GA–PSO hybrid algorithm is combined with this method to calculate the weight ratio for each wavelength. This allows for the selection of an optimal weight ratio combination, which in turn outputs the best imaging range and reduces the sensitivity of the gap between the mask and wafer in terms of the alignment precision. Furthermore, this approach minimizes the impact of repeatability and other errors, thereby enhancing the adaptability of the alignment process.
2. Theoretical Analysis
2.1. Broad-Spectrum Moiré Fringe Alignment Theory
The alignment method based on the Moiré fringe utilizes the superposition of projected line gratings to generate a multiplicative Moiré fringe. The principle is that as the grating is displaced, the corresponding Moiré fringe also shifts, According to the principle of the Moiré fringe [14], this change is reflected in the phase distribution of the Moiré fringe. By analyzing the phase distribution of the Moiré fringe, it is possible to calculate actual the deviation between the mask and wafer. The field distribution after double grating diffraction is determined via the superposition of all the harmonic components in the diffraction, using a rectangular line grating as an example.
represents the field intensity distribution of the diffracted beam passing through two gratings. The spatial frequencies of two rectangular line gratings are denoted as and , while represents the spatial frequency on the frequency spectrum. According to the Angular Spectrum theory, the propagation of the n-th order to the z plane introduces a nonlinear phase factor .
If the incident light is an incoherent white light broad–spectrum source, the light intensity distribution of the interference fringe in its diffraction field can be expressed as:
represents the weighted sum of the intensity distribution of the Moiré fringe produced by different wavelengths in a white light broad–spectrum. is the weight factor of the corresponding wavelength in the spectrum. represents the background light intensity of the Moiré fringe signal, and represents the amplitude of the Moiré fringe signal.
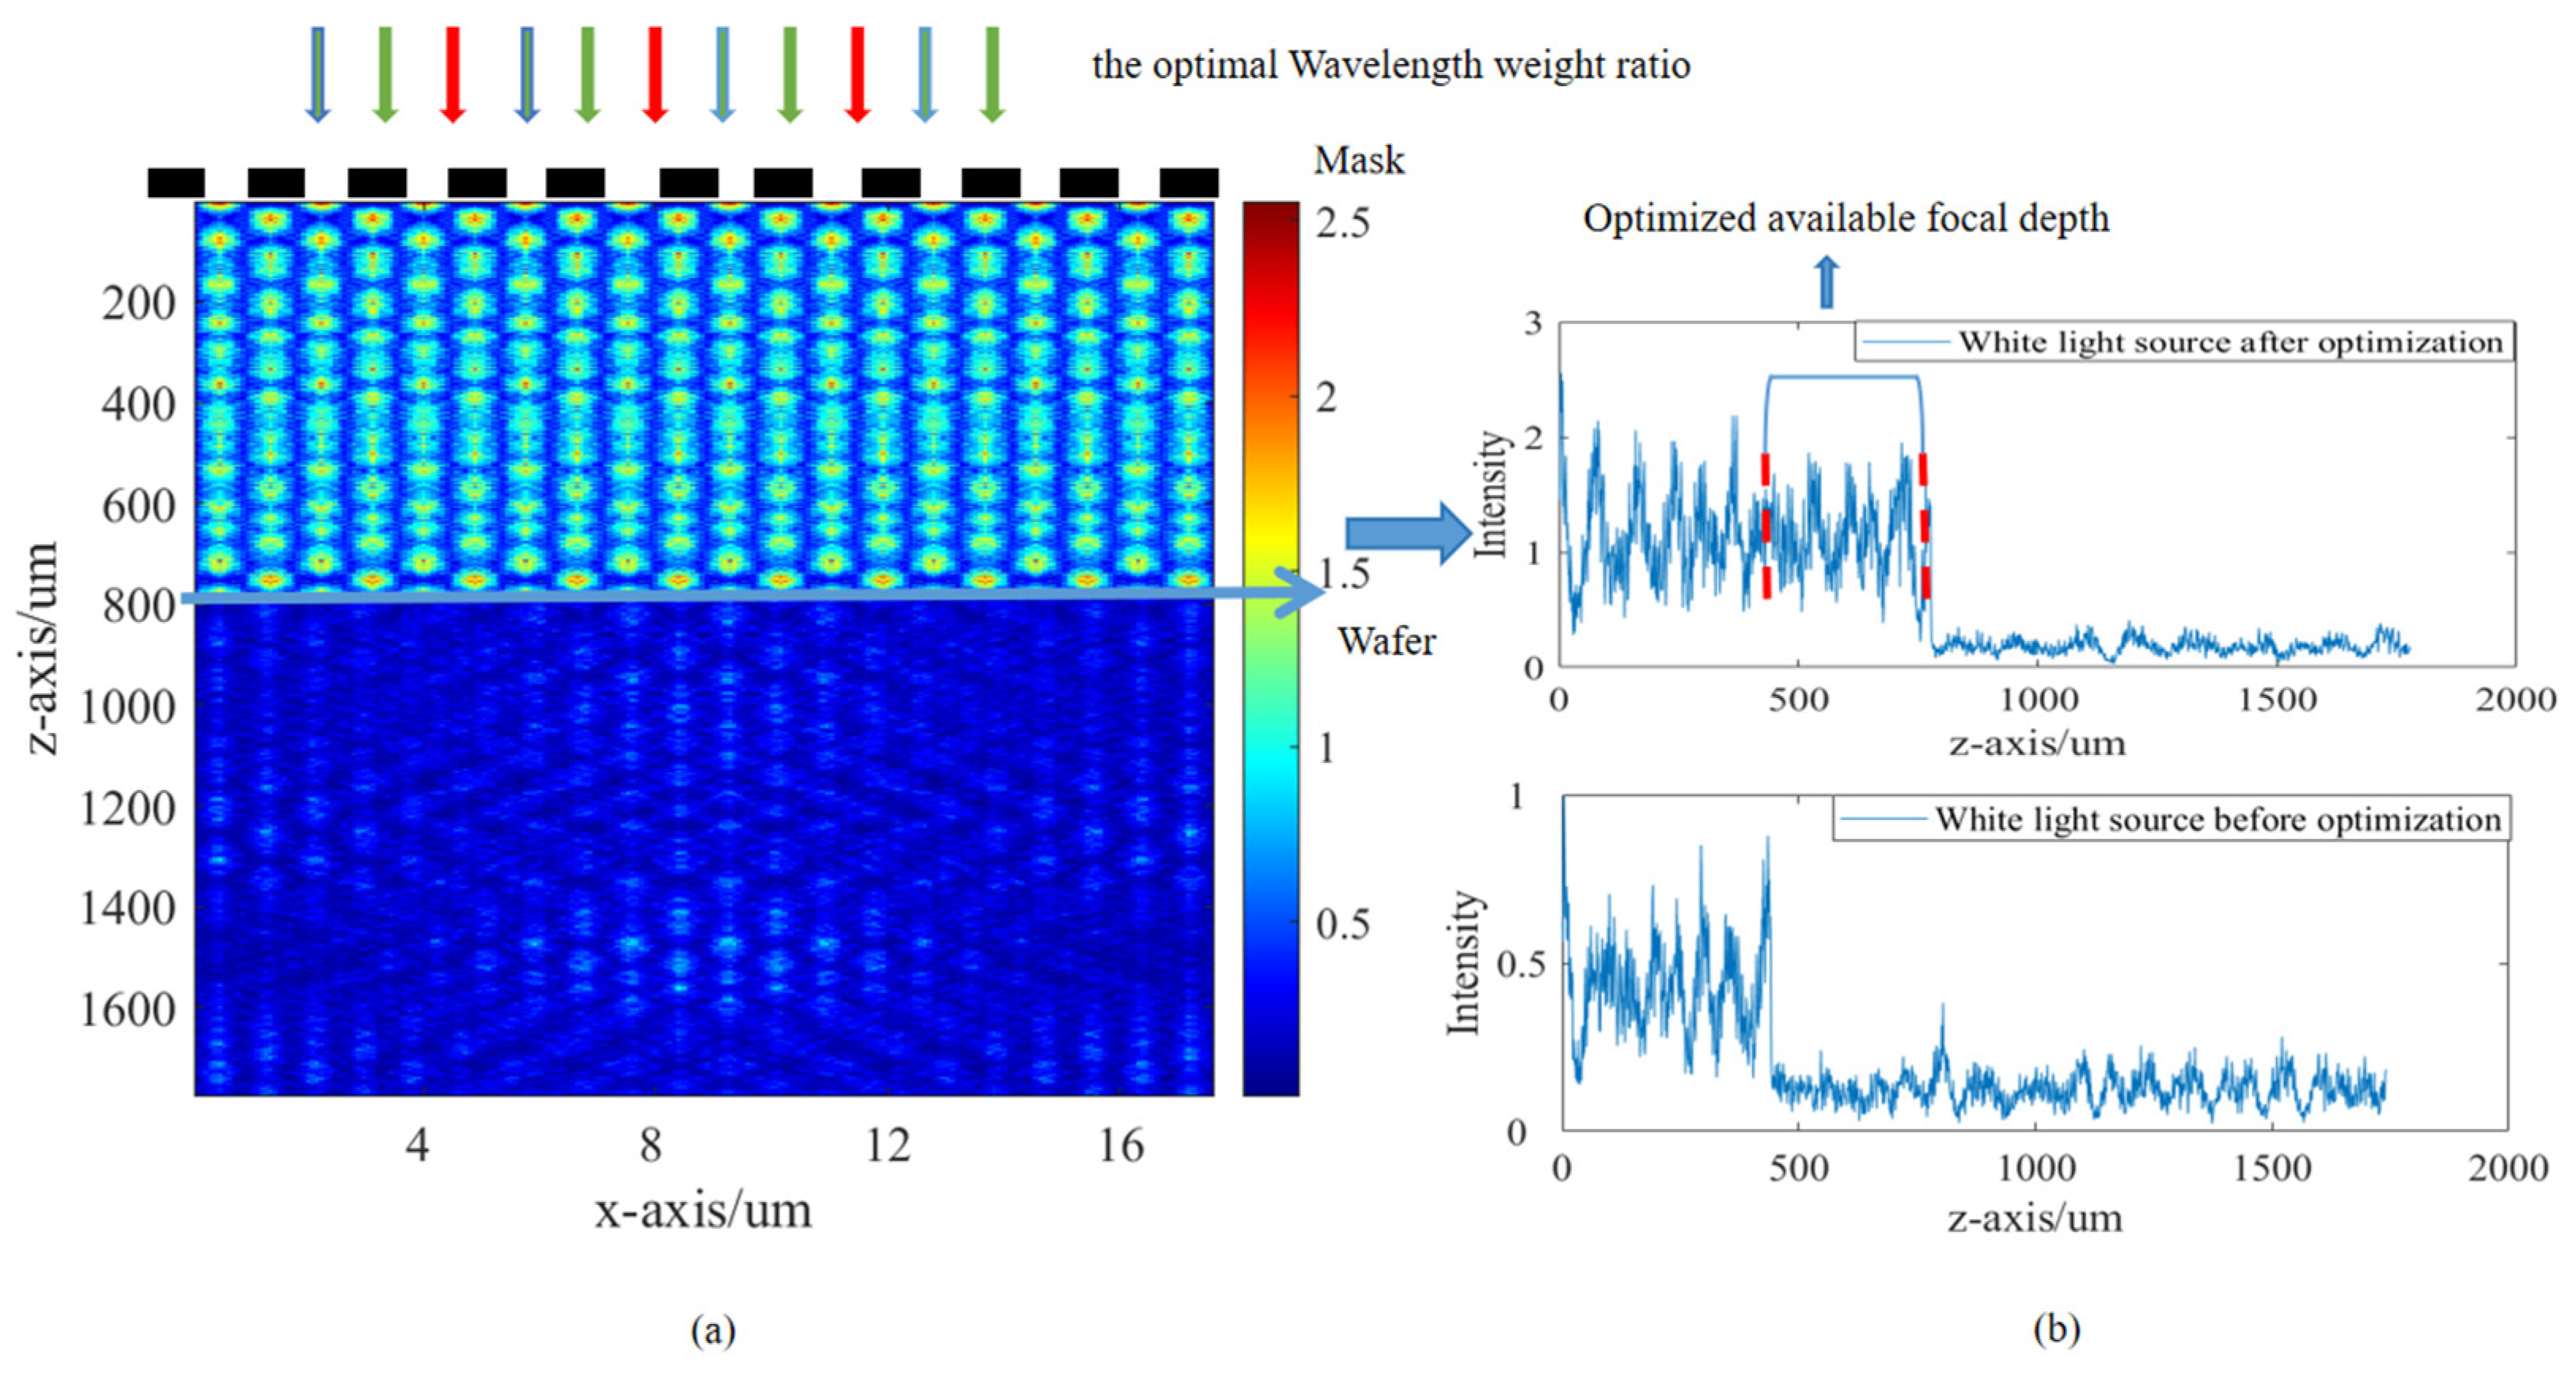
The schematic diagram in Figure 1a illustrates the process. A white light broad–spectrum source is used, and the GA–PSO hybrid algorithm is used to determine the optimal wavelength ratio and form an optimized white light broad–spectrum source through a combination of filters with different wavelengths, and different transmittance light is diffracted through the mask and wafer separately, after passing through the collimated beam expansion system. The diffracted light is absorbed by the objective lens and transmitted to a CCD camera. The illumination spectrum is shown in Figure 1b and is white light. Among them, the four bands with the highest energy proportion in the white light spectrum (405 nm, 532 nm, 633 nm, and 780 nm) are selected as the targets for optimizing the wavelength ratio. The light field x–z cross-sectional distribution of the diffraction field formed by the optimized white light plane wave is diffracted in the Z direction toward the rectangular line grating mask with a period of 4 μm and a duty cycle of 1:1, as shown in Figure 1(c1). The self-imaging effect will result in a periodic frequency doubling effect in relation to the mask [19]. The distribution passes through the rectangular line grating mask and is diffracted 300 um in the Z direction onto a rectangular line grating with a period of 2 μm and a duty cycle of 1:1, as shown in Figure 1(c2). When the different wavelength components of the white light spectrum are not at their respective Talbot distance, their superpositions will affect the imaging contrast of the Moiré fringe, as shown in Figure 1(d1). Under the illumination of the optimized white light source, the alignment mark of the rectangular line grating on the mask and wafer are overlapped and superimposed to achieve improved Moiré fringe imaging quality, as shown in Figure 1(d2). The relative deviation between the mask and wafer is calculated using the phase distribution of the Moiré fringe, as illustrated in Figure 1(d3).
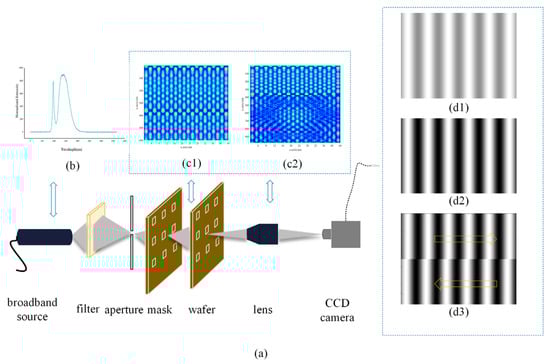
Figure 1.
(a) Principle of broad-spectrum Moiré fringe imaging. (b) White light spectrum. (c1) Light field x–z cross-sectional distribution diagram of the Talbot effect produced under optimized white light source illumination. (c2) Light field x–z cross-sectional distribution diagram of the Moiré effect produced under optimized white light source illumination. (d1) Moiré fringe generation diagram with different wavelength components in the white light spectrum that are not within the Talbot distance. (d2) Moiré fringe generation diagram at the Talbot distance with different wavelength components in the white light spectrum. (d3) Diagram showing the shift in the Moiré fringe phase distribution.
2.2. Depth of Focus Calculation Theory
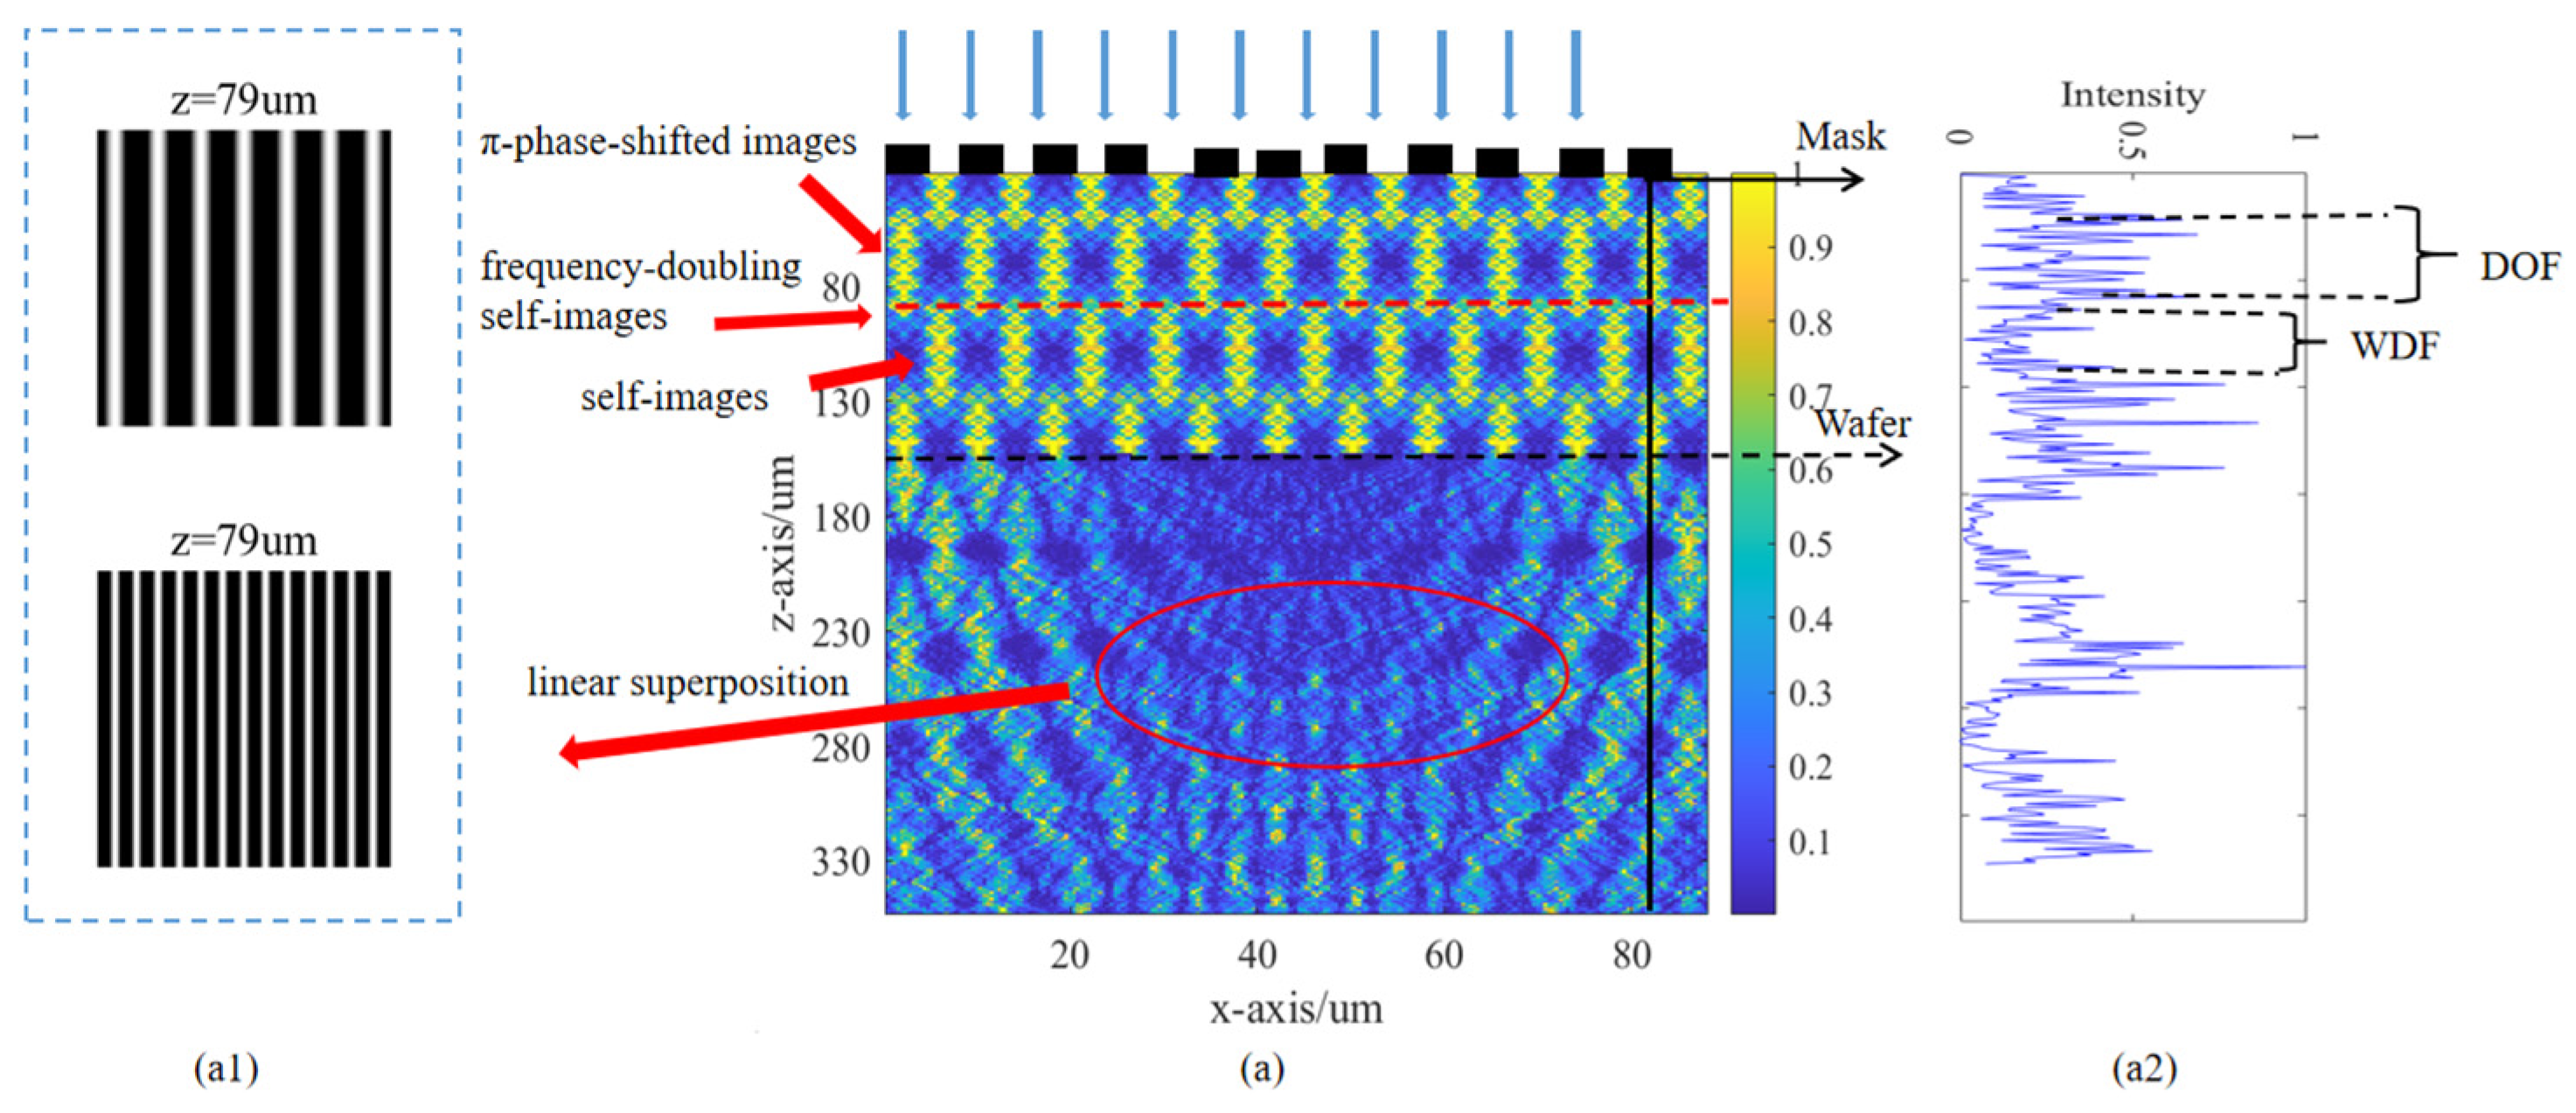
According to scalar diffraction theory, a monochromatic plane wave passes through the periodic micro–nano structure mask along the direction of light field propagation at a distance with a period of . It will produce self-images of a periodic object. -phase–shifted images will also occur at , where m is a positive integer, p is the periodic constant of the mask, and is the incident wavelength. Additionally, at halfway through each propagation period, self–images with -phase–shifted images will also appear. This phenomenon is known as the Talbot effect. It is important to note that this effect is a result of diffraction imaging rather than lens imaging; hence, it is also referred to as the ‘self-imaging effect’. In addition, between self-images and -phase–shifted images, there is also a sub–image of frequency–doubling self–images with weak light intensity. Compared to a grating mask with a period constant of 4 μm, its period is halved, resulting in a doubling of its fringe resolution. This phenomenon is known as the ‘frequency-doubling effect’ [19].
When the self–imaging effect and frequency–doubling effect are used as an alignment mode in the field of lithography, the depth of focus (DOF) becomes an important parameter. The depth of focus (DOF) is defined as the range along the optical axis within which clear imaging can be achieved, representing the actual imaging in the optical system. The tolerance between the surface and the ideal imaging plane. The alignment method based on the Moiré fringe is limited by the Talbot effect, resulting in a small tolerance for the gap between the mask and wafer [15]. It requires precise control of the gap tolerance, i.e., the available DOF, which is an important factor affecting the process requirements of the alignment system.
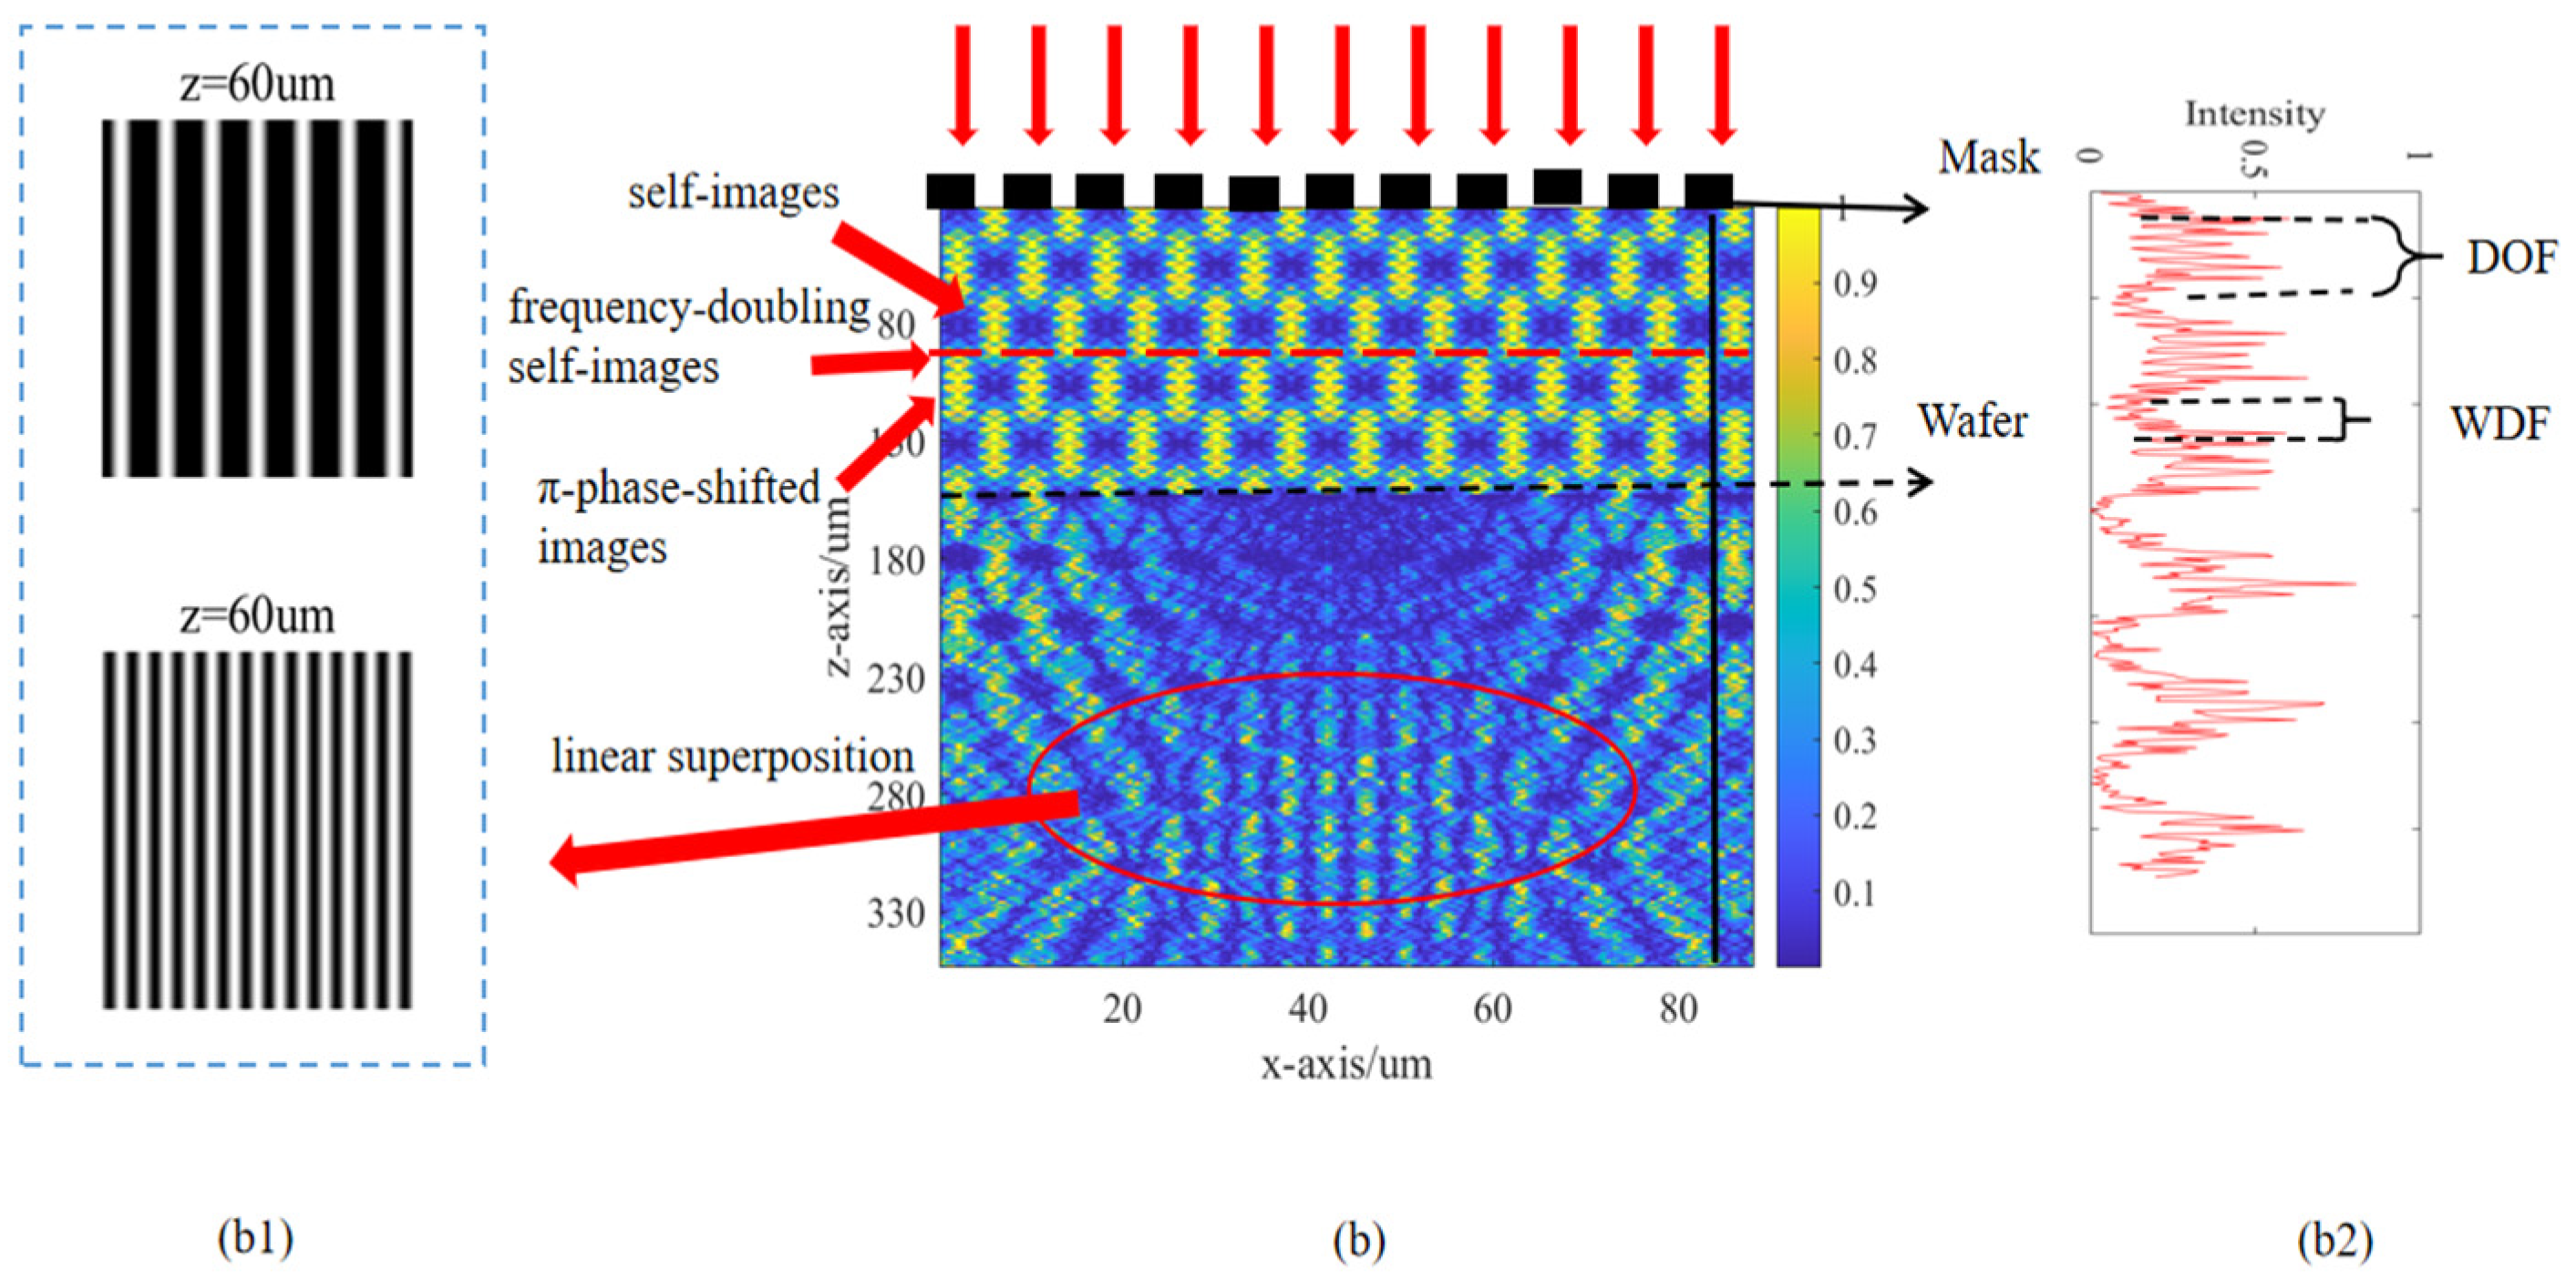
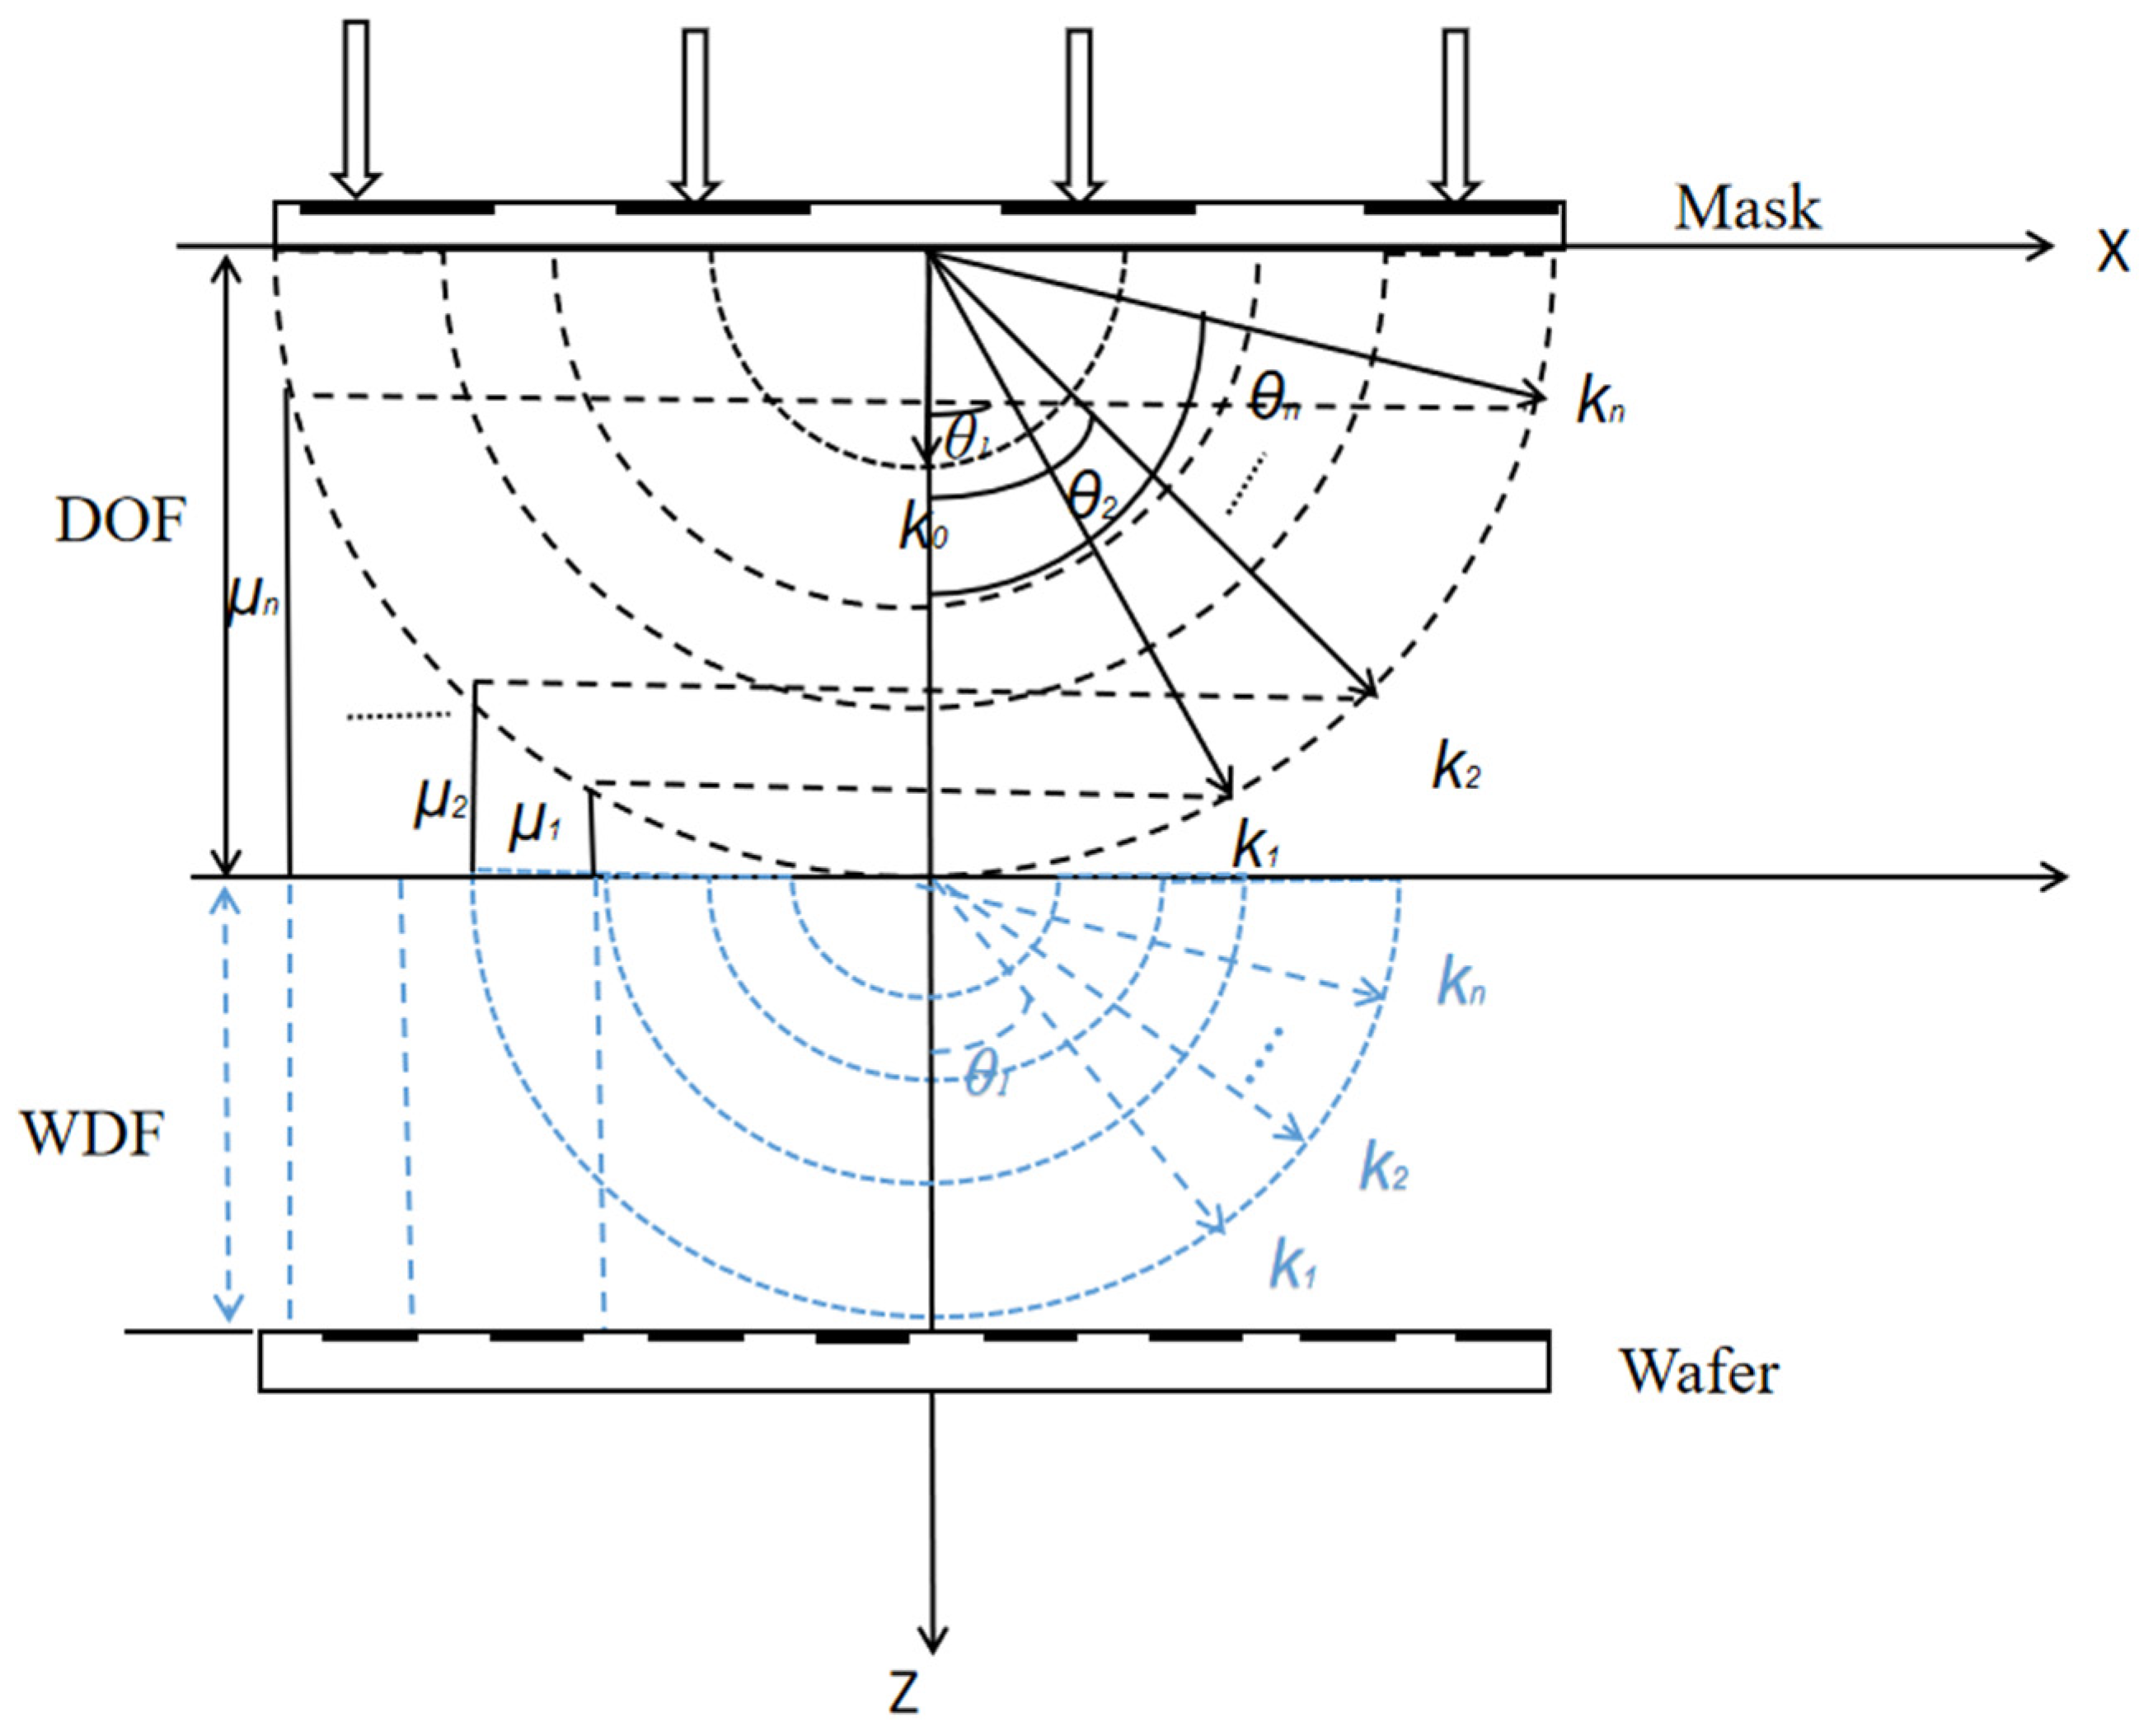
According to the Talbot effect and frequency–doubling effect theory, for a mask with the same periodic constant, the distribution positions of self–images and -phase–shifted images in the optical axis direction will change accordingly if the incident wavelength is different. As shown in Figure 2a,b, the light field x–z cross–sectional distribution of the diffraction field formed by and , respectively, pass through the rectangular line grating mask with a period of 4 μm and a duty cycle of 1:1, along the Z direction, and then pass through a rectangular line grating wafer with a period of 4.4 μm and a duty cycle of 1:1 at the same diffraction distance. It can be observed that the -phase–shifted images and self–images and frequency–doubling self–images, among them, as shown in Figure 2(a1,b1), after passing through the grating mask, and , respectively, correspond to a wafer grating with a period of 4.4 μm and a duty cycle of 1:1, and a wafer grating with a period of 2 μm and a duty cycle of 1:1. The superposition of these gratings generates a Moiré fringe pattern. It can be seen from the pattern that it is consistent with what is described by the frequency doubling effect. Moreover, there is a width of dark field (WDF) between the k-th order image and the k + 1-th order image. That is, the relative light intensity distribution in this area is insignificant. The self–imaging effect will result in wavefront distortion at the actual imaging surface of the wafer. This wavefront distortion can be considered as the linear recombination of the diffraction field generated by each harmonic after the second grating after the incident plane wave is diffracted by the first grating. As shown in Figure 3, it can also be expressed as the outcome of the interaction of the diffraction orders of all the distinct wave vectors.
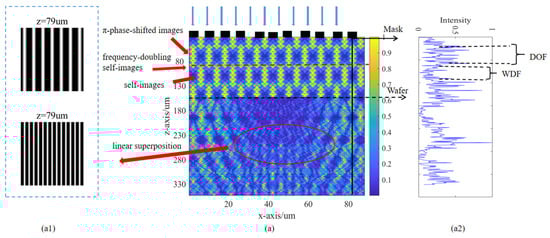
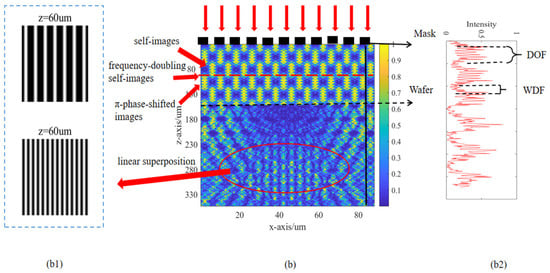
Figure 2.
Light field x–z cross-sectional distribution of unit amplitude plane waves with a single wavelength vertically incident on the Ronchi grating. (a) x–z cross-sectional distribution of incident wavelength (a1) Moiré fringe generation diagram reflected by different Z distances. (a2) Longitudinal normalized light intensity distribution propagating along the Z-axis at a certain point of amplitude-type grating. (b) x–z cross-sectional distribution of incident wavelength (b1) Moiré fringe generation diagram reflected by different Z distances. (b2) Longitudinal normalized light intensity distribution propagating along the Z-axis at a certain point of amplitude-type grating.
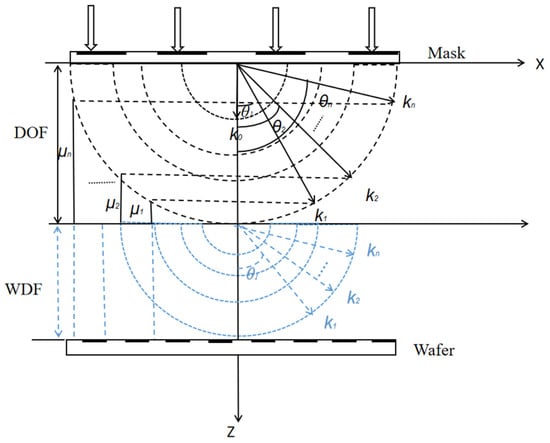
Figure 3.
The depth of focus of the self-images is determined by different wavevectors of all the diffraction orders.
Using zero–order diffraction as a reference:
Therefore, the wavefront distortion introduced by all the diffraction orders can be expressed as:
In the Formula (4), m is the largest diffraction order. At the same time, the depth of focus (DOF) is defined as the wavefront distortion caused by defocus, which cannot exceed one–quarter of the wavelength. Therefore, the depth of focus can be expressed as:
Substituting the diffraction equation into above the Formula (5), the DOF can be expressed as:
It can be seen from Figure 2a,b that the WDF formed between two self–images in the z direction at wavelength is approximately filled by the width of dark field (WDF) at wavelength .
Among them, N is the number of periods during which the light intensity distribution is continuous along the Z–axis. For a rectangular grating mask, the longest WDF can be approximately equal to half of the longest self–imaging distance in the broad-spectrum. The above Formula (7) be approximately derived as:
Among them, . represents the continuous and constant starting distance of light field along the Z axis.
Finally, lithography uses the white light broad–spectrum illumination of , and if Equation (8) is satisfied, the WDF at N times the self–images’ distance from the mask grating will be filled by the superposition of different diffraction light fields. That is, weighted incoherent superposition. This greatly expands the imaging DOF of the longitudinal light field, and at the same time, produces this weighted incoherent superposition on both the self–images and -phase–shifted images and frequency-doubling effect.
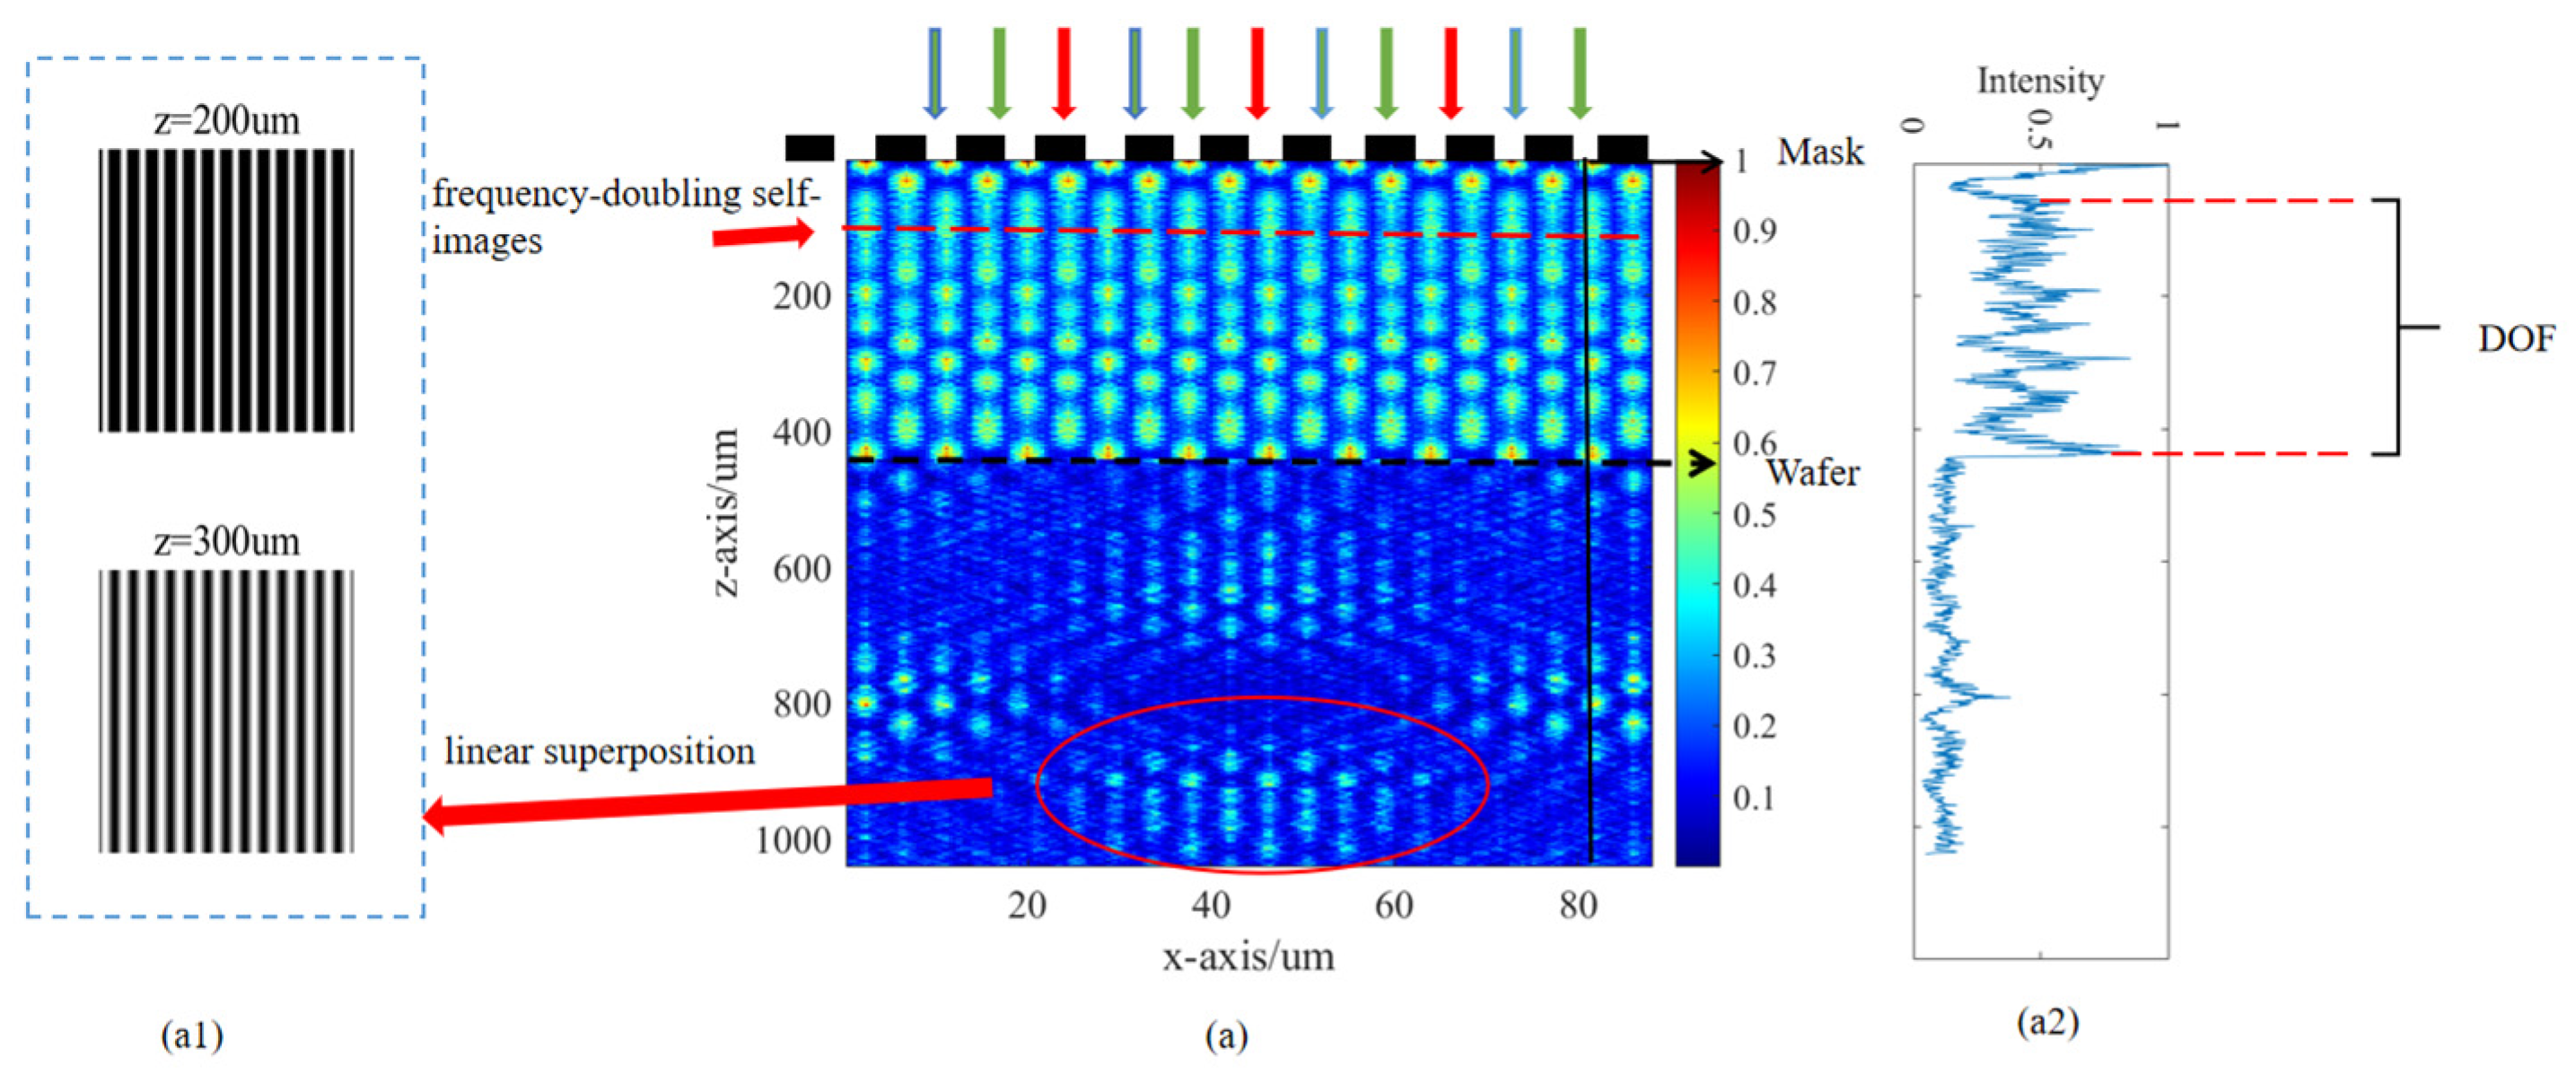
By measuring the white light spectrum, the bands with the highest energy proportion are 405 nm, and 532 nm, and 633 nm, and 780 nm. Under ideal circumstances, assuming that the relative light intensity between the four bands is consistent, the self-imaging light fields of the four bands perform incoherent superposition. They pass through the rectangular line grating mask with a period of 4 μm and a duty cycle of 1:1. In the area of , an ultra–long depth of focus will be formed (relative to the single wavelength case) along the Z direction 420 μm, and then pass through a rectangular line grating wafer with a period of 2 μm and a duty cycle of 1:1. The superposition of these gratings generates a Moiré fringe pattern at the different diffraction distance. The light field x–z cross-sectional distribution shown in Figure 4(a,a1,a2) illustrates that the radio of various wavelengths in the white light source before optimization lead to a depth–DOF but also create a scattered width of dark field, which impacts the contrast of the Moiré fringe. In addition, a depth DOF produced by the broad-spectrum will also result in the frequency doubling effect. Therefore, the period of the wafer should be half of the mask period to achieve a high-quality Moiré fringe.
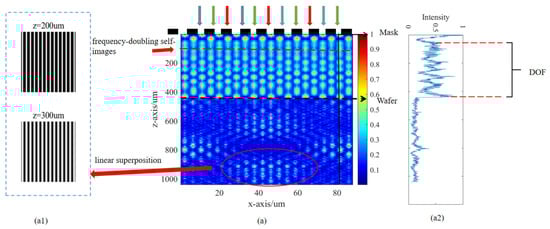
Figure 4.
(a) Light field x–z cross-sectional distribution of the unit amplitude plane waves with the four bands with the highest energy proportion in the white light spectrum (405 nm, 532 nm, 633 nm, and 780 nm) vertically incident on the Ronchi grating. (a1) Moiré fringe generation diagram reflected by different Z distances. (a2) Longitudinal normalized light intensity distribution propagating along the Z–axis at a certain point of amplitude-type grating.
2.3. Wavelength Weight Optimization Theory
In order to achieve the optimal DOF range of the broad–spectrum Moiré fringe imaging model, this paper discusses the GA–PSO hybrid algorithm, which utilizes gradient–free operations, employs the extended depth of field (DOF) in the wavelength weight ratio model used as the objective function, and uses the ratio of the wavelength part with the highest energy in white light (405 nm, 532 nm, 633 nm, 780 nm) as a variable to accurately assess the optimization of the wavelength weight ratio process. The general structure of the optimization process is as follows:
Among them, Formula (9) represents the physical relationship between the depth of focus and wavelength in the broad-spectrum fringe imaging model. represents different wavelengths in white light that exist in the white light spectrum in different ratios . of this paper is mainly taken as the four bands with the highest energy proportion in the white light spectrum (405 nm, 532 nm, 633 nm, and 780 nm), and T represents the period of grating. The function in Formula (10) reaches close to the global maximum during iteration process, with representing the matrix variable of each active light source, which is continuously updated as the algorithm iterates and loops. .
Formulas (11) and (12) represent the constraints and each design variable type for solving the maximization problem of Formula (10). Formula (11) represents that the sum of all the wavelength weight ratio factors is 1. Formula (12) represents the lower bound set for the design wavelength variable, and represents the upper bound set for the design wavelength variable.
Previous research has shown that using a method that combines multiple heuristic algorithms is more effective than applying these heuristic algorithms individually [20]. This paper utilizes the GA–PSO hybrid algorithm to address the engineering optimization problem of the wavelength weight ratio design variables. In the hybrid algorithm proposed in this paper, the mutation and crossover operations of the genetic algorithm (GA) are utilized to broaden the search range of the wavelength weight ratio variable. The objective of incorporating the GA is to enhance the diversity of the initial population. Subsequently, these updated variables undergo a PSO cycle. By applying the PSO search process, the fitness value of individuals in the population can be improved, enabling the PSO to quickly obtain the optimal solution. Furthermore, the populations with higher fitness values achieved after the GA and PSO cycles are restricted in order to attain the optimal solution that satisfies the conditions.
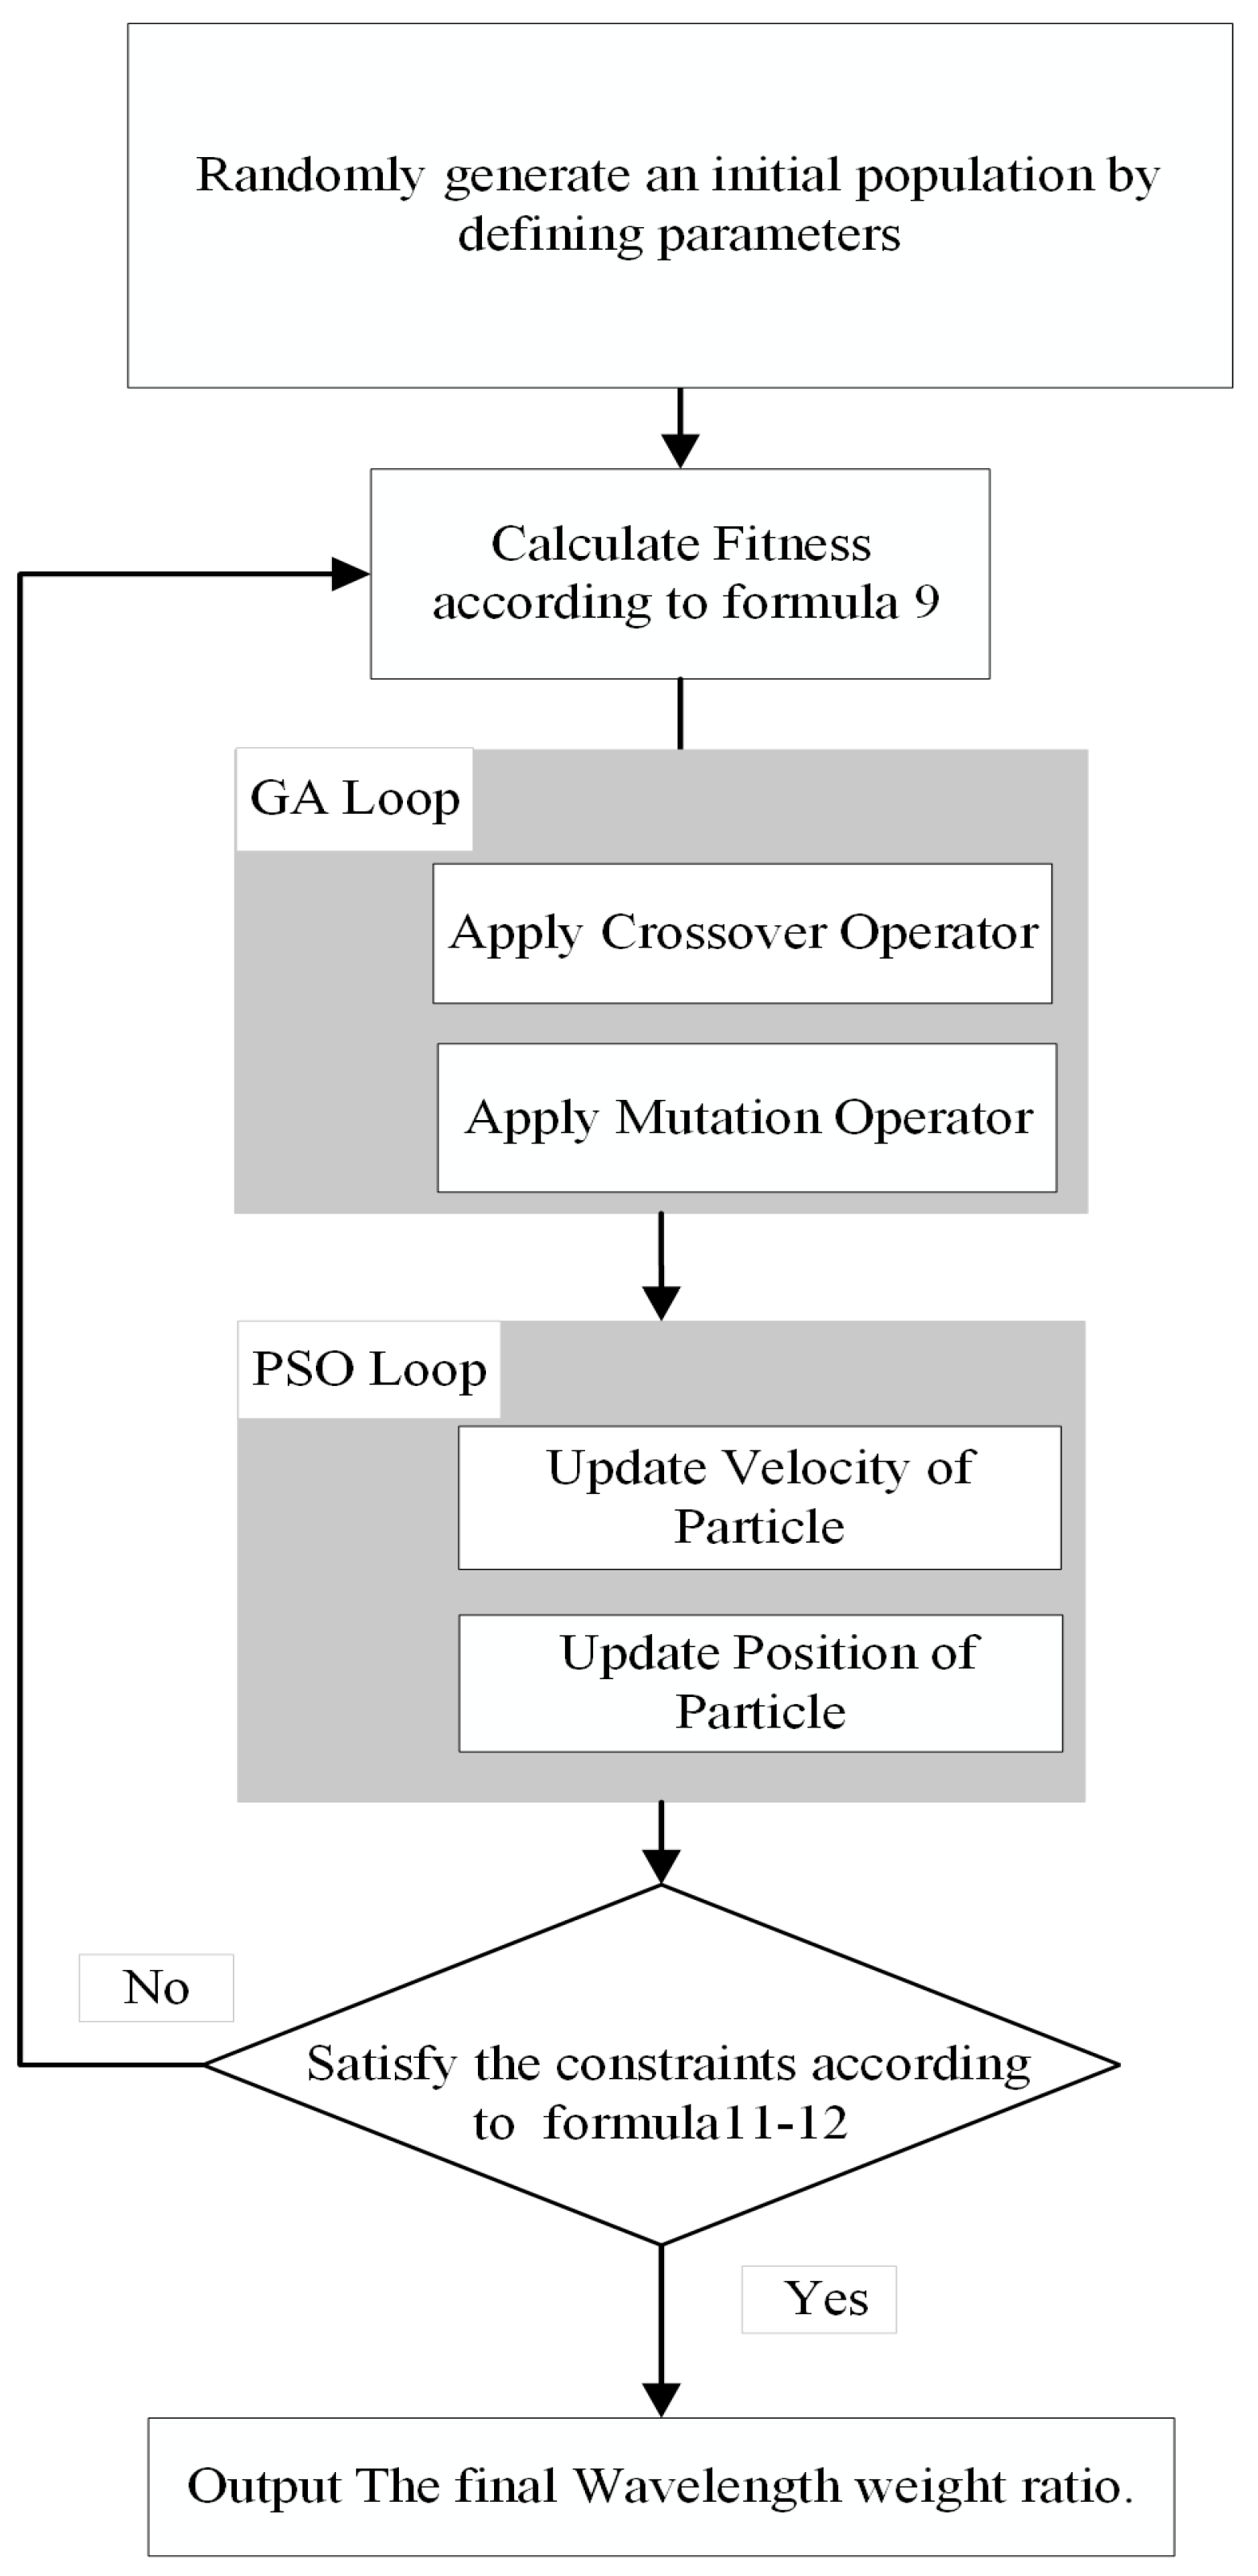
The GA–PSO hybrid optimization algorithm flow is shown in Figure 5. The randomly generated initial population P is used to calculate the fitness function value of each particle in the population P, according to the wavelength weight ratio calculation model in Formula (9). To enhance the diversity of the hybrid algorithms, the genetic algorithm (GA) uses the mutation operation to introduce random updates over an increasing number of iterations. Through a multi-point crossover strategy, the randomness of the variable update process is enhanced, expanding the search scope. Furthermore, the population P resulting from the mutation and crossover operations of the GA is used as input for the particle swarm optimization model (PSO). Non-linear adaptive control in the PSO algorithm is used to enhance the search efficiency during the optimization process. Implementing this strategy can decrease the likelihood of becoming stuck in a local optimum. Combining GA and PSO can enhance both the exploration and exploitation capabilities simultaneously. By combining GA and PSO, the optimized weight ratio is applied to the constraints. The purpose of imposing constraints is to enhance the likelihood of finding an optimal solution.
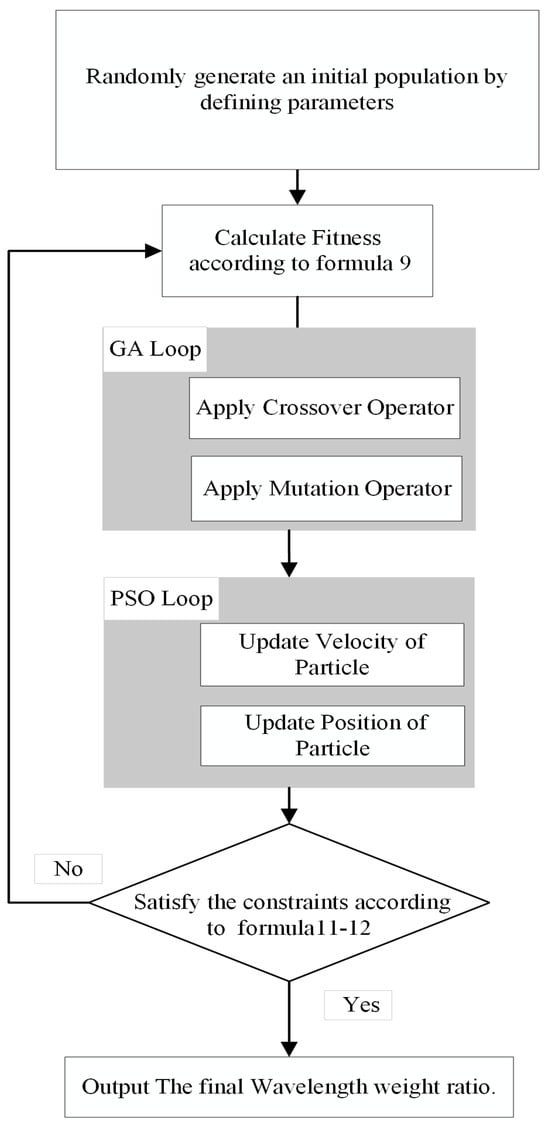
Figure 5.
Flow chart of the proposed GA–PSO hybrid algorithm.
For the optimal weight ratio problem, as shown in Algorithm 1, the detailed implementation process of the GA–PSO algorithm.
| Algorithm 1: | Flow of the GA–PSO hybrid algorithm in the wavelength weight ratio simulation. |
| Input: Output: | ; ); |
| Step1: | t ← 1 (initialization); ) using the random function; evaluate P(t) using (9); |
| Step2: | While For if η < η1, then//crossover operation create G(t + 1) from P(t) by crossover routine;// End End For i = 1 to NP If then//mutation operation create G(t + 1) from P(t) by mutation routine;// End End For i = 1 to NP //PSO loop End End For i = 1 to NP//Restrictions End |
Using the optimization problem above, the initial variable is set as the ratio of the wavelength part with the highest energy in white light (405 nm, 532 nm, 633 nm, 780 nm). The number of iterations is set to 100, and these initial conditions are then substituted into the GA–PSO hybrid algorithm for comparative analysis of the optimization effects of several established individual heuristic algorithms currently in use.
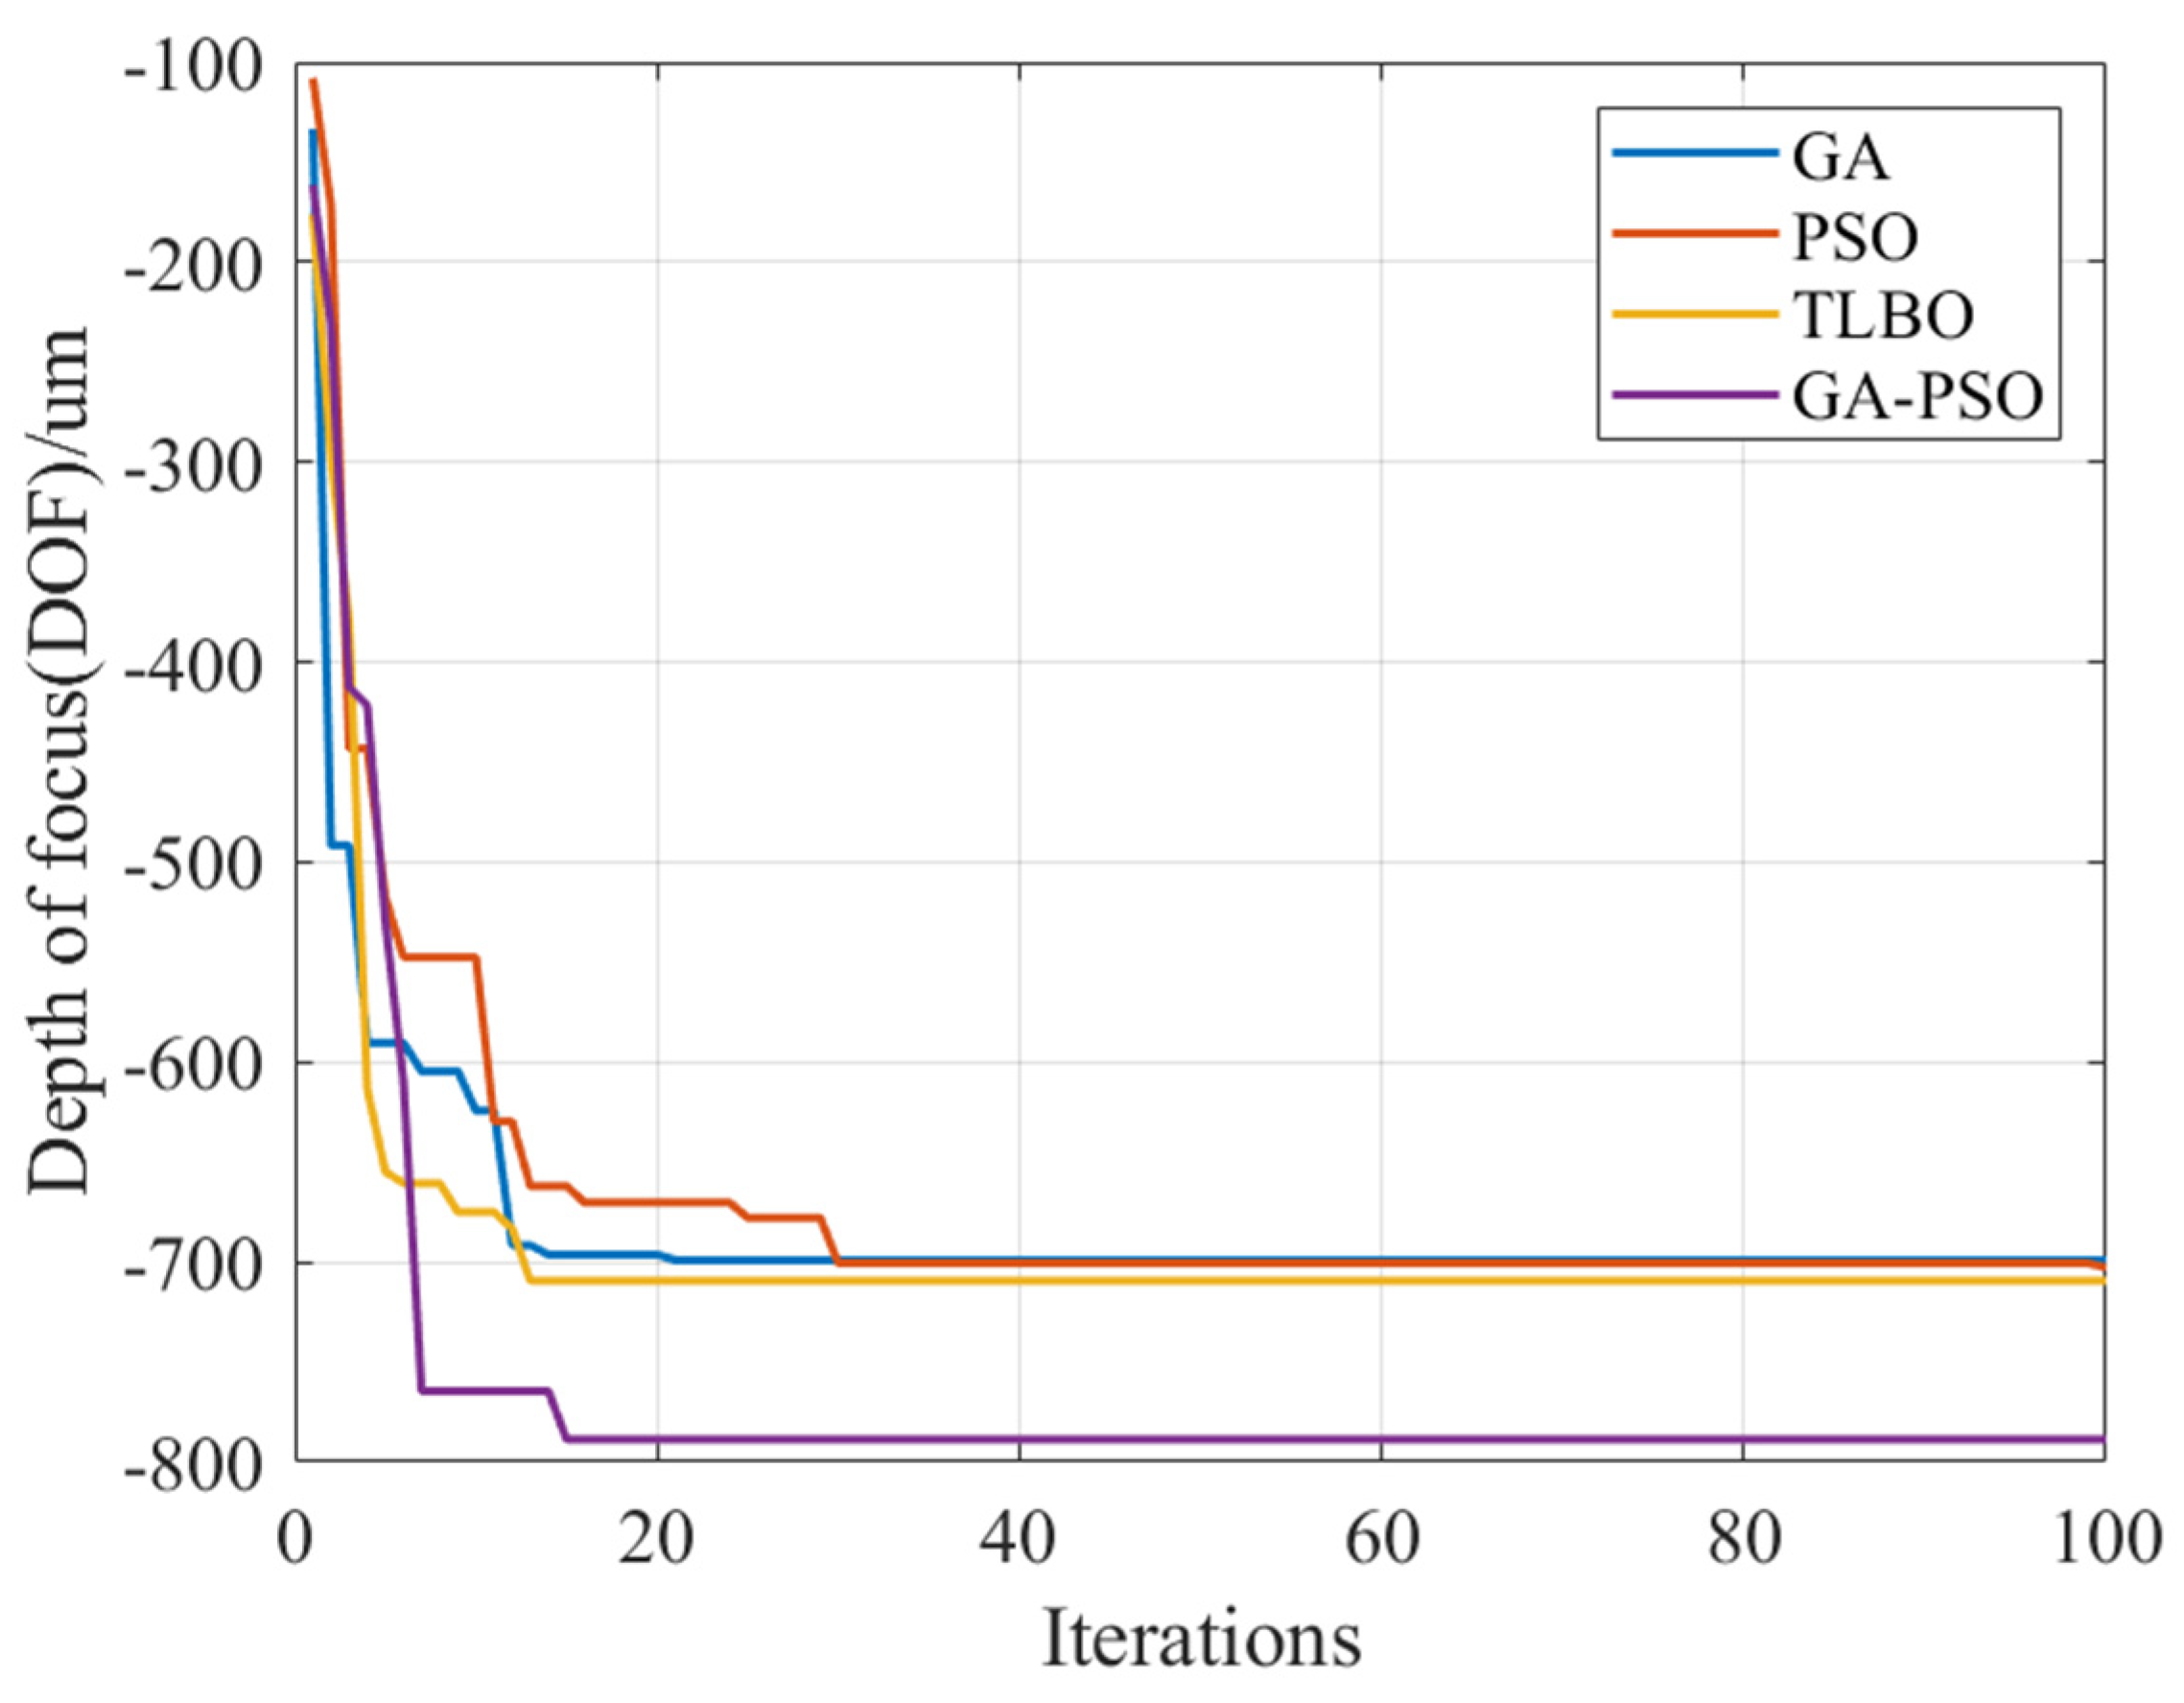
It is evident from Figure 6 that the GA–PSO hybrid method significantly improves the optimization in the initial stages, Among them, since the optimization goal is to expand the depth of focus, the abscissa represents the number of iterations, the ordinate represents the depth of focus range, and the negative sign on the ordinate represents the positive direction of z-–axis diffraction. The GA and PSO and TLBO algorithms will complicate the optimization model by introducing a large number of optimization variables. This can cause the iterative process to prematurely converge to a local optimum and slow down the search speed of the method. Its performance in searching for GA is weaker compared to the weight ratio optimization results obtained via the genetic algorithm. The convergence curve of the GA–PSO algorithm indicates a tendency to maintain stability around iteration 40. The genetic algorithm has strong generalization ability. Combining PSO with the genetic algorithm in the weight ratio model can significantly enhance the optimized efficiency of the point variable matrix of light source. The search range can be expanded outward based on the local optimum, thereby bringing the variable matrix closer to the global optimal value. The optimization effect in Figure 7 confirms that the combination of PSO and GA can enhance the optimization capability of the wavelength weight ratio model. The XZ cross–sectional distribution in Figure 7a illustrates that the WDF formed between the self-images of different wavelengths is well covered, resulting in a continuous light field distribution. However, it should be noted that there will always be a frequency–doubling effect occurring simultaneously. Therefore, a periodic frequency–doubling grating relative to the mask grating needs to be placed on the wafer. The normalized distribution of the white light source before and after optimization can be seen in Figure 7b. The comparison results show that, compared with the white light source before optimization, the white light source after optimization is more stable, and the DOF has also increased from 400 μm to 800 μm.
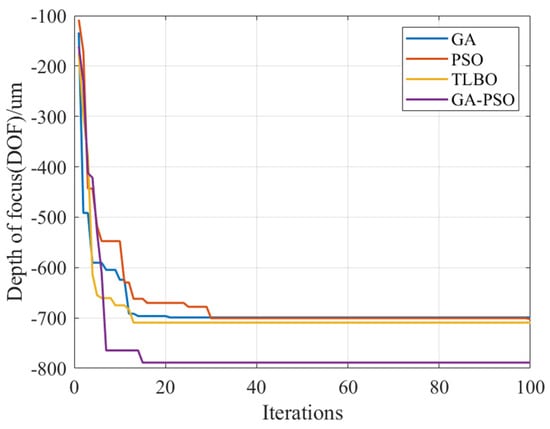
Figure 6.
Convergence behaviors of each approach for the depth of focus (the wavelength part with the highest energy in white light (405 nm, 532 nm, 633 nm, 780 nm)).
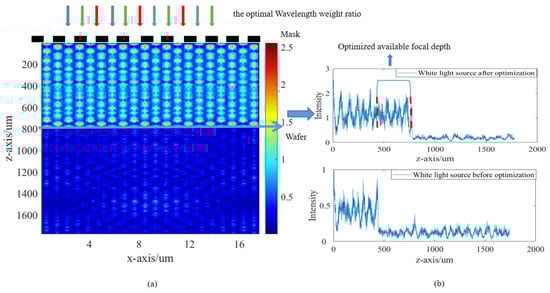
Figure 7.
(a) Light field x–z cross-sectional distribution of unit amplitude plane waves with the four bands with the highest energy proportion in the white light spectrum (405 nm, 532 nm, 633 nm, and 780 nm) with the GA–PSO optimized wavelength ratio vertically incident on the Ronchi grating. (b) Longitudinal normalized light intensity distribution propagating along the Z–axis at a certain point of amplitude–type grating with the white light source after optimization (top) and the white light source before optimization (bottom).
3. Alignment Precision Analysis
The main factors that affect the precision of the Moiré fringe alignment are the generation of the Moiré fringe, alignment process, fringe imaging, and post–processing. When the grating is at a Talbot distance of different orders of magnitude, the contrast of the Moiré fringe image varies significantly. There are numerous factors that can interfere with the phase extraction of the Moiré fringe. For instance, when the Moiré fringe is at an odd Talbot distance, they will undergo a phase shift, which can impact the accuracy of the image extraction [17]. And in actual scenarios, the grating mark on the wafer and alignment mark on the mask often show specific angular displacement and out–of–plane tilt [16]. During the phase extraction process, the alignment mark on the mask and wafer should be parallel. Otherwise, an inclined Moiré fringe will be generated, significantly impacting the accuracy of the fringe extraction. Any misalignment will result in phase extraction errors. Therefore, to determine whether the extended DOF resulting from the broad–spectrum affects alignment precision of the Moiré fringe, it was compared with the well–established Moiré fringe formed by a single wavelength.
In this paper, a method that combines two–dimensional Fourier transform and two–dimensional Hanning window filter function is used to filter the line stripes of a single frequency. At the same time, the least squares method is used for phase analysis in the phase extraction. By performing a two–dimensional Fourier transform on the input signal, the discrete Fourier transform (DFT) is generally more advantageous in image processing than the Fourier transform. For function F(u, v) with an image size of M × N, its two–dimensional DFT expression is:
Among them, x, y are variables in the image or spatial domain, while u and v are variables in the transformation or frequency domain.
The frequency spectrum and phase of the Fourier transform can be expressed as:
Among them, R(u, v) is the real part of F(u, v), and I(u, v) is the imaginary part of F(u, v).
Since the stripe information occurs at a single frequency, the 2–D Hanning window function is used as a notch filter to obtain the effective spectrum of the stripes. The expression of the filter is as follows:
Among them, T represents the two–dimensional spectrum range that needs to be filtered. By carefully selecting T and multiplying it with the spectrum of the entire image, unwanted elements such as background and noise can be filtered out.
There is a specific relationship between the misalignment offset of the grating mark and the phase offset of the Moiré fringe pattern [14], which can be expressed as follows:
Among them, represents the phase offset of the Moiré fringe, represents the misalignment offset of the grating mark, and represent the spatial frequencies of two rectangular line gratings, respectively.
As shown in Figure 8a, the noise will be reflected in the Moiré fringe phase distribution. The 2–D Hanning window function in Figure 8b is utilized to filter out the modulation noise. Subsequently, the alignment deviation of the image is obtained via phase unwrapping the Moiré fringe image using the least squares method shown in Figure 8c. As indicated in Table 1, the single wavelength 405 nm and white light source after optimization are incident on the rectangular line grating mask with a period of 4 μm and a duty cycle of 1:1. The Moiré fringe produced by the superposition of 100 um diffraction in the Z direction and the rectangular line grating wafer with a period of 2 μm and a duty cycle of 1:1. This can be seen from the phase extraction of the Moiré fringe. The phase extraction accuracy of a single wavelength Moiré fringe ranges from −0.03 to 0.04 rad, while the phase extraction accuracy of a broad–spectrum Moiré fringe ranges from −0.04 to 0.053 rad. The phase extraction accuracy error range for both is 0.01–0.022 rad, with an average difference of 0.015 rad, if the alignment system uses two–line gratings with periods of 4 μm and 4.4 μm, respectively, and 10× stripe magnification imaging lens. Taking the single wavelength phase offset extraction accuracy of 0.01 rad in Table 1 as an example, using Equation (18), we can calculate the alignment system precision to be 3.3 nm. Compared to a single wavelength, the alignment precision of the broad–spectrum Moiré fringe has decreased by an average of 0.0495 nm, equivalent to a 1.5% reduction in the original alignment precision. However, the alignment precision can still reach 3.795 nm. If the aforementioned conditions remain consistent and the wafer period is changed to 2 μm, the alignment precision can reach 2.1 nm, with an accuracy loss of 0.0315 nm. If the system utilizes a fine line grating with a smaller period in conjunction with a high–magnification stripe imaging lens, the alignment precision can achieve sub–nanoscale accuracy.
Figure 8.
The phase analysis process involves: (a) analyzing the Moiré fringe phase distribution with noise and relative movement in the x direction, (b) applying the two–dimensional Hanning window filtering model, and (c) using the least squares method to modulate the phase of the Moiré fringe phase distribution.

Table 1.
Alignment precision between the single wavelength and broad–spectrum.
As depicted in Table 1, accuracy analysis of the noise resistance [18], translation amount [14], and tilt amount [16] was conducted for the Moiré fringe. In terms of noise filtering, Gaussian noise with a mean value of 0 and variances of 0.005, 0.03, and 0.8 is added. These three sets of fringes are analyzed using the two–dimensional Fourier transform combined with the two–dimensional Hanning window method proposed in this paper. After calculating and comparing with the standard preset phase difference, we found an error in the accuracy of the single wavelength phase difference extraction. The range is −0.04~0.03 radians (refer to Single Wavelength Type Noise module patterns 1–3 in Table 1). The margin of error for the broad–spectrum phase difference extraction accuracy is −0.05~0.029 radians (see Multiple Wavelength Type Noise module pattern1–3 in Table 1). It is evident that the combination of the two–dimensional Fourier transform and two–dimensional variable Hanning window function can effectively filter out the noise from the fringe pattern and extract the phase difference more accurately. After two gratings with periods of 4 μm and 2 μm move relative to each other by 1/16 Pa, 1/8 Pa, and 1/2 Pa (Pa refers to the half-average period of the two gratings, which is 2.095 μm), the Moiré fringes generated are superimposed. After phase analysis, the mean square error of the displacement deviation for a single wavelength is 0.0015 μm, 0.0042 μm, and 0.0061 μm, respectively (refer to Table 1, Single Wavelength Type Translation Module, patterns 1–3). The root mean square error of the multi–wavelength displacement deviation is 0.0016 μm, 0.0037 μm, and 0.0059 μm, respectively (refer to Multiple Wavelength Type Translation module pattern1–3 in Table 1). These results indicate that the difference in wavelength does not impact the measurement of the stripe alignment deviation. During the alignment process of the mask and wafer, if the wafer and mask are tilted, the resulting Moiré fringe will also change [16]. An angle measurement of 0.03° can be obtained by performing phase analysis on the tilt fringes generated using the single wavelength and broad-spectrum methods, as shown in the Single Wavelength and Broad–spectrum Type Tilt module patterns 1–3 in Table 1.
4. Discussion
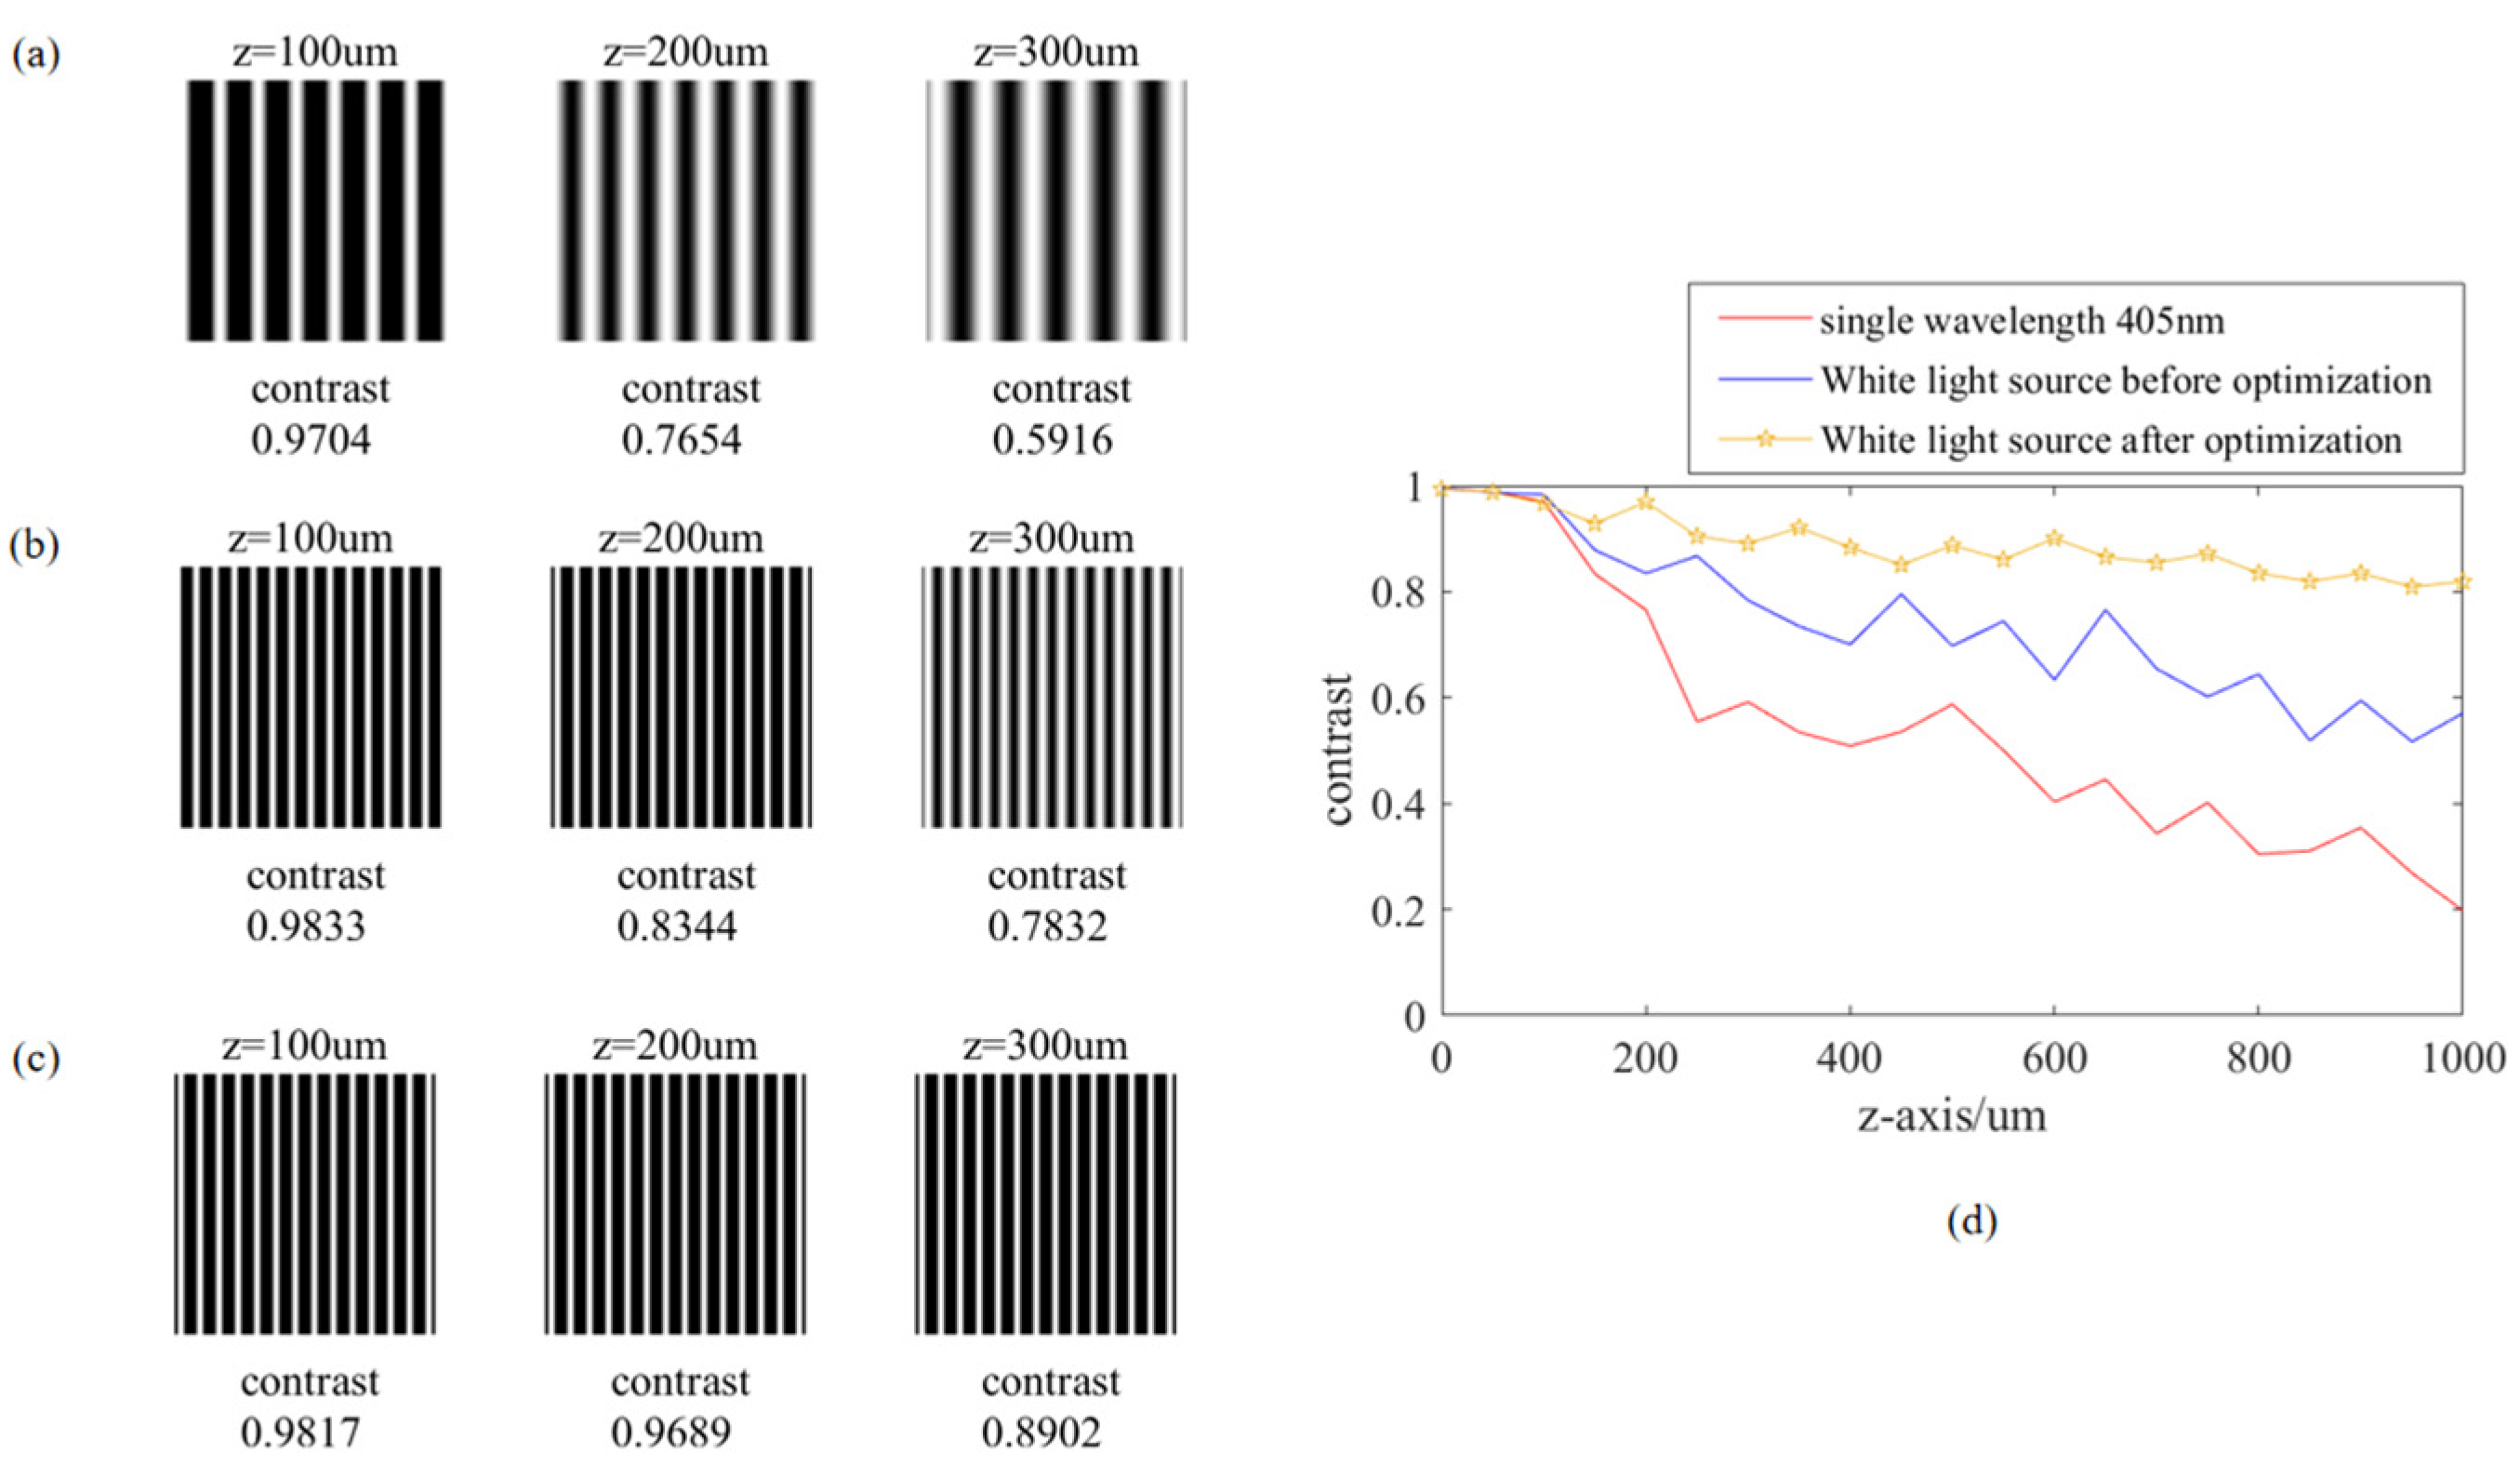
The model proposed in this paper effectively combines the advantages of different approaches and applies broad–spectrum modulation to a Moiré fringe alignment system. Based on the Moiré pattern formed by the white light broad–spectrum light source, we conducted a quantitative contrast analysis and established three control groups (single wavelength 405 nm, white light source before optimization, and white light source after optimization) with the same gap. As shown in Figure 9a–c, among them, a Moiré fringe is formed by a single wavelength of 405 nm, respectively, incident on a 4 um grating mask and a 4.4 um grating wafer, while due to frequency doubling effect of a white broad–spectrum light source, a 4 um grating mask and a 2 um grating wafer, respectively, formed a Moiré fringe. We calculated the contrast of the Moiré fringe generated in the area. The Moiré fringe contrast is calculated according to the principle [14]. As shown in Figure 9d, through comparative analysis, as the gap between the mask and wafer increases, the Moiré fringe contrast generated by a single wavelength decreases in a step–like manner and the Moiré fringe contrast generated by the white light source decreases slowly before optimization. The overall fluctuation is large, which can easily affect the Moiré fringe analysis. Although the fringe contrast generated by the white light source after optimization fluctuates up and down, it generally tends to be stable and maintains a contrast ratio above 0.8.
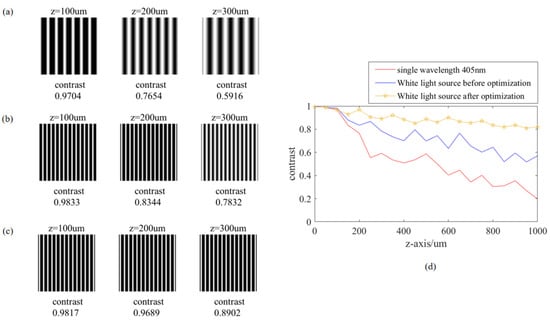
Figure 9.
(a) A single wavelength of 405 nm illuminates the rectangular line grating mask and wafer, creating a Moiré fringe at varying gaps. (b) White light source before optimization illuminates the rectangular line grating mask and wafer, creating a Moiré fringe at varying gaps. (c) White light source after optimization illuminates the rectangular line grating mask and wafer, creating a Moiré fringe at varying gaps. (d) The comparison of the Moiré fringe contrast between the three (405 nm, white light source before optimization, and white light source after optimization) in the same spatial region.
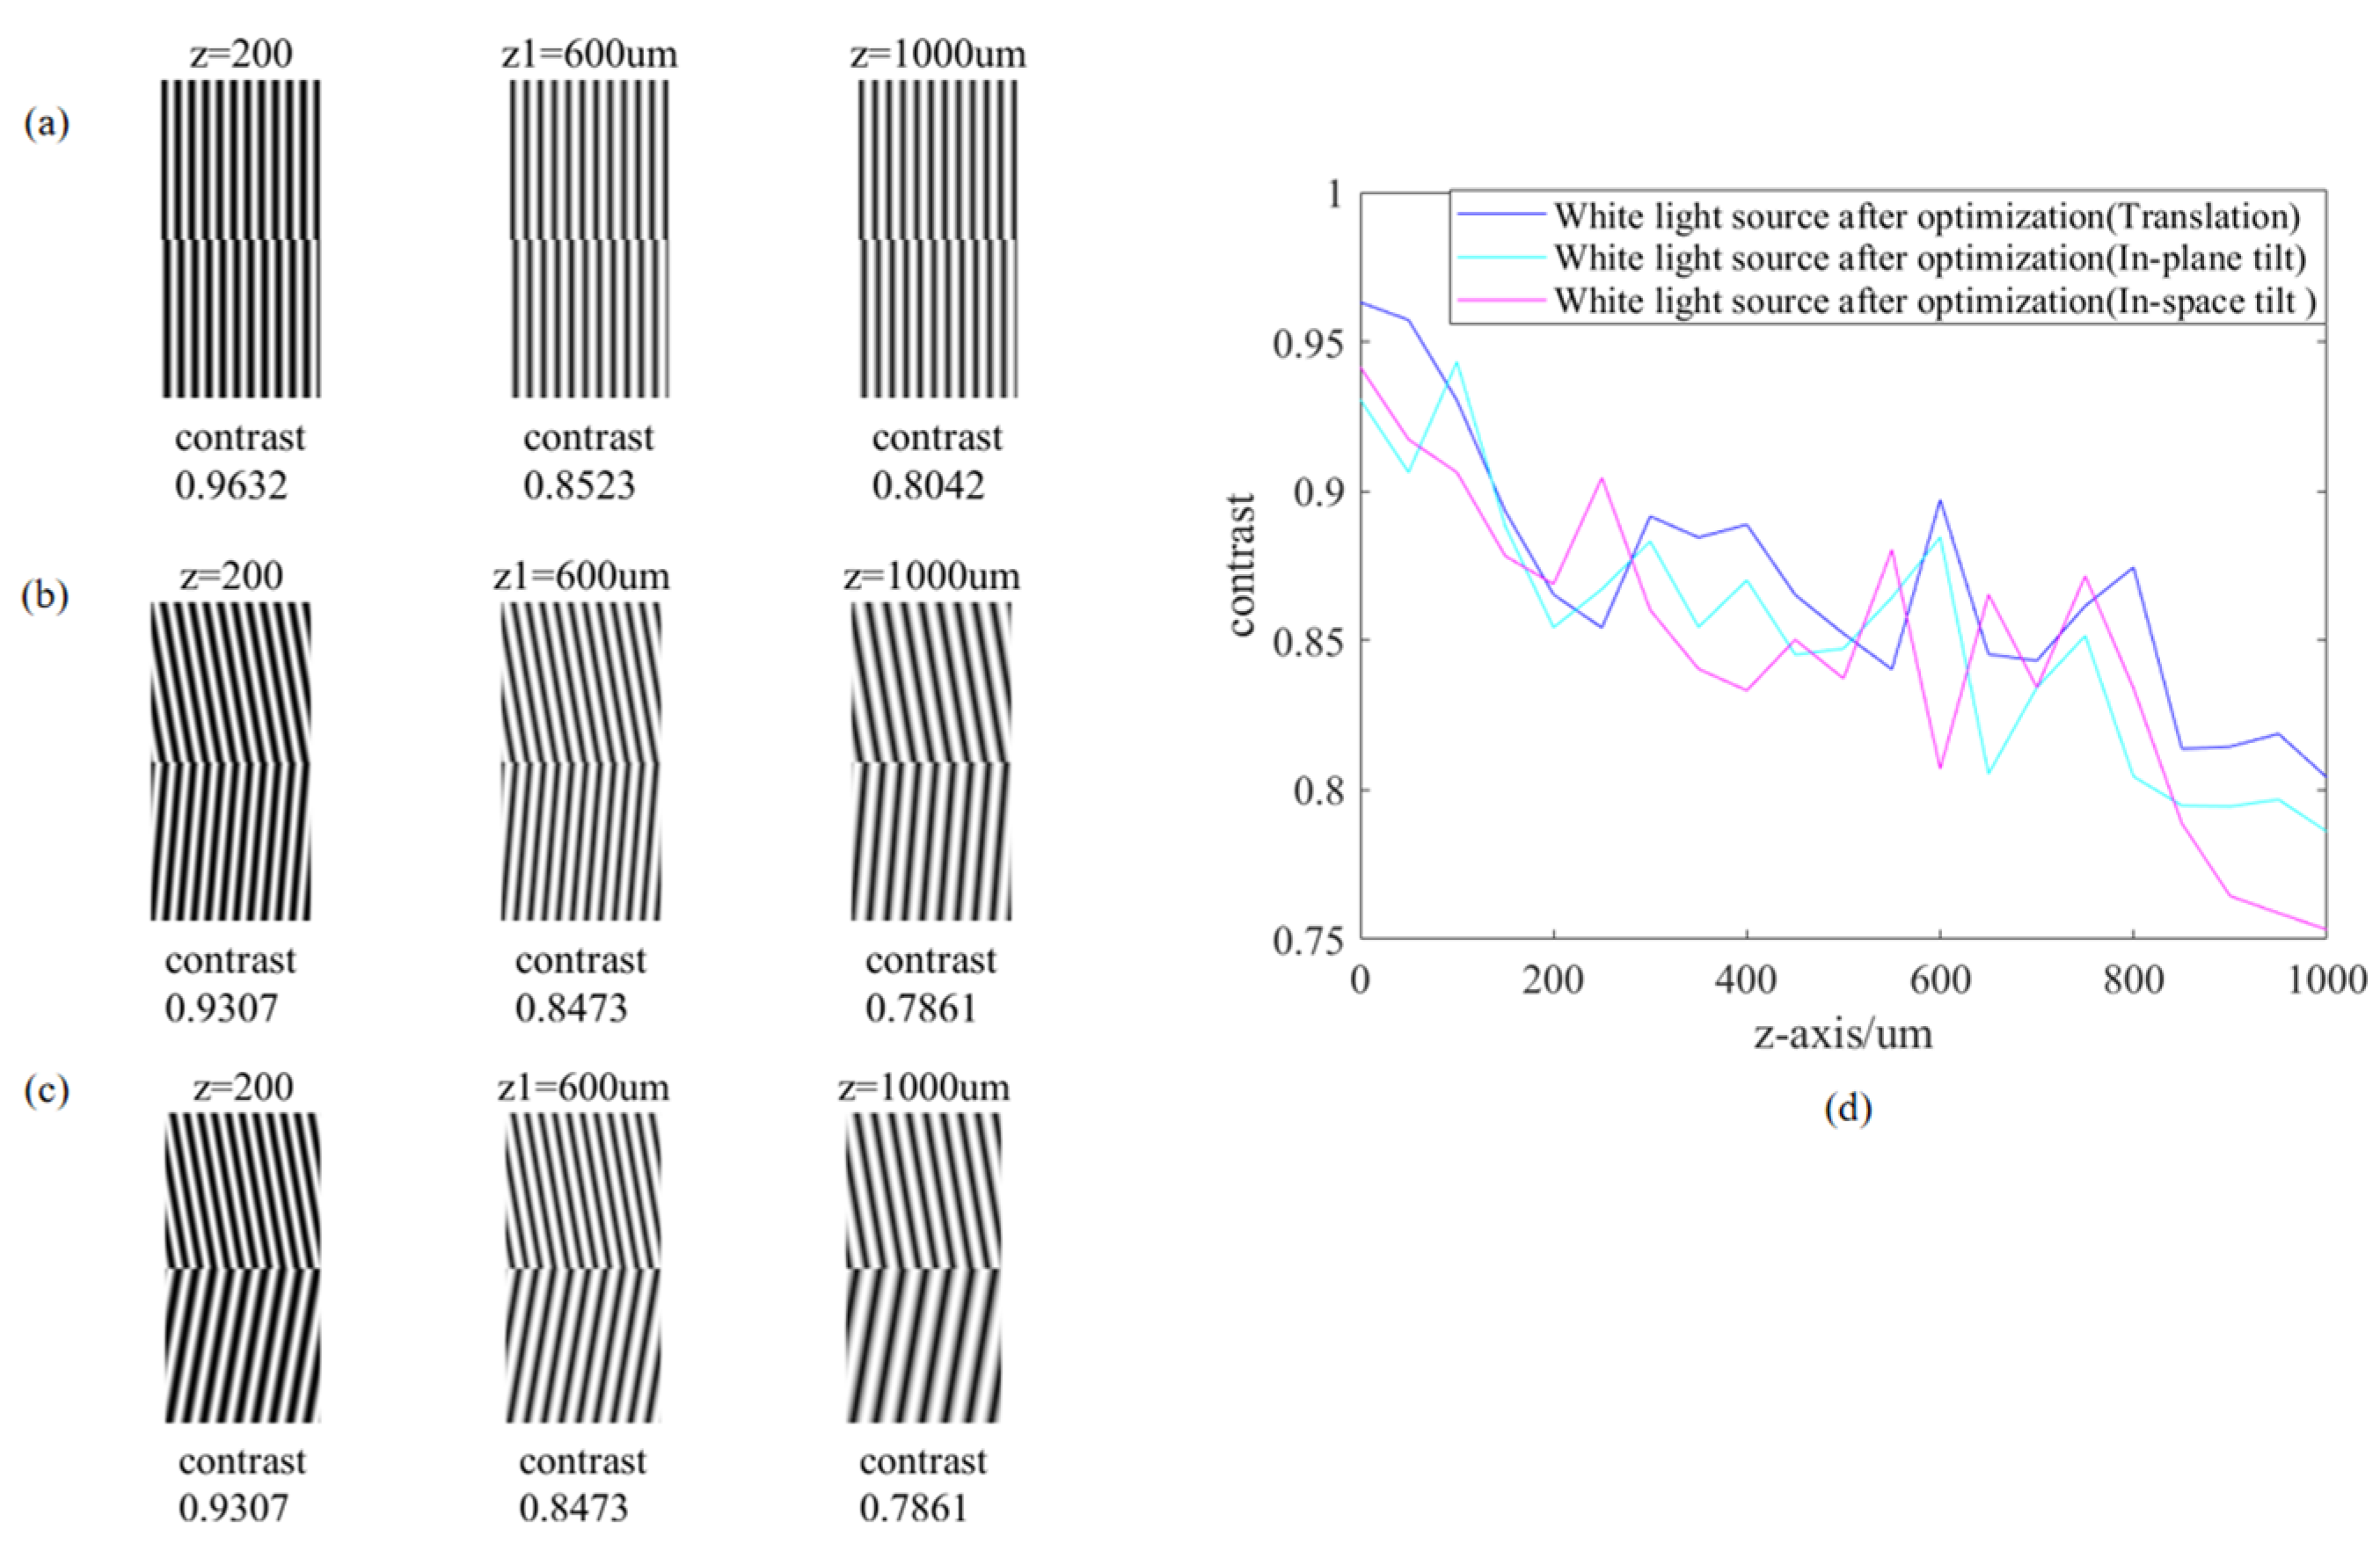
At the same time, considering the potential interference with the Moiré fringe under extreme conditions, we established three control groups, all of which were tested using the white light source after optimization. In the same spatial region, in accordance with the conditions outlined in Figure 10a–c, a quantitative analysis was conducted on the translation, in-plane tilt, and in-space tilt of the Moiré fringe. The contrast of the Moiré fringe produced by these operations was roughly analyzed. Figure 10d illustrates that with specific movement and tilt, the contrast of the Moiré fringe will decrease. However, even in the worst-case scenario, where the Moiré fringe is at 1000 um and the mask and wafer are in a state of in-space tilt, the Moiré fringe contrast can still be maintained at around 0.75. This level of contrast can still meet the requirements of the entire alignment system during the alignment process.
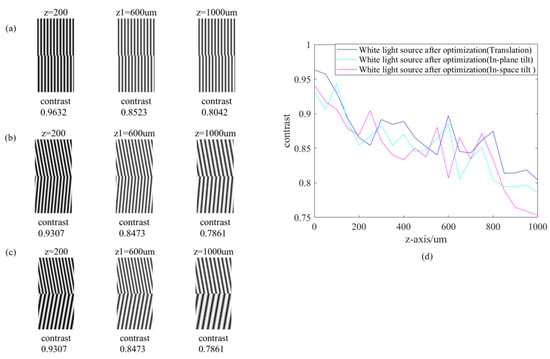
Figure 10.
(a) White light source after optimization illuminates the rectangular line grating mask and wafer (the mask and wafer are relatively mobile), creating a Moiré fringe at varying gaps. (b) White light source after optimization illuminates the rectangular line grating mask and wafer (the mask and wafer are tilted in x–y plane), creating a Moiré fringe at varying gaps. (c) White light source after optimization illuminates the rectangular line grating mask and wafer (the mask and wafer are tilted in x–y–z plane), creating a Moiré fringe at varying gaps. (d) The comparison of the Moiré fringe contrast between the three (white light source after optimization (translation), white light source before optimization (in-plane tilt), and white light source after optimization (in-space tilt) in the same spatial region.
5. Conclusions
This paper proposes a broad–spectrum modulated Moiré fringe alignment method. This method expands the effective formation range of the alignment signal, reduces the sensitivity of the mask and wafer gap, and reduces the loss of alignment precision. Focusing on the problems faced, we draw the following conclusions:
This method establishes a broad–spectrum Moiré fringe model based on the Talbot effect principle. It effectively covers the width of dark field (WDF) between different wavelength imaging ranges, thereby extending the depth of focus (DOF) range of the alignment process and employs a hybrid of genetic algorithms and the particle-swarm optimization (GA–PSO) algorithm to combine various spectral components in the four bands with the highest energy proportion in the white light spectrum (405 nm, 532 nm, 633 nm, and 780 nm). By calculating the optimal weight ratio of each wavelength and using white light incoherent illumination in combination with this ratio, it achieves the optimal DOF range of broad–spectrum Moiré fringe imaging model. The simulation results demonstrate that the available DOF range of the alignment system has been expanded from 400 μm to 800 μm.
To determine the potential impact of the broad–spectrum Moiré fringe alignment method on the alignment precision, the alignment precision of the system was analyzed, under the same conditions. Here, accuracy analysis of the noise resistance, translation amount, and tilt amount, was conducted for the Moiré fringe and broad–spectrum Moiré fringe.
The method proposed in this paper results in an average reduction of 0.0495 nm in the alignment precision of the broad–spectrum Moiré fringe compared to a single wavelength, which is equivalent to a 1.5% decrease in the original alignment precision when using a 4 μm mask and a 4.4 μm wafer. However, the alignment precision can still reach 3.795 nm. Although the alignment precision is reduced, it has a minimal impact on the alignment system and can still meet the requirements of the current alignment system.
Author Contributions
Conceptualization, D.Y. and J.Z.; writing—original draft preparation and experimental work, D.Y.; writing—review and editing, H.S. and J.L.; supervision and experimental work, C.J. and J.W. All authors have read and agreed to the published version of the manuscript.
Funding
This work was supported by the National Key Research and Development Plan 2021YFB3200204, the National Natural Science Foundation of China (NSFC) under Grants No. 61604154, No. 61875201, No. 61975211, and No. 62005287, the Youth Innovation Promotion Association of the Chinese Academy of Sciences (2021380), and the project of the Western Light of Chinese Academy of Science.
Institutional Review Board Statement
Not applicable as the study did not involve human subjects or animals.
Informed Consent Statement
Not applicable as the study did not involve human subjects or animals.
Data Availability Statement
The data underlying the results presented in this paper are not publicly available at this time but may be obtained from the authors upon reasonable request.
Acknowledgments
The authors would like to thank Zhou Ji for the helpful discussions.
Conflicts of Interest
The authors declare no conflicts of interest.
References
- Kamal, K.Y. The Silicon Age: Trends in Semiconductor Devices Industry. J. Eng. Sci. Technol. Rev. 2022, 15, 110–115. [Google Scholar] [CrossRef]
- Tomonori, D.; Yuji, S.; Takanobu, O.; Hajime, Y.; Yujiro, H.; Brown, J.; Go, I.; Masahiro, M.; Yuichi, S. On-product overlay improvement with an enhanced alignment system. Proc. SPIE 2017, 10147, 343–350. [Google Scholar] [CrossRef]
- Chris, A.M. Fundamental Principles of Optical Lithography; John Wiley & Sons: Hoboken, NJ, USA, 2007. [Google Scholar] [CrossRef]
- Shaoyu, Z.; Lei, Z.; Yu, H. Lithography alignment method based on image rotation matching. J. Phys. Conf. Ser. 2021, 1939, 012039. [Google Scholar] [CrossRef]
- Fay, B.; Trotel, J.; Frichet, A. Optical alignment system for submicron X-ray lithography. J. Vac. Sci. Technol. 1979, 16, 1954–1958. [Google Scholar] [CrossRef]
- Noboru, N.; Takayoshi, M.; Taketoshi, Y.; Kugimiya, K. A New Interferometric Alignment Technique with Holographic Configuration. Jpn. J. Appl. Phys. 1985, 24, 1555. [Google Scholar] [CrossRef]
- Matt, K.; Donald, H.B. Photolithographic Mask Alignment Using Moiré Techniques. Appl. Opt. 1972, 11, 2455–2459. [Google Scholar] [CrossRef]
- Lyszczarz, T.M.; Flanders, D.C.; Economou, N.P.; DeGraff, P.D. Experimental evaluation of interferometric alignment techniques for multiple mask registration. J. Vac. Sci. Technol. 1981, 19, 1214–1218. [Google Scholar] [CrossRef]
- Moel, A.; Moon, E.E.; Frankel, R.D.; Smith, H.I. Novel on-axis interferometric alignment method with sub-10 nm precision. J. Vac. Sci. Technol. B Microelectron. Nanometer Struct. Process. Meas. Phenom. 1993, 11, 2191–2194. [Google Scholar] [CrossRef]
- Euclid, E.M.; Henry, I.S. Nanometer-precision pattern registration for scanning-probe lithographies using interferometric-spatial-phase imaging. J. Vac. Sci. Technol. 2006, 24, 3083–3087. [Google Scholar] [CrossRef]
- Nianhua, L.; Wei, W.; Stephen, Y.C. Sub-20-nm Alignment in Nanoimprint Lithography Using Moiré Fringe. Nano Lett. 2006, 6, 2626–2629. [Google Scholar] [CrossRef]
- Jae-Hwang, L.; Chang-Hwan, K.; Yong-Sung, K.; Kai-Ming, H.; Kristen, P.C.; Leung, W.Y.; Cheol, O. Diffracted moiré fringes as analysis and alignment tools for multilayer fabrication in soft lithography. Appl. Phys. Lett. 2005, 86, 204101. [Google Scholar] [CrossRef]
- Mühlberger, M.; Bergmair, I.; Schwinger, W.; Gmainer, M.; Schöftner, R.; Glinsner, T.; Hasenfuß, C.; Hingerl, K.; Vogler, M.; Schmidt, H.; et al. A Moiré method for high accuracy alignment in nanoimprint lithography. Microelectron. Eng. 2007, 84, 925–927. [Google Scholar] [CrossRef]
- Jianguo, Z.; Song, H.; Junsheng, Y.; Shaolin, Z.; Yan, T.; Min, Z.; Lei, Z.; Minyong, C.; Lanlan, L.; Yu, H.; et al. Four-quadrant gratings moiré fringe alignment measurement in proximity lithography. Opt. Express 2013, 21, 3463–3473. [Google Scholar] [CrossRef]
- Xu, F.; Zhou, S.; Hu, S.; Jiang, W.; Luo, L.; Chu, H. Moiré fringe alignment using composite circular-line gratings for proximity lithography. Opt. Express 2015, 23, 20905–20915. [Google Scholar] [CrossRef] [PubMed]
- Zhou, S.; Xie, C.; Yang, Y.; Hu, S.; Xu, X.; Yang, J. Moiré-Based Phase Imaging for Sensing and Adjustment of In-Plane Twist Angle. IEEE Photonics Technol. Lett. 2013, 25, 1847–1850. [Google Scholar] [CrossRef]
- Nan, W.; Wei, J.; Jiangping, Z.; Yan, T.; Wei, Y.; Junmin, T.; Song, H. Influence of Collimation on Alignment Accuracy in Proximity Lithography. IEEE Photonics J. 2014, 6, 2500010. [Google Scholar] [CrossRef]
- Wang, N.; Jiang, W.; Zhang, Y. Deep learning–based moiré-fringe alignment with circular gratings for lithography. Opt. Lett. 2021, 46, 1113–1116. [Google Scholar] [CrossRef] [PubMed]
- Liu, J.; Zhou, S.; Hu, S.; Gao, H.; He, Y.; Cheng, Y. Spectrum-Integral Talbot Effect for UV Photolithography With Extended DOF. IEEE Photonics Technol. Lett. 2015, 27, 2201–2204. [Google Scholar] [CrossRef]
- Yun, Y.; Gen, M.; Erdene, T.N. Applying GA-PSO-TLBO approach to engineering optimization problems. Math. Biosci. Eng. 2022, 20, 552–571. [Google Scholar] [CrossRef] [PubMed]


Disclaimer/Publisher’s Note: The statements, opinions and data contained in all publications are solely those of the individual author(s) and contributor(s) and not of MDPI and/or the editor(s). MDPI and/or the editor(s) disclaim responsibility for any injury to people or property resulting from any ideas, methods, instructions or products referred to in the content. |
© 2024 by the authors. Licensee MDPI, Basel, Switzerland. This article is an open access article distributed under the terms and conditions of the Creative Commons Attribution (CC BY) license (https://creativecommons.org/licenses/by/4.0/).